
Possibilities to Increase Assembly Line Productivity Using Different Management Approaches


Abstract
:1. Introduction
2. Materials and Methods
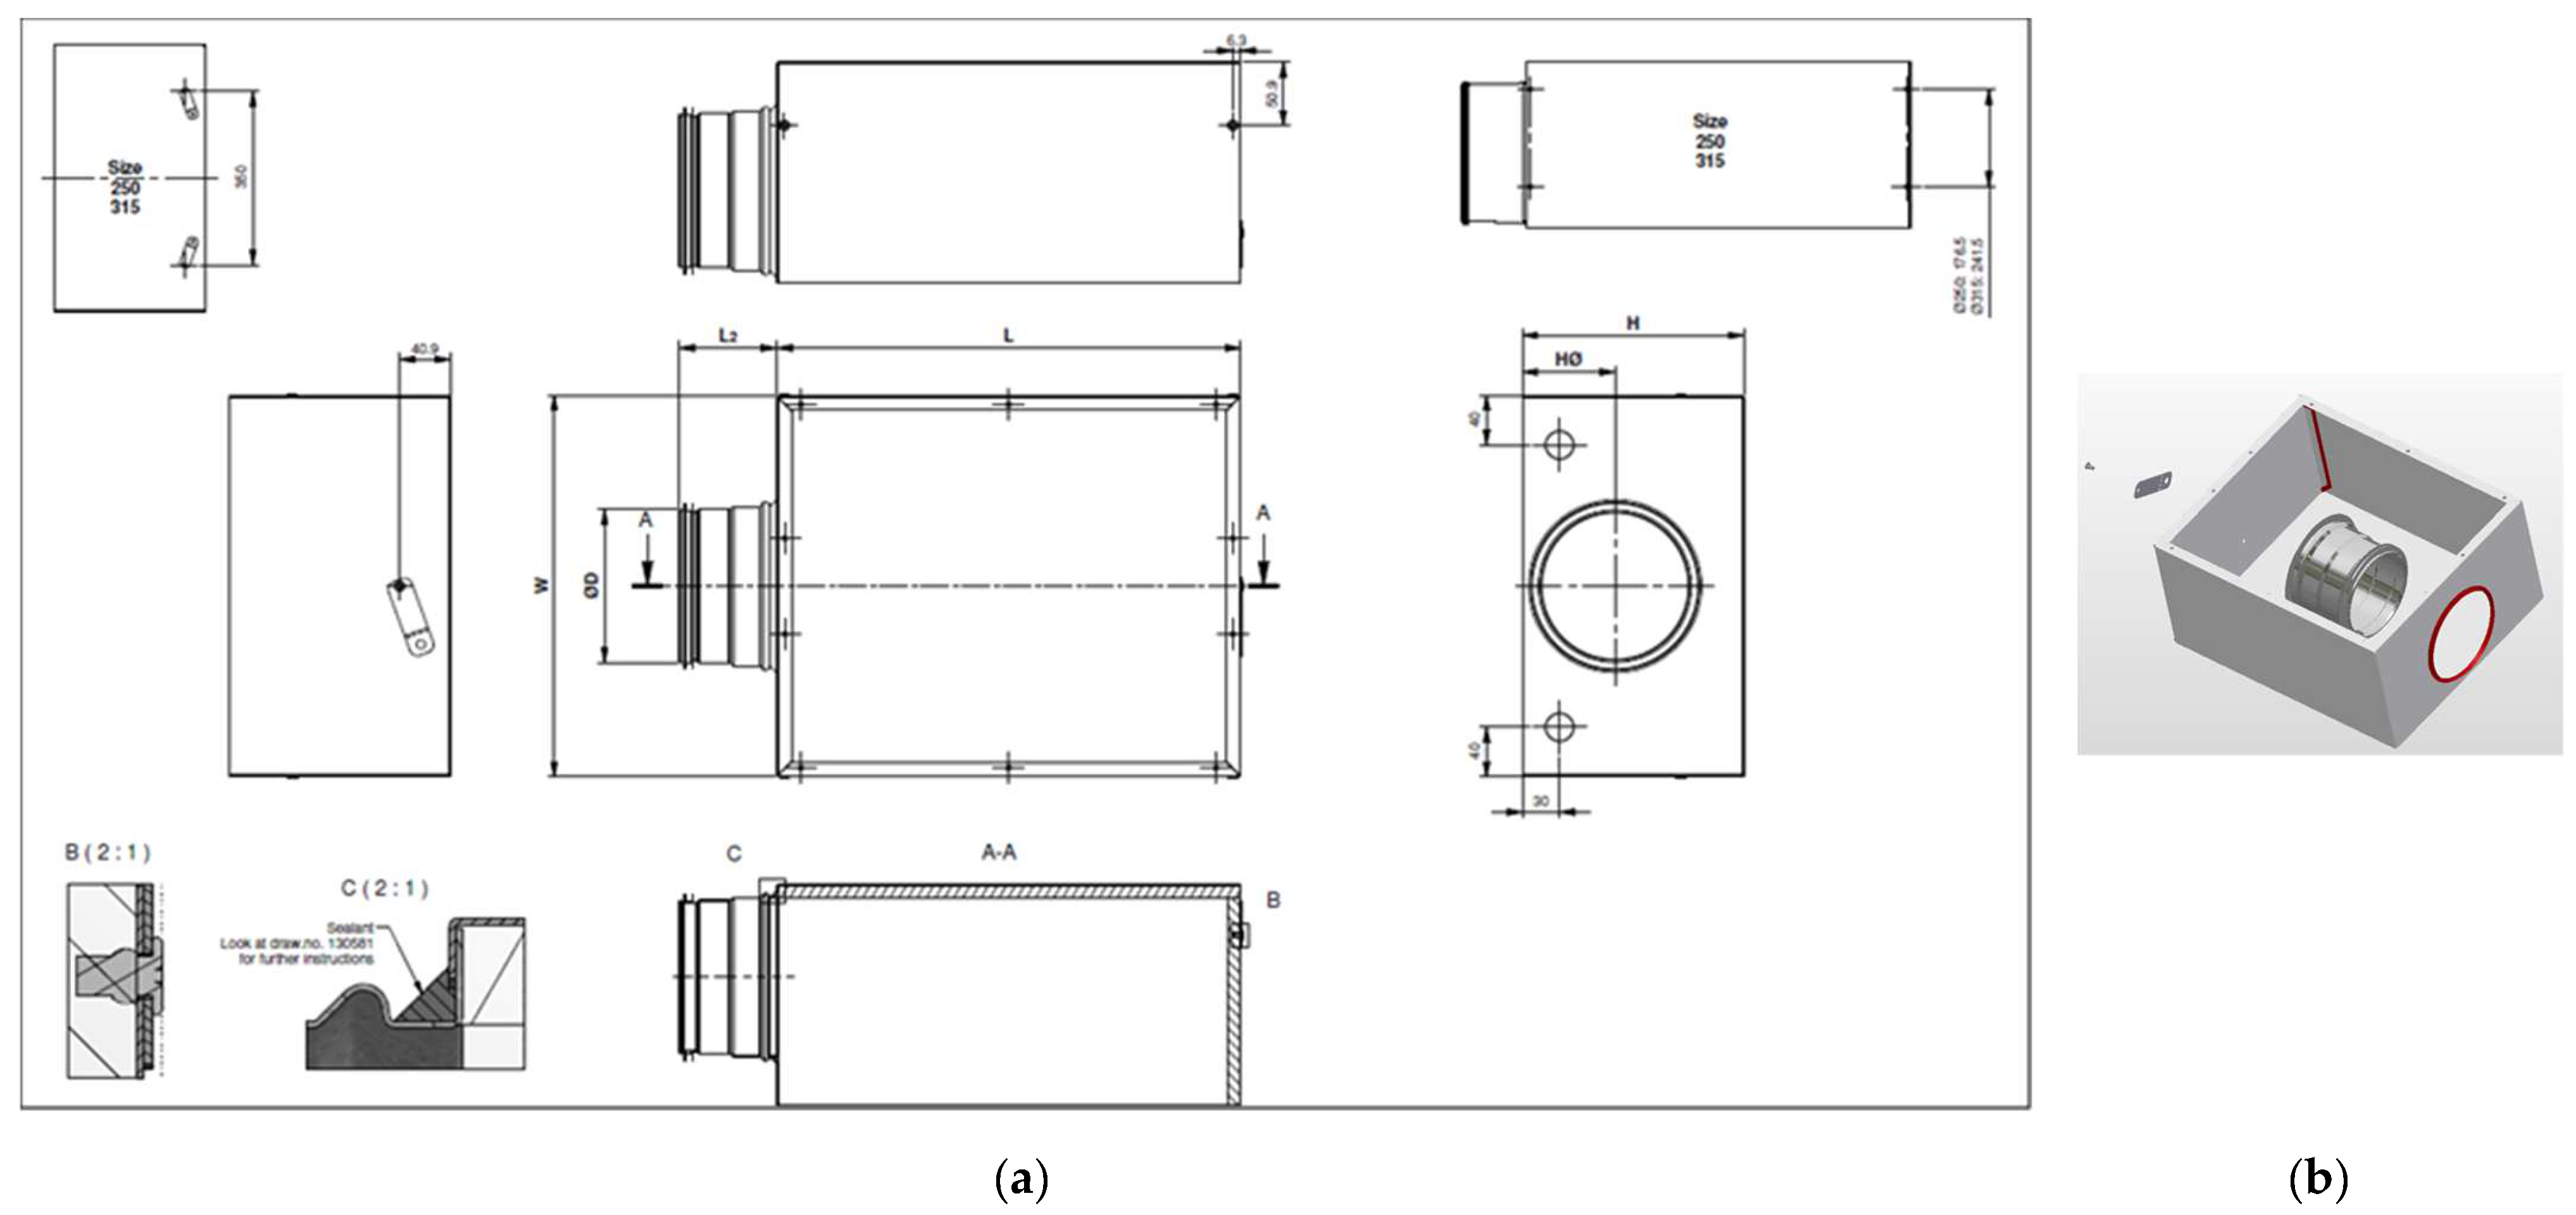
2.1. Current State of Installation of Throttle Valves
2.2. Methodical Procedure of Solution
- Tact time of line. It expresses the average time required to make one product on an assembly line. As a rule, it is determined by the tact time of the workplace on the line which has the longest duration of all operations performed at the given workplace. The method of calculation is given by relation (2):where TT is the tact time of line, TTWmax is the tact time of the line workplace with the longest time of all performed operations.
- Hourly production of line. It expresses the number of manufactured products on the assembly line per hour. The method of calculation is given by relation (2):where Oh is an hourly production of line, T is the time expressed in seconds per hour.
- Cost per product. Within costs, two cost types are monitored, namely, hourly labor costs, referred to in the article as the hourly rate of the worker, and hourly costs for machines, referred to in the article as the hourly rate of robots. The sum of the hourly rate of the worker and the hourly rate of the robots determines the hourly rate of the assembly line. The method of calculating the costs per product is recorded by relations (4), (5) and (6):where roL is the hourly rate of the line, roE is the hourly rate of the employee, NE is the number of employees on the line, roR is the hourly rate of robots, IC is investment costs, TD is the depreciation period of the robot, TeR used effective time fund of the robot, c is the coefficient of overhead costs in the amount of 1.36.
3. Results
3.1. Main Sources of Waste
3.2. Proposed Solution Variants
- Two robots connected in parallel, one robot performing only welding operations, the other, only sealing operations;
- Two robots connected in series, one robot performing only welding operations, the other, only sealing operations;
- Two robots connected in parallel, both robots performing both welding and sealing operations;
- Two robots connected in parallel with a third robot in the series, with two robots arranged in parallel performing welding operations, and a third robot sealing operations.
4. Discussion
5. Conclusions
Author Contributions
Funding
Institutional Review Board Statement
Informed Consent Statement
Data Availability Statement
Acknowledgments
Conflicts of Interest
References
- Kováč, J.; Svoboda, M.; Líška, O. Automated and Flexible Assembly, 1st ed.; Technical University of Košice: Kosice, Slovakia, 2000. [Google Scholar]
- Mourtzis, D.; Zogopoulos, V.; Xanthi, F. Augmented reality application to support the assembly of highly customized products and to adapt to production re-scheduling. Int. J. Adv. Manuf. Technol. 2019, 105, 3899–3910. [Google Scholar] [CrossRef]
- Li, M.; Huang, G.Q. Production-intralogistics synchronization of industry 4.0 flexible assembly lines under graduation intelligent manufacturing system. Int. J. Prod. Econ. 2021, 241, 108272. [Google Scholar] [CrossRef]
- Li, Z.X.; Tang, Q.H.; Zhang, L.P. Two-sided assembly line balancing problem of type I: Improvements, a simple algorithm and a comprehensive study. Comput. Oper. Res. 2017, 79, 78–93. [Google Scholar] [CrossRef]
- Lu, H.; Hou, K.H.; Shi, W. Application of Work Study to the Automobile Assembling Line Balancing. In Proceedings of the 2nd International Conference on Information Management, Innovation Management and Industrial Engineering, Xi’an, China, 26–27 December 2009; Volume 3. [Google Scholar] [CrossRef]
- Schmid, N.A.; Limère, V. A classification of tactical assembly line feeding problems. Int. J. Prod. Res. 2019, 57, 7586–7609. [Google Scholar] [CrossRef]
- Fansuri, A.F.H.; Rose, A.N.M.; Ab Rashid, M.F.F.; Mohamed, N.M.Z.; Ahmad, H. Productivity improvement through line balancing at electronic company—Case study. IOP Conf. Ser. Mater. Sci. Eng. 2018, 409, 012015. [Google Scholar] [CrossRef]
- Byrne, B.; McDermott, O.; Noonan, J. Applying lean six sigma methodology to a pharmaceutical manufacturing facility: A case study. Processes 2021, 9, 550. [Google Scholar] [CrossRef]
- Scholl, A.; Boysen, N.; Fliedner, M. The sequence-dependent assembly line balancing problem. OR Spectr. 2008, 30, 579–609. [Google Scholar] [CrossRef]
- Lusa, A. A survey of the literature on the multiple or parallel assembly line balancing problem. Eur. J. Ind. Eng. 2008, 2, 50–72. [Google Scholar] [CrossRef]
- Bukchin, J.; Tzur, M. Design of flexible assembly line to minimize equipment cost. IIE Trans. 2000, 32, 585–598. [Google Scholar] [CrossRef]
- Barutcuoglu, S.; Azizoglu, M. Flexible assembly line design problem with fixed number of workstations. Int. J. Prod. Res. 2011, 49, 3691–3714. [Google Scholar] [CrossRef]
- Battaia, O.; Dolgui, A.; Guschinsky, N.; Levin, G. Optimal design of machines processing pipeline parts. Int. J. Adv. Manuf. Technol. 2012, 63, 963–973. [Google Scholar] [CrossRef]
- Borisovsky, P.; Delorme, X.; Dolgui, A. Genetic algorithm for balancing reconfigurable machining lines. Comput. Ind. Eng. 2013, 66, 541–547. [Google Scholar] [CrossRef]
- Corominas, A.; Ferrer, L.; Pastor, R. Assembly line balancing: General resource—Constrained case. Int. J. Prod. Res. 2011, 49, 3527–3542. [Google Scholar] [CrossRef]
- Hamta, N.; Ghomi, S.F.; Jolai, F.; Shirazi, M.A. A hybrid PSO algorithm for a multi-objective assembly line balancing problem with flexible operation times, sequence-dependent setup times and learning effect. Int. J. Prod. Econ. 2013, 141, 99–111. [Google Scholar] [CrossRef]
- Bock, S. Supporting offshoring and nearshoring decision for mass customization manufacturing processes. Eur. J. Oper. Res. 2008, 184, 490–508. [Google Scholar] [CrossRef]
- Li, J.; Gao, J. Balancing manual mixed-model assembly lines using overtime work in a demand variation environment. Int. J. Prod. Res. 2014, 52, 3552–3567. [Google Scholar] [CrossRef]
- Sungar, B.; Yavuz, Y. Assembly line balancing with hierarchical worker assignment. J. Manuf. Syst. 2014, 37, 290–298. [Google Scholar] [CrossRef]
- Boysen, N.; Fliedner, M.; Scholl, A. Sequencing mixed-model assembly lines to minimize part inventory cost. OR Spectr. 2008, 30, 611–633. [Google Scholar] [CrossRef] [Green Version]
- Dolgui, A.; Kovalev, S.; Kovalyov, M.Y.; Nossack, J.; Pesch, E. Minimizing setup costs in a transfer line design problem with sequential operation processing. Int. J. Prod. Econ. 2014, 151, 186–194. [Google Scholar] [CrossRef]
- Kovalev, S.; Delorme, X.; Dolgui, A. Line configuration to minimize setup costs. Math. Comput. Model. 2012, 55, 2087–2095. [Google Scholar] [CrossRef]
- Amen, M. Cost-oriented assembly line balancing: Model formulations, solution difficulty, upper and lower bounds. Eur. J. Oper. Res. 2006, 168, 747–770. [Google Scholar] [CrossRef]
- Kara, Y.; Ozguven, C.; Yalcin, N.; Atasagun, Y. Balancing straight and U-shaped assembly lines with resource dependent task times. Int. J. Prod. Res. 2011, 49, 6387–6405. [Google Scholar] [CrossRef]
- Tuncel, G.; Topaloglu, S. Assembly line balancing with positional constraints, task assignment restrictions and station paralleling: A case in an electronics company. Comput. Ind. Eng. 2013, 64, 602–609. [Google Scholar] [CrossRef]
- Yoosefelahi, A.; Aminnayeri, M.; Mosadegh, H.; Ardakani, H.D. Type II robotic assembly line balancing problem: An evolution strategies algorithm for a multi-objective model. J. Manuf. Syst. 2012, 31, 139–151. [Google Scholar] [CrossRef]
- Roshani, A.; Fattahi, P.; Roshani, A.; Salehi, M.; Roshani, A. Cost-oriented two-sided assembly line balancing problem: A simulated annealing approach. Int. J. Comput. Integr. Manuf. 2012, 25, 689–715. [Google Scholar] [CrossRef]
- Boysen, N.; Fliedner, M.; Scholl, A. Assembly line balancing: Which model to use when? Int. J. Prod. Econ. 2008, 111, 509–528. [Google Scholar] [CrossRef]
- Dolgui, A.; Eremeev, A.; Kovalyov, M.; Sigaev, V. Complexity of buffer capacity allocation problems for production lines with unreliable machines. J. Math. Model. Algorithms Oper. Res. 2013, 12, 155–165. [Google Scholar] [CrossRef]
- Bentaha, M.L.; Battaia, O.; Dolgui, A. An exact solution approach for disassembly line balancing problem under uncertainty of the task processing times. Int. J. Prod. Res. 2015, 53, 1807–1818. [Google Scholar] [CrossRef] [Green Version]
- Periera, J. Modelling and solving a cost-oriented resource-constrained multi-model assembly line balancing problem. Int. J. Prod. Res. 2018, 56, 3994–4016. [Google Scholar] [CrossRef]
- Hazir, Ö.; Delorme, X.; Dolgui, A. A review of cost and profit oriented line design and balancing problems and solution approaches. Annu. Rev. Control 2015, 40, 14–24. [Google Scholar] [CrossRef]
- Harikrishnan, R.; Rajeswaran, M.; Kumar, S.S.; Dinesh, K. Productivity improvement in poly-cover packing line through line balancing and automation. Mater. Today-Proc. 2020, 33, 102–111. [Google Scholar] [CrossRef]
- Levitin, G.; Rubinovitz, J.; Shnits, B. A genetic algorithm for robotic assembly line balancing. Eur. J. Oper. Res. 2016, 168, 811–825. [Google Scholar] [CrossRef]
- Pfeiffer, S. Robots, Industry 4.0 and Humans, or Why Assembly Work Is More than Routine Work. Societies 2016, 6, 16. [Google Scholar] [CrossRef]
- Boysen, N.; Fliedner, M.; Scholl, A. A classification of assembly line balancing problems. Eur. J. Oper. Res. 2007, 183, 674–693. [Google Scholar] [CrossRef]
- Kováč, J.; Mihok, J. Industrial Engeneering; Technical University of Košice: Kosice, Slovakia, 2013. [Google Scholar]
- Zhang, W.; Gen, M. An efficient multi objective genetic algorithm for mixed-model assembly line balancing problem considering demand ratio-based cycle time. J. Intell. Manuf. 2011, 22, 367–378. [Google Scholar] [CrossRef]
- Yuan, T.; Xiang, P.; Li, H.; Zhang, L. Identification of the main risks for international rail construction projects based on the effects of cost-estimating risks. J. Clean. Prod. 2020, 274, 122904. [Google Scholar] [CrossRef]
- Dheskali, E.; Koutinas, A.A.; Kookos, I.K. Risk assessment modeling of bio-based chemicals economics based on Monte-Carlo simulations. Chem. Eng. Res. Des. 2020, 163, 273–280. [Google Scholar] [CrossRef]
- Albana, A.S.; Saputra, A.Y. Financial risk assessment for power plant investment under uncertainty using Monte Carlo simulation. In Proceedings of the International Conference on Technologies and Policies in Electric Power & Energy, TPEPE, Yogyakarta, Indonesia, 21–22 October 2019; Institute of Electrical and Electronics Engineers Inc.: Yogyakarta, Indonesia, 2019. [Google Scholar] [CrossRef]

| Indicator | Unit | Type of Throttle Valve “FD” | Total | |||||
|---|---|---|---|---|---|---|---|---|
| 100 | 125 | 160 | 200 | 250 | 315 | |||
| Production volume | pcs/year | 8647 | 22,616 | 28,046 | 18,777 | 9522 | 3237 | 90,845 |
| Share in “FD” | % | 10 | 25 | 31 | 20 | 10 | 4 | 100 |
| Share in total volume | % | 5 | 14 | 17 | 11 | 6 | 2 | 55 |
| Current State | ||
|---|---|---|
| Number of lines | 2 | 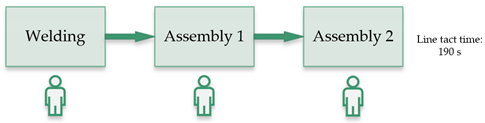 |
| Number of employees on 1 line | 3 | |
| Number of employees on 2 lines | 6 | |
| Hourly employee rate (EUR) | 10.50 | |
| Hourly rate for 2 lines (EUR) | 63.00 | |
| Tact time of the line (s) | 190 | |
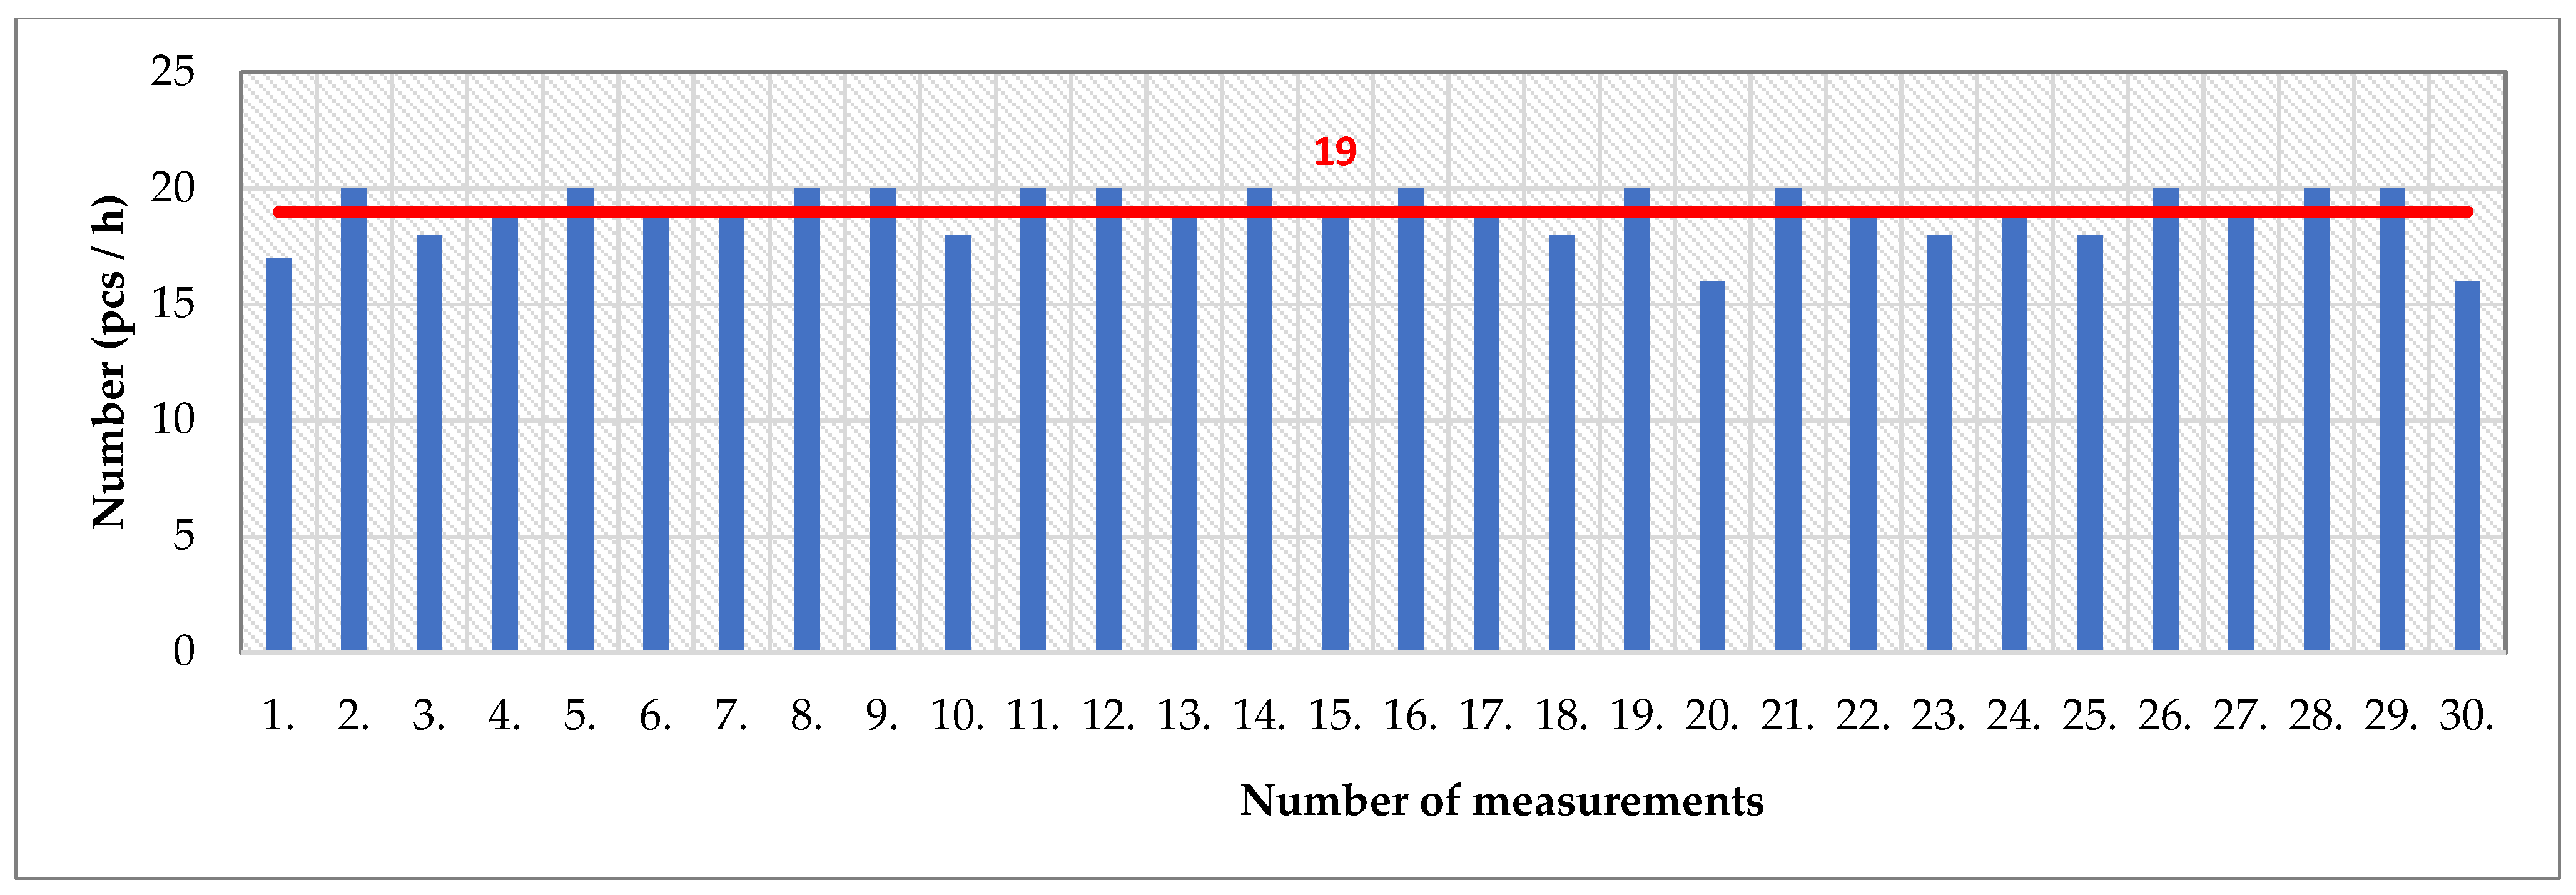
| Hourly production the line (pcs) | 19 | |
| Hourly production of 2 lines (pcs) | 38 | |
| Cost per piece (EUR) | 1.66 | |
| Type of Waste | Average Waste per 1 Employee (%) | Waste Costs (EUR) | |
|---|---|---|---|
| 1 Worker/1 Shift | 2 Lines/1 Year, 2 Shifts/Day | ||
| Waiting | 11 | 8.28 | 26,072.13 |
| Outside the workplace | 4 | 3.01 | 9481.50 |
| Personal interview | 2 | 1.51 | 4740.75 |
| Overwork | 5 | 3.76 | 11,851.88 |
| Other | 7 | 5.27 | 16,592.63 |
| Total | 29 | 21.82 | 68,740.88 |
| Workplace | Welding (Tip Cleaning 19.92 s) | Assembly 1 | |||||||
| Operation | Chimney installation | Chimney welding | Sidewall riveting | Sidewall welding | Stickers incl. submissions | Chimney sealing and interior sealing | Insert the seal | Flap installation | Cover sealing |
| FD 160 | 15.21 | 24.43 | 43.07 | 50.07 | 13.43 | 35.71 | 17.29 | 20.50 | 18.14 |
| Initial state | 152.70 | 105.07 | |||||||
| Workplace | Assembly 2 | ||||||||
| Operation | Closing by cover | Riveting the lid | Knocking the lid | Labeling | Flap inspection | Inserting accessories | Closing by 2 lids | Labeling QA | Transfer to the box |
| FD 160 | 10.93 | 33.86 | 12.21 | 12.93 | 19.79 | 3.86 | 15.00 | 3.43 | 9.00 |
| Initial state | 121.00 | ||||||||
| Initial State | ||
|---|---|---|
| Number of lines | 2 |  |
| Number of employees on 1 line | 3 | |
| Number of employees on 2 lines | 6 | |
| Hourly employee rate (EUR) | 10.50 | |
| Hourly rate for 2 lines (EUR) | 63.00 | |
| Tact time of the line (s) | 153 | |
| Hourly production the line (pcs) | 23 | |
| Hourly production of 2 lines (pcs) | 46 | |
| Cost per piece (EUR) | 1.37 | |
| Workplace | Welding (Tip Cleaning 19.92 s) | Assembly 1 | |||||||
| Operation | Chimney installation | Chimney welding | Sidewall riveting | Sidewall welding | Stickers incl. submissions | Chimney sealing and interior sealing | Insert the seal | Flap installation | Cover sealing |
| FD 160 | 15.21 | 24.43 | 43.07 | 50.07 | 13.43 | 35.71 | 17.29 | 20.50 | 18.14 |
| Proposal 1 | Assistance from Assembly 1 workplace at “Sidewall riveting” operation 15 s 137.70 | Assistance on Welding workplace at “Sidewall riveting” operation 15 s 120.07 | |||||||
| Workplace | Assembly 2 | ||||||||
| Operation | Closing by cover | Riveting the lid | Knocking the lid | Labeling | Flap inspection | Inserting accessories | Closing by 2 lids | Labeling QA | Transfer to the box |
| FD 160 | 10.93 | 33.86 | 12.21 | 12.93 | 19.79 | 3.86 | 15.00 | 3.43 | 9.00 |
| Proposal 1 | Operation “Labeling” transferred to an off-lime worker (operator) 108.07 | ||||||||
| Proposal 1 | ||
|---|---|---|
| Number of lines | 2 |  |
| Number of employees on 1 line | 3 | |
| Number of employees on 2 lines | 6 | |
| Hourly employee rate (EUR) | 10.50 | |
| Hourly rate for 2 lines (EUR) | 63.00 | |
| Tact time of the line (s) | 138 | |
| Hourly production the line (pcs) | 26 | |
| Hourly production of 2 lines (pcs) | 52 | |
| Cost per piece (EUR) | 1.21 | |
| Pre-assembly | Robot | Assembly 1 | ||||||||
|---|---|---|---|---|---|---|---|---|---|---|
| Chimney installation | Installation into the jig | Welding | Chimney sealing | Stickers incl. sub-missions | Insert the seal | Flap installation | Sealing the cover | Closing the lid | ||
| FD 160 | 15.2 | 24.4 | 111.0 | 19.7 | 13.4 | 17.3 | 20.5 | 18.1 | 10.9 | |
| Proposal 2 | 30.0 | 130.7 | 80.3 | |||||||
| Proposal 3 | 30.0 | 130.7 | 80.3 | |||||||
| Proposal 4 | 30.0 | 111.0 | 19.7 | 80.3 | ||||||
| Proposal 5 | 30.0 | 65.5 | 80.3 | |||||||
| Proposal 6 | 30.0 | 65.5 | 80.3 | |||||||
| Proposal 7 | 30.0 | 56.0 | 19.7 | 80.3 | ||||||
| Proposal 8 | 30.0 | 56.0 | 19.7 | 80.3 | ||||||
| Assembly 2 | Tact time of the line (s) | Line production (pcs/h) | ||||||||
| Lid riveting | Knocking of rivets | Flap inspection | Inserting accessories | Closing with two covers | Gluing the QA label | Transfer to the box | ||||
| FD 160 | 33.9 | 12.2 | 19.8 | 3.9 | 15.0 | 3.4 | 9.0 | |||
| Proposal 2 | 97.1 | 131 | 27 | |||||||
| Proposal 3 | 97.1 | 131 | 27 | |||||||
| Proposal 4 | 97.1 | 111 | 32 | |||||||
| Proposal 5 | 97.1 | 98 | 36 | |||||||
| Proposal 6 | 97.1 | 66 | 54 | |||||||
| Proposal 7 | 97.1 | 98 | 36 | |||||||
| Proposal 8 | 97.1 | 56 | 64 | |||||||
| Indicator | Unit | Value |
|---|---|---|
| Number of welds on the chimney | pcs | 7 |
| Number of welds on the product body | pcs | 30 |
| Welding time for 1 weld | s | 3 |
| Length of sealant of chimney | m | 0.5 |
| Length of sealant of body | m | 1.76 |
| Length of sealant for sealing the top lid | m | 3.93 |
| Application time of sealant with a length of 12 m | min. | 1 |
| Indicator | Unit | Value | ||
|---|---|---|---|---|
| 2 Robots Parallel | 2 Robots Series | 3 Robots Series | ||
| Purchase price of 2 or 3 robots (investment costs) | EUR | 230,000 | 276,000 | 370,000 |
| Effective time fund of the robot per year | hours/year | 3570.00 | ||
| Utilization of effective time fund of the robot | % | 85 | ||
| Utilization of effective time fund of the robot | hours/year | 3034.50 | ||
| Depreciation time of the robot | years | 6 | ||
| Hourly rate of employee | EUR | 10.50 | ||
| Hourly rate of robot for 2 or 3 robots | EUR | 17.18 | 20.62 | 27.64 |
| Proposal 2 | Investment Costs = EUR 230,000 | |
|---|---|---|
| Number of lines | 1 |  |
| Number of employees on the line | 3 | |
| Hourly employee rate (EUR) | 10.50 | |
| Hourly rate of line employees (EUR) | 31.50 | |
| Hourly rate of robots (EUR) | 17.18 | |
| Hourly line rate (EUR) | 48.68 | |
| Tact time of the line (s) | 131 | |
| Hourly line production (pcs) | 27 | |
| Cost per piece (EUR) | 1.80 | |
| Proposal 3 | Investment Costs = EUR 230,000 | |
|---|---|---|
| Number of lines | 1 | 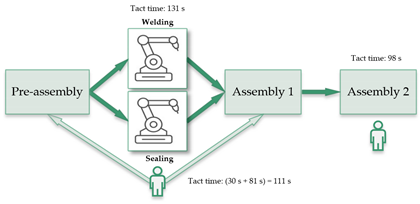 |
| Number of employees on the line | 2 | |
| Hourly employee rate (EUR) | 10.50 | |
| Hourly rate of line employees (EUR) | 21.00 | |
| Hourly rate of robots (EUR) | 17.18 | |
| Hourly line rate (EUR) | 38.18 | |
| Tact time of the line (s) | 131 | |
| Hourly line production (pcs) | 27 | |
| Cost per piece (EUR) | 1.41 | |
| Proposal 4 | Investment Costs = EUR 276,000 | |
|---|---|---|
| Number of lines | 1 |  |
| Number of employees on the line | 3 | |
| Hourly employee rate (EUR) | 10.50 | |
| Hourly rate of line employees (EUR) | 31.50 | |
| Hourly rate of robots (EUR) | 20.62 | |
| Hourly line rate (EUR) | 52.12 | |
| Tact time of the line (s) | 111 | |
| Hourly line production (pcs) | 32 | |
| Cost per piece (EUR) | 1.63 | |
| Proposal 5 | Investment Costs = EUR 276,000 | |
|---|---|---|
| Number of lines | 1 | 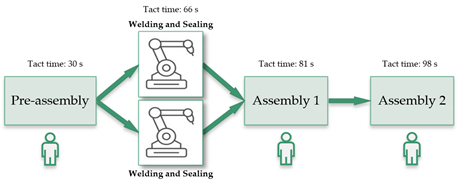 |
| Number of employees on the line | 3 | |
| Hourly employee rate (EUR) | 10.50 | |
| Hourly rate of line employees (EUR) | 31.50 | |
| Hourly rate of robots (EUR) | 20.62 | |
| Hourly line rate (EUR) | 52.12 | |
| Tact time of the line (s) | 98 | |
| Hourly line production (pcs) | 37 | |
| Cost per piece (EUR) | 1.41 | |
| Proposal 6 | Investment Costs = EUR 276,000 | |
|---|---|---|
| Number of lines | 1 |  |
| Number of employees on the line | 4 | |
| Hourly employee rate (EUR) | 10.50 | |
| Hourly rate of line employees (EUR) | 42.00 | |
| Hourly rate of robots (EUR) | 20.62 | |
| Hourly line rate (EUR) | 62.62 | |
| Tact time of the line (s) | 66 | |
| Hourly line production (pcs) | 54 | |
| Cost per piece (EUR) | 1.16 | |
| Proposal 7 | Investment Costs = EUR 370,000 | |
|---|---|---|
| Number of lines | 1 | 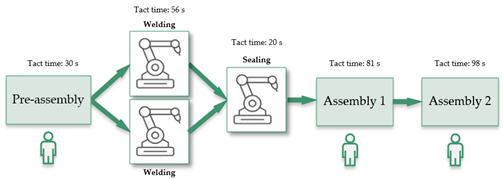 |
| Number of employees on the line | 3 | |
| Hourly employee rate (EUR) | 10.50 | |
| Hourly rate of line employees (EUR) | 31.50 | |
| Hourly rate of robots (EUR) | 27.64 | |
| Hourly line rate (EUR) | 59.14 | |
| Tact time of the line (s) | 98 | |
| Hourly line production (pcs) | 37 | |
| Cost per piece (EUR) | 1.60 | |
| Proposal 8 | Investment Costs = EUR 370,000 | |
|---|---|---|
| Number of lines | 1 | 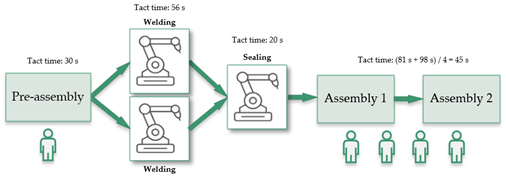 |
| Number of employees on the line | 5 | |
| Hourly employee rate (EUR) | 10.50 | |
| Hourly rate of line employees (EUR) | 52.50 | |
| Hourly rate of robots (EUR) | 27.64 | |
| Hourly line rate (EUR) | 80.14 | |
| Tact time of the line (s) | 56 | |
| Hourly line production (pcs) | 64 | |
| Cost per piece (EUR) | 1.25 | |
| Inputs Data for Determining the Cost per Piece | Product Cost (EUR/pcs) | Order of Proposals by Product Cost | |||||
|---|---|---|---|---|---|---|---|
| Number of Lines (pcs) | Tact Time of Line (s) | Hourly Line Rate (EUR/h) | Hourly Production Line/Lines (pcs/h) | State | Deviation from CS (−) Savings (+) Overrun | ||
| Current state | 2 | 190 | 63.00 | 38 | 1.66 | - | - |
| Proposal 1 | 2 | 138 | 63.00 | 52 | 1.21 | −0.45 | 2. |
| Proposal 2 | 1 | 131 | 48.68 | 27 | 1.80 | +0.14 | 7. |
| Proposal 3 | 1 | 131 | 38.18 | 27 | 1.41 | −0.25 | 4. |
| Proposal 4 | 1 | 111 | 52.12 | 32 | 1.63 | −0.03 | 6. |
| Proposal 5 | 1 | 98 | 52.12 | 37 | 1.41 | −0.25 | 4. |
| Proposal 6 | 1 | 66 | 62.62 | 54 | 1.16 | −0.50 | 1. |
| Proposal 7 | 1 | 98 | 59.14 | 37 | 1.60 | −0.06 | 5. |
| Proposal 8 | 1 | 56 | 80.14 | 64 | 1.25 | −0.41 | 3. |
Publisher’s Note: MDPI stays neutral with regard to jurisdictional claims in published maps and institutional affiliations. |
© 2022 by the authors. Licensee MDPI, Basel, Switzerland. This article is an open access article distributed under the terms and conditions of the Creative Commons Attribution (CC BY) license (https://creativecommons.org/licenses/by/4.0/).
Share and Cite
Kádárová, J.; Janeková, J.; Suhányiová, A. Possibilities to Increase Assembly Line Productivity Using Different Management Approaches. Processes 2022, 10, 553. https://doi.org/10.3390/pr10030553
Kádárová J, Janeková J, Suhányiová A. Possibilities to Increase Assembly Line Productivity Using Different Management Approaches. Processes. 2022; 10(3):553. https://doi.org/10.3390/pr10030553
Chicago/Turabian StyleKádárová, Jaroslava, Jaroslava Janeková, and Alžbeta Suhányiová. 2022. "Possibilities to Increase Assembly Line Productivity Using Different Management Approaches" Processes 10, no. 3: 553. https://doi.org/10.3390/pr10030553
APA StyleKádárová, J., Janeková, J., & Suhányiová, A. (2022). Possibilities to Increase Assembly Line Productivity Using Different Management Approaches. Processes, 10(3), 553. https://doi.org/10.3390/pr10030553