Article

Technical and Environmental Feasibility Study of the Co-Production of Crude Oil and Electrical Energy from Geothermal Resources: First Field Trial in Colombia

1
Grupo de Investigación en Fenómenos de Superficie-Michael Polanyi, Departamento de Procesos y Energía, Facultad de Minas, Universidad Nacional de Colombia—Sede Medellín, Medellín 050034, Colombia
2
Parex Resources Colombia Ltd., Bogotá 110111, Colombia
*
Authors to whom correspondence should be addressed.
Processes 2022, 10(3), 568; https://doi.org/10.3390/pr10030568
Submission received: 7 February 2022 / Revised: 4 March 2022 / Accepted: 8 March 2022 / Published: 14 March 2022
(This article belongs to the Section Energy Systems)

Abstract

:
In the oil and gas industry, there has not been a consistent, concerted effort to reduce global greenhouse gas (GHG) emissions across the supply chain. In addressing this challenge, this study evaluates the potential GHG emissions reduction that may be realized through deployment of a geothermal power co-production system in two Colombian oil fields, compared to a base case where energy needs are derived through non-renewable sources such as gas and diesel. These geothermal power co-production systems make use of organic Rankine cycle (ORC) engines to convert the heat from produced oilfield fluids into electrical energy. The energy potential of this resource is evaluated through the exergy concept, and a life cycle analysis is implemented to calculate the carbon footprint using the Intergovernmental Panel on Climate Change (IPCC) 2013 methodology. In the two oil fields of interest, OFA and OFB, the results show a maximum potential energy production of 2260 kWe for OFA and 657 kWe for OFB. The co-production of crude oil and electrical energy from geothermal resources suggests a possible a carbon footprint reduction of 19% and 11% for OFA and OFB, respectively, when compared to conventional power systems. In addition, four emissions scenarios are assessed where the current energy sources in these oil fields are substituted by gas, diesel, co-generated geothermal power, or a combination of the three while maintaining the average power output in each field. The highest carbon footprint reduction is found in Scenario 1, which replaces 100% of the liquid fuel consumption with purchased gas (gas provided by a third party and treated outside the system’s limits), thereby achieving carbon footprint reductions up to 54% for OFB. This research opens the prospect for the use of renewable energies in the oil and gas industry.

1. Introduction

The increasing global energy demand, especially in the industrial sector, has renewed the search for new energy resources that allow for both diversification of the energy matrix and mitigation of environmental impacts [1]. According to the data presented in the World Energy Markets Observatory (WEMO) [2], oil and coal will continue to be the leading sources of energy worldwide. The use of these fossil resources has led to a 2% increase in global greenhouse gas (GHG) emissions in the period between 2016 and 2018, where China and the United States were the leading emitters of CO2 into the atmosphere [3]. Even though less than 0.5% global total GHG emissions are emitted in Colombia, it is among the countries most vulnerable to climate change. In the Paris Agreement, Colombia has committed to reducing its GHG emissions by 51% by 2030 and to becoming carbon neutral by 2050 [4]; these goals were recently ratified at COP26 [5]. The Colombian government is promoting several circular economic strategies across all sectors to support a transition from a brown to a green economy [6].
In Colombia, the energy matrix shows a strong dependence on water sources and natural gas, which in 2018 represented approximately 82% and 11% of electrical power consumption, respectively. Thermal plant power generation contributes a further 6% to this overall figure. The contribution of renewable energies in Colombia’s energy matrix is minor, as it represents less than 0.1% of overall generation [7,8,9]. As a result, there is renewed interest in diversifying energy generation sources in Colombia and increasing the contribution of renewable energy technologies such as solar, wind, and geothermal energy, particularly in regions that are well suited to the development of these resources [8,10].
Geothermal power is climatically independent and generates base-load power that provides an element of energy security that other renewable technologies cannot. The lack of specialized studies examining the characterization and use of geothermal energy to produce electricity, and the high costs and risks that these types of projects carry, has stunted the growth of a geothermal power industry in Colombia [11,12,13].
Recent work has forecasted that in the year 2025, geothermal energy will meet 1.65% of Colombia’s electrical demand. In addition, it is estimated that the generation capacity of this renewable resource could eventually be scaled to 17,400 GWh year−1 [14]. The research carried out in Colombia has not considered oil fields as potential areas for geothermal energy development; these investigations have instead focused on the direct exploitation of conventional, hydrothermal geothermal deposits.
Colombia does not take advantage of geothermal resources for electrical generation, despite multiple studies supporting its potential in the country [11,12,14,15,16,17,18,19]. One of the principal challenges of geothermal projects is the cost of drilling and completions, which can account for 30% to 40% of total project costs in a conventional geothermal development [20,21,22,23]. The use of petroleum wells to produce geothermal energy mitigates the costs associated with single-purpose geothermal exploration or development wells. The subsurface knowledge acquired in drilling oil and gas wells, including reservoir properties and fluid properties, allows one to reduce subsurface uncertainty related to geothermal resource development [22,24,25,26]. Importantly, the constant, base-load generation profile of geothermal energy makes it well suited to oilfield use, as power demands in oil fields are generally stable and do not tend to fluctuate significantly [27]. Coupling geothermal energy with oil and gas operations provides a decarbonization alternative that supplies reliable power and reduces GHG emissions. Moreover, geothermal energy in oil and gas operations can supply electricity to remote areas (where conventional power grids are difficult to connect to), and the heat can also be harnessed in direct-use applications [28].
During the life of an oil well, the amount of water produced as percentage of overall fluid production can rise to levels above 95% [29]. Such wells can produce water with temperatures exceeding 90 °C. This water is usually treated for consumption in other activities or reinjected into a subsurface reservoir for disposal, secondary recovery, or pressure maintenance. This represents a waste of a thermal resource that could otherwise be employed for energy production or direct-use applications. The waters produced in these oil fields, according to published criteria, would be classified either as medium-enthalpy (90 °C to 150 °C) or low-enthalpy (30 °C to 90 °C) geothermal resources [30,31]. Medium-enthalpy resources can provide useful energy to the operation in the form of electricity or heat, whereas low-enthalpy resources are only useful in direct-use applications. Indeed, in the global context, a growing body of research is showing the co-production potential of geothermal energy and oilfield reservoir fluids [32,33,34,35,36,37,38,39,40,41,42,43,44,45,46,47,48,49,50].
As mentioned, the conversion of geothermal heat to electricity in an oilfield operation is desirable due to the local demand, and due to the potential for direct offset of fossil fuel-burning, internal combustion power sources. The benefits are realized both in terms of lowering costs and reducing the GHG footprint of the oilfield power supply [26]. Other applications for the use of geothermal resources in oil fields have also been piloted successfully, including heating systems and crude oil transportation [31,41,51,52].
The production of geothermal power from oil fields has already been piloted successfully in the USA and China [35,41,44]. Work by Augustine et al. [48] estimated the potential for this co-produced fluid geothermal power generation in the United States using three models for electrical generation potential: exergy, the Massachusetts Institute of Technology (MIT) model, and a commercially available “off-the-shelf” (COTS) model. The exergy model is based on the theoretical limit of the maximum amount of work that can be obtained by bringing the resource to ambient or dead conditions. Meanwhile, the Massachusetts Institute of Technology (MIT) model works with the theoretical efficiency for ORC [53], and the commercially available “off-the-shelf” (COST) model is derived from performance curves of the ORC system [54].
The information was taken from a database created by the authors based on the parameters of volume, flow rate, bottom-hole temperature of the produced waters, and maps of surface temperature of the fluids. Based on an estimate that approximately 4.2 billion bbl yr−1 of co-produced water is extracted in the United States with temperatures suitable for power production, the authors calculated estimated power production potentials of 1300 MWe with the exergy model, 560 MWe with the MIT model, and 276 MWe with the COTS model.
A study by Auld et al. [49] assessed the potential for power generation from co-produced hot brines in oil fields in the North Sea to supply the power demand of offshore platforms through an on-platform organic Rankine cycle (ORC) power plant. Power generation from the ORC units was analytically modeled using co-produced brines from oil fields in Brent Province. These simulations showed that six of the 21 evaluated oil fields had an electrical generation potential greater than 10 MW. The smallest and largest projects assessed yielded 0.45 MW and 31 MW of power generation potential, respectively.
Banks et al. [50] investigated the gross geothermal power potential of several oil fields in Virginia, USA. This investigation used three different methods to assess gross power production potential over an operating lifetime of 25 years. Using a reservoir-volume method, the investigation identified 172 MWth and 28 MWe of power potential. A deterministic surface heat method, based on available information for bottom-hole temperatures and historical water production from 190 wells, estimated an average power potential of 115 MWth and 16 MWe.
In Texas, it was reported that a natural gas well could generate approximately 1.5 MW of net energy using the geothermal energy of produced waters [55]. Likewise, in the Gulf Coast, over 1000 MW of electrical power potential has been identified from high-temperature waters [56]. One of the most critical investigations on this topic was conducted in 2012 by Bennet et al. [38], who stated that the potential for generating power from geothermal sources present in mature Los Angeles basin oil fields was approximately 7430 kWe.
The United States Department of Energy (DOE), in Wyoming, carried out the first pilot of co-produced fluid geothermal power production. The system used an ORC generation unit to convert the heat from low-temperature co-produced fluids to electrical power [41]. In the field trial, production of 132 kWe of net electrical power was achieved from 40,000 barrels per day of water at temperatures ranging between 90 °C and 99 °C. Another landmark project was carried out in North Dakota, where the first commercial application of oilfield geothermal power generation occurred [57]. The system produced 250 kWe of power from 30,000 barrels per day of co-produced water at a temperature of 98 °C.
A study on Naval Petroleum Field No. 3 (NPR-3) in Wyoming by Milliken [40] estimated that 300 kWe of co-produced geothermal power could be harnessed from 40,000 barrels of produced water per day at a temperature of 88 °C.
The first geothermal power plant built in China for an oilfield, co-produced fluid geothermal application made use of 18,114 barrels of water per day produced from oil wells, at an average temperature of 110 °C [58]. This plant produced 310 kWe of electrical power and remains an impactful example of how oilfield infrastructure can be used to produce energy from alternative sources.
Although geothermal energy presents the highest energy return (energy output/energy invested) of any comparable renewable energy source, it has not been implemented in Colombia because of the considerable levels of capital investment required and the significant uncertainties inherent in exploring for geothermal resources. Such uncertainties include fluid type, temperature, chemical composition, and the generation technology that will be most appropriate for the resource (dry steam, flash, binary cycle) [21,27]. In addition, financial pressures to obtain economic returns over a short period of time have been an obstacle to the development of geothermal energy both in Colombia and globally [16,18,19].
Although prior research has considered the energy and subsurface aspects of oilfield co-produced geothermal power, recent studies on the subject have not considered the GHG emissions benefits, despite the significant environmental, social, and technical–economic pressures on extractive industries in recent years. Moreover, carbon footprint calculations through life cycle analyses (LCA) have not been implemented for geothermal co-generation systems in oil fields. Few studies have focused on GHG emissions calculations in oil fields through life cycle analyses, as work by Rahman et al. [59] and Nassar et al. [60] has pointed out. Therefore, the objective of this paper is to evaluate, for the first time, the GHG reductions in two oil fields under two energy production systems: first, a conventional system based on the combustion of fossil fuels, and second, a co-generation system that harnesses the potential of the geothermal energy in the produced fluids. This evaluation will incorporate an LCA using IPCC 2013. The fields of interest in this study are the two fields that have been chosen for the first pilot of co-produced fluid geothermal power in Colombia.
This study assesses the technical and environmental feasibility of the application of co-produced fluid geothermal energy in these oil fields, with special emphasis on the carbon footprint reduction. This research details the magnitude reduction of the carbon footprint reduction achieved using the geothermal energy in these produced waters. The field trial associated with this study involves the start-up of the ORC equipment in the two fields of interest. The outcome of this work does not simply consist of the specific carbon footprint reductions achieved in each field; rather, it demonstrates the possibility of making better use of all resources in the oilfield value chain, of which geothermal resources are just one element.
This document is divided into two sections. The first section describes the electrical co-generation process for two oil fields, referred to as A and B (OFA and OFB, respectively) for the purposes of this study. The methodologies used to evaluate the electrical power potential of geothermal resources in oil fields are described. Subsequently, the energy potential of the geothermal resources is calculated through an approach that focuses on exergy and energy. The carbon footprint calculation is used to measure environmental impact under the LCA framework.
The second section explores and quantifies the power generation potential from the geothermal resources based on exergy and energy, and then examines the electrical production observed in one of the generation units deployed in the field. Lastly, four power generation scenarios are evaluated to investigate a configuration with a minimal GHG footprint. The scenarios consider different fossil fuel energy sources (gas and diesel) together with geothermal energy co-production. The aim is to minimize the GHG footprint of the power generation while maintaining the historical, average power production in the field. In Scenario 1, 100% of liquid fuel consumption is replaced by purchased gas; in Scenario 2, 100% of liquid fuel consumption is replaced by field gas (gas produced and treated inside the system’s limits); in Scenario 3, 100% of energy consumption is carried out with purchased gas; and in Scenario 4, all energy consumption is carried out with field gas.

2. Methodology

2.1. Estimation of Geothermal Potential in Two Colombian Oil Fields

Geothermal resources in oilfield settings, according to published classification schema, are generally considered medium-enthalpy or low-enthalpy geothermal resources, where fluid temperatures rarely exceed 120 °C. Typically, water that is co-produced with oil or gas is run through a treatment system and then disposed of according to local regulations, most often in a permeable subsurface formation [61].
The harnessing of geothermal energy in these produced waters occurs through the use of technologies like organic Rankine cycle (ORC) power generation systems [62,63]. ORC systems use heat exchangers to transfer the thermal energy of these produced waters to a low-boiling-point working fluid (which is commonly a refrigerant or hydrocarbon) in a closed loop. This heat provokes a phase change and turns the liquid working fluid into vapor. The pressure of this vapor is used to drive a turbine and generator, thereby producing electrical power [27,52,55]. Figure 1 illustrates how geothermal energy is harnessed by ORC units in oil fields.
The separation and treatment of produced fluids is key to the proper functioning of the ORC generation unit. Better separation and treatment leads to fewer problems with heat exchangers, such as hydrocarbon build-up or scale, which may impair the overall efficiency of the system [64].
As previously indicated, ORC systems are the most common technology for producing electrical energy from low- and medium-enthalpy geothermal resources [44,52,63]. As in many other power generation technologies, a vapor pressure differential across a turbine is required to produce electrical power. Organic fluids such as refrigerants and hydrocarbons make this possible, as they vaporize at temperatures below the boiling point of water. Despite the potential hazards that the use of organic fluid may present compared to water, many organic working fluids may exhibit properties that are environmentally benign, such as low global warming potential (GWP), low ozone depletion potential (ODP), low to zero flammability, and low toxicity, according to the American Society of Heating, Refrigerating, and Air-conditioning Engineers (ASHRAE) [65]. Thermodynamically, these organic working fluids also feature a high molecular weight, allowing fluids to absorb and retain more thermal energy [62], and a low propensity to condense during expansion. Condensation during expansion can damage turbine components. A simple ORC consists of four main elements: An evaporator, a turbine, a condenser, and a booster pump. Initially, the produced geothermal fluid enters the evaporator, where it transfers its energy to the working fluid of the ORC. The working fluid is then heated and undergoes a phase change to vapor. At high temperature and pressure, the working fluid in the vapor phase enters a turbine, where it expands and produces mechanical movement. Subsequently, the rotation of this turbine is used by a generator to produce electricity. After expansion in the turbine, the working fluid is cooled and brought back to the liquid phase at low temperature and pressure through a condenser. Lastly, the fluid is pumped back to the evaporator to start the cycle again.
The oil fields that are the subject of this study were selected based on the characteristics of their produced fluids. The key parameters in this evaluation were the flow rates and temperatures of the produced fluids. The two oil fields produce water at temperatures of 88 °C and 100 °C, respectively. The selected fields are separated by 149 km and share similar climatic conditions (Figure 2). The air temperature is effectively the cooling temperature of the working fluid, which is an important factor in assessing the geothermal power potential of these assets.
Figure 3 shows the relationship between the flow rate of individual oil wells and the surface temperature of the fluids in each well across the oil fields of interest. Wells with high water production exhibit higher surface temperatures, which meet the threshold for electrical generation in ORC systems. In the OFB field, the surface temperature of the combined flow of all fluids in the field can reach up to 98 °C, and in the OFA field, combined-flow surface temperatures can reach temperatures of 104 °C.
For the characterization of each field, the energy production potential was calculated through the exergy concept, a thermodynamic property that indicates the maximum amount of work that can be extracted from a particular energy source. The exergy (available energy) in the subject fields was calculated as shown in Equation (1).
B = m ˙ [ h h 0 T 0 ( s s 0 ) ]
where B is the exergy flow of a current (kW); m is the mass flow (kg s−1); h and h0 are the enthalpies at the system temperature and pressure, and ambient conditions, respectively (kJ kg−1); and s and s0 are the entropy at the system temperature and pressure, and ambient conditions, respectively (kJ kg−1 K−1). Finally, T0 is the ambient temperature (K).
Next, the energy of each flow was calculated through Equation (2).
E = m ˙ h
The produced waters in each field were chemically profiled through physicochemical analysis. This was performed to understand the potential for scale precipitation, which could impair the performance of the process. The alkalinity of the samples was measured using a titrimetric method considering the SM2320 B method [66]. On the other hand, for the measurement of chlorides, the standardized argentometric method was used based on the S.M. (4500—Cl-B) [66]. In the case of water conductivity, the electrometric method was used according to the S.M. (2510B) standard [66]. For the pH, a potentiometric method based on the S.M. (4500-H+B) standard was employed [66]. Finally, the total dissolved solids were obtained from a gravimetric process based on the S.M. (2540 C) standard [66]. It should be mentioned that all measurements were done in triplicate. The physicochemical characteristics of the produced waters of each field are summarized in Table 1.

2.2. Effect of Oilfield Geothermal Energy on Carbon Emissions Intensity Using the Life Cycle Analysis Approach

A life cycle analysis (LCA) is a methodological tool for evaluating environmental impacts across supply chains and value chains. It takes into consideration the use of both renewable and non-renewable natural resources and quantifies the associated environmental impacts in terms of emissions and contamination (water contamination, soil contamination, and air contamination) during the transformation of raw materials into end-user products and services. According to Rahman et al. [59], few studies related to upstream oil and gas activities have focused on GHG emissions calculations. The authors determined the carbon footprint from the production of various North American conventional crude oils, which produce emissions across many activities at various points in the value chain, including drilling, land use changes, crude oil production, crude oil processing, venting, flaring, and fugitive emissions. The aim of this work was to provide an accurate assessment of these impacts so that strategies can be devised to meet the relevant environmental regulations [59]. In 2021, Nassar et al. [60] estimated the CO2 emissions factor across the hydrocarbon supply chain (including extraction, distillation, and combustion) through the LCA methodology. The LCA calculations showed that a scenario employing renewable energy results in 6.7% lower CO2 emissions compared to a traditional approach without the use of renewable energy [60].
The ISO 14040 standard, which consists of the following four steps, codifies one approach to life cycle analyses. The components of this standard are (1) goal and scope definition, (2) inventory analysis, (3) impact assessment, and (4) interpretation [67]. The functional unit selected for the current study was 1 kWh of electrical energy, and accounts for the impacts of all steps in the value chain, from extraction to final consumption: gas extraction, treatment, and power generation. These steps were considered in two different power-producing systems, a gas-burning system and an ORC power generation system. In this study, inventory data related to the production of electrical energy were collected for the two oil fields of interest over a period of one month. The impact category evaluated was the carbon footprint, using the hierarchical perspective of the IPCC 2013 methodology [68], which reports values in metric tons of CO2 equivalent (metric tons CO2eq) per kWh generated. Software including Umberto LCA+ and Ecoinvent v. 3.6 (ifu Hamburg, Hamburg, Germany) were used to carry out these calculations [69].
The carbon footprint was obtained from the characterization of the input–output environmental flows of the system process, based on energy and mass balance. GHG emissions flows become a carbon footprint through the characterization factors that represent the GWP (see Equation (3)); GWP is a relative measure of how much heat can be trapped by a given GHG compared to a baseline gas, usually carbon dioxide.
C a r b o n   f o o t p r i n t = s ( G W P ( s ) × E I ( s ) )  
where G W P ( s ) is the global warming potential of each emission s , and E I ( s ) is the emission inventory.
For both oil fields, this study quantified the GHG emissions reduction between the baseline scenario—a conventional system without geothermal power co-generation—and alternative scenarios that consider the use of this novel, geothermal co-generation application. Four scenarios were evaluated to analyze the environmental impacts of supplying power to an oil field through different combinations of fossil-fuel power sources and geothermal co-generation power equipment, as described below:
  • Scenario 1: 100% of liquid fuel consumption is replaced by purchased gas.
  • Scenario 2: 100% of liquid fuel consumption is replaced by field gas.
  • Scenario 3: 100% of energy demands are supplied by purchased gas.
  • Scenario 4: 100% of energy demands are supplied by field gas.
The analysis requires an accounting of the consumed resources in terms of material balance and energy balance. The operator of the oil field provided the data on fuel consumption related to power generation and the associated costs. The information used for the calculations in this research corresponds to an average month of fuel consumption in the year 2019. For clarity, the net calorific value of each fuel was considered in the energy accounting. In this way, the resources consumed in these processes were contemplated both in terms of the volume of fuel used and the overall energy consumed.

3. Results

This section presents the results of this study, first with an assessment of the energy potential of the oil fields, followed by a section on the efficiency of the geothermal co-generation systems. Lastly, this section details the results of the carbon footprint accounting, highlighting the advantages of using renewable energy sources such as geothermal energy.

3.1. Geothermal Energy Potential

To determine the energy generation potential of the subject oil fields, the energy flow and exergy of the produced waters were calculated based on temperature and flow rates. In this study, the average temperatures assumed for the OFA and OFB fields were 100 °C and 88 °C, respectively. The representative produced water flow rates vary between 40,000 BFPD and 45,000 BFPD for the OFA field, and between 15,000 BFPD and 20,000 BFPD for the OFB field. From the characteristics of the produced waters, the enthalpy and entropy of the system were calculated as shown in Table 2.
Figure 4 shows the energy and exergy potential of the subject fields for different produced water flow rates. It should be clarified that the energy and exergy flows are shown for comparative purposes. Energy is a global measure of the capacity to produce work in the analyzed energy source, but it does not consider the thermodynamic irreversibilities inherent to all real processes. On the other hand, exergy considers all the irreversibilities through the generated entropy, although it does not consider the levels of applied technologies (technological conversion efficiency). In addition, these two measurements are presented as evaluation parameters of the geothermal resource, although it is clarified that the exergy is a more realistic value.
The difference between the energy potential and the exergy potential is highlighted. The reason for this discrepancy lies in the definition of these parameters. Energy losses due to processes such as heat transfer caused by finite difference in temperatures are not considered in these calculations [70]. For exergy potential, which is a more realistic measure of the maximum energy production in the field, the thermal and mechanical gradients available using the properties of the system at ambient temperature and pressure are considered. Therefore, exergy is defined by the difference between the original energy of the produced fluids at surface compared to their energy at the ambient temperature and pressure, at which no further energy can be extracted due to the lack of pressure or temperature gradients.
The calculation of the energy potential shows that for OFB, a maximum energy production between 576 and 758 kW could theoretically be obtained, whereas for OFA, the maximum production is between 2157 and 2364 kW. This production is only possible if the generation equipment operates at 100% thermodynamic efficiency. Currently, ORC technologies in geothermal fields that operate with medium- and low-enthalpy resources have thermal-to-power efficiencies of between 5% and 12% [62], which implies an output of between 50 and 70 kWe for the OFB field and between 180 and 200 kWe for the OFA field, assuming a 9% thermal-to-power efficiency.
The difference between the values obtained for OFA and OFB is accounted for by the difference in flow rates, as OFA produces twice as much water as OFB. Moreover, the temperature measured in OFA produced waters is greater than that of OFB.
This result demonstrates that useful quantities of geothermal energy are available in these oil fields.

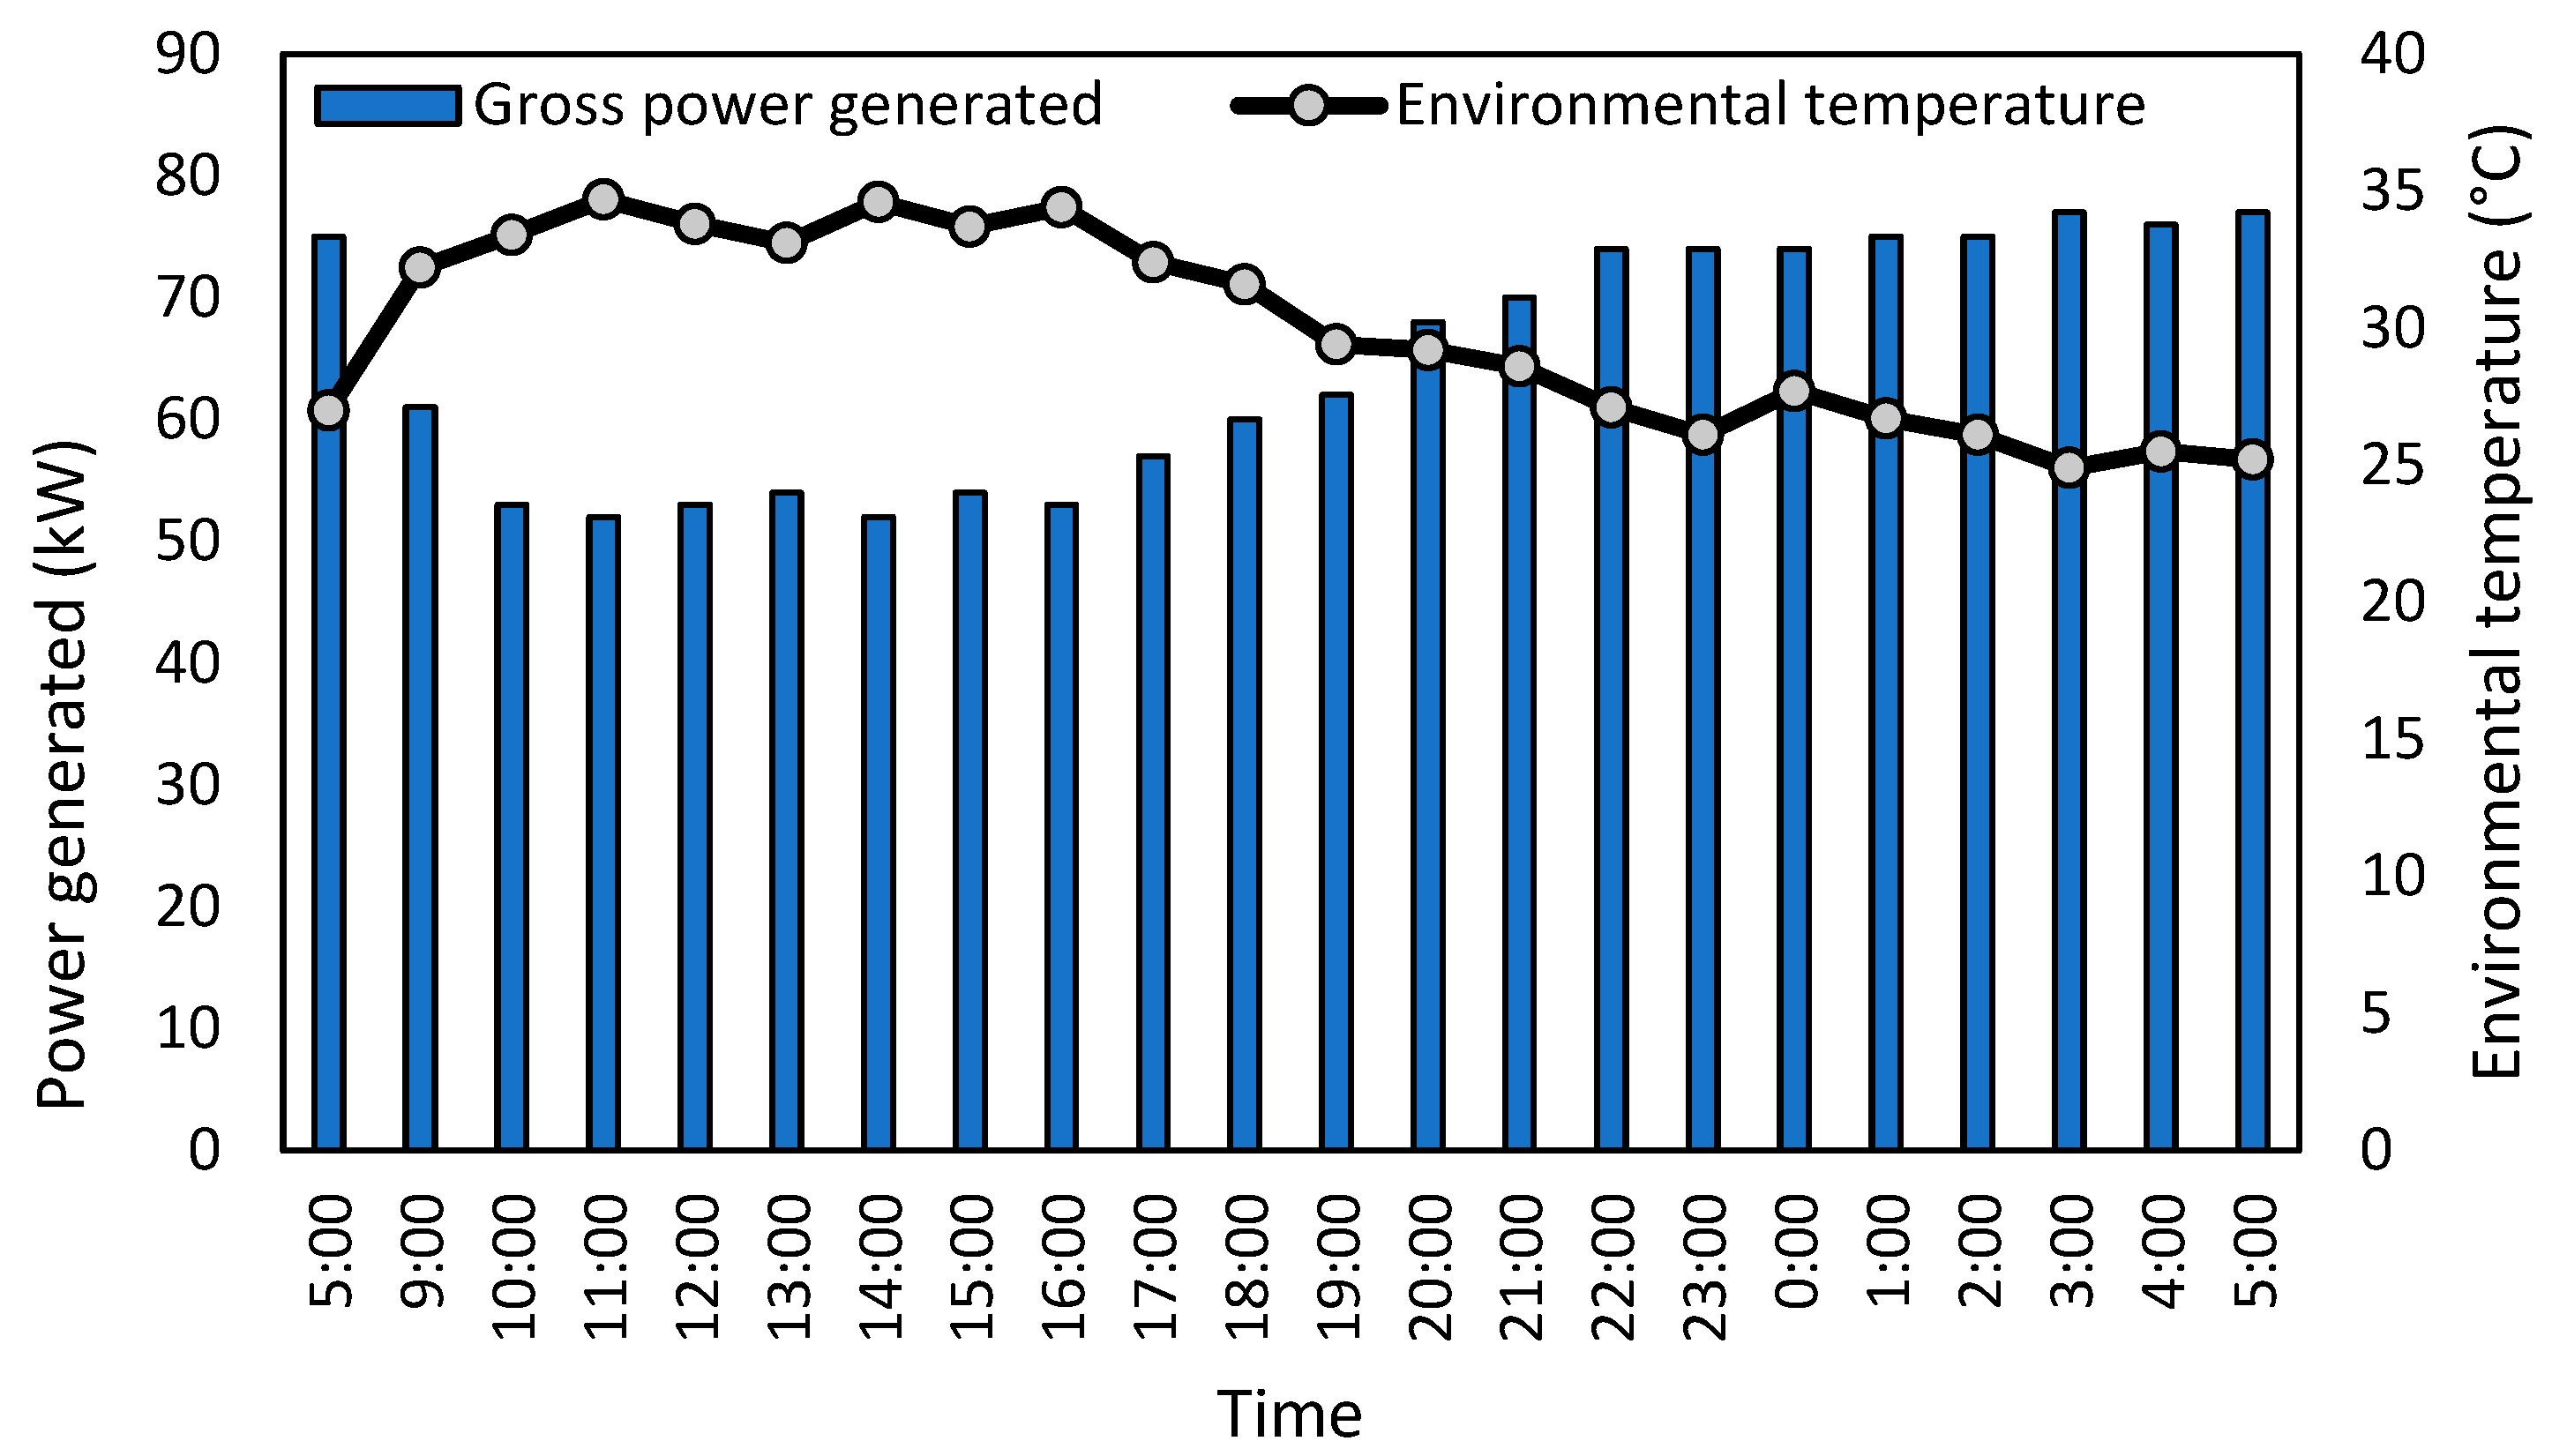
3.2. Production of the First Pilots in Colombia: Electrical Power Production

The first field pilot was carried out in OFA, where a modular ORC power generation unit was put into operation. Coincident with the commissioning of the power unit at OFA, installation activities for the OFB field pilot were initiated. The equipment installation in each field was carried out in a facility where the produced water could be filtered and treated prior to entering the ORC generation units. The treatment of this water, in addition to being normal oilfield practice, removed contaminants such as scale and hydrocarbons that could impair the operation of the ORC unit. Figure 5 shows the installed ORC system in one of the oil fields.
As Figure 5b illustrates, the ORC condenser uses ambient air to facilitate cooling of the working fluid in the system. In addition, the design of the system fits within a 40-foot shipping container, which allows for subsequent redeployment of the unit to another oil or gas field, should the need arise to do so.
A growing market for generation units suited to medium- and low-enthalpy geothermal energy is spurring innovation among ORC equipment manufacturers. These containerized, modular ORC units will help make the best use of geothermal power in oilfield settings [27].
On average, higher power production in the OFA field should be expected based on higher temperature fluids and higher flow rates when compared to the OFB field. A diurnal tendency in power production was observed due to changes in ambient air temperature over the course of a day. More efficient cooling was achieved at night, where temperatures could decrease from daytime highs of more than 30 °C down to temperatures of approximately 23 °C. This improved cooling efficiency at night allowed the power output to reach 77 kWe. This is explained by the increase in the thermal gradient between the system’s high-temperature focus (the geothermal fluid) and low-temperature focus (the environment as a cooling sink). The greater the magnitude of this thermal gradient, the greater the efficiency of the process. The true efficiency of the system depends on the technology employed, as well as the irreversibility of the process. A real measure of the system’s efficiency was calculated by dividing the gross power produced over the total thermal power available in the geothermal resource at the point of entry into the generation equipment. This calculation is detailed in Equation (4).
η r e a l = W N W T
where WN is the gross power generated (kW) and WT is the thermal power, or energy transported by the produced water (kW). Another parameter to evaluate the performance of the technology is the exergy efficiency. This parameter compares the amount of exergy employed regarding the exergy available at the beginning of the process, as shown in Equation (5).
η e x e = W N W a v a
where Wava is the exergy available at the beginning of the process (kW). Table 3 provides general information on the performance of the equipment, and Figure 6 shows the 24 h production of the ORC system in one of the oil fields.
As Table 3 demonstrates, the production of electrical energy increased when the ambient temperature was lower. Consequently, the highest power generation rates were obtained at night and in the early morning (19:00–5:00), as can be seen in Figure 6. In addition, as seen in Table 3, low values of exergy efficiency were found between 12:00 and 17:00, which were the times of highest ambient temperature. This is explained as being due to the influence that the ambient temperature has on the condensation of the working fluid inside the ORC, where high temperatures do not allow a complete condensation of the fluid, considering that for this system the ambient air is used as a cooling substance. This was to be expected because, as a thermal machine, the greater the temperature difference between the source and the sink, the greater the use and production of the technology [71,72]. On the other hand, the production system had an average exergy efficiency of 23%, indicating that only that percentage of the exergy that entered the process was transformed into power produced. The amount that was not usable in power generation was exergy wasted as residual heat and exergy destroyed, indicating that the proposed process can be optimized to increase efficiency and performance from modifications such as in the working fluid or in ORC components [63,72]. The real efficiency of the ORC unit depends on the process experiencing irreversibilities, such as heat transfer due to finite temperature difference, and fluid expansion, among others. It should be noted that the real efficiency observed was within the expected ranges of values for this type of generation system [73,74,75,76]. The greater efficiency observed in the hours of lower ambient temperature was also explained by the larger thermal gradient, which can be clearly seen in Figure 6. The improved condensation efficiency of the working fluid in these cooler conditions increased the overall efficiency of the ORC system. As shown in Figure 6, there were two zones that describe the energy production. The first zone was characterized by less energy production and high environmental temperatures and was found between 10:00 and 17:00 h. The second zone, with the highest energy production, was characterized by low environmental temperatures and appeared between 22:00 and 5:00. As explained above, this behavior was due to the temperature gradient between the energy source (geothermal fluid) and the sink (environment), which was greater in the second zone.
The geothermal power production in each oil field is used to supply part of the field’s own electrical needs, which may include lighting or the operation of heavy equipment. In this oil field setting, the use of the ORC units directly offsets power generation from fossil fuel combustion. The geothermal power production in an oilfield is an example of a transition from non-renewable technologies to renewable energy technologies. The benefits realized through the implementation of these systems are both environmental and financial due to a reduction in carbon footprint and a lowering of fuel costs, as reported in previous studies [38,42,45,47,51].

3.3. Carbon Footprint Calculation for the Two Colombian Oil Fields

A carbon footprint calculation was performed to determine the GHG emissions reduction associated with the implementation of the co-produced fluid geothermal power systems in both OFA and OFB compared to a base case where power was supplied exclusively through fossil fuel combustion. Four scenarios for this co-production system were evaluated to determine how different combinations of power generation sources would affect overall GHG emissions from these oil fields. The scenarios were listed in Section 2.2.
There is no other study in the scientific literature that examines the environmental benefits of geothermal co-production in oil and gas fields.

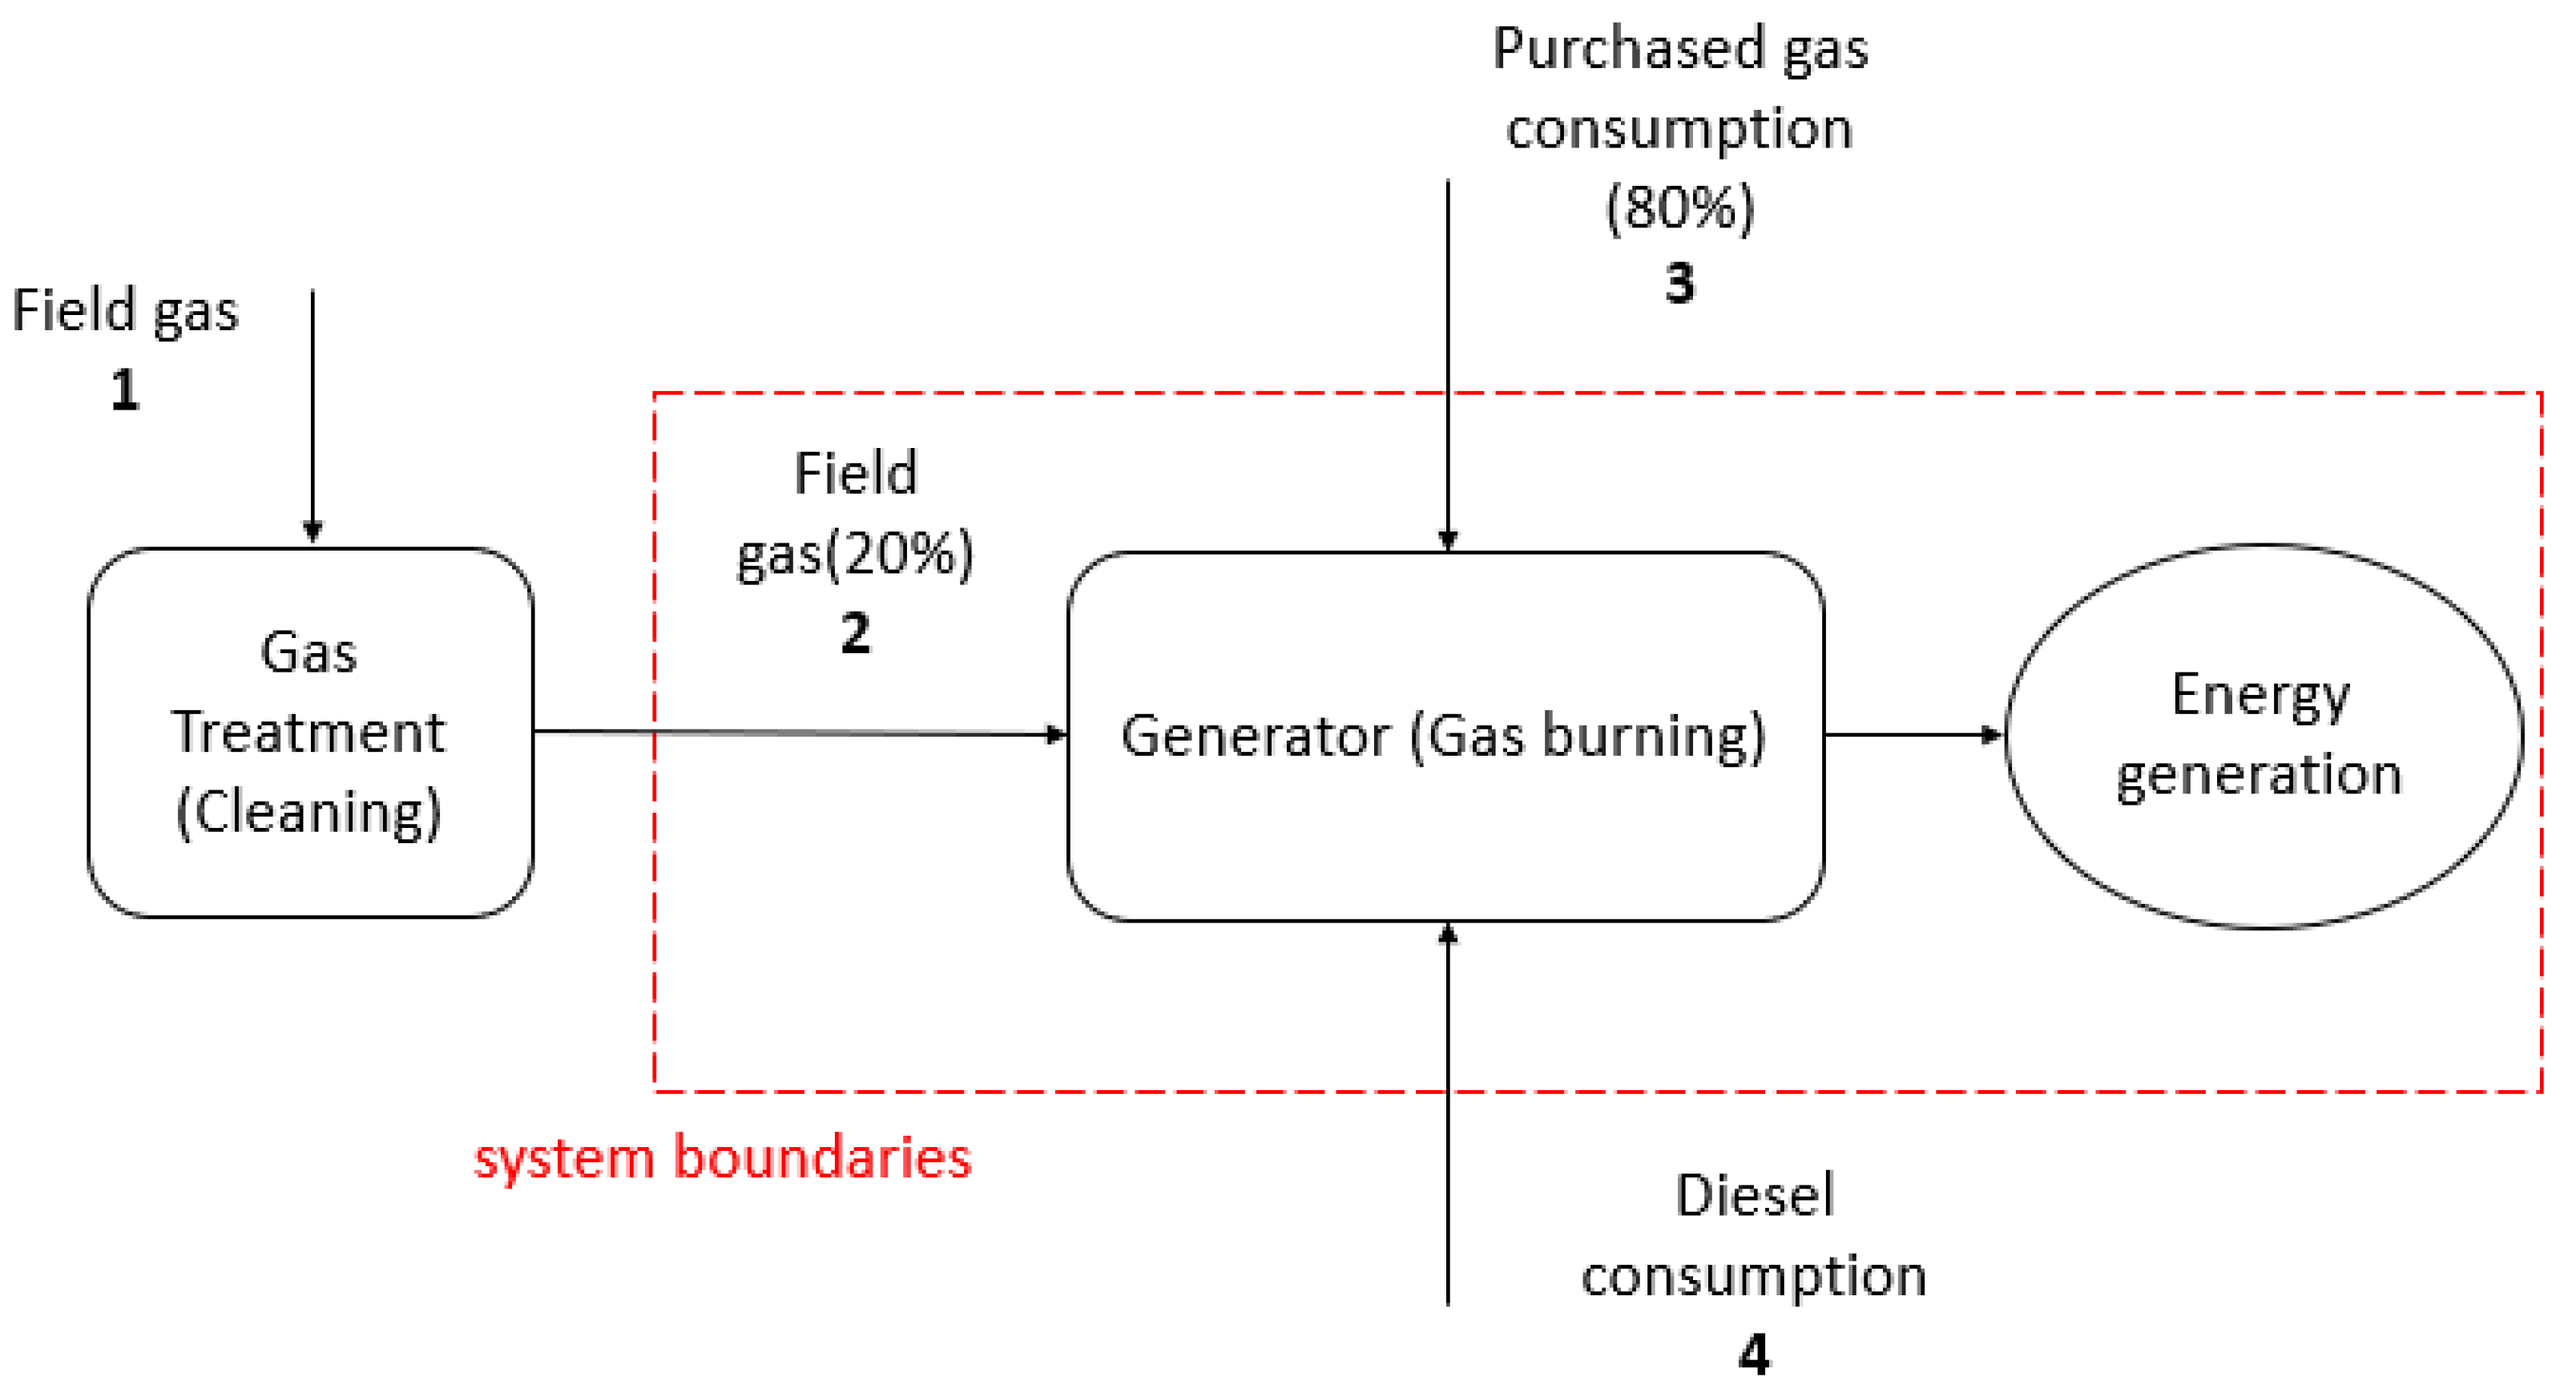
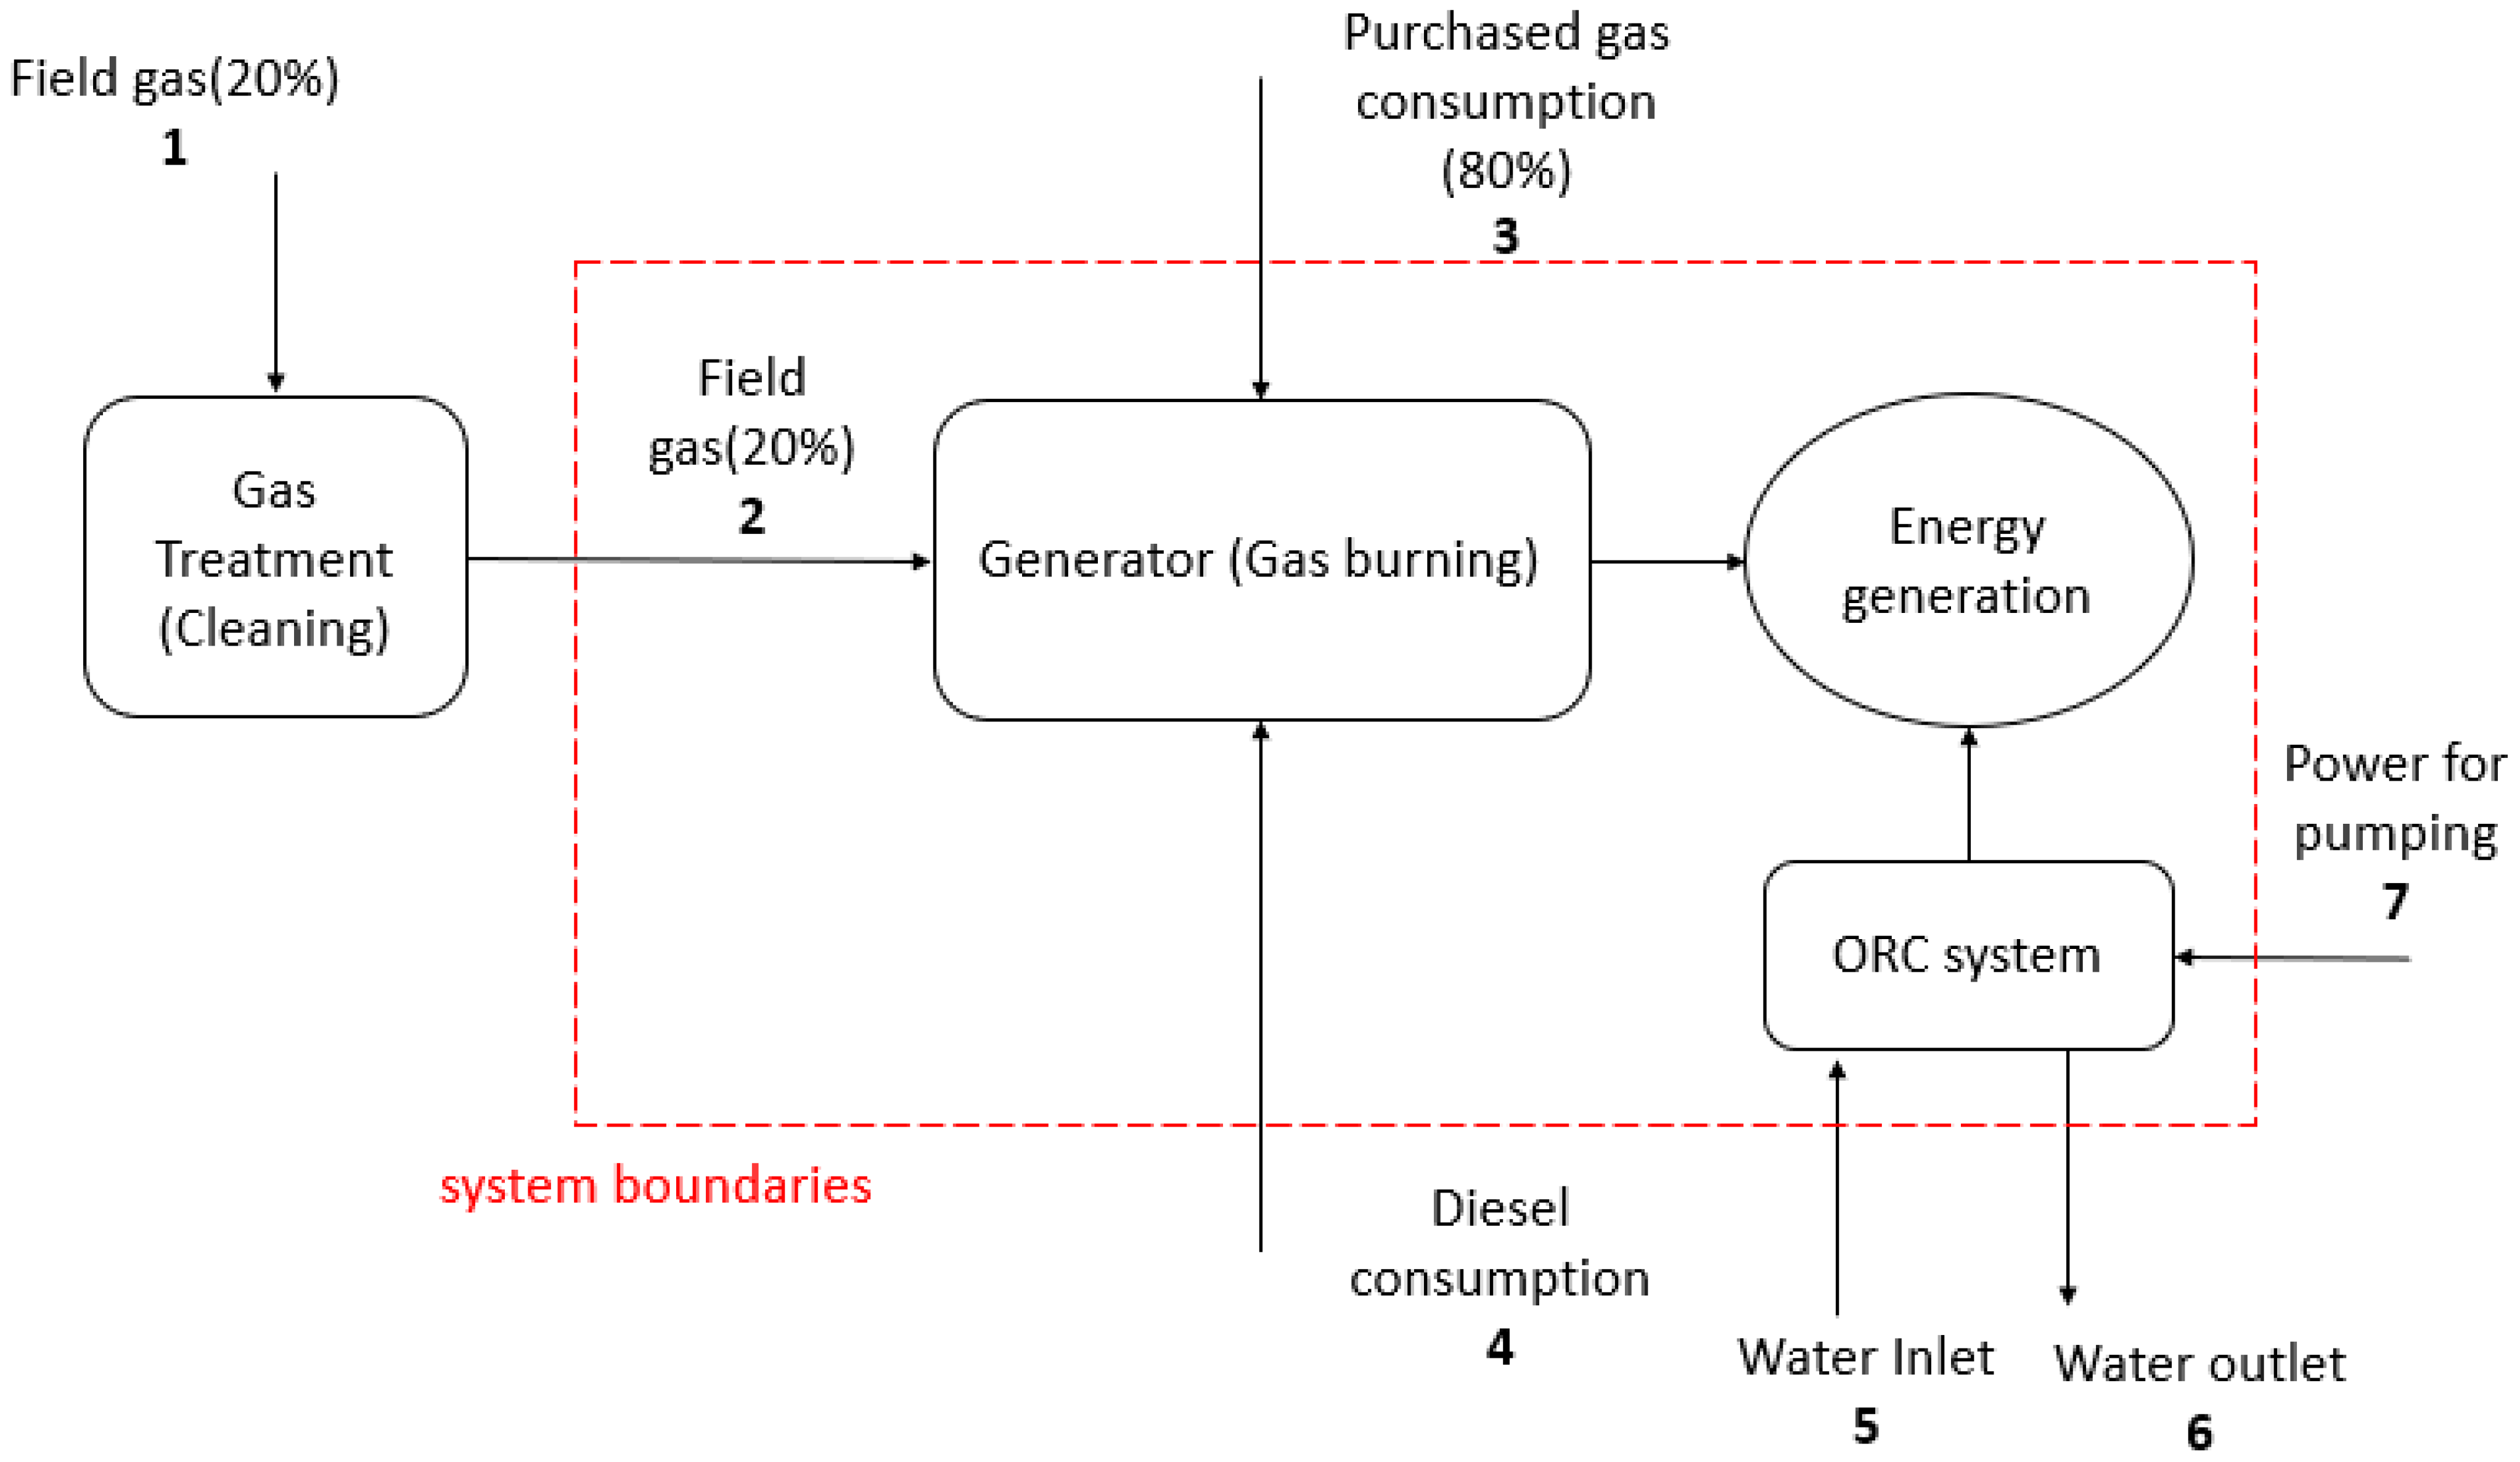
3.3.1. System Boundaries and Carbon Footprint Inventory Data

The calculation of the carbon footprint began by defining the cases that would be applied to OFA and OFB, where one case consisted of power generation exclusively from non-renewable, fossil fuel sources (Figure 7), and a second case considered the contribution of power from renewable sources, such as geothermal energy (Figure 8). In the case detailed in Figure 7, a large fraction of the natural gas consumed for power generation (80%) is supplied by an external provider. The remaining 20% comes from the oil field itself, where the gas is extracted and treated on site. The GHG emissions related to the transport of the natural gas were not considered in the carbon footprint calculation, but the emissions related to the combustion of this gas were accounted for. It was assumed that the gas supplier is responsible for the environmental impacts related to the production of the sold gas. Diesel consumption occurs when there is a shortage of gas, or when it is necessary to reinforce the energy generation system.
Table 4 presents the volumetric and energy flows consumed in the energy generation system based on non-renewable resources. The values expressed in this section, including energy consumption and gas consumption, represent the consumption over a period of one month in the year 2019, and were provided by the field operator based on the actual consumption in the oil fields.
Figure 8 shows an energy production system where the use of renewable geothermal energy is incorporated. This system considers the geothermal energy supplied from the produced waters, as well as the parasitic load imposed by the pump. The total energy produced is 94,970 MJ per month. As in the previous case, gas and diesel are consumed, but here, the consumption of field gas is smaller because of the power contribution from the ORC system.
Table 5 presents the summary data for a system integrating geothermal energy co-generation. The calculations related to non-renewable resources (gas and diesel) considered that the energy produced by the ORC offsets the use of gas. Over a period of a month in OFA, 1,102,816 MJ and 27,050 m3 of gas consumption are offset and in OFB, 1,352,940 MJ and 33,185 m3 are offset.
When analyzing the information shown in Table 4 and Table 5, it was identified that the OFA field has a greater energy need. This can be explained by the dynamics of OFA, where there is a greater production of fluids (see Figure 3 and Figure 4). In addition, when part of the input to the system came from the geothermal co-production, a decrease of 28% and 59% in field gas was identified for OFA and OFB, respectively. The decrease in OFB can be explained due to the lower consumption of field gas, where the co-production of geothermal energy has a greater impact in terms of energy consumption.

3.3.2. Carbon Footprint Accounting for Energy Production from Non-Renewable Resources and Geothermal Energy Co-Generation Systems

The comparison of the per-kWh carbon footprint between the fossil fuel-derived power scenario and the geothermal energy co-production scenario showed a 19% reduction in CO2 emissions in the OFA oil field. The gas treatment process within the oil field accounted for most of the CO2 emissions in these evaluations. In the OFA oil field, gas treatment represented 99.1% of total carbon emissions in the fossil fuel-derived power scenario, and in the geothermal power co-generation scenario, it represented 87.3% of total carbon emissions.
In the case of OFB, a possible 11% reduction in CO2 emissions intensity was identified through the use of geothermal co-generation. As in the OFA analysis, the greatest contributor to GHG emissions in OFB was gas treatment. Here, gas treatment represented 93.4% of total carbon emissions in the fossil fuel-derived power scenario, and in the geothermal power co-generation scenario, it represented 63.2% of total carbon emissions. Table 6 summarizes these analyses and underscores the positive environmental impacts of incorporating geothermal energy into these assets. It is worthwhile to reinforce that the emissions related to the treatment of the imported gas are assumed by the gas supplier; hence, they are not included in this accounting.
The impact of offsetting power derived from field gas with power from co-produced geothermal energy is notable. In the OFA oilfield, 27,050 m3 of gas combustion was avoided using geothermal co-production, and in the OFB oilfield, 33,185 m3 of gas combustion was avoided.
A contribution analysis of the non-renewable, fossil fuel-derived system was conducted, and a summary is presented in Table 7. Field gas generated a significant carbon footprint through the cleaning process. The analysis revealed that 90.1% and 80.1% of the overall carbon footprint for OFA and OFB, respectively, can be attributed to gas cleaning. By reducing the volume of field gas in this system, the carbon footprint should be reduced meaningfully. Table 8 shows the contribution analysis for the fossil fuel-derived energy in the geothermal co-generation. Field gas continued to be one of the most significant contributors to the carbon footprint of the system, as 87.5% of OFA emissions and 63.21% of OFB emissions were derived from this treatment. In the case of OFB, the geothermal energy co-generation system had a more significant impact in reducing the carbon footprint due to the lower amount of gas burned compared to OFA. Here, a 19% carbon footprint reduction can be achieved through implementation of the geothermal system. In the case of OFA, although a total decrease in the carbon footprint of 19% was identified through geothermal co-production, gas combustion still contributed significantly to the carbon footprint in this field.

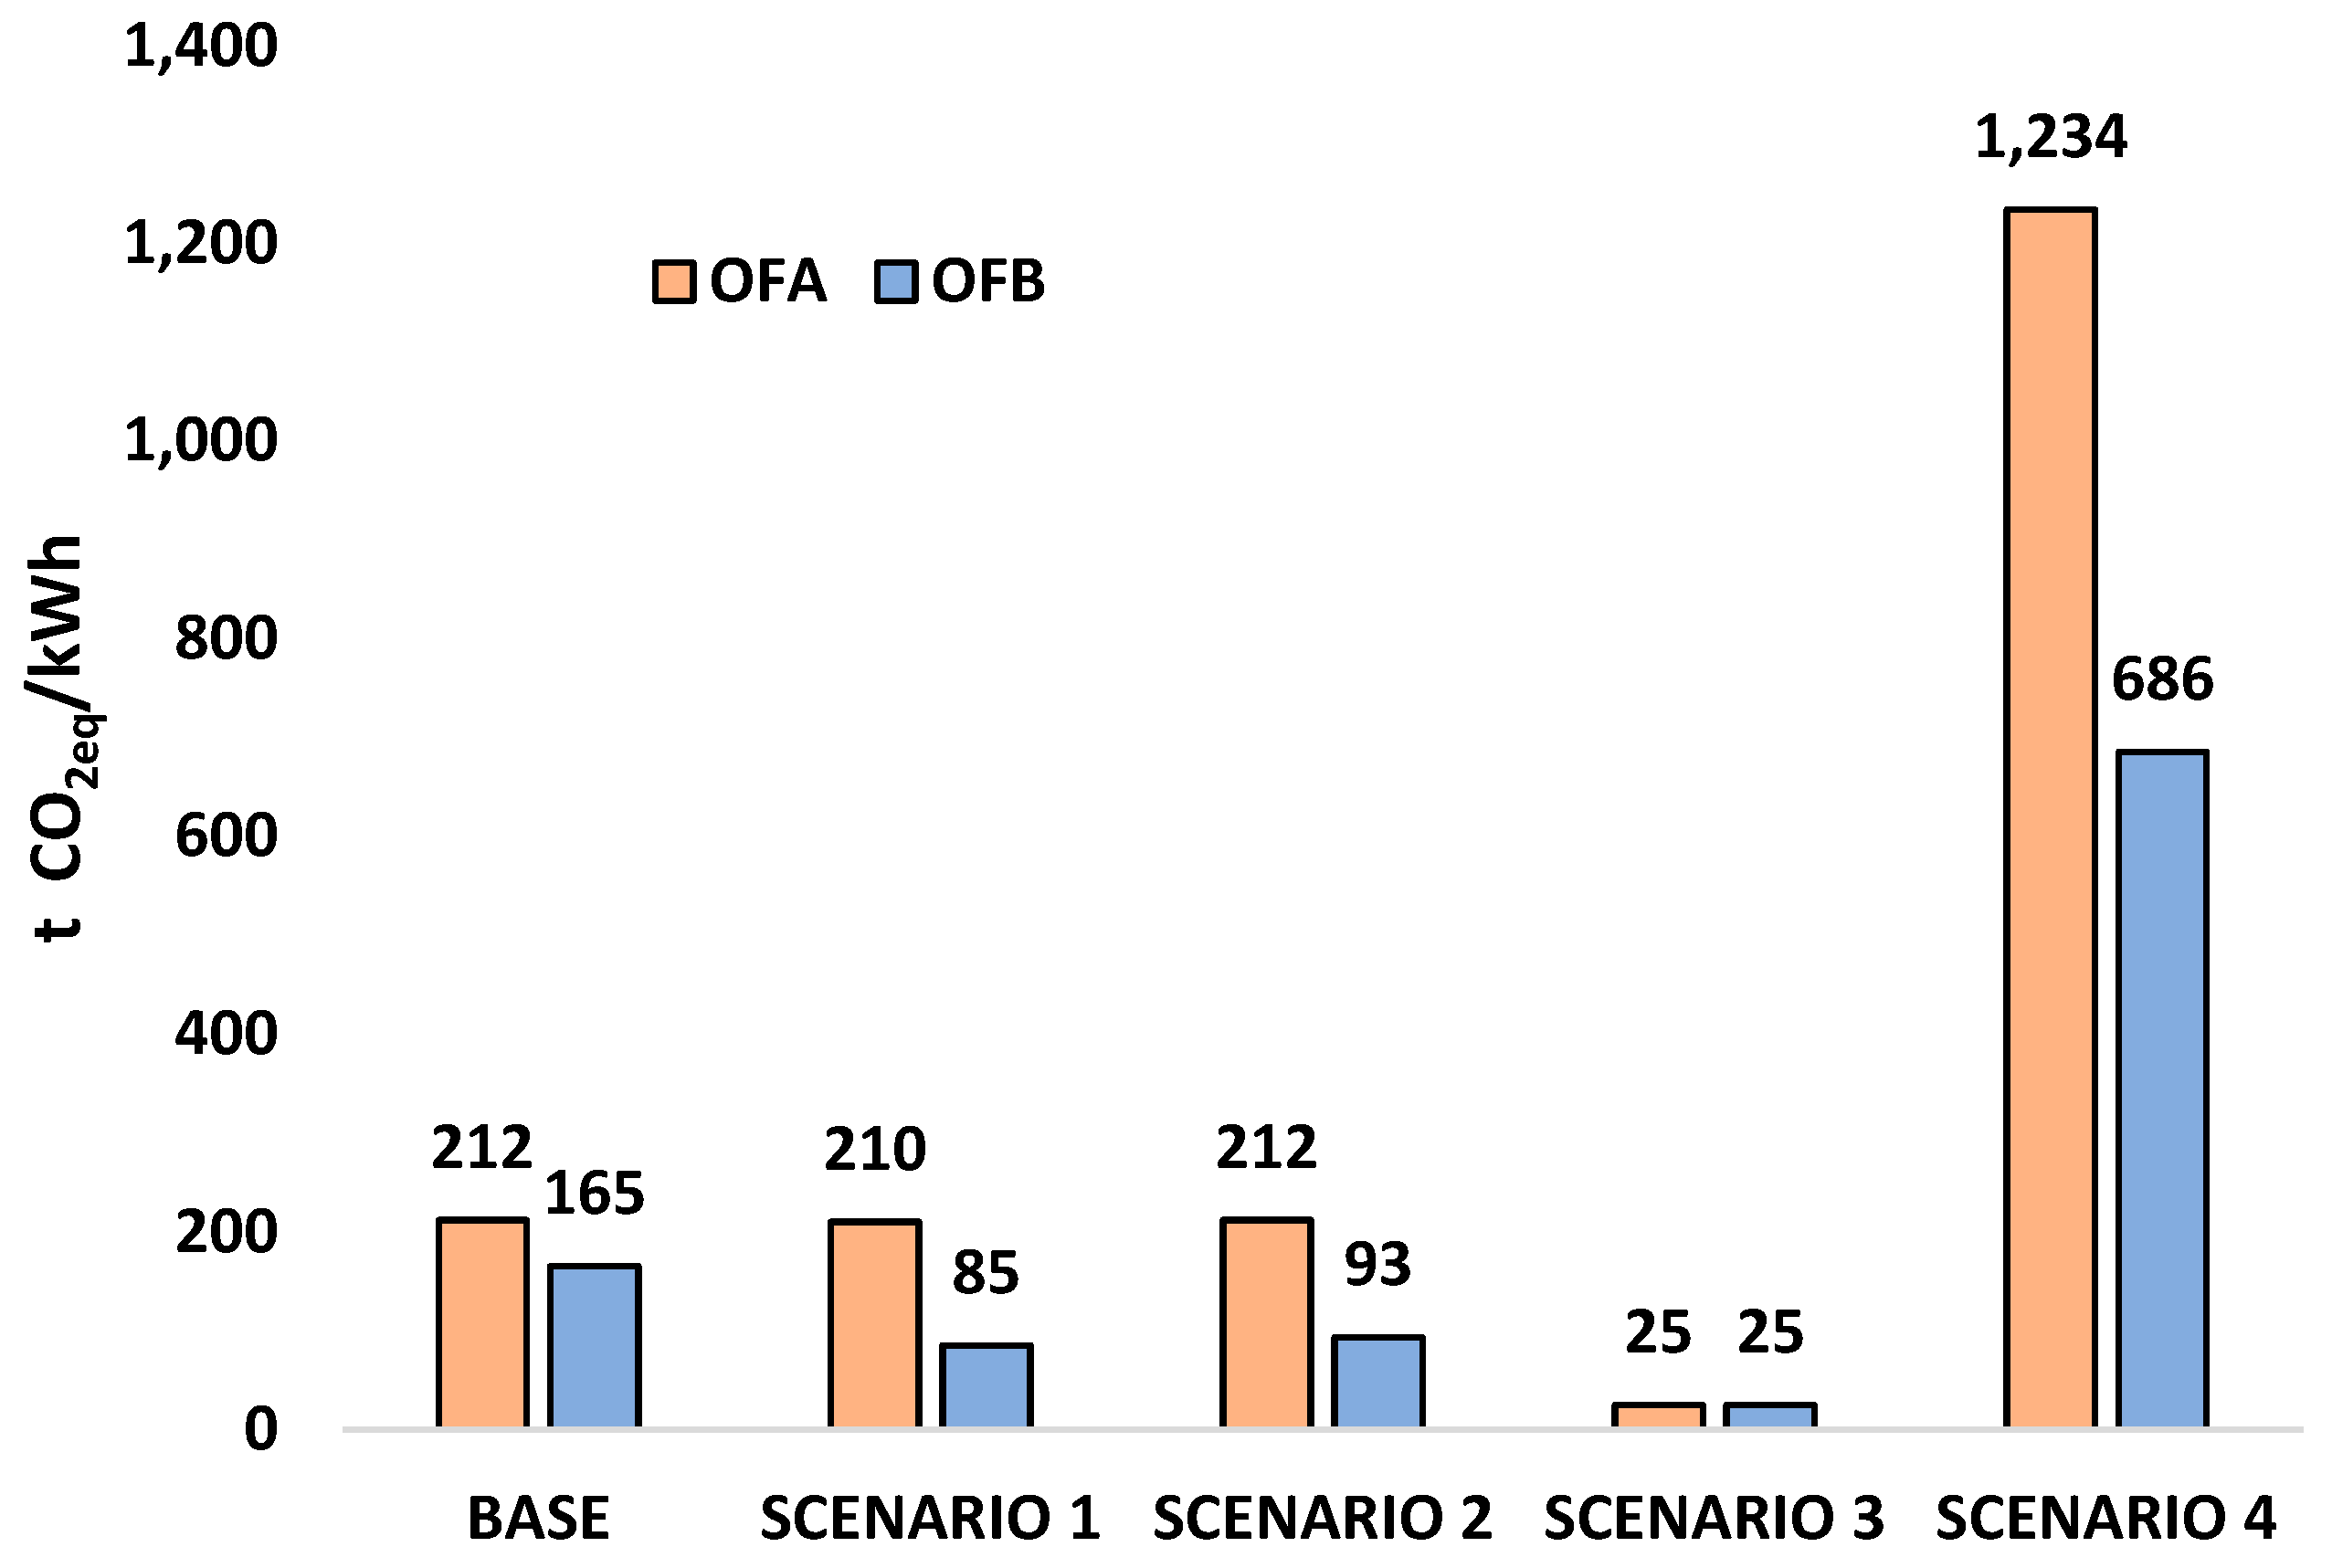
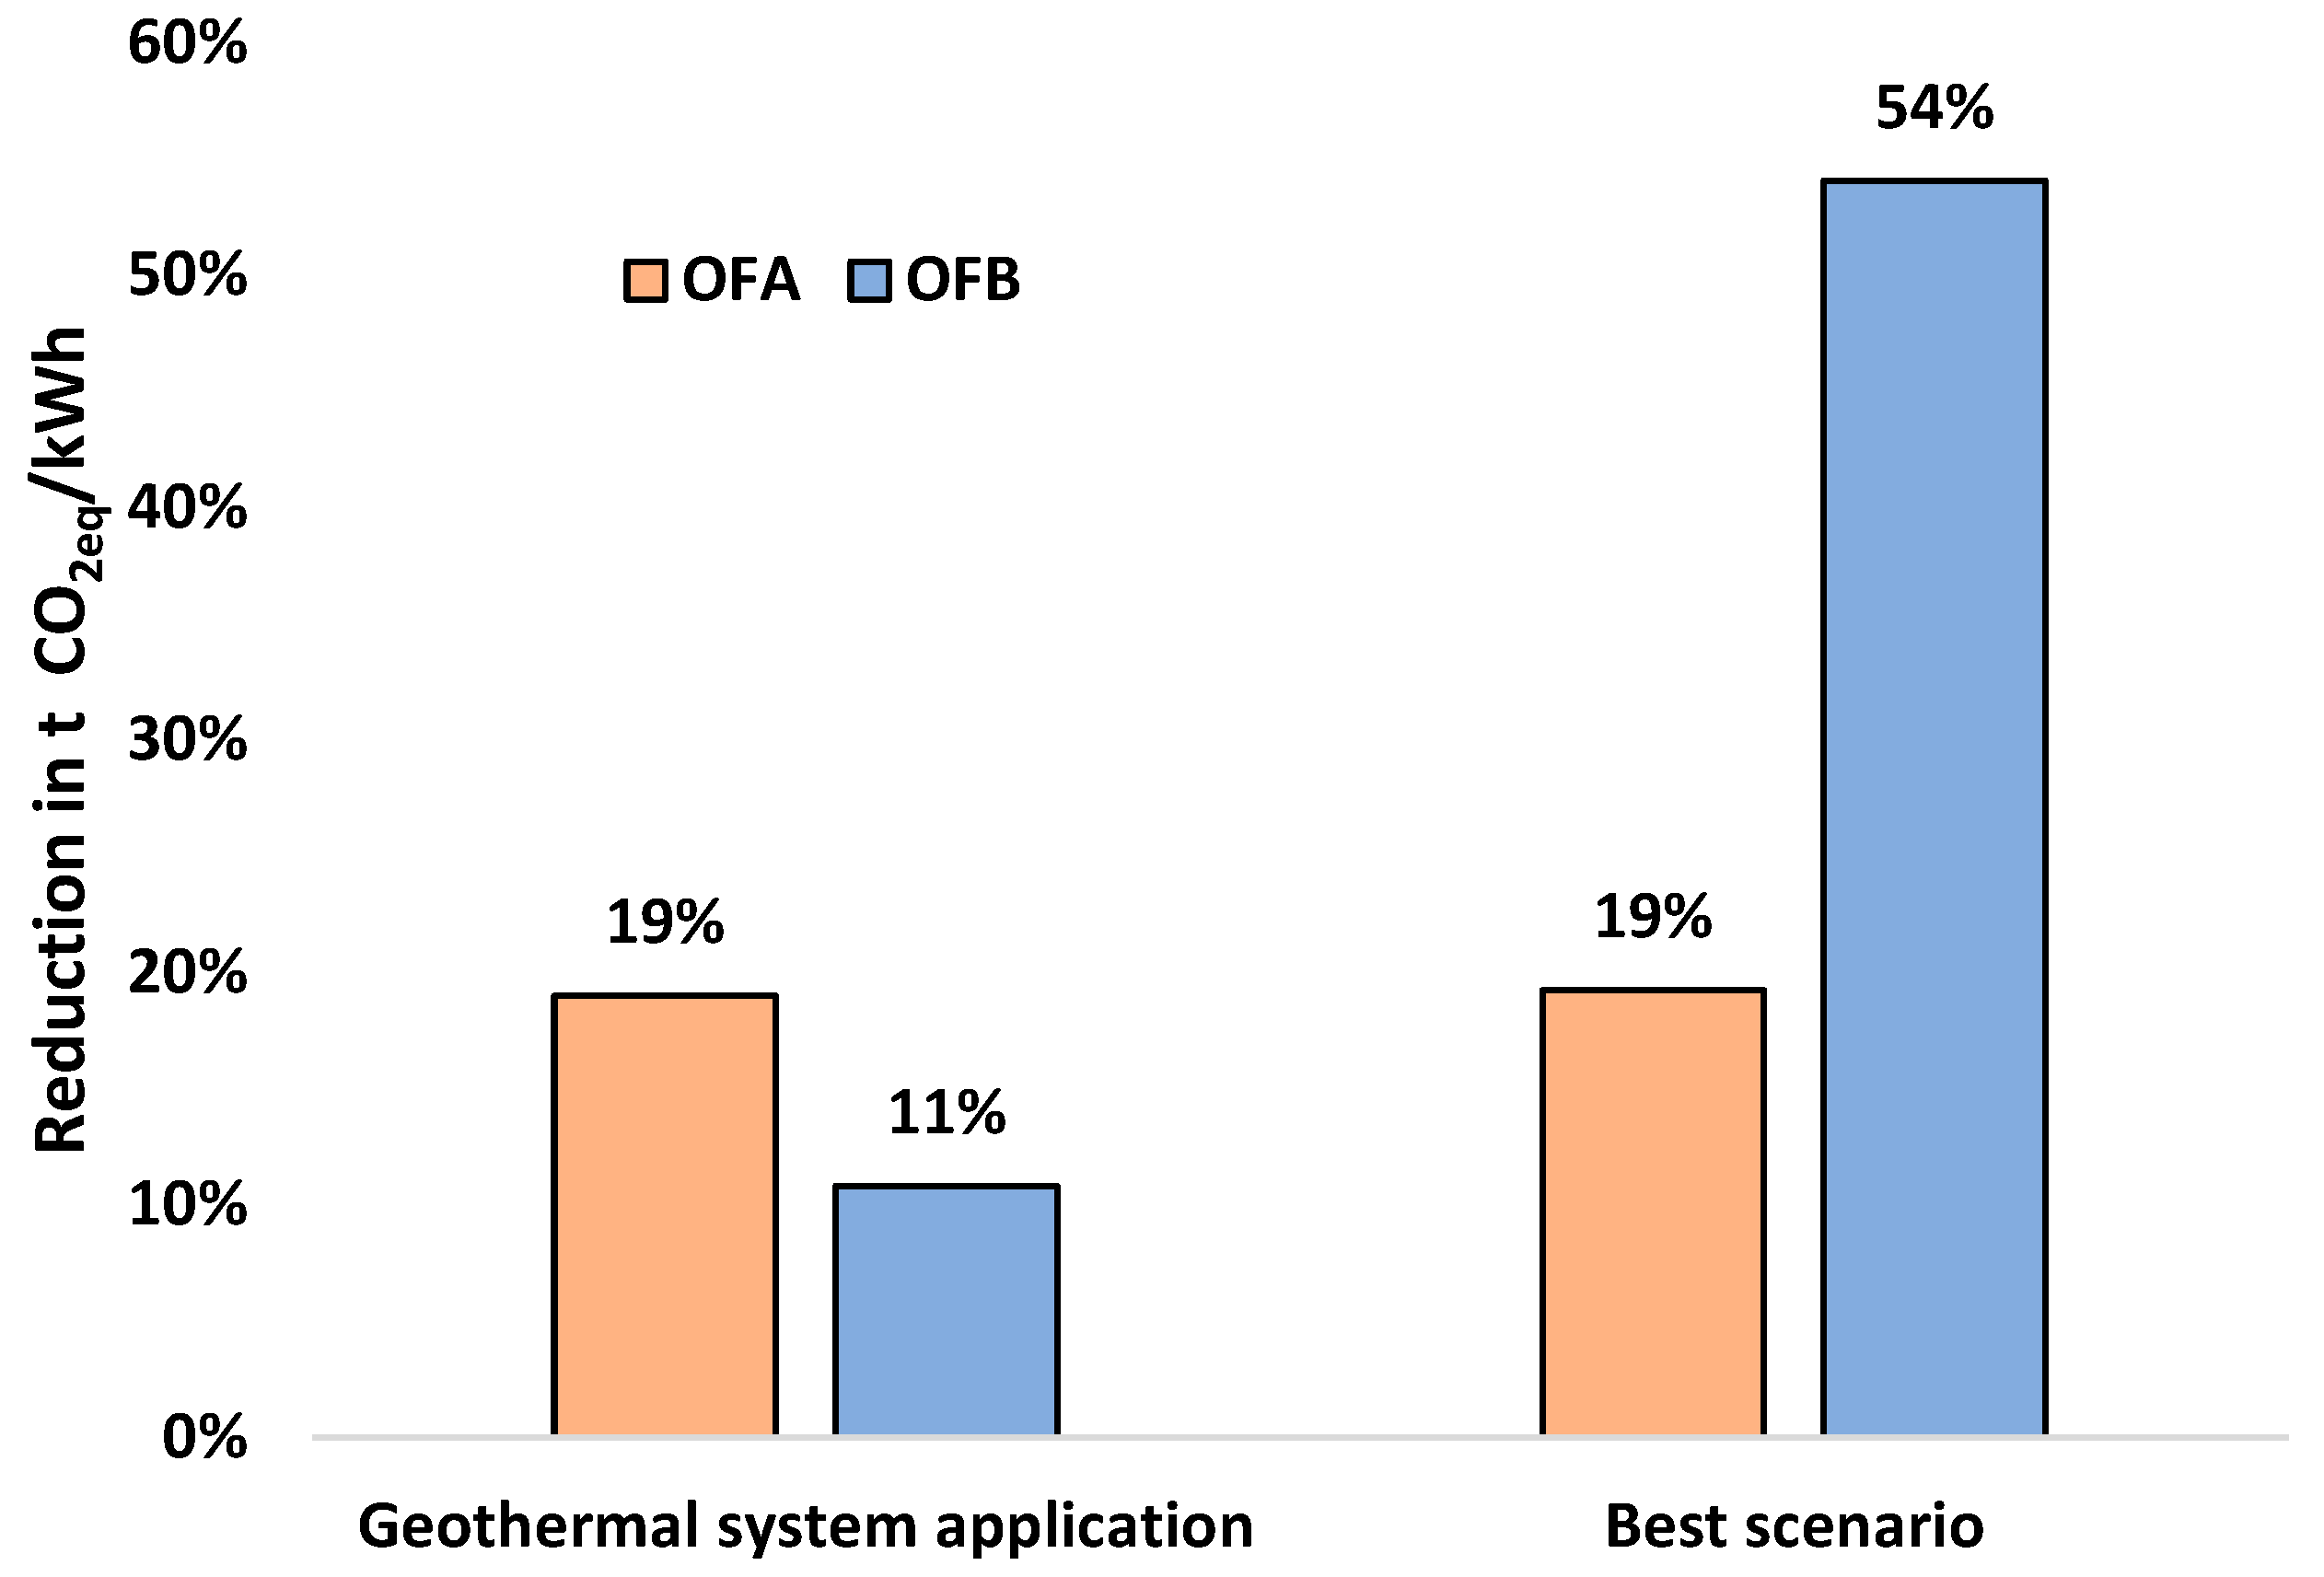
3.3.3. Effect of the Variation in Consumption of Non-Renewable Resources on the Carbon Footprint in the Geothermal Energy Co-Generation System

The results from the previous sections show that the use of geothermal resources had a significant positive environmental impact on the carbon footprint in both subject oil fields. In this section, the impacts of geothermal energy co-generation systems are further analyzed by proposing scenarios where the non-renewable energy inputs are varied. This analysis was conducted to find the geothermal energy co-generation scenario in which the lowest carbon footprint occurs while still maintaining the average power production in the oil field. For this purpose, four scenarios were defined wherein the quantities of non-renewable energy sources used in power generation are manipulated.
Table 9 and Figure 9 show the contributions of each of the non-renewable energy sources to the overall carbon footprint. As we have seen in this study, the impact of diesel fuel power generation is relatively low, as it is only used when natural gas supplies are restricted. We proposed replacing the diesel power generation to further reduce the impact of diesel generation on the overall footprint. In Scenario 1, diesel is replaced by purchased gas, and in Scenario 2, diesel generation is replaced by field gas. Due to the large impact of gas generation on the carbon footprint, it is useful to consider scenarios wherein 100% of the generation is derived from purchased gas or 100% of the generation is derived from field gas. These are represented by Scenarios 3 and 4, respectively.
For additional clarification, when there is a gas overload in the system, a flaring system is used. For the purpose of this investigation, this flaring was not considered in the carbon footprint accounting, as these emissions are not directly associated with power generation.
The electrical production in OFA was assumed to be 4,924,800 MJ month−1 and for OFB was assumed to be 3,132,000 MJ month−1. Table 9 shows the fuel consumption for each proposed scenario.
When comparing the scenarios in each oil field, one can observe that the replacement of diesel with gas combustion generated a decrease in the carbon footprint of OFB of 48% in Scenario 1 and 44% in Scenario 2. For OFA, the replacement of diesel resulted in a carbon footprint reduction of 1% in Scenario 1 and had no significant effect in Scenario 2 (a decrease of 0.3%). This can be attributed to the lower amount of diesel consumed in OFB (3.25 m3 month−1) compared to OFA (0.75 m3 month−1). Furthermore, this result, particularly in OFB, indicates that this reduction is sensitive to the overall amount of diesel that enters the system. Diesel is a key target for GHG emissions reduction, and where it is a significant input in power generation, it should be replaced by a fuel with a lower emissions impact, like natural gas. These large reductions in carbon footprint through the replacement of diesel will not apply to all oil fields, and the magnitude of the GHG emissions reductions may depend on factors that are outside the scope of this study.
Scenarios 3 and 4 represent the cases with the highest and lowest carbon footprint in this analysis. This can be attributed to the differences in the types of gas consumed in each scenario. When 100% field gas is used, as in Scenario 4, the carbon footprint associated with the treatment of the gas must be accounted for in the footprint calculation. Otherwise, as observed in Scenario 3, the environmental impact produced by the purchased gas is assumed by the supplier rather than the operator of the oil field.
In addition, if each scenario is analyzed in terms of practicality and viability, Scenario 3 would require a constant supply of purchased gas. Considering that the purchased gas is treated in a facility that may be located a significant distance from the oil field, which provokes additional GHG emissions, Scenario 3 is not recommended. Meanwhile, Scenario 4 requires a large gas production within the oil field, which is not the case in the subject fields in this study. Therefore, balancing technical, environmental, and practical considerations, the best operating scenario is Scenario 1, wherein 100% liquid fuel consumption is replaced with purchased gas. All of the above scenarios take into account the power contribution from the geothermal co-generation units.
Figure 10 shows the reduction in GHG emissions compared to the base case when using the geothermal energy co-production system and when considering Scenario 1 as the optimal scenario for energy production in OFA and OFB. In OFA, the emissions reductions are realized almost exclusively through the implementation of geothermal co-generation and the practices outlined in Scenario 1. This is due to the low amount of diesel consumption in OFA, which uses 25% of the amount of diesel consumed in OFB. This means there is less of an opportunity for diesel replacement in OFA compared to OFB. In OFB, a carbon footprint decrease of 54% could be achieved through the replacement of diesel generation with geothermal energy and purchased gas generation.
These results underline a significant opportunity for Colombian oilfield operators to reduce their carbon footprints.

4. Conclusions

Colombia is a country with significant potential for renewable energy development, building on an already large portfolio of hydroelectric power infrastructure. The geothermal energy potential in the country has been estimated at 1170 MWe [76]. Across the two oil fields that were the subject of this study, and based on thermodynamic calculations, the maximum theoretical potential for geothermal energy production is 2260 kWe for OFA and 657 kWe for OFB. This work has demonstrated the technical feasibility of this geothermal energy in oilfield applications, which may serve as an example for others in the industry to follow.
In the OFA oil field, the carbon emissions intensity from power production was equivalent to 260 tons CO2eq/kWh, compared to OFB, where the carbon emissions intensity from power production was 185 tonCO2eq/kWh. The gas treatment stage is the process that has the largest impact on overall emissions intensity. In scenarios that already consider the emissions reductions realized through geothermal co-generation, in OFA, 87.3% of emissions were attributable to gas treatment, and in OFB, gas treatment accounted for up to 63.2% of GHG emissions. Based on the assessments performed in this study, a carbon footprint reduction of 19% could be realized in OFA and a reduction of 11% could be achieved in OFB.
Non-renewable sources of energy such as gas and diesel are the source of almost all greenhouse gases in co-production systems. By varying the sources of power generation in OFA and OFB, our study found an optimal solution in Scenario 1, wherein 100% of liquid fuel consumption (diesel) is replaced by purchased gas.
Aside from the benefits quantified and confirmed in this investigation, it is clear that more widespread implementation of geothermal energy co-generation systems would be a benefit to the efforts of the oil and gas industry to decarbonize activities. The regulatory precedents may help resolve obstacles that stand in the way of conventional hydrothermal geothermal developments. These regulatory pathways will be key to attracting the interest and investment required to meaningfully develop a geothermal industry in Colombia and further diversify Colombia’s energy matrix.
This project is an important example of how Colombia can implement innovative strategies to meet increasing energy needs while mitigating the effects of climate change.
For future research, we propose broadening the evaluation to include other environmental impacts outside of the carbon footprint, including fossil fuel and metal depletion, land impacts, and acidification throughout the supply chain. Technical and economic analyses should also be implemented to provide a framework for holistic decision-making on sustainability.

Author Contributions

Conceptualization, S.C., N.A.C., G.F., D.J., D.M., M.G., J.P., J.R., F.B.C. and C.A.F.; methodology, S.C., N.A.C., G.F., D.J., D.M., M.G., J.P., J.R., F.B.C. and C.A.F.; software, S.C. and N.A.C.; formal analysis, S.C. and N.A.C.; investigation, S.C., N.A.C., G.F., D.J., D.M., M.G., J.P., J.R., F.B.C. and C.A.F.; writing—original draft preparation, S.C. and N.A.C.; writing—review and editing, S.C., N.A.C., G.F., D.J., D.M., M.G., J.P., J.R., F.B.C. and C.A.F. All authors have read and agreed to the published version of the manuscript.

Funding

This research was funded by MINCIENCIAS under project number 7995-869-76099.

Institutional Review Board Statement

Not applicable.

Informed Consent Statement

Not applicable.

Acknowledgments

The authors acknowledge MINCIENCIAS, Parex Resources Colombia Ltd., and Universidad Nacional de Colombia for their financial and logistic support.

Conflicts of Interest

The authors declare no conflict of interest.

References

  1. Vilches, A.; Gil Pérez, D.; Toscano, J.; Macías, O. La Transición Energética. Una Nueva Cultura de la Energía; OEI: Madrid, Spain, 2014; ISBN 978-84-7666-213-7. [Google Scholar]
  2. Vie, P.; Bonanni, A.; Lewiner, C.; Cozzens, R.; Modi, G.; Klingberg, A.; Lindhaus, J.; Lemaitre, E.; Sinha, N.; Ghosh, A. World Energy Markets Observatory-Wemo 2020, 22 edition, November 2020. France. Available online: https://inis.iaea.org/search/searchsinglerecord.aspx?recordsFor=SingleRecord&RN=51124578 (accessed on 27 January 2020).
  3. EPA. Global Grenhouse Gas Emissions Data. Available online: https://www.epa.gov/ghgemissions/global-greenhouse-gas-emissions-data (accessed on 27 January 2020).
  4. Agreement, P. Adoption of the Paris Agreement’ fccc/cp/2015/L; UNFCCC: Bonn, Germany, 2015; Volume 9. [Google Scholar]
  5. UNFCCC. The 2021 United Nations Climate Change Conference. In Proceedings of the 2021 United Nations Climate Change Conference, Glasgow, UK, 31 October–13 November 2021. [Google Scholar]
  6. Álvarez-Espinosa, A.C.; Ordóñez, D.A.; Nieto, A.; Wills, W.; Romero, G.; Calderón, S.L.; Hernández, G.; Argüello, R.; Delgado-Cadena, R. Economic Evaluation of Colombia’s Commitment at COP21. Desarro. Soc. 2017, 79, 15–54. [Google Scholar] [CrossRef]
  7. CAMPETROL. Transformación Energética en Colombia; Unavisión de Campetrol: Quito, Ecuador, 2019. [Google Scholar]
  8. Radomes, A.A., Jr.; Arango, S. Renewable energy technology diffusion: An analysis of photovoltaic-system support schemes in Medellín, Colombia. J. Clean. Prod. 2015, 92, 152–161. [Google Scholar] [CrossRef]
  9. García, C. Mapa Energético de Colombia 2019–2050. Available online: https://www1.upme.gov.co/DemandaEnergetica/PEN_documento_para_consulta.pdf (accessed on 27 January 2020).
  10. Caspary, G. Gauging the future competitiveness of renewable energy in Colombia. Energy Econ. 2009, 31, 443–449. [Google Scholar] [CrossRef]
  11. Alfaro, C. Improvement of Perception of the Geothermal Energy as A Potential Source of Electrical Energy in Colombia, Country Update. In Proceedings of the World Geothermal Congress 2015, Melbourne, Australia, 15–24 April 2015; pp. 19–24. [Google Scholar]
  12. Alfaro, C.; Ponce, P.; Monsalve, M.L.; Ortiz, I.; Franco, J.V.; Ortega, A.; Torres, R.; Gómez, D. A Preliminary Conceptual Model of Azufral Geothermal System, Colombia. In Proceedings of the World Geothermal Congress, Melbourne, Australia, 15–24 April 2015. [Google Scholar]
  13. Arias-Gaviria, J.; Carvajal-Quintero, S.X.; Arango-Aramburo, S.J.R.E. Understanding dynamics and policy for renewable energy diffusion in Colombia. Renew. Energy 2019, 139, 1111–1119. [Google Scholar] [CrossRef]
  14. Salazar, S.S.; Muñoz, Y.; Ospino, A. Analysis of geothermal energy as an alternative source for electricity in Colombia. Geotherm. Energy 2017, 5, 27. [Google Scholar] [CrossRef] [Green Version]
  15. Bachu, S.; Ramon, J.C.; Villegas, M.E.; Underschultz, J.R. Geothermal regime and thermal history of the Llanos Basin, Colombia. AAPG Bull. 1995, 79, 116–128. [Google Scholar] [CrossRef]
  16. Lozano, E.J.G. Hot springs and geothermal energy in Colombia. Geothermics 1988, 17, 377–379. [Google Scholar] [CrossRef]
  17. Marzolf, N.C. Emprendimiento de la Energía Geotérmica en Colombia. Available online: https://publications.iadb.org/publications/spanish/document/Emprendimiento-de-la-energ%C3%ADa-geot%C3%A9rmica-en-Colombia.pdf (accessed on 27 January 2020).
  18. Mejía, E.; Rayo, L.; Méndez, J.; Echeverri, J. Geothermal development in Colombia. In Short Course VI on Utilization of Low- and Medium-Enthalpy Geothermal Resources and Financial Aspects of Utilization; UNU-GTP LaGeo: Santa Tecla, El Salvador, 2014. [Google Scholar]
  19. Moreno-Rendón, D.A.; López-Sánchez, J.; Blessent, D. Geothermal Energy in Colombia as of 2018. Ing. Univ. 2020, 24, 1–27. Available online: https://10.11144/Javeriana.iyu24.geic. (accessed on 27 January 2020). [CrossRef]
  20. Leitch, A.; Haley, B.; Hastings-Simon, S. Can the oil and gas sector enable geothermal technologies? Socio-technical opportunities and complementarity failures in Alberta, Canada. Energy Policy 2019, 125, 384–395. [Google Scholar] [CrossRef]
  21. Toth, A.N.; Szucs, P.; Pap, J.; Nyikos, A.; Fenerty, D.K. Converting Abandoned Hungarian Oil and Gas Wells into Geothermal Sources. In Proceedings of the 43rd Workshop on Geothermal Reservoir Engineering, Stanford, CA, USA, 12–14 February 2018. [Google Scholar]
  22. Watson, S.M.; Falcone, G.; Westaway, R. Repurposing hydrocarbon wells for geothermal use in the UK: The onshore fields with the greatest potential. Energies 2020, 13, 3541. [Google Scholar] [CrossRef]
  23. Nugroho, W.; Hermawan, S.; Lazuardi, B.; Mirza, R. Drilling Problems Mitigation in Geothermal Environment, Case Studies of Stuck Pipe and Lost Circulation. In Proceedings of the SPE/IATMI Asia Pacific Oil & Gas Conference and Exhibition, Bali, Indonesia, 17–19 October 2017. [Google Scholar]
  24. Harris, B. A CFD Study on the Extraction of Geothermal Energy from Abandoned Oil and Gas Wells. Master’s Thesis, McMaster University, Hamilton, ON, Canada, 2017. [Google Scholar]
  25. Kharseh, M.; Al-Khawaja, M.; Hassani, F. Optimal utilization of geothermal heat from abandoned oil wells for power generation. Appl. Therm. Eng. 2019, 153, 536–542. [Google Scholar] [CrossRef]
  26. Wang, S.; Yan, J.; Li, F.; Hu, J.; Li, K. Exploitation and utilization of oilfield geothermal resources in China. Energies 2016, 9, 798. [Google Scholar] [CrossRef] [Green Version]
  27. Wang, K.; Yuan, B.; Ji, G.; Wu, X. A comprehensive review of geothermal energy extraction and utilization in oilfields. J. Pet. Sci. Eng. 2018, 168, 465–477. [Google Scholar]
  28. Choi, Y.; Lee, C.; Song, J. Review of renewable energy technologies utilized in the oil and gas industry. Int. J. Renew. Energy Res. 2017, 7, 592–598. [Google Scholar]
  29. Raos, S.; Ilak, P.; Rajšl, I.; Bilić, T.; Trullenque, G. Multiple-criteria decision-making for assessing the enhanced geothermal systems. Energies 2019, 12, 1597. [Google Scholar] [CrossRef] [Green Version]
  30. Chiasson, A.D. Geothermal Heat Pump and Heat Engine Systems: Theory and Practice; John Wiley & Sons: London, UK, 2016. [Google Scholar]
  31. Liu, X.; Falcone, G.; Alimonti, C.J.E. A systematic study of harnessing low-temperature geothermal energy from oil and gas reservoirs. Energy 2018, 142, 346–355. [Google Scholar] [CrossRef] [Green Version]
  32. Gosnold, W.; Mann, M.; Salehfar, H. Challenges in Implementing a Multi-Partnership Geothermal Power Plant; University of North Dakota: Grand Forks, ND, USA, 2017. [Google Scholar]
  33. Gosnold, W.; Crowell, A.; Nordeng, S.; Mann, M. Co-produced and low-temperature geothermal resources in the Williston Basin. GRC Trans. 2015, 39, 2015. [Google Scholar]
  34. Vraa, H.; Picklo, M.; Hertz, E.; Gosnold, W. Geothermal Energy Utilization of Multi-Well Oil Pads via the Application Of Organic Rankine Cycle Systems. Geotherm. Resour. Counc. Trans. 2019, 43, 1078–1084. [Google Scholar]
  35. Gosnold, W.; LeFever, R.; Klenner, R.; Mann, M. Geothermal Power form Coproduced Fluids in the Williston Basin. In Proceedings of the Geothermal Resources Council 2010 Annual Meeting, Sacramento, CA, USA, 24–27 October 2010. [Google Scholar]
  36. Gosnold, W.; Abudureyimu, S.; Tisiryapkina, I.; Wang, D.; Ballesteros, M. The Potential for Binary Geothermal Power in the Williston Basin. GRC Trans. 2019, 43, 114–126. [Google Scholar]
  37. Gosnold, W.; Mann, M.; Salehfar, H. The UND-CLR binary geothermal power plant. GRC Trans. 2017, 41, 1824–1834. [Google Scholar]
  38. Bennett, K.; Horne, R.N.; Li, K. Power Generation Potential from Coproduced Fluids in the Los Angeles Basin; Stanford University: Stanford, CA, USA, 2012. [Google Scholar]
  39. Singh, H.; Falcone, G.; Volle, A.; Guillon, L. Harnessing Geothermal Energy from Mature Onshore Oil Fields, The Wytch Farm Case Study. In Proceedings of the 42nd Workshop on Geothermal Reservoir Engineering, Stanford, CA, USA, 13–15 February 2017; pp. 13–15. [Google Scholar]
  40. Milliken, M. Geothermal Resources at Naval Petroleum Reserve-3 (NPR-3), Wyoming. In Proceedings of the Thirty-Second Workshop on Geothermal Reservoir Engineering, Stanford, CA, USA, 22–24 January 2007. [Google Scholar]
  41. Nordquist, J.; Johnson, L. Production of Power from the Co-Produced Water of Oil Wells, 3.5 Years of Operation. In Proceedings of the Geothermal Resources Council Transactions, Geothermal Resources Council 2012 Annual Meeting, 2012, Reno, NV, USA, 30 September–8 October 2012; pp. 207–210. [Google Scholar]
  42. Johnson, L.; Simon, D.L. Electrical Power from An Oil Production Waste Stream. In Proceedings of the Thirty-Forth Workshop on Geothermal Reservoir Engineering, Stanford, CA, USA, 9–11 February 2009. [Google Scholar]
  43. Reinhardt, T.; Johnson, L.A.; Popovich, N.; Poplar, N. Systems for Electrical Power from Coproduced and Low Temperature Geothermal Resources. In Proceedings of the 36th Workshop on Geothermal Reservoir Engineering, Stanford, CA, USA, 31 January–2 February 2011. [Google Scholar]
  44. Xin, S.; Liang, H.; Hu, B.; Li, K. A 400 kW geothermal power generator using co-produced fluids from Huabei oilfield. Geotherm. Resour. Counc. Trans. 2012, 36, 219–223. [Google Scholar]
  45. Li, T.; Liu, Q.; Xu, Y.; Dong, Z.; Meng, N.; Jia, Y.; Qin, H. Techno-economic performance of multi-generation energy system driven by associated mixture of oil and geothermal water for oilfield in high water cut. Geothermics 2021, 89, 101991. [Google Scholar] [CrossRef]
  46. Gutiérrez Pulido, H.; Vara Salazar, R.d.l. Análisis y Diseño de Experimentos; McGraw-Hill: New York, NY, USA, 2012. [Google Scholar]
  47. Akhmadullin, I. Utilization of Co-Produced Water from Oil Production: Energy Generation Case. In Proceedings of the SPE Health, Safety, Security, Environment, & Social Responsibility Conference-North America, New Orleans, LA, USA, 18–20 April 2017. [Google Scholar]
  48. Augustine, C.; Falkenstern, D.M. An Estimate of the Near-Term Electricity-Generation Potential of Coproduced Water From Active Oil and Gas Wells. SPE J. 2014, 19, 530–541. [Google Scholar] [CrossRef]
  49. Auld, A.; Hogg, S.; Berson, A.; Gluyas, J. Power production via North Sea hot brines. Energy 2014, 78, 674–684. [Google Scholar] [CrossRef] [Green Version]
  50. Banks, J.; Willems, C.J.; Cowper, A.; Nadkarni, K.; Poulette, S.; Van Allen, C. Geothermal Power Potential of the Virginia Hills Oil Field, Part of the Swan Hills Carbonate Complex; Alberta, Canada. In Proceedings of the World Geothermal Congress, Reykjavik, Iceland, 27 April 2020. [Google Scholar]
  51. Li, T.; Zhu, J.; Zhang, W. Cascade utilization of low temperature geothermal water in oilfield combined power generation, gathering heat tracing and oil recovery. Appl. Therm. Eng. 2012, 40, 27–35. [Google Scholar] [CrossRef]
  52. Yang, Y.; Huo, Y.; Xia, W.; Wang, X.; Zhao, P.; Dai, Y. Construction and preliminary test of a geothermal ORC system using geothermal resource from abandoned oil wells in the Huabei oilfield of China. Energy Econ. 2017, 140, 633–645. [Google Scholar] [CrossRef]
  53. Tester, J.; Anderson, B. Impact of Enhanced Geothermal Systems (egs) on the United States in the 21st Century. In The Future of Geothermal Energy; Massachusetts Institute of Technology: Cambridge, MA, USA, 2006. [Google Scholar]
  54. Pratt & Whitney Power Systems Organic Rankine Cycle Technology. Available online: https://www.prnewswire.com/news-releases/pratt--whitneys-waste-heat-to-power-organic-rankine-cycle-solutions-now-eligible-for-the-california-self-generation-incentive-program-133537828.html (accessed on 5 February 2020).
  55. Sanyal, S.K.; Butler, S.J. Geothermal Power Capacity from Petroleum Wells–Some Case Histories of Assessment. Proceedings of World Geothermal Congress, Bali, Indonesia, 2–30 April 2010; pp. 25–30. [Google Scholar]
  56. McKenna, J.; Blackwell, D.; Moyes, C.; Patterson, P.D. Geothermal electric power supply possible from Gulf Coast, midcontinent oil field waters. Oil 2005, 103, 34–40. [Google Scholar]
  57. Gosnold, W.D. Electric Power Generation from Low to Intermediate Temperature Resources; University of North Dakota: Grand Forks, ND, USA, 2015. [Google Scholar]
  58. Rahman, M.M.; Canter, C.; Kumar, A. Greenhouse gas emissions from recovery of various North American conventional crudes. Energy 2014, 74, 607–617. [Google Scholar] [CrossRef]
  59. Nassar, Y.F.; Salem, M.A.; Iessa, K.R.; AlShareef, I.M.; Ali, K.A.; Fakher, M.A. Estimation of CO 2 emission factor for the energy industry sector in Libya: A case study. Environ. Dev. Sustain. 2021, 23, 13998–14026. [Google Scholar] [CrossRef]
  60. Mesa, S.L.; Orjuela, J.M.; Ramírez, A.T.O.; Sandoval, J.-A. Review of the current state of wastewater management in the Colombian oil industry. Gestión Ambiente 2018, 21, 87. [Google Scholar] [CrossRef] [Green Version]
  61. Vélez, F.; Segovia, J.J.; Martín, M.C.; Antolín, G.; Chejne, F.; Quijano, A. A technical, economical and market review of organic Rankine cycles for the conversion of low-grade heat for power generation. Renew. Sustain. Energy Rev. 2012, 16, 4175–4189. [Google Scholar] [CrossRef]
  62. Zabek, D.; Penton, J.; Reay, D.J. Optimization of waste heat utilization in oil field development employing a transcritical Organic Rankine Cycle (ORC) for electricity generation. Appl. Therm. Eng. 2013, 59, 363–369. [Google Scholar] [CrossRef]
  63. Dickson, M.H.; Fanelli, M. Geothermal Energy: Utilization and Technology; Routledge: New York, NY, USA, 2013. [Google Scholar]
  64. Calm, J.M.; Hourahan, G.C. Physical, Safety, and Environmental Data for Current and Alternative Refrigerants. In Proceedings of the 23rd International Congress of Refrigeration (ICR2011), Prague, Czech Republic, 21–26 August 2011; pp. 21–26. [Google Scholar]
  65. Federation, W.E. Standard Methods for the Examination of Water and Wastewater; American Public Health Association: Washington, DC, USA, 2005. [Google Scholar]
  66. ISO 14044:2006; Environmental Management—Life Cycle Assessment—Requirements and Guidelines. ISO: Geneva, Switzerland, 2006.
  67. IPCC. IPCC Guidelines for National Greenhouse Gas Inventories: Reference Manual; Intergovernmental Panel on Climate Change (IPCC): Kanagawa, Japan, 1996. [Google Scholar]
  68. Hamburg, I. Umberto LCA+; ifu: Hamburg, Germany, 2017. [Google Scholar]
  69. Bejan, A. Fundamentals of exergy analysis, entropy generation minimization, and the generation of flow architecture. Int. J. Energy Res. 2002, 26, 545–565. [Google Scholar] [CrossRef]
  70. Chacartegui, R.; Sánchez, D.; Muñoz, J.; Sánchez, T. Alternative ORC bottoming cycles for combined cycle power plants. Appl. Energy 2009, 86, 2162–2170. [Google Scholar] [CrossRef]
  71. Feng, Y.; Hung, T.; Greg, K.; Zhang, Y.; Li, B.; Yang, J. Thermoeconomic comparison between pure and mixture working fluids of organic Rankine cycles (ORCs) for low temperature waste heat recovery. Energy Convers. Manag. 2015, 106, 859–872. [Google Scholar] [CrossRef]
  72. Alfaro, C.; Rueda-Gutiérrez, J.; Casallas, Y.; Rodríguez, G.; Malo, J. Approach to the geothermal potential of Colombia. Geothermics 2021, 96, 102169. [Google Scholar] [CrossRef]
  73. Bu, X.; Ma, W.; Li, H. Geothermal energy production utilizing abandoned oil and gas wells. Renew. Energy 2012, 41, 80–85. [Google Scholar] [CrossRef]
  74. Barbier, E. Geothermal energy technology and current status: An overview. Renew. Sustain. Energy Rev. 2002, 6, 3–65. [Google Scholar] [CrossRef]
  75. Daneshipour, M.; Rafee, R. Nanofluids as the circuit fluids of the geothermal borehole heat exchangers. Int. Commun. Heat Mass Transf. 2017, 81, 34–41. [Google Scholar] [CrossRef]
  76. Junrong, L.; Rongqiang, L.; Zhixue, S. Exploitation and utilization technology of geothermal resources in oil fields. In Proceedings of the World Geothermal Congress 2015, Melbourne, Australia, 19–24 April 2015. [Google Scholar]
Figure 1. Schematic of an oilfield application of an ORC power generation unit. Image from Parex Resources Archives. Water flow (blue arrows), heat flux (orange arrows), phase change of the working fluid in the turbine and evaporator (light green lines), fluids produced from wells (gray arrows).
Processes 10 00568 g001
Figure 2. The geographic location in Colombia of the two subject oil fields in this study, OFA and OFB. The colors indicate the division of Colombia 32 departments.
Processes 10 00568 g002
Figure 3. The relationship between the magnitude of the produced water flow and produced water temperatures for (a) OFA and (b) OFB. The blue circles indicate the measurements made in different wells for oilfield A. The yellow circles indicate the measurements made in different wells for oilfield B.
Processes 10 00568 g003
Figure 4. Energy and exergy potential of the subject oil fields.
Processes 10 00568 g004
Figure 5. An oilfield ORC system: (a) internal view; (b) external view with condenser positioned on top.
Processes 10 00568 g005
Figure 6. 24 h production of the ORC system in one of the subject oil fields.
Processes 10 00568 g006
Figure 7. Energy production from non-renewable resources (gas, diesel) for both the OFA and OFB fields.
Processes 10 00568 g007
Figure 8. Energy production from the geothermal energy co-generation systems for both the OFA and OFB fields.
Processes 10 00568 g008
Figure 9. tCO2eq/kWh for the scenarios considered in OFA and OFB.
Processes 10 00568 g009
Figure 10. Reduction in tCO2eq/kWh for the scenarios considered for OFA and OFB.
Processes 10 00568 g010
Table 1. Physicochemical properties of the produced waters of OFA and OFB.
ParameterOFAOFB
Total alkalinity (mg CaCO3 L−1)335.0 ± 3.8271.5 ± 3.1
Chlorides (mg Cl L−1)7624.8 ± 38.13941.9 ± 19.7
Conductivity (uS cm−1)21,600.0 ± 130.010,760.0 ± 65.0
pH7.2 ± 0.27.6 ± 0.2
Total dissolved solids (mg TDS L−1)16,686.7 ± 83.47710.7 ± 46.3
Table 2. Properties of the produced waters for the calculation of energy potential.
Oil FieldEnthalpy (kJ kg−1)Entropy (kJ kg−1 K−1)
OFA420.011.3087
OFB368.891.1694
Table 3. Monitoring parameters of the energy production in the ORC system.
TimeWater Flow
(kg s−1)
Thermal Power (kWt) η r e a l η e x e
5:4435.818034%22%
9:0230.715484%20%
10:0030.715483%20%
11:0030.715483%20%
12:0030.715483%18%
13:0235.117673%17%
14:0035.117673%18%
15:0035.117673%18%
16:0035.117673%19%
17:0035.117673%20%
18:0032.916624%26%
19:0026.413325%24%
20:0031.816034%25%
21:0030.515375%24%
22:0031.615945%25%
23:0031.415815%24%
0:0032.716495%26%
1:0029.714965%26%
2:0030.015115%26%
3:0031.315755%25%
4:0031.415845%31%
5:0026.213216%22%
Table 4. Input sources for energy production from non-renewable resources.
Stream234Energy Production *
Oil FieldVolumetricEnergyVolumetricEnergyVolumetricEnergyEnergy
(m3)(MJ)(m3)(MJ)(m3)(MJ)(MJ)
OFA96,3193,926,929385,27615,707,7160.75276104,924,800
OFB55,8212,275,814223,2839,103,2573.25119,2353,132,000
Note: * Monthly energy production average. Calorific power: diesel (36,648 MJ L−1), natural gas (40.44 MJ m−3). Stream 3 shown in Figure 7 assumed that the environmental load from gas treatment is assumed by the service provider. Stream 1 shown in Figure 7 was not considered, as it is outside of the scope of these calculations.
Table 5. Input sources for the geothermal energy co-production system.
Stream234567Energy
Production *
VolumetricEnergyVolumetricEnergyVolumetricEnergyVolumetricVolumetricEnergyEnergy
Oil Field(m3)(MJ)(m3)(MJ)(m3)(MJ)(m3)(m3)(MJ)(MJ)
OFA69,2692,824,112385,27615,707,7160.7527,610194,400194,40094,9704,924,800
OFB22,636922,874223,2839,103,2573.25119,235194,400194,40094,9703,132,000
Note: * Monthly energy production average. Calorific power: diesel (36,648 MJ L−1), natural gas (40.44 MJ m−3). Stream 3 shown in Figure 7 assumed that the environmental load from gas for treatment is assumed by the service provider. Stream 1 shown in Figure 7 was not considered, as it is outside of the scope for these calculations.
Table 6. Tons of CO2 equivalent per kWh generated for the raw material inputs and energy generation phases.
Oil FieldEnergy Production from Non-Renewable Resources
(Tons CO2eq/kWh)
Geothermal Energy
Co-Generation System (Tons CO2eq/kWh)
Percentage
Reduction in
Carbon Footprint (%)
OFA26021219
OFB18516511
Table 7. Contribution analysis of non-renewable resources expressed as a percentage of the overall carbon footprint produced in an exclusively non-renewable resource system.
Non-Renewable ResourceOFAOFB
Diesel0.95%6.64%
Field gas90.14%80.15%
Purchased gas consumption8.91%13.21%
Table 8. Contribution analysis of non-renewable resources expressed as a percentage of the overall carbon footprint produced in a geothermal energy co-generation system.
Non-Renewable ResourceOFAOFB
Diesel1.16%11.09%
Field gas87.25%63.21%
Water Pumping *11.59%25.7%
* Energy required to pump the geothermal fluid to the ORC system. It is accounted for because it is part of the power generation system.
Table 9. Variation in the consumption of non-renewable resources on the carbon footprint in the geothermal energy co-generation system.
Scenarios EvaluatedPurchased GasField Gas
(m3)(MJ)(m3)(MJ)
Scenario 1OFA385,95915,608,18569,26928,241,113
OFB226,2329,148,80822,636922,874
Scenario 2OFA385,27615,580,57569,9472,851,722
OFB223,2839,029,57325,5611,042,109
Scenario 3OFA455,79418,432,29800
OFB249,05210,071,68200
Scenario 4OFA00452,10418,432,298
OFB00247,03710,071,682
Publisher’s Note: MDPI stays neutral with regard to jurisdictional claims in published maps and institutional affiliations.

