Abstract
Two once-through steam generators and a combination of a steam generator and a gas preheater for supplying feed gases to solid-oxide electrolysis stacks were evaluated for their carryover characteristics of contaminants from the feed-water into the steam phase. The concentrations of various trace impurities in the steam were determined by sampling the steam condensates and screening them with inductively coupled plasma–mass spectrometry for 19 elements and liquid ion chromatography and continuous flow analysis for chloride and ammonium. Steam-soluble species such as boric acid undergo complete volatilization and transfer into the steam phase. During unstable evaporation in the steam generators an extensive physical carryover of alloying metal species was observed. At realistic operation conditions for steam electrolysis, the gas preheater caused a considerable release of silicon into the steam phase. Two stack experiments were performed with common preheater temperatures and showed largely increased cell voltage degradation at higher operation temperatures. The post-test chemical analysis of cell samples revealed significant concentrations of silicon in the samples that are regarded as primary cause for increased degradation. These findings could partially explain the wide spread of degradation rates reported for solid-oxide steam electrolysis experiments.
1. Introduction
Solid-oxide electrolysis provides a promising approach for converting electrical work into chemical substances, because the technique is versatile as well as efficient. Recently, a 10/40 kW class reversible solid oxide cell system was demonstrated experimentally to achieve an electrical efficiency of 70% (LHV, DC) in electrolysis mode and further improvements can be expected [1]. Simultaneous co-electrolysis of steam and carbon dioxide enables the production of synthesis gas with a variety of compositions [2,3] and carbon dioxide electrolysis provides clean onsite carbon monoxide with high purity [4]. Both approaches can serve as the first step to utilize carbon dioxide to produce valuable chemicals and synthetic fuels [5,6]. Transient operation in steam electrolysis was demonstrated without increased degradation [7,8] and a system-supporting operation of an SOC stack in co-electrolysis mode has been shown as well, without additional degradation [9]. Overall, the development of solid-oxide cells, stacks, and systems made heavy progress in recent years, enabling hugely increased current and power densities and much improved durabilities that now reach less than 0.5% per 1000 h [10].
Nonetheless, there is still much demand for improving durabilities and identifying causes for degradation. Besides various known intrinsic mechanisms, the introduction of harmful impurities into the solid-oxide cells represents an important group of causes why cells and stacks lose performance and fail early. Most work has been conducted on fuel-cell mode and concentrated on impurities in the fuel produced by the gasification of coal, fossil fuels, and biomass, e.g., phosphor, chlorine, and sulfur species, and arsenic and other heavy metals [11,12]. Dedicated investigations of the impact on electrolysis mode are much rarer and although solid-oxide cells for fuel-cell and electrolysis modes are usually identical in construction, impurities can behave differently [13]. Besides investigations on impurities in fuel, a number of studies identify impurities in post-test examinations of cells. However, often it is not clear what their exact origin is and potential sources include the test infrastructure, sealing materials, construction materials of cells or stacks, and the fuel and air supplied to the cells. In this work we will concentrate on impurities within the steam entering the cells and possible sources of these impurities.
Silicon dioxide deposits were found in cells during post-test investigations in both electrodes. As non-conductive material it can coat triple-phase-boundary sites or disrupt the conductivity within the Ni/YSZ or Ni/CGO cermet structure. Sasaki et al. evaluated the effect of polysiloxanes in fuel gas during fuel-cell mode because of their high concentrations in biogases and found a severe impact, although the added concentrations were extremely high (10 ppm) [14]. The sealing materials of stacks [13,15] or the system (tubes, valves) [16] were commonly discussed as potential source of these deposits. In the past, we found highly varying silicon concentrations in cells during post-test analysis and concluded that the sealing materials may be a potential source, but were likely not the only one.
Our search of potential silicon sources focused on the feed-water and on the gas preheaters. Gas preheaters may contain quartz insulation which may react with a hydrogen-steam atmosphere at high temperatures to form volatile silicic acid (). The feed-water for the steam generators is usually produced by purifying tap water with mixed-bed ion-exchangers. Tap water in Germany may contain up to 40 dissolved silicates and because of the very weak interaction of the anion with these ion-exchangers, they are difficult to remove. They are also among the first species to break through the ion-exchanger even below its nominal exchange capacity. To make matters worse, they do not increase the conductivity of purified water much and therefore the breakthrough of several hundreds of easily happens without a strict monitoring and maintenance regime. In fact, we temporarily determined silicon concentrations of 170 to 350 in the institute’s purified water.
Steam generators exhibit an effect called carryover which describes the transfer of dissolved species or suspended particles from the liquid phase into the steam phase. Most common is the entrainment of droplets of feed-water by which impurities can be introduced into the steam. This effect is known as the mechanical carryover. In contrast, the vaporous carryover is determined by a substance’s physical volatility, either by its vapour pressure or by its solubility in steam. At high temperatures and pressures, many salts exhibit a significant vaporous carryover, but at low pressures the total carryover is usually by far dominated by the mechanical carryover. However, there are a few notable exceptions which exhibit substantial vaporous carryover even at relatively low pressures and cause notorious problems; among them are silica, copper oxides and hydroxides, aluminum compounds, and boric acid [17]. There are many factors that determine the amount of mechanical carryover, e.g., the design of the boiler, the surface tension of the liquid, and the system pressure [18,19]. Without entering into detail, there are several factors that likely increase the mechanical carryover in typical SOC applications:
- The common once-through design misses a steam separator which increases the humidity of the steam and thus the mechanical carryover.
- Low pressures promote foaming and increase bubble sizes.
- Often a small surface area of the liquid phase in the small column.
- The accumulation of deposits in the steam generator because of the once-through design.
- Finding the right combination of temperature and feed-water flow to ensure stable evaporation is difficult in electrical once-through boilers.
- No systematic and reliable detection of unstable evaporation.
Furthermore, load transients and temperature changes can lead to temporary unstable evaporation which causes excessive mechanical carryover, which may especially be a problem during startup and shutdown.
In addition to silicon, we were interested in the carryover of boron and aluminum. Both elements were repeatedly found in post-test analysis of cell samples. According to Sasaki et al., boron accelerates grain growth in nickel electrodes [20], and Chen et al. reported the reaction of boron species with YSZ to form YBO3 [21]. Similar to , the anion is only weakly bound in mixed-bed ion-exchangers and poses a similar problem. It also shows a very high steam solubility which causes a very high vaporous carryover into the steam phase. As far as we know, there is little known about poisoning of SOCs by aluminum. However, besides its presence in our samples, Hauch et al. also identified aluminosilicates in degraded cells [15,22]. Al(OH)3 present in steam may form these silicates with silic acid. We temporarily determined boron concentrations up to 60 and aluminum concentrations up to 10 in the institute’s purified water.
For these reasons we thought it is plausible that impurities from the feed-water can be transferred to the SOC stack and cause increased degradation. In this work we performed experiments to estimate the extent of the carryover. In addition, we evaluated the release of silicon and boron from a commercial gas preheater and the impact this likely has on the stack performance in steam electrolysis mode.
2. Experimental Procedure
2.1. Steam Generators
We mainly employed three different once-through, electrically-heated steam generators (SG) of two designs in this study:
- RS
- was a self-built steam generator with an annular gap of mm between a heated cylindrical centerbody and an outer tube (both made of 1.4571). The water was introduced into this gap and evaporated in it. The inner body was heated with a heating cartridge (1.4571) with a diameter of mm and a heated length of 160 mm with a power of 400 W. This design has only one stage, and the upper parts served to superheat the steam. The steam generator was originally designed for steam temperatures up to 550 °C, but was tested up to 700 °C at the end of the experiments.
- VS1
- was a commercially available steam generator model (aSTEAM DV-2) from aDROP Feuchtemeßtechnik GmbH (Fürth, Germany) which employs a porous, sintered body in which evaporation takes place. The steam is then superheated in a second stage up to 250 . Water and steam were in contact with the stainless steels 316Ti (1.4571) and 316L (1.4404). This instrument was new (as-received from the manufacturer) when the experiments with it started.
- VS2
- was the same model as VS1. However, this instrument was already in use for several thousand hours of stack operation before we began this study.
For the investigation of the behavior of a fuel gas preheater and the stack experiments, a fourth SG was employed as part of a commercially built test rig (see Section 2.4 and Section 2.6).
2.2. Chemicals
Purified water with a resistivity of 10 cm was used as clean feed-water and for preparing spiked feed-waters. A commercial silica standard ( 1000 , NIST traceable) was obtained from Hach (Düsseldorf, Germany) and used as stock solution for creating feed-water with silicon contamination by dilution with purified water. Aluminum nitrate nonahydrate (99+% p.a., Acros/VWR, Darmstadt, Germany), orthoboric acid (99.8–100.5%, VWR, Darmstadt, Germany), and ammonium chloride (ACS/Reag.Ph.Eur., VWR, Darmstadt, Germany) were used to prepare stock solutions. These were then also diluted with purified water for the individual measurement runs. Samples of the spiked feed-water solutions were analyzed in the same way as the condensate samples to determine their exact concentrations. Oxalic acid was used in some cases to adjust the pH value of spiked feed-water. Oxalic acid was chosen because it disproportionates into CO, CO2, and H2O at temperatures of >150 °C. Therefore, it does not deposit in the steam generators and does not introduce additional impurities.
2.3. Condensates Sampling
The steam generated by the steam generators was introduced by a short length of stainless steel tubing (1.4571) into a high-capacity laboratory condenser. The condenser was built according to DIN 12593 from borosilicate glass 3.3 and employed a cylindrical outer cooling jacket and an inner, cooled, spiral coil. Between the coil and the outer jacket is the vapor–condensate path. The cooled length was 400 mm and the estimated surface area for heat transfer was according to manufacturer information (Pfaudler Normag Systems GmbH, Jena, Germany). Tap water was used for cooling. The condenser was operated in an upright position and steam was introduced from the bottom. The condensates dropped downwards into a borosilicate glass tube. At the lowest end of this tube a ball valve made of PTFE was used to extract samples from the tube. After changes in the operation conditions of the steam generator, this tube was emptied and flushed with fresh condensate. This approach did not retain volatile species with a boiling temperature below the temperature of the tap water, but we were mainly interested in various steam-soluble species, which were expected to condense with the steam itself.
2.4. Fuel Gas Preheater
To investigate the fuel gas preheater as a potential source of impurities, we performed experiments with a commercial solid-oxide cell test rig manufactured by EBZ (type FCTR-S-FZJ-S-AEG-80/80-600/680-7.2/20.0-L/PS-01, EBZ GmbH, Dresden, Germany), which employed an electrical direct, once-through steam generator (model EE-DR-4.5-2x230-6x1.1-02, EBZ GmbH, Dresden, Germany) and electrical fuel gas preheater (model GH-IC250-1x400-1x6.0-01, EBZ GmbH, Dresden, Germany). For this experiment, the fuel gas preheater was operated at temperatures from 190 to 800 and a mixture of steam and argon was passed through it. The temperature of the steam generator was fixed to 300 during the experiment. The sampling was performed as described above, but the setup included a longer section of stainless steel tube to divert the gas stream from the test rig into the condenser, which also reduced the temperatures of the steam. We ensured, however, sufficiently high steam temperatures to prevent any condensation in the steel tube.
2.5. Stack and Cell Design
We employed two 10-layer stacks of the Jülich F20 design [23] in this study. This design contains four ASCs (anode-supported cell in fuel cell mode) per layer in a window frame, yielding a total active area of 320 cm2. Further information of the cell architecture with the layer sequence and their respective thicknesses are given in Table 1, which also includes the contact layers and the protective coatings of the interconnects (IC), as well as their thicknesses. The cells were produced by CeramTec. A cerium-doped gadolinium oxide (CGO) barrier layer was applied by screen-printing. The protective coating at the interconnects was prepared by means of atmospheric plasma spraying. For the electrical contact between the interconnect and cell substrate, nickel meshes were utilized. The sealing inside the stack was achieved by glass-ceramic on all bonding surfaces. Detailed descriptions of the cell and stack design and assembly can be found in [23,24,25,26,27]. Joining of the stack was performed for 100 h at 850 in the furnace with a load of 6 kN. The reduction of the substrate and fuel electrode was performed at 800 in an mixture with stepwise increasing hydrogen concentrations between 9% and 62% . Prior to the experiment described in this work, the two stacks were operated simultaneously as a reversible SOC system in both fuel cell and steam electrolysis modes.

Table 1.
Cell and stack components of a repeating unit.
2.6. Stack Operation
The two SOE stacks were operated in a commercial SOFC/SOEC test rig manufactured by EBZ (type FCTR-S-FZJ-S-AEG-80/80-600/680-7.2/20.0-L/PS-01, EBZ GmbH, Dresden, Germany), which employed an electrical direct steam generator (model EE-DR-4.5-2x230-6x1.1-02, EBZ GmbH, Dresden, Germany) and electrical fuel gas preheater (model GH-IC250-1x400-1x6.0-01, EBZ GmbH, Dresden, Germany). Flat mica gaskets were employed as seal between the stacks and the test rig, and the assembly of stack, mica gaskets, and test rig interface was compressed with 6 kN. Both stacks were operated in steam electrolysis mode in a mixture of 90% steam and 10% hydrogen (technical grade) at an oven temperature of 800 in galvanostatic mode. Steam and air were fed in a counter-flow scheme. Stack A was operated with a current density of / and a conversion ratio of 0.75 (75%) during the electrolysis experiment. At stack B, a current density of / and a conversion ratio of 0.56 (56%) was maintained during the electrolysis experiment. The steam generator was supplied with purified water with a resistivity of 10 and operated at 300 . The operation temperature of the air preheater was fixed to 800 and air flow maintained at 50 . The temperature of the fuel preheater alternated between 630 and 800 . Lower temperatures than 630 were not achievable in the test rig at the time of the experiment for safety reasons. All volumetric flows are given at standard conditions ( = 1.01325 bar and = K).
2.7. Chemical Analysis of Condensates and Feed-Water Samples
For the determination of (semi-)metals, chloride, and ammonium in the sampled condensates, three different methods were employed.
The determination of total elemental concentrations was performed by inductively coupled plasma mass spectrometry (ICP-MS) using an Agilent 7900 quadrupole instrument in He collision cell mode (Agilent Technologies, Waldbronn, Germany). Three replicate aliquots of each sample were acidified with 1% nitric acid and analyzed without further dilution. In case of some samples with higher concentrations (e.g., the feed-water samples), 10-fold to 50-fold dilution was required. Initially, an intensity screening was made over the whole mass range. The elements Al, As, B, Ba, Bi, Cd, Cr, Cu, Fe, K, Mn, Mo, Na, Ni, Pb, Sb, Si, W, and Zn significantly exceeded the blank levels of an ultra-pure water sample (blank mean + 10 times standard deviation) and were determined quantitatively using external calibration with Rh as the internal standard.
For the determination of chloride, ion exchange chromatography was employed using an ICS-3000 with a Dionex IonPac AS14 A column (Thermo Fisher, Dreieich, Germany). The eluent for the isocratic separation contained 1 NaHCO3 and 8 Na2CO3. For each sample, two replicate aliquots were analyzed. The relative standard deviation ranged from 0.3% to 17%.
For the determination of ammonium, a continuous flow analysis (CFA) was performed using a CFA analyzer from Alliance Instruments (Salzburg, Austria). For each sample, two replicate aliquots were analyzed. For concentrations of 0.5 to 1 , the relative standard deviation was 5%, and for ranges 1 to 3 , the relative standard deviation was 2%.
2.8. Chemical Analysis of Cell Samples
After stack operation, the stacks were disassembled. Selected cell samples were taken near the feed gas entrance and near the gas exit from several layers (stack A: layers 4, 5, and 10; stack B: layers 1, 2, and 9). The samples were roughly 1 in size.
First, a perchlorate digestion was performed. Each cell sample was heated two times with 3 mL HClO4 acid for 2 each until fuming. The obtained leachates were combined and made up to 50 with ultrapure water (R > ). Two replicate dilutions (20-fold and 400-fold) of each leachate were performed and analyzed by inductively coupled plasma optical emission spectrometry (ICP-OES) using an iCAP 7600 (Thermo Fisher Scientific, Dreieich, Germany). The standard deviations refer to the duplicate dilutions and triplicate ICP-OES scanning, excluding other sample preparation steps. The solutions were qualitatively screened for 29 elements (Al, As, B, Ba, Ca, Ce, Co, Cr, Cu, Fe, Gd, Hf, K, La, Li, Mg, Mn, Mo, Na, Ni, P, S, Si, Sr, Ti, V, Y, Zn, and Zr). Afterwards, all quantifiable elements were determined quantitatively using matrix-matched external calibration.
The solid remains of the samples from the perchlorate leaching described above were then subjected to a subsequent digestion with lithium borate. The solids were mixed with lithium borate and heated to 1000 for 8 in a muffle furnace. After cooling, the melts were dissolved in 30 diluted HCl (5%) and made up to 50 with ultrapure water. Unfortunately, in some cases, a small amount of white residue was left after the lithium borate digestion. Mostly likely, this was zirconium oxide that was not sufficiently digested. The obtained digests were analyzed in the same way as described above for the perchloric acid leachates with the exception that Li and B could not be analyzed due to the digestion reagent used.
3. Results and Discussion
3.1. Feed-Water Concentrations
During stack operation, the steam generators were fed with purified water from the institute’s central distribution having a resistivity of 10 (corresponding to a conductivity of ). This water was also directly used for determining the background levels of contamination in steam condensates.
In addition to that, specific series of measurements were performed using the same water with deliberately added contaminants (spiked feed-water). We initially chose ammonium chloride as a model substance with a very high chemical carryover from water to steam and as a potential source of deliberate chloride poisoning of cells. Boron and silicon were selected because they can quite easily break through mixed-bed ion-exchangers, are known to exhibit a significant steam solubility, and are expected to increase cell degradation. Sodium served as a model species for an almost exclusive physical carryover and is, anyway, contained in the silica standard solutions. Aluminum was expected to exhibit a certain steam solubility and was showing up in post-test examinations of cells in the past.
The feed-water for each series was analyzed to determine the real concentrations of contaminants introduced to the steam generator during the measurements in the respective series. The results of these measurements concerning the relevant (i.e., added) species are given in Table 2. Results from three samples of clean feed-water during the time of experiments are shown in Table 3. A complete table of all species in the feed-waters that were also determined in the condensates can be found in Appendix A.2 (Table A1) for overall comparison.
Table 2.
Measured concentrations in of spiked feed-water samples.
Table 3.
Measured concentrations in of clean feed-water samples.
3.2. Physical Carryover: Sodium
Sodium ions have a negligible steam solubility and are transferred nearly exclusively by the effect of mechanical carryover, as described in the introduction. Manufacturers of steam generators use it to establish the amount of mechanical carryover of their products. We started with the same approach and looked at the concentrations of sodium in condensates for establishing a baseline of mechanical carryover at different temperatures.
Figure 1a shows the concentrations of sodium found in the condensates of the annular-gap steam generator (AG-SG) when supplied with clean feed-water in a temperature range of 150 to 680 . Two important observations can be made from this. The measured concentrations of Na do not exhibit a significant dependence on the temperature and are usually about 20 L−1 or less. The concentrations of Na in the condensates can be expected as the sum of mechanical carryover and releases from the piping and the borosilicate glass of the condenser. Our samples of clean feed-water showed concentrations between 4.6 to 8.5 L−1. However, we expect that during stable operation, some of that does not carry over into the steam phase, thus enriching the liquid phase in the steam generator and also forming deposits over time.
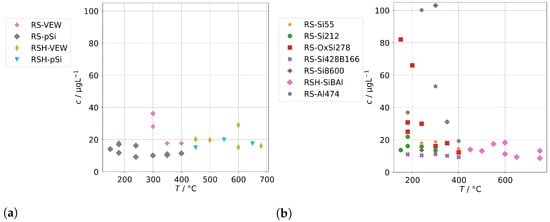
Figure 1.
Sodium concentrations in condensates in dependence of operation temperature for the AG-SG: (a) Background levels for clean feed-waters; (b) Concentrations for spiked feed-water solutions containing sodium.
Figure 1b, in comparison, shows the sodium concentrations of condensate samples obtained with feed-water that was spiked with sodium (for concentrations in feed-water see Table 2). It can be observed that these exhibit significantly increased levels of contamination, particularly up to 300 , and it seems a stable minimum is achieved by 400 . We conclude that concentrations around 20 L−1 or below signify a stable operation with a minimum of mechanical carryover. We assume that statistical events of unstable evaporation and increased mechanical carryover are the reason for the three samples with elevated concentrations shown in Figure 1a, given the possible enrichment in the liquid phase. Due to the partially low concentrations of Na in this experiment and of further determined elements in the following experiments near the limit of detection, the uncertainty of the quantification also needs to be taken into account, especially at background levels. The standard deviations from replicate measurements of the samples were not included in the graphs for easier readability. For additional illustration of the temperature dependence we exhibit Figure A1a in Appendix A.1, which shows all samples with clean and spiked feed-water in one graph.
For the two commercial sintered-body steam generators (SB-SG), a similar evaluation can be seen in Figure 2a,b. The background level seems to be again about 20 L−1. Using spiked feed-water, increased concentrations were observed, especially at the temperatures below 250 , which is also the maximum operating temperature of the model. Again, we point out the statistical nature of events of unstable evaporation which we regard as reason for a significant scatter of the measured concentrations at lower temperatures. For additional illustration of the temperature dependence, we exhibit Figure A1b in Appendix A.1, which shows all samples with clean and spiked feed-water in one graph.
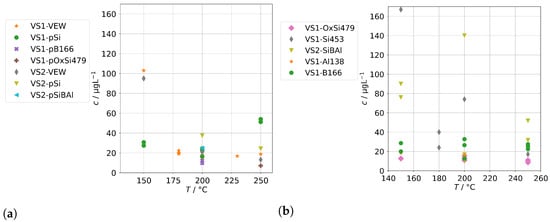
Figure 2.
Sodium concentrations in condensates in dependence of operation temperature for the two SB-SG: (a) Background levels for clean feed-waters; (b) Concentrations for spiked feed-water solutions containing sodium.
We also note that in the case of experiment runs with spiked feed-water, the condensates always contain much less sodium as the feed-waters. This is not surprising and has the consequence that sodium will accumulate over time in the steam generator. This can also be expected for clean feed-waters, which in turn has consequences for the long-term operation for several thousand hours in real stack experiments.
3.3. Model Substance: Ammonium Chloride
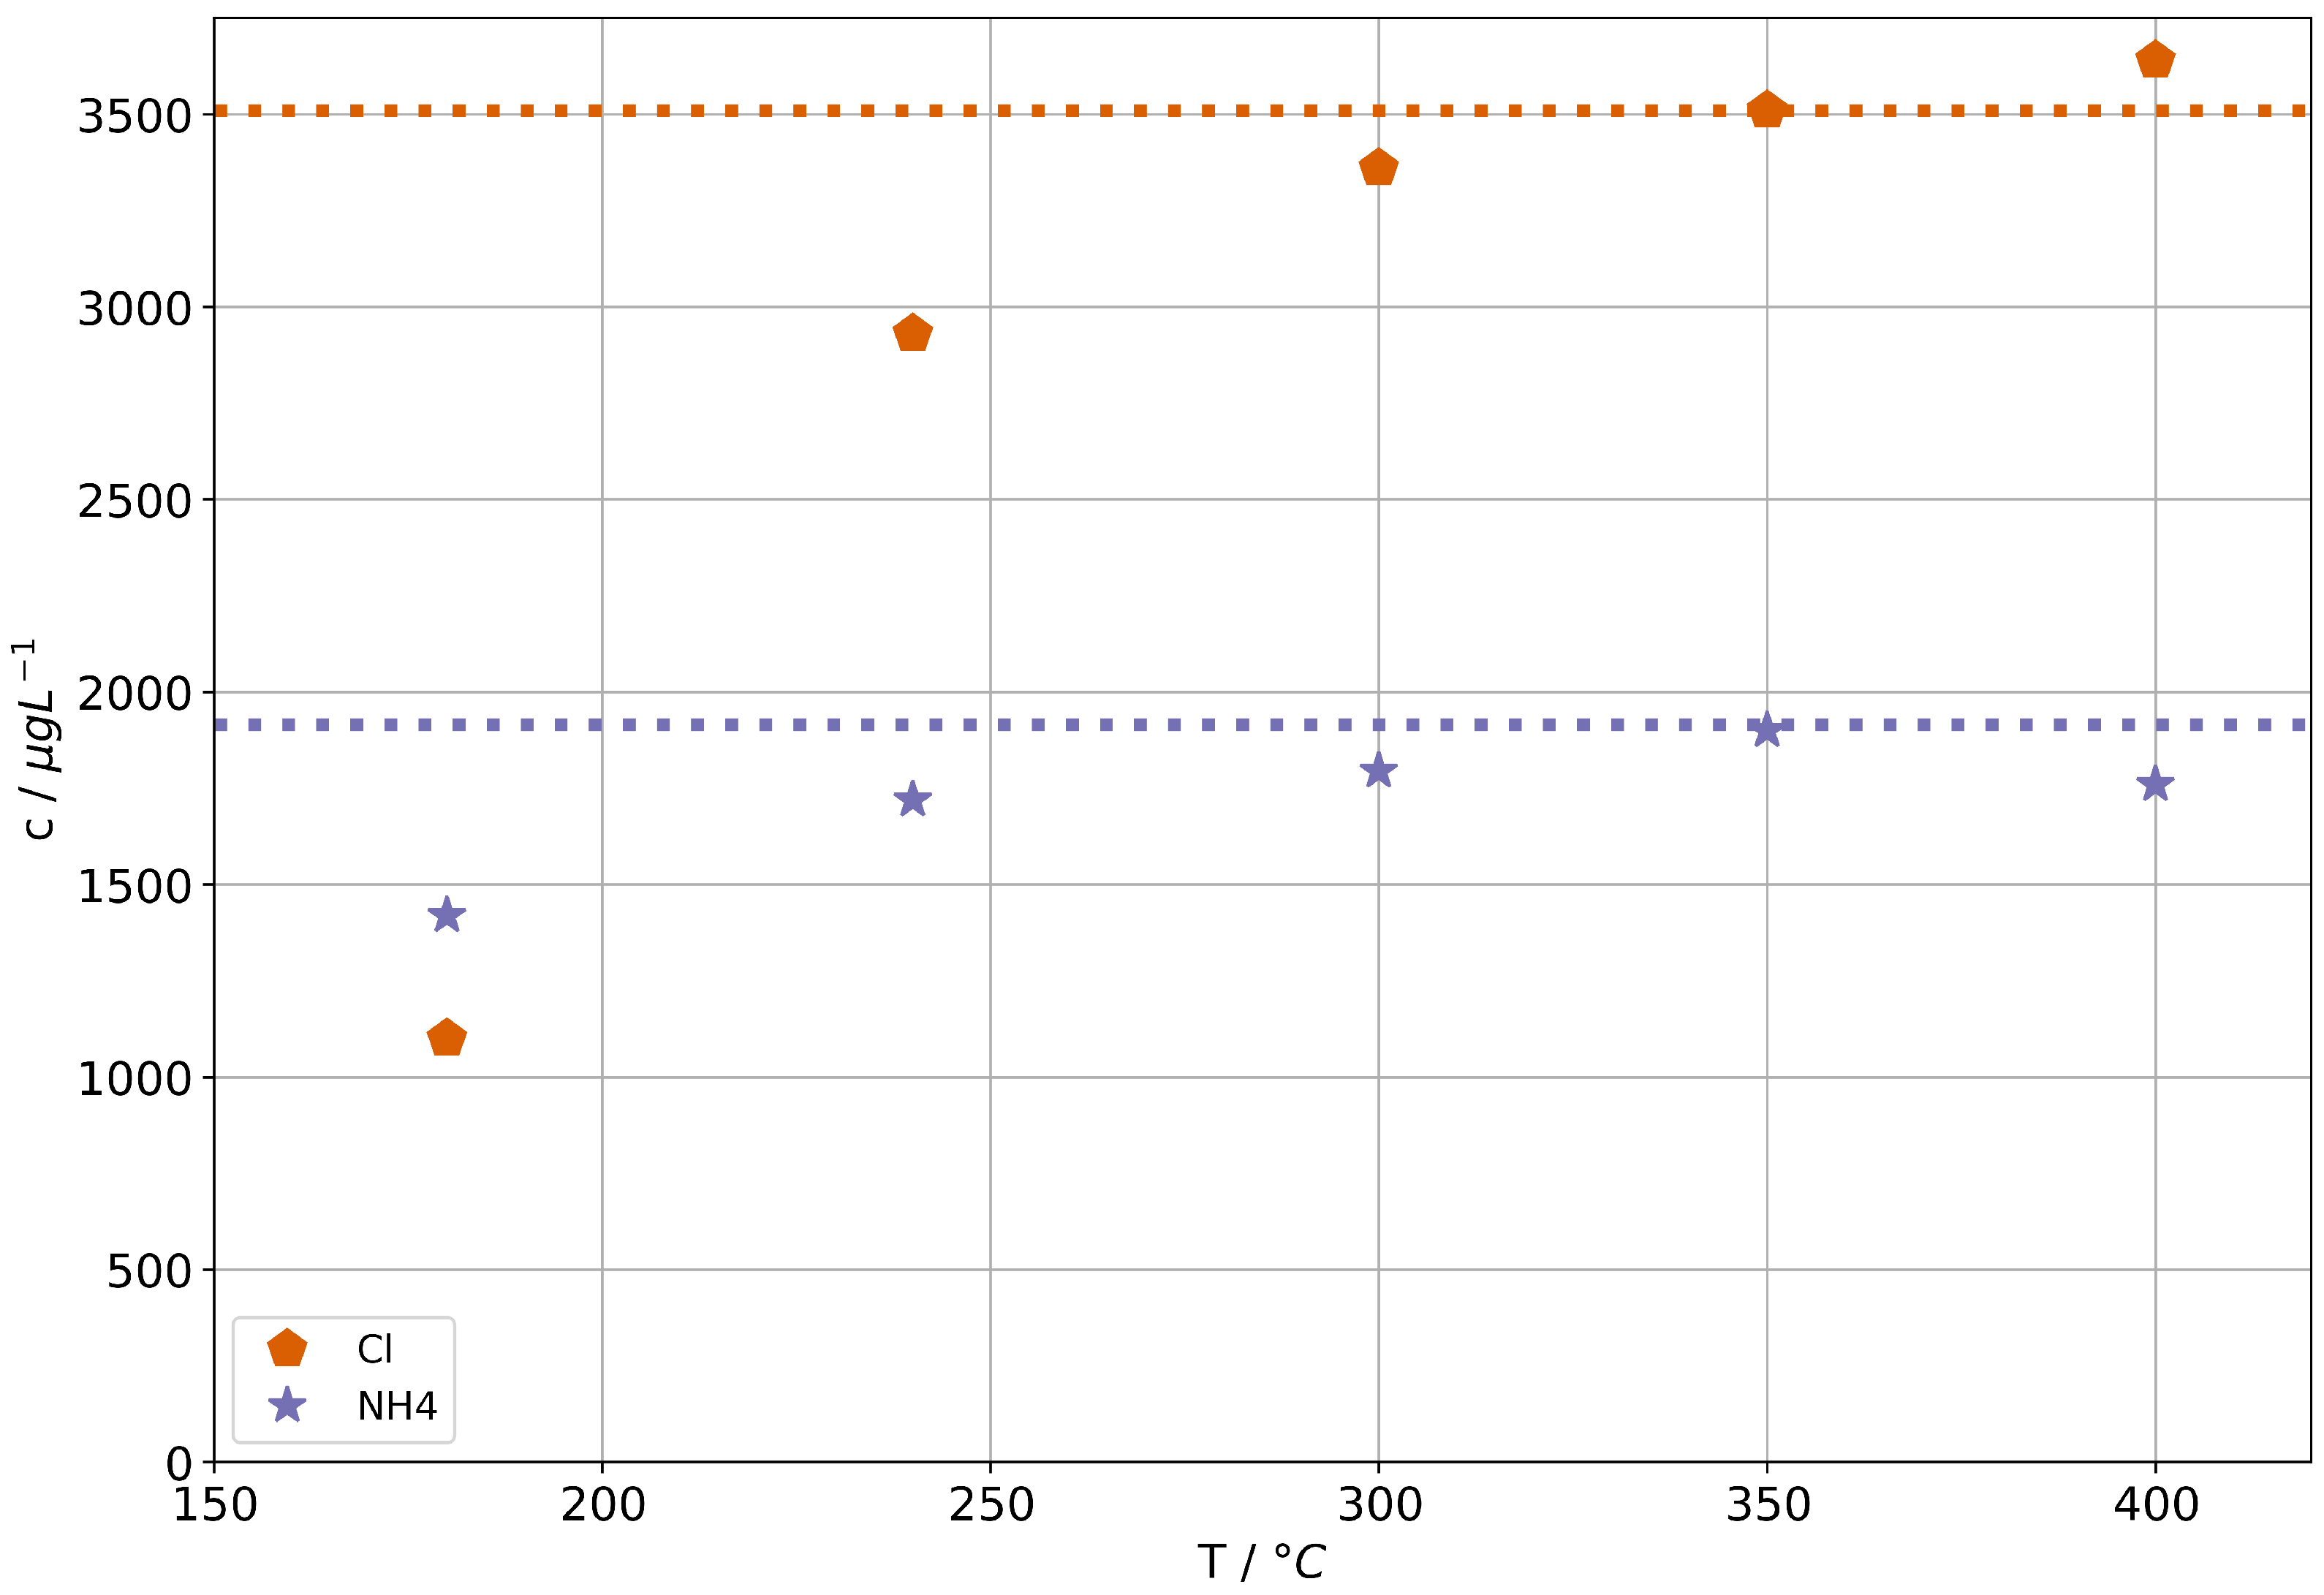
Ammonium chloride has a significant volatility of at 300 and is readily transported into the steam phase at higher temperatures [28]. This is well known in conventional power plants and steam processes, because it then can dissociate into and HCl which in turn can cause severe corrosion issues in SOC systems. In addition, a role of chlorine in SOC degradation is suspected due to the formation of volatile Ni(Cl)2. Sasaki et al. observed increased degradation in the presence of chlorine [20]. We therefore chose ammonium chloride as model for a potentially harmful substance that will transfer into the steam phase due to its high vaporous volatility (vs. the mechanical carryover discussed above).
Figure 3 shows the concentrations of and Cl in steam condensates of the AG-SG. The corresponding concentrations in the feed-water are indicated by the dashed lines. It can be seen that at suitable operation temperatures a complete volatilization of any ammonium chloride in feed-water has to be assumed.
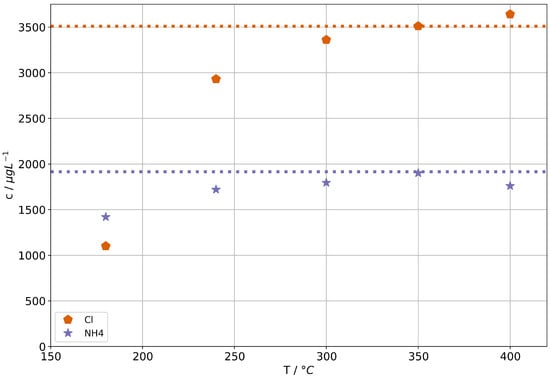
Figure 3.
Ammonium and chloride concentrations in condensates for the AG-SG. Dashed lines indicate the concentrations in the feed-water solutions.
3.4. Background Concentrations
Before assessing the introduction of contaminants in steam by the feed-water, we need to establish the background for operation with clean feed-water. This is especially important since the materials used in the steam generators, the piping, and the condenser are a potential source of contaminations as well. Specifically, the glassware might be a cause for concern. On the other hand, the borosilicate glass 3.3 in use here has an excellent durability against acidic, neutral, and alkaline environments and has the highest class of hydrolytic resistance according to ISO 720:2020, ISO 1776:1985, and DIN 12116:2001-03. Another obvious material choice besides laboratory glass for condensing the steam would be a steel, but steels do release ions from the alloy components into the condensate samples, especially from the group A (see below). It has to be kept in mind that a material was needed that can withstand high steam temperatures, had an acceptable heat conduction to remove the heat of condensation, and was available for construction.
We divided the contaminants into two groups:
- Group A
- mainly contains typical alloying metals Co, Cr, Cu, Fe, Mn, Mo, Ni, W, and Zn plus the pnictogens As, Bi, and Sb. None of these elements were specifically introduced into spiked feed-water.
- Group B
- contains the alkali and alkaline earth metals Na, K, Mg, Ca, and Ba plus the metalloids B, Al, and Si. These may also be constituents of borosilicate glass.
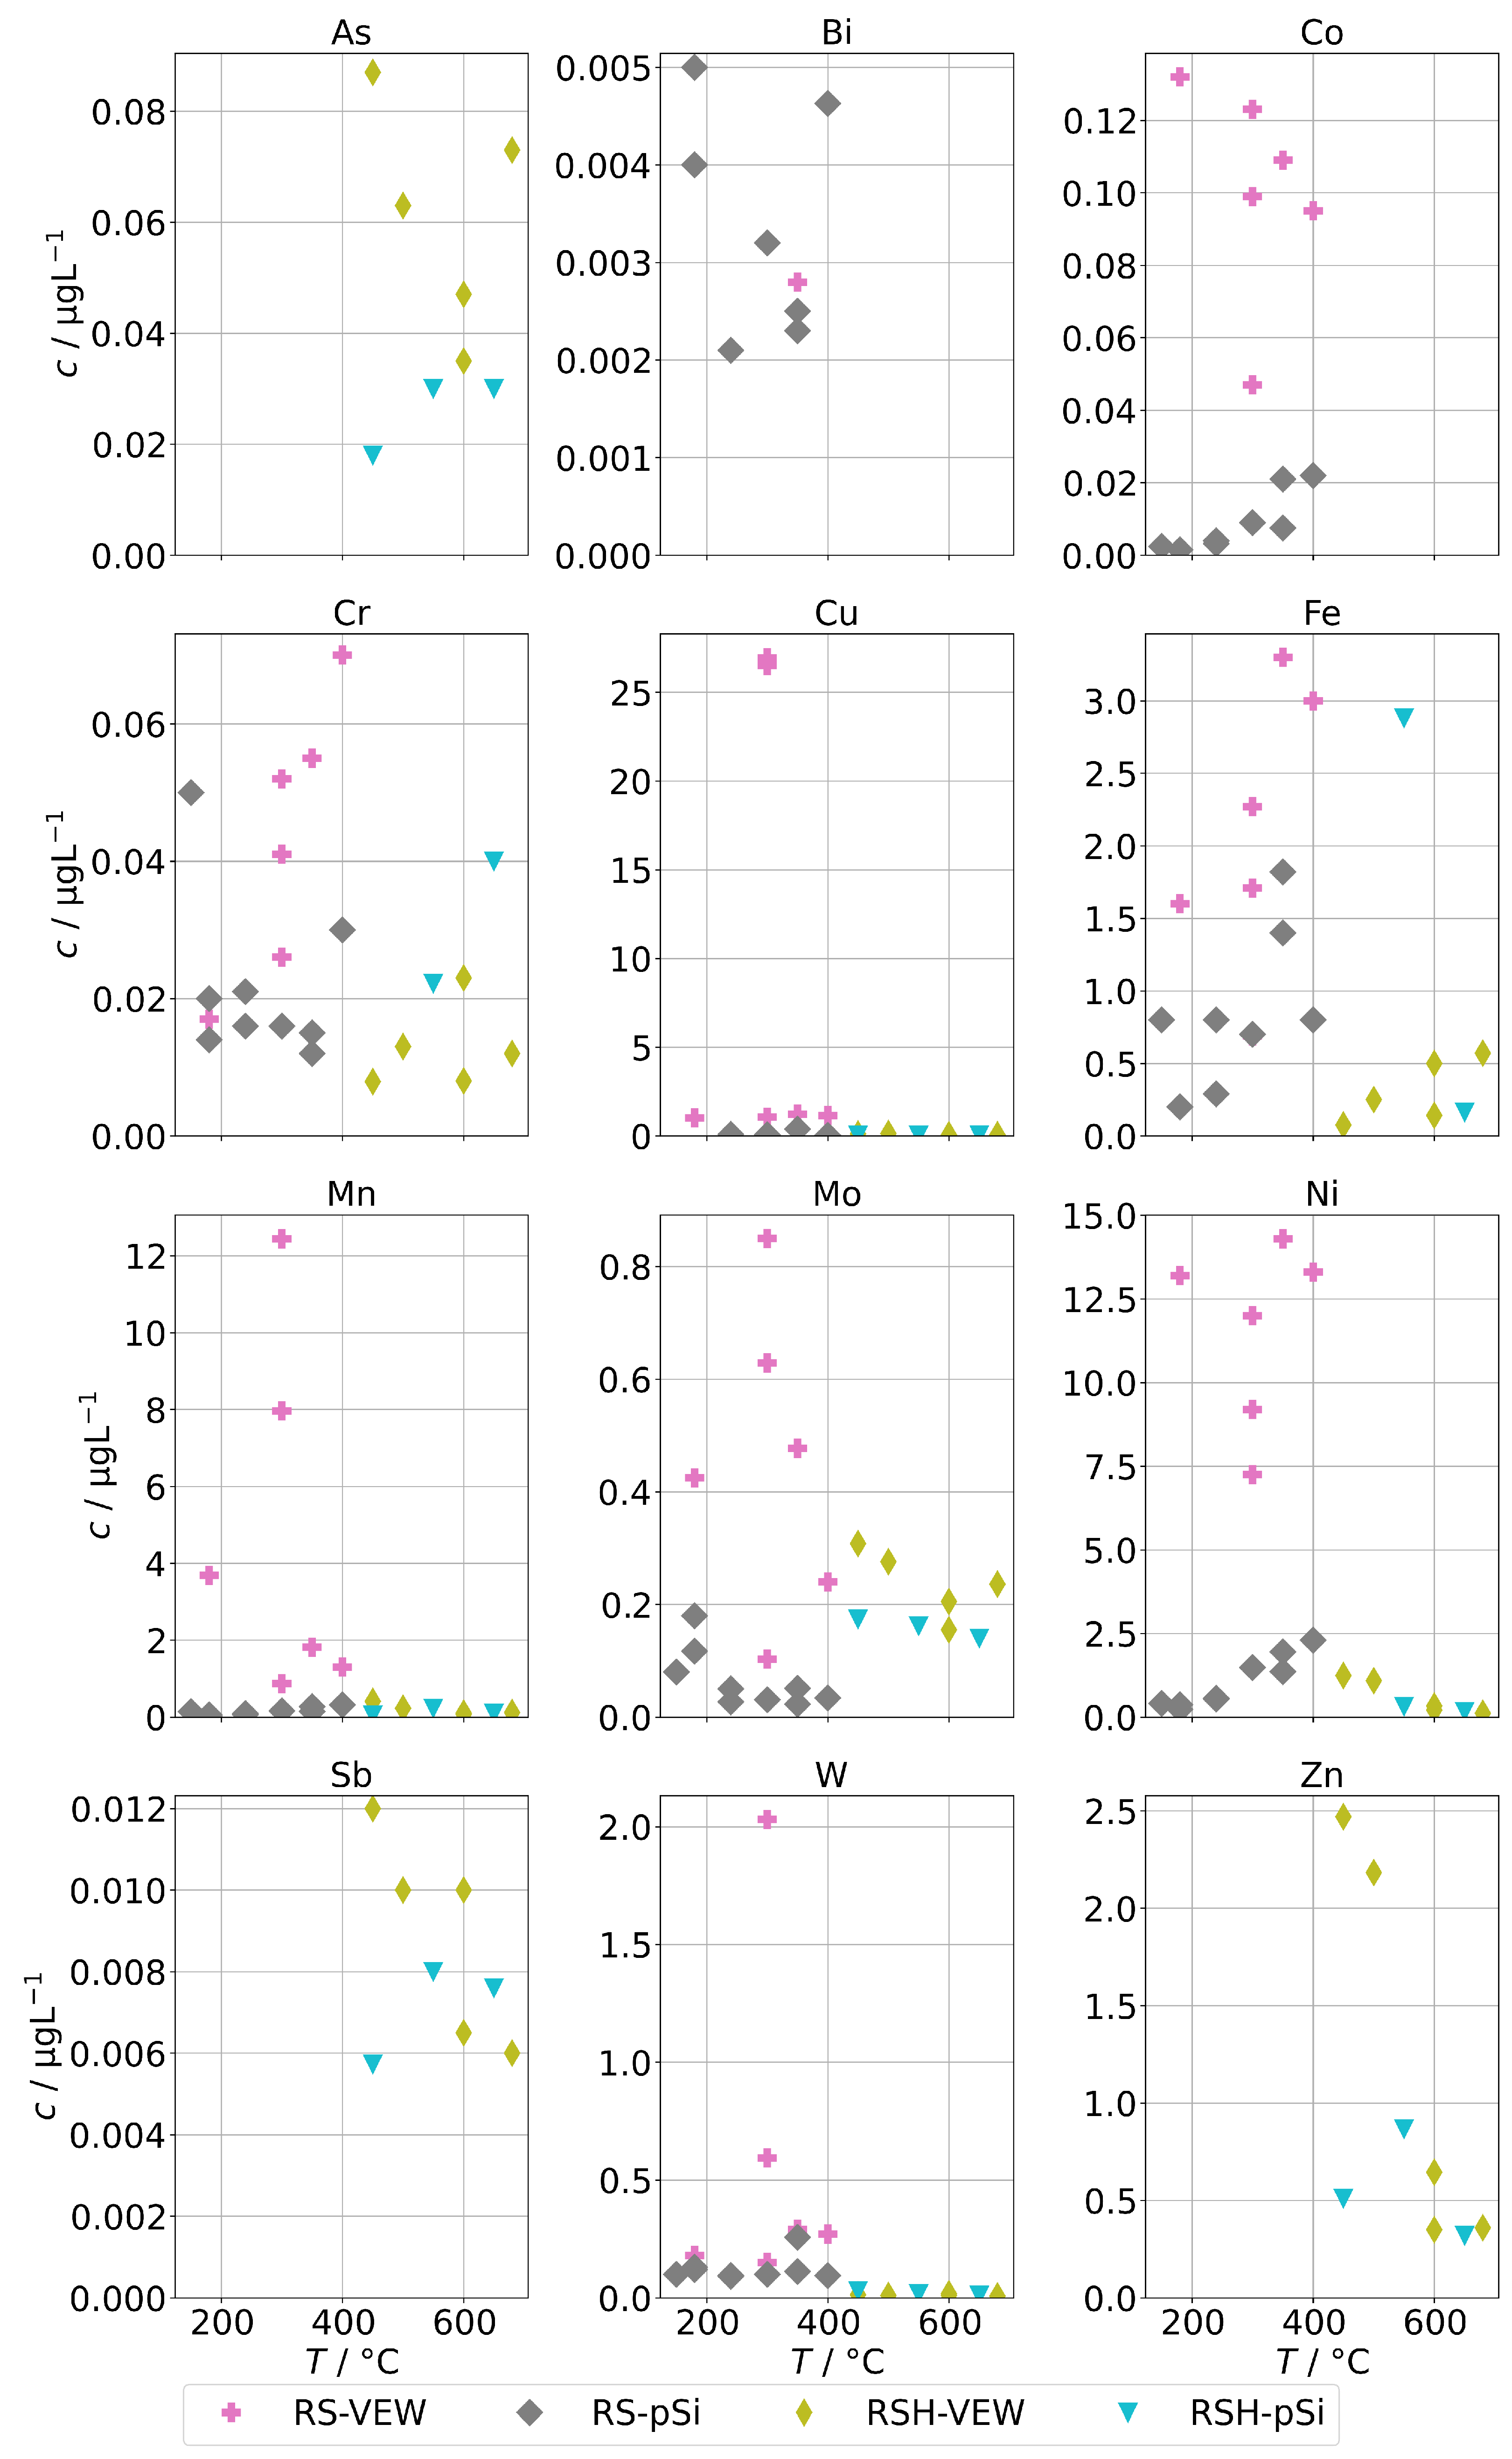
Figure 4 shows the measured background concentrations of group A for the AG-SG. In general, there is no clear dependance on the operation temperature recognizable. The concentrations of the pnictogens are usually well below 100 , and the concentrations of the alloying metals are usually well below 20 . However, we made one specific observation: the concentrations of the alloying elements were highest in the series RS-VEW. After this series, a feed-water containing silica was examined before we switched to clean feed-water for RS-pSi. Silica is a common corrosion inhibitor for metals and water pipes and forms, together with corrosion products of metals, a very thin, protective film which protects against further corrosion [29]. We find it likely that the feed-water spiked with silica performed in this way and therefore the amount of alloying elements in the condensates was reduced after this experiment. This could offer an interesting route of preconditioning steam generators before operation.
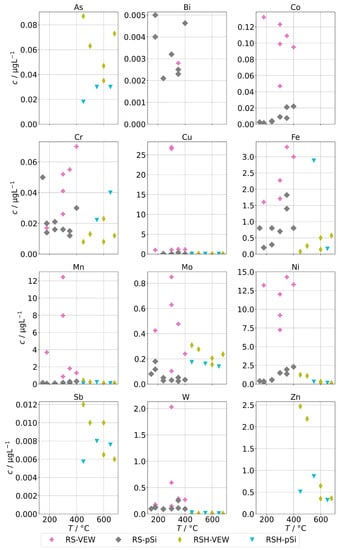
Figure 4.
Background concentrations of quantifiable species in condensates of the AG-SG (group A) in dependence of operation temperature.
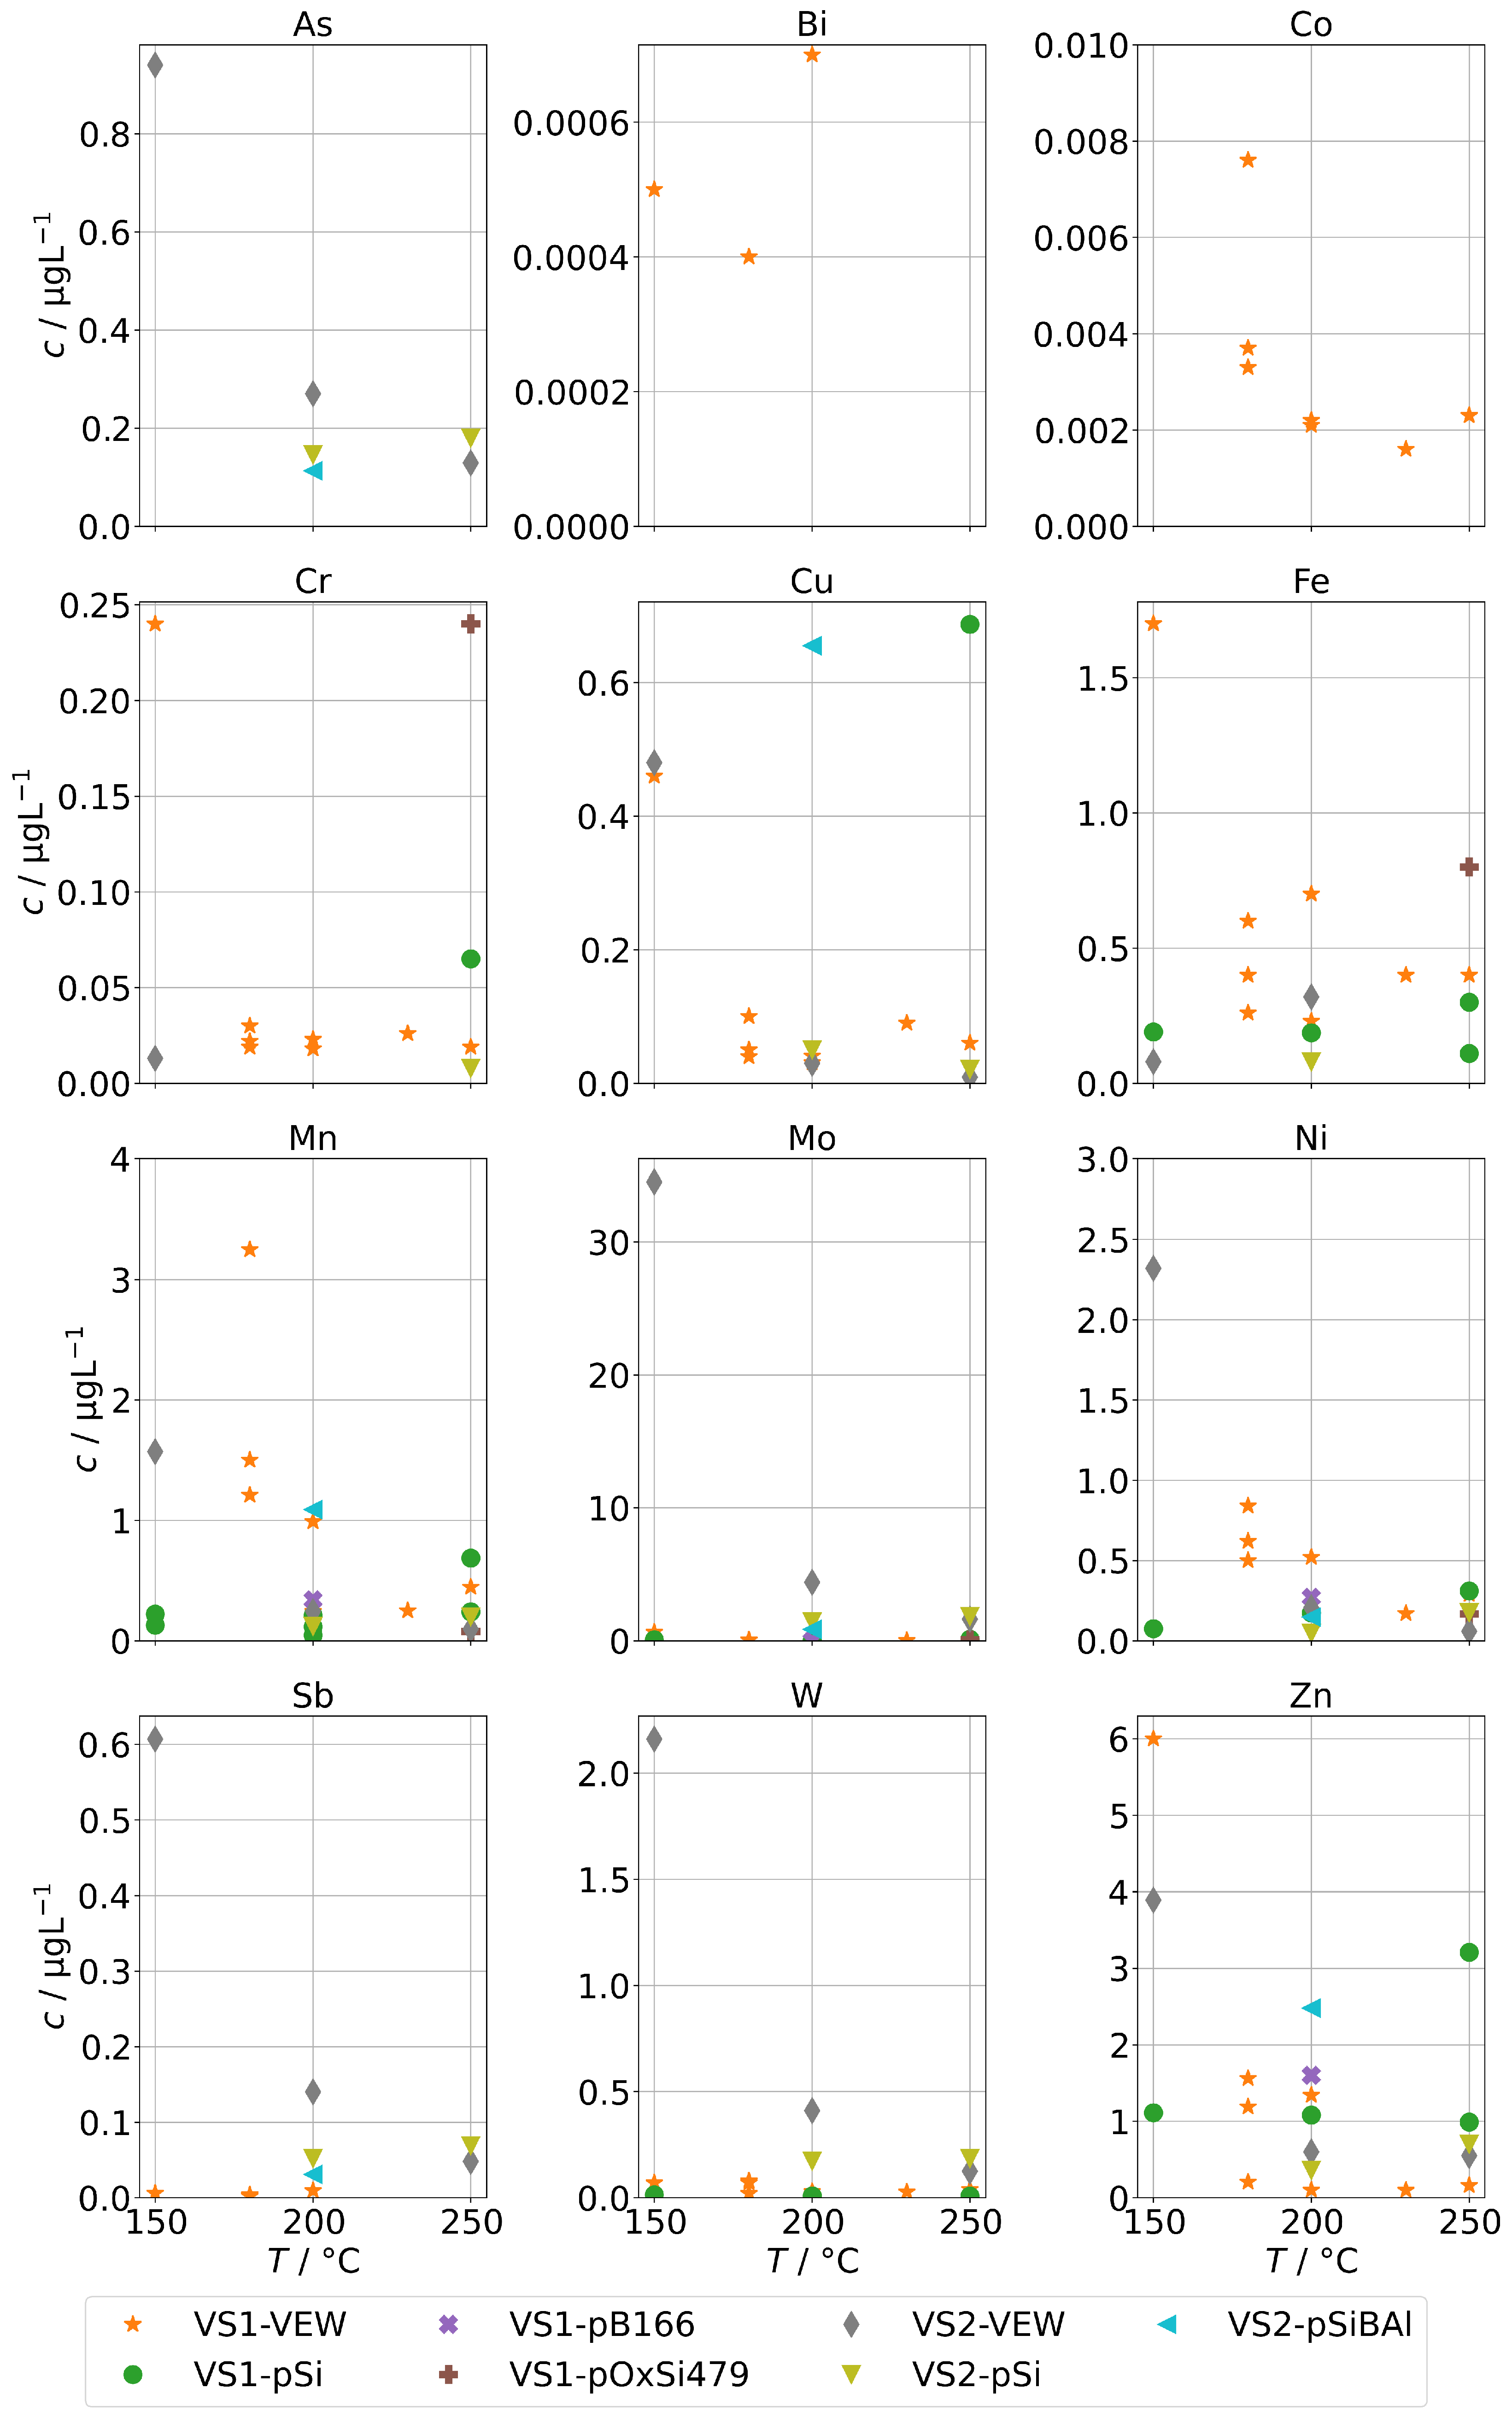
The contaminations from group A found in the condensates of the two sintered-body steam generators VS1 and VS2 are shown in Figure 5. For scaling reasons, the panels for Co, Mn, and Ni do not show the measurements for the sample at 150 in series VS1-VEW. Their concentrations were 214 for Co, 174 for Mn, and 34 for Ni.
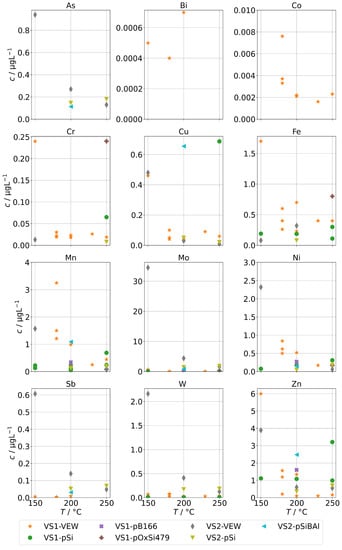
Figure 5.
Background concentrations of quantifiable species in condensates of the SB-SG (group A) in dependence of operation temperature.
Our first observation is that concentrations are usually highest for samples obtained at a temperature of 150 . From Figure 2b, we already concluded that at low temperatures, the physical carryover strongly increases due to unstable evaporation. This is reflected here as well and causes a strong increase for Ni, Mo, Mn, Cr, and Co. At this temperature, the steam generator is clearly overloaded, causing the formation and transport of entrained water droplets. The effect was likely boosted by the fact that VS1 was new and the series VS1-VEW was the first operation of the steam generator. It seems reasonable to expect that the protective layer on top of the metals was not fully formed, causing an increase in metal ions in the water phase of the steam generator, which are then carried over. In particular, we expect this to be the reason for the massively increased concentrations for Co, Mn, and Ni for the measurement in series VS1-VEW at 150 , which was the very first of this steam generator.
The second observation is that As could only be quantified for VS2, and the highest concentration of Sb, W, and Mo were found with VS2. This steam generator was in use for some time. Therefore, we regard it as likely that these species are not released by the SG or the sampling infrastructure, but did accumulate over time and formed deposits in it from previous operation. This might also explain the ten-fold increase for As and Sb for the VS2 in comparison to the AG-SG.
Both observations alone could have significant implications for real stack experiments.
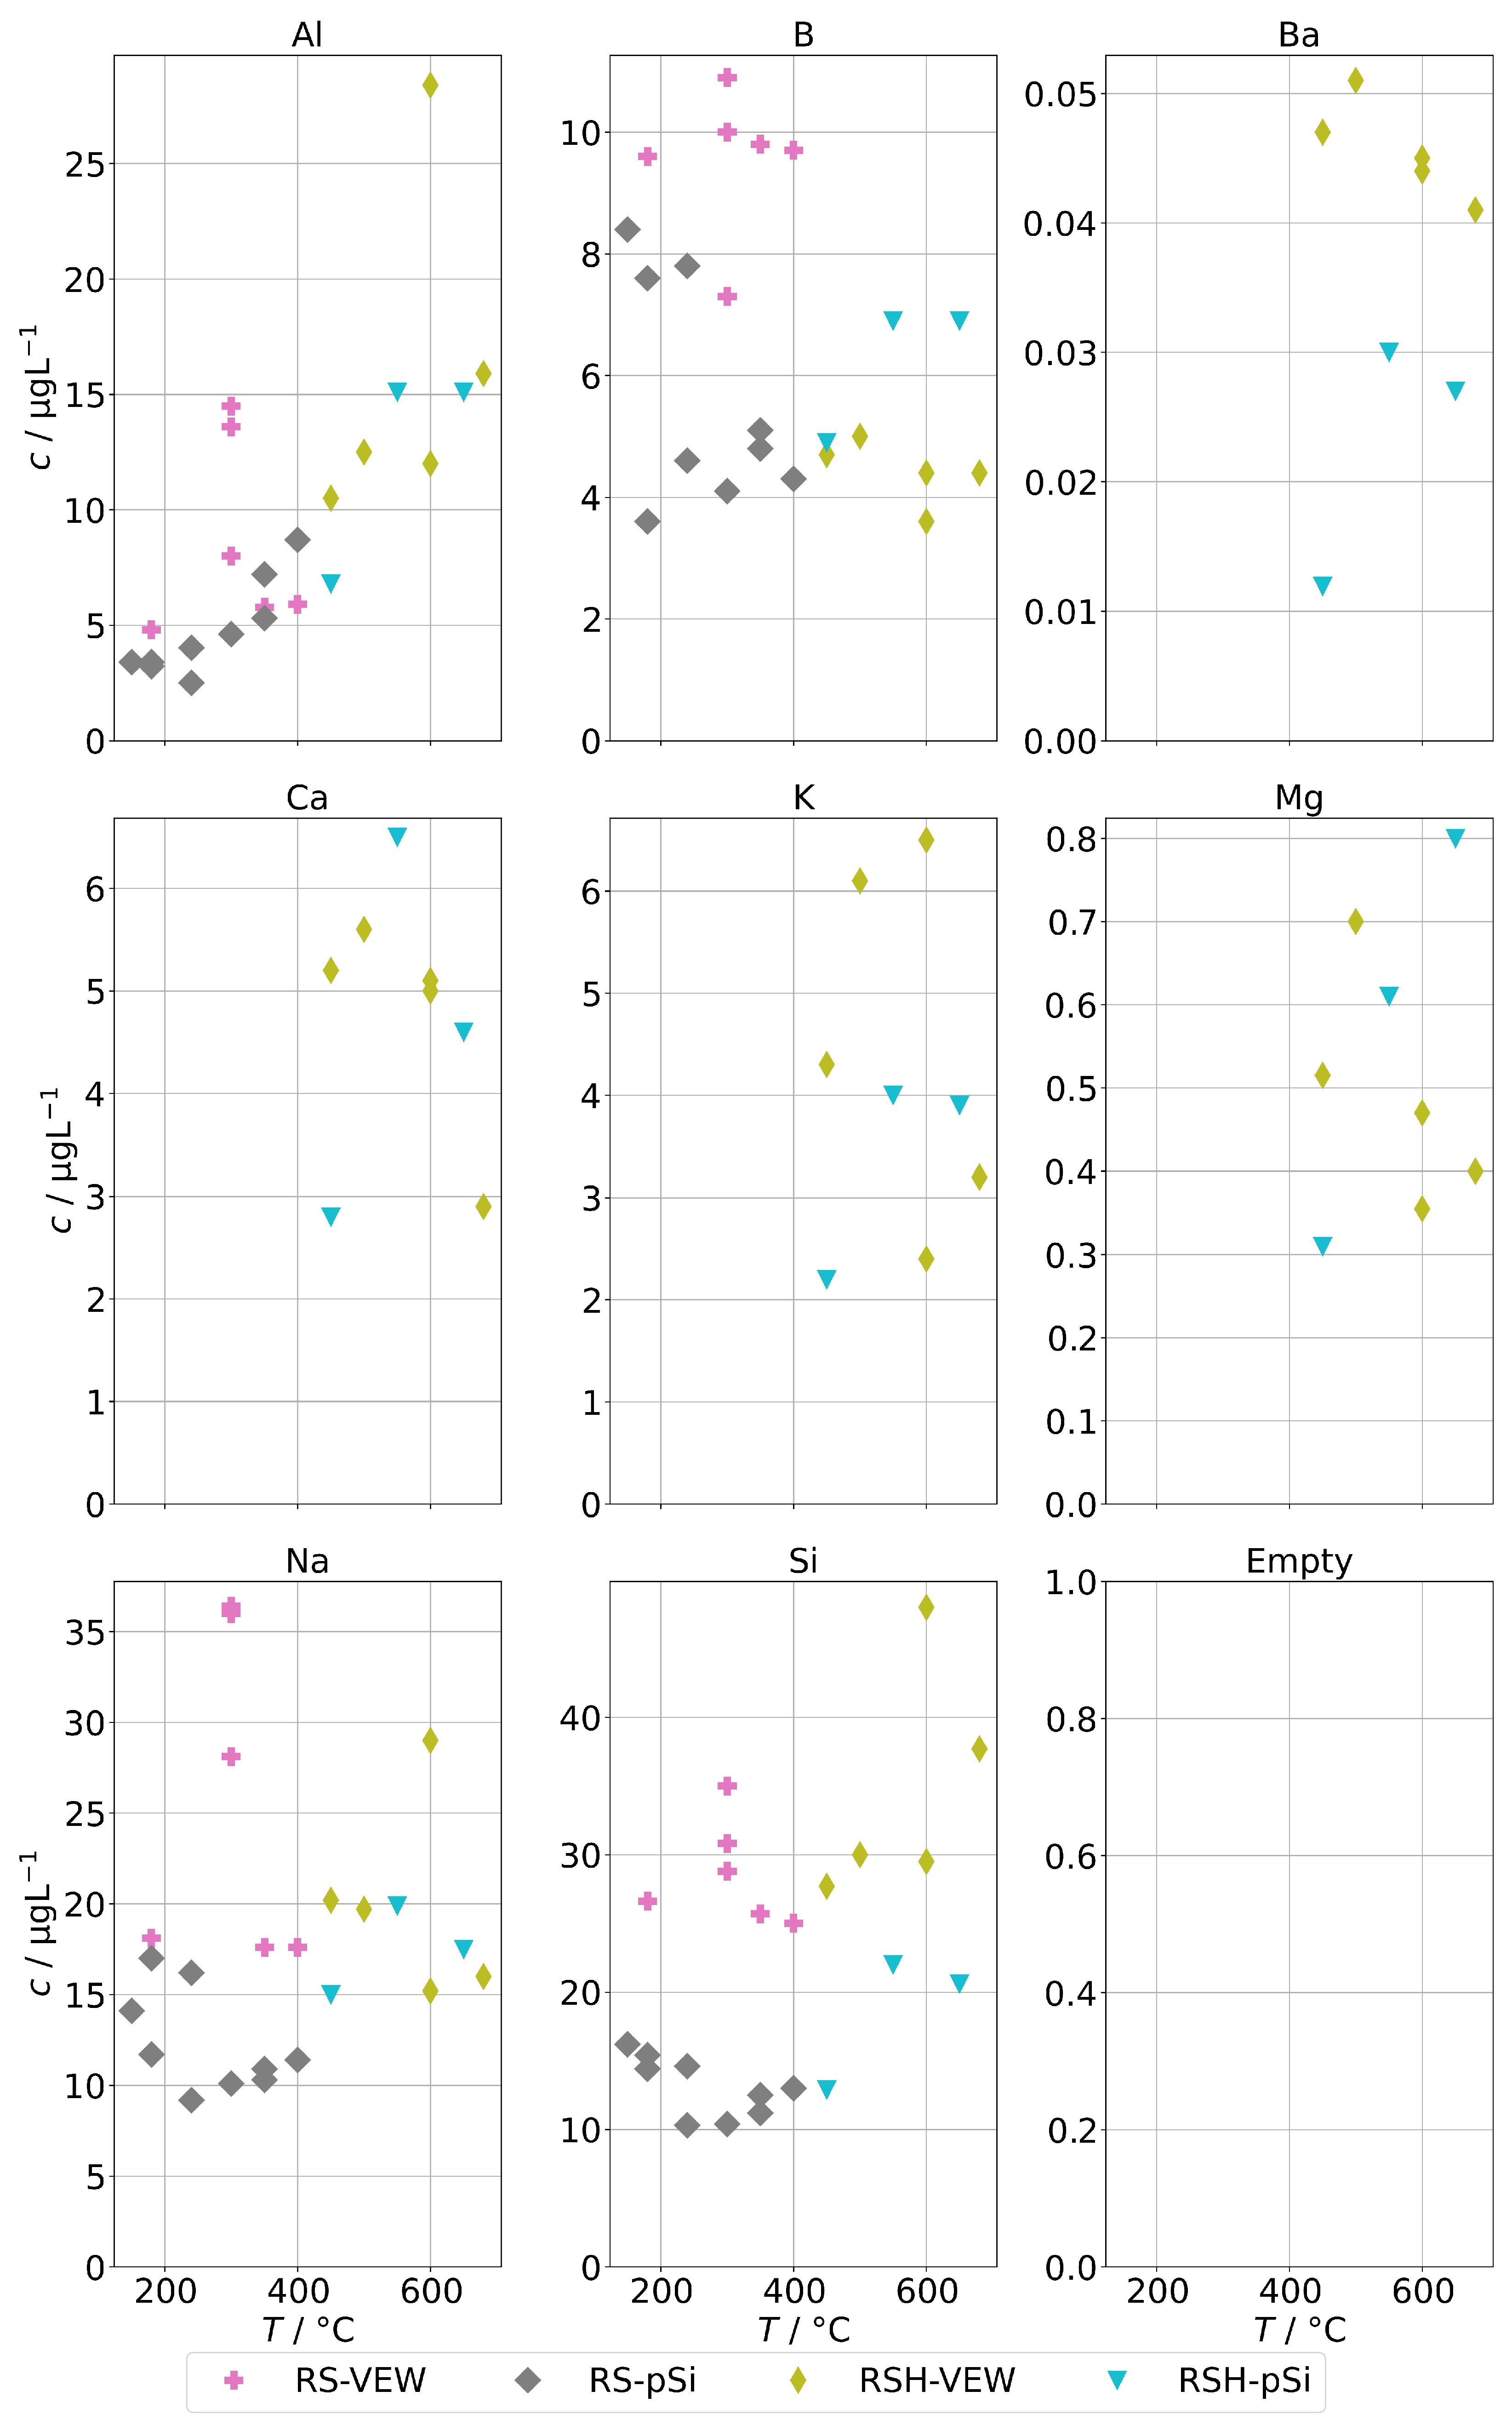
Figure 6 shows the background concentrations for group B for the AG-SG. In general, no clear temperature dependence can be observed. An exception may be aluminum. The lowest observed concentrations were around 4 for Al and B and around 10 for Na and Si. The corresponding graph for the two SB-SGs is in Figure 7. As before, the general trend is a strong increase of contamination below 200 , which coincides with an increased physical carryover for this type of steam generator.
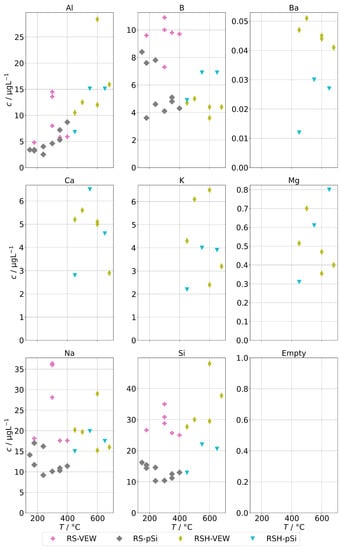
Figure 6.
Background concentrations of quantifiable species in condensates of the AG-SG (group B) in dependence of operation temperature.
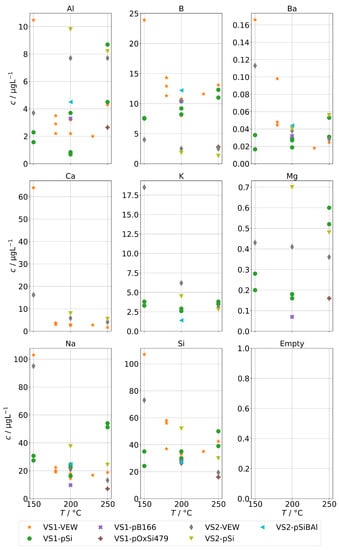
Figure 7.
Background concentrations of quantifiable species in condensates of the SB-SG (group B) in dependence of operation temperature.
Obviously, we cannot separate the contributions of the steam generators and the sampling infrastructure; however, we consider it likely that the lower end of the concentration ranges observed here represents the background of the sampling infrastructure and a stable evaporation of the steam generators with low carryover. Any addition to that is expected to be caused by additional carryover.
3.5. Spiked Feed-Water
In this step, we added several contaminants (see Table 2) to the feed-water supplied to the steam generators and analyzed the concentration of species from the groups A and B in the condensate samples obtained at different operation conditions.
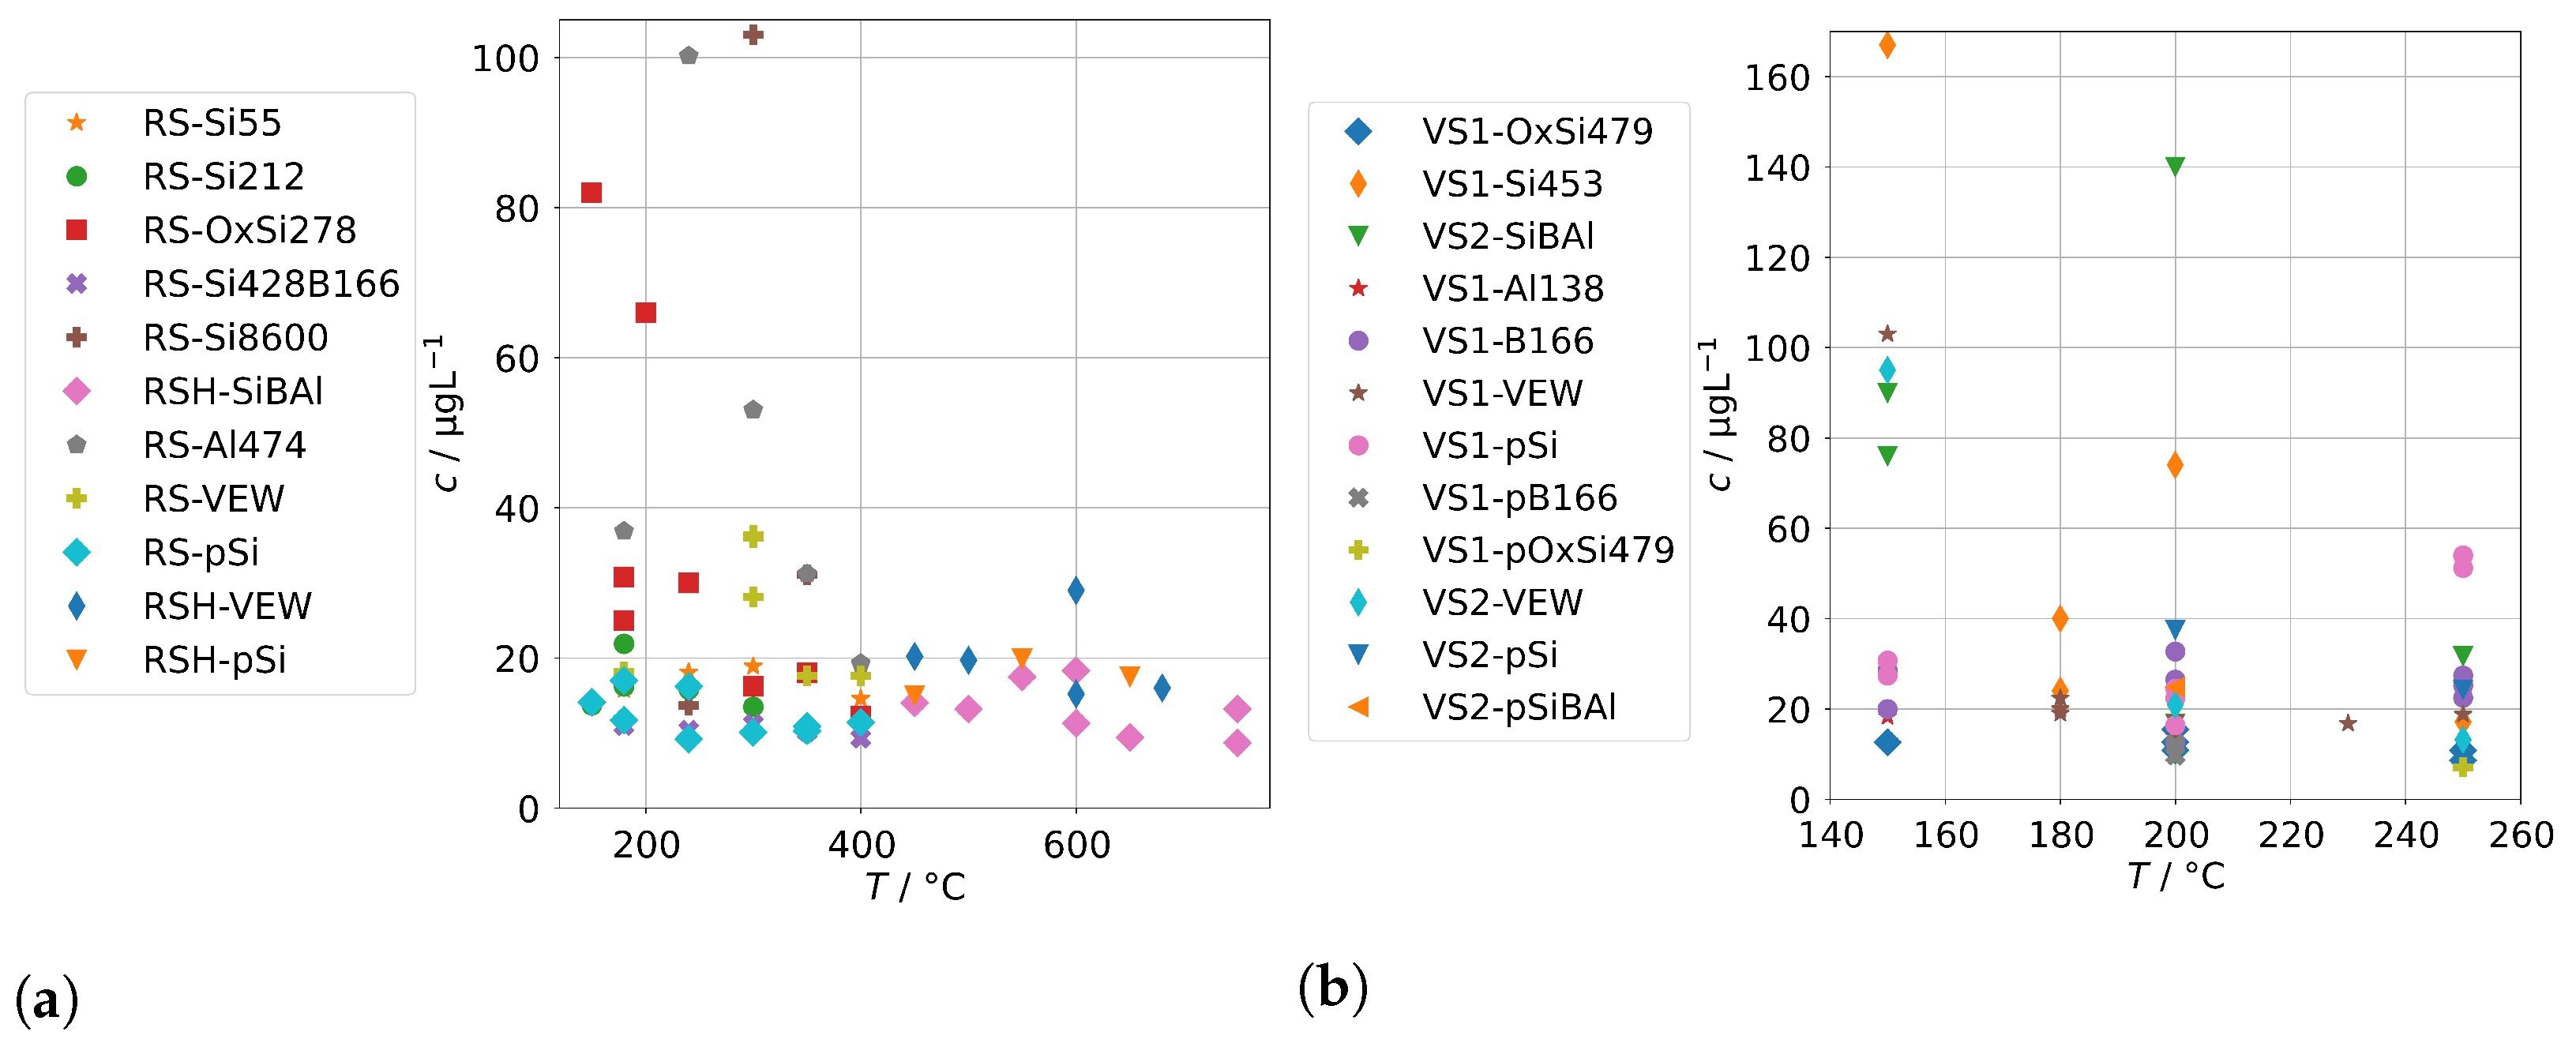
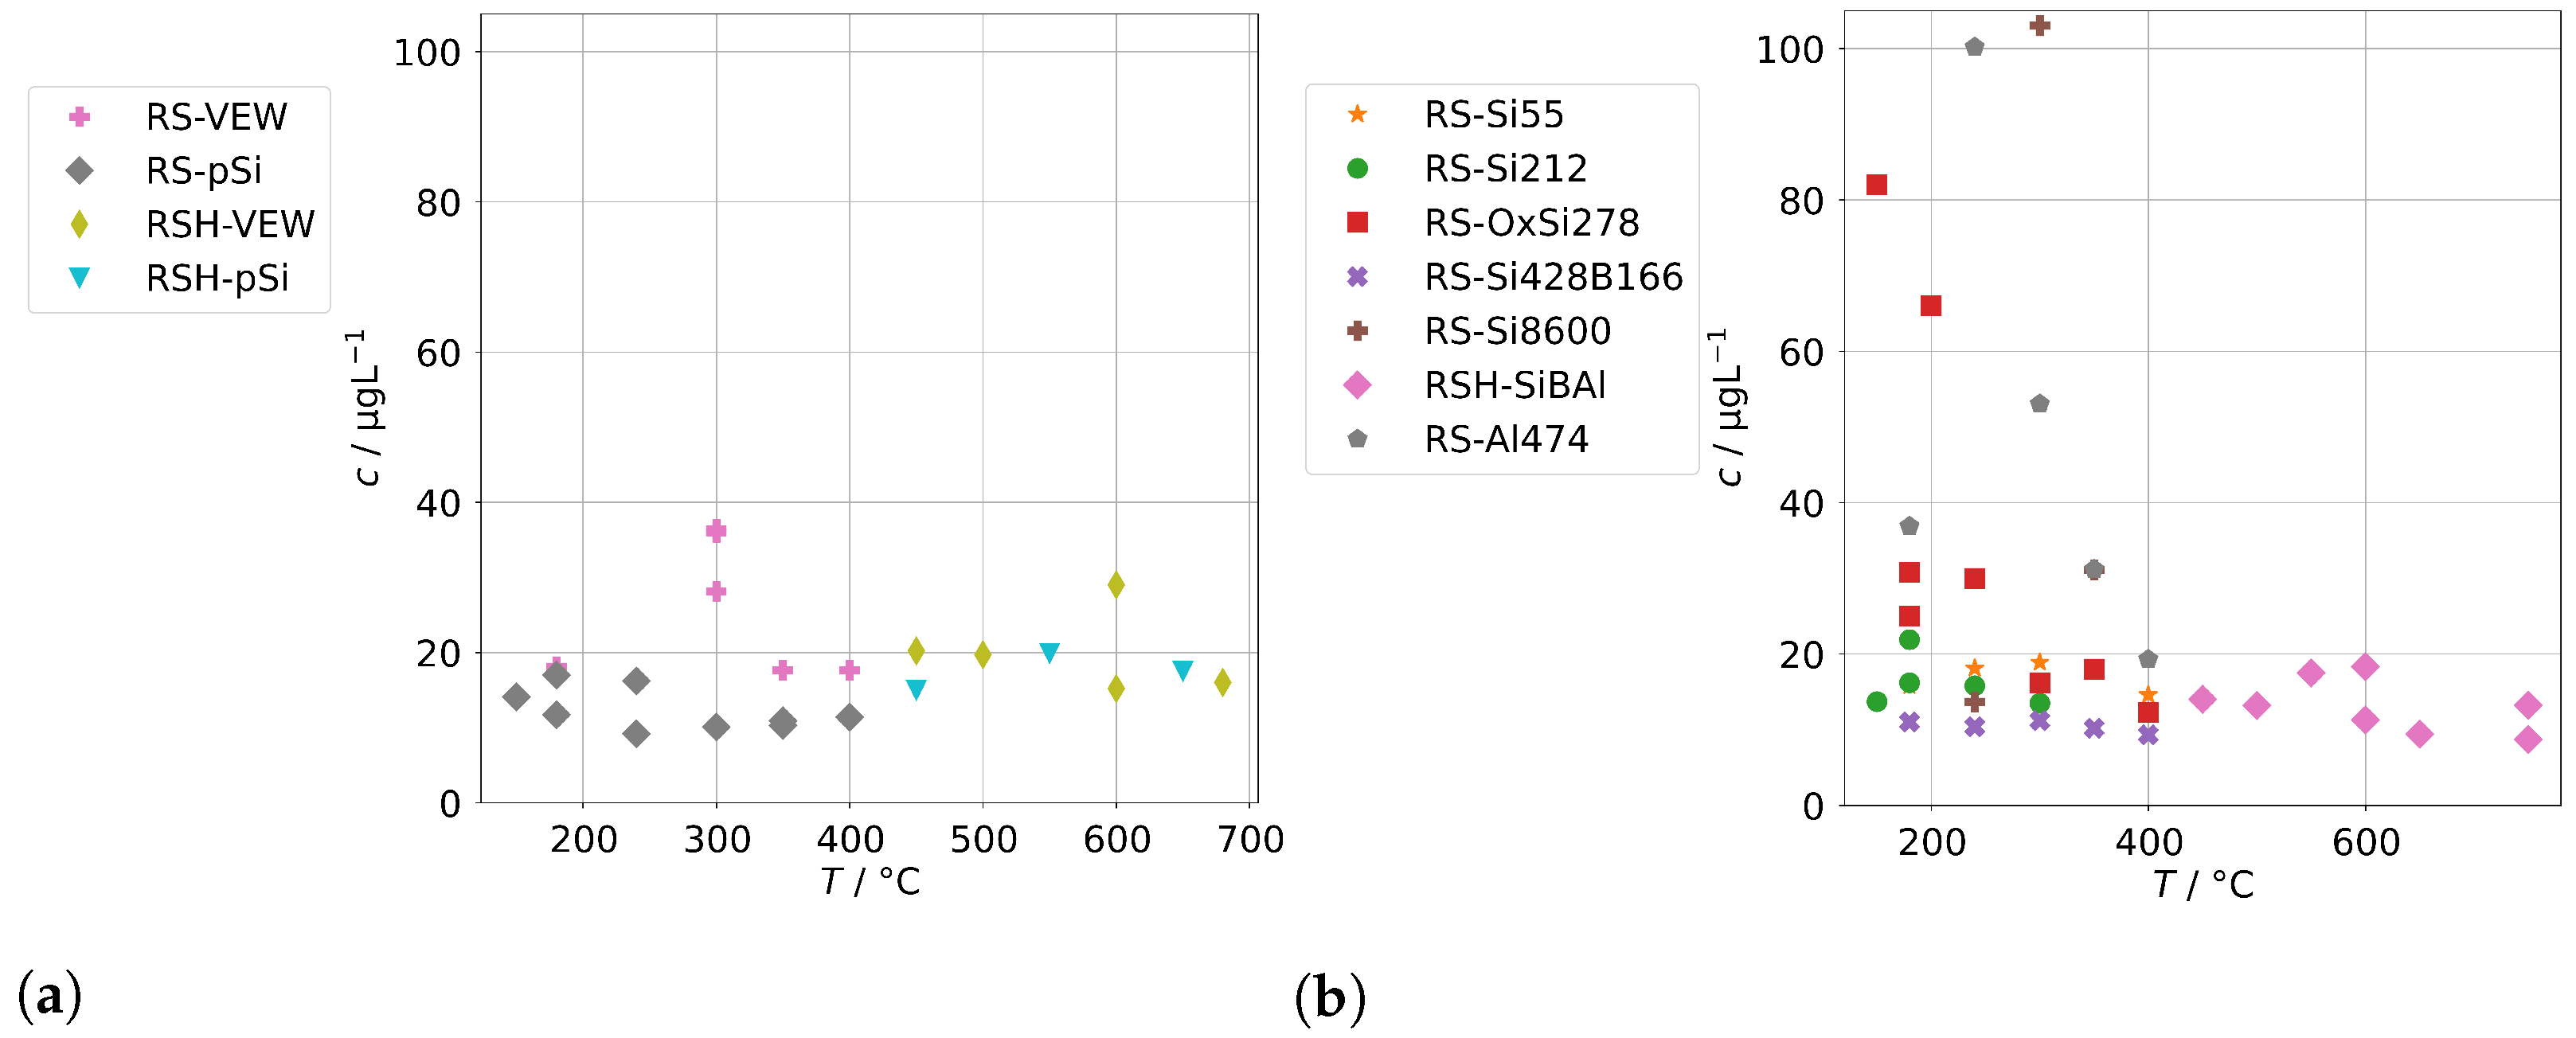
The results for group A in the case of the annular-gap steam generator are shown in Figure 8. As in the case of the background concentrations, the concentrations of the condensates increase with decreasing operation temperatures due to increased mechanical carryover. Since the feed-water was never spiked with species from group A, no large increase in comparison to the background is to be expected, and, in general, this was indeed the case. The series RS-OxSi278 is an exception, because it did not only contain a silicate standard as silicon source, but also oxalic acid to adjust the pH to 4–5. This was performed to take into account that water purified by ion-exchange is usually slightly acidic. This change in water chemistry can shift the concentration of steam-soluble species, e.g., it shifts the equilibrium of orthosilic acid towards the actual steam-soluble protonated form Si(OH)4. However, it also promotes corrosion of metal surfaces in piping and steam generators, even in case of corrosion-resistant materials. The result is a hugely increased load of alloying species in the condensates of series RS-OxSi278. The increase varies by species, but is at least an order of magnitude, and in the case of the main alloying metals Cr, Fe, and Ni, even three orders of magnitude.
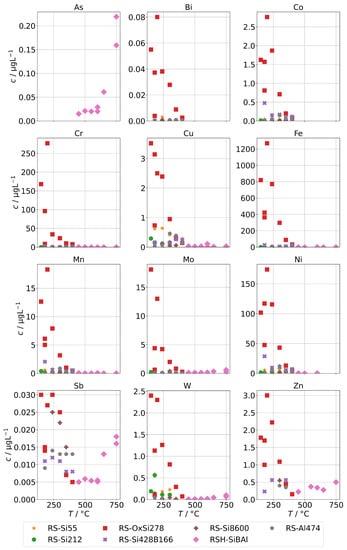
Figure 8.
Concentrations of quantifiable species in condensates of the AG-SG obtained with spiked feed-water (group A) in dependence of operation temperature.
Upon close inspection of the high-temperature series RSH-SiBAl, an increase of concentrations of Mo and W in condensates above about 600 was observed. Oxides of both elements can form gaseous oxide–hydroxides MoO(OH) and WO(OH) in humid atmospheres with comparatively high partial pressures ( and 31 at 873 K) according to thermodynamical calculations [30], which could cause an increased chemical carryover at high temperatures. As and Sb are not specifically used in alloys and do not show a large increase upon acidification of the feed-water, although their carryover seems to be increased at higher temperatures. Both elements are known to exist in oxianionic compounds with significant volatilities that are expected to be formed either in alkaline aqueous environments or in high-temperature solid-phase environments between 500 to 900 [31]. A high volatility of As and Sb from copper ores was reported in oxidizing environments between 500 to 700 and most likely in the form of AsO and SbO [32].
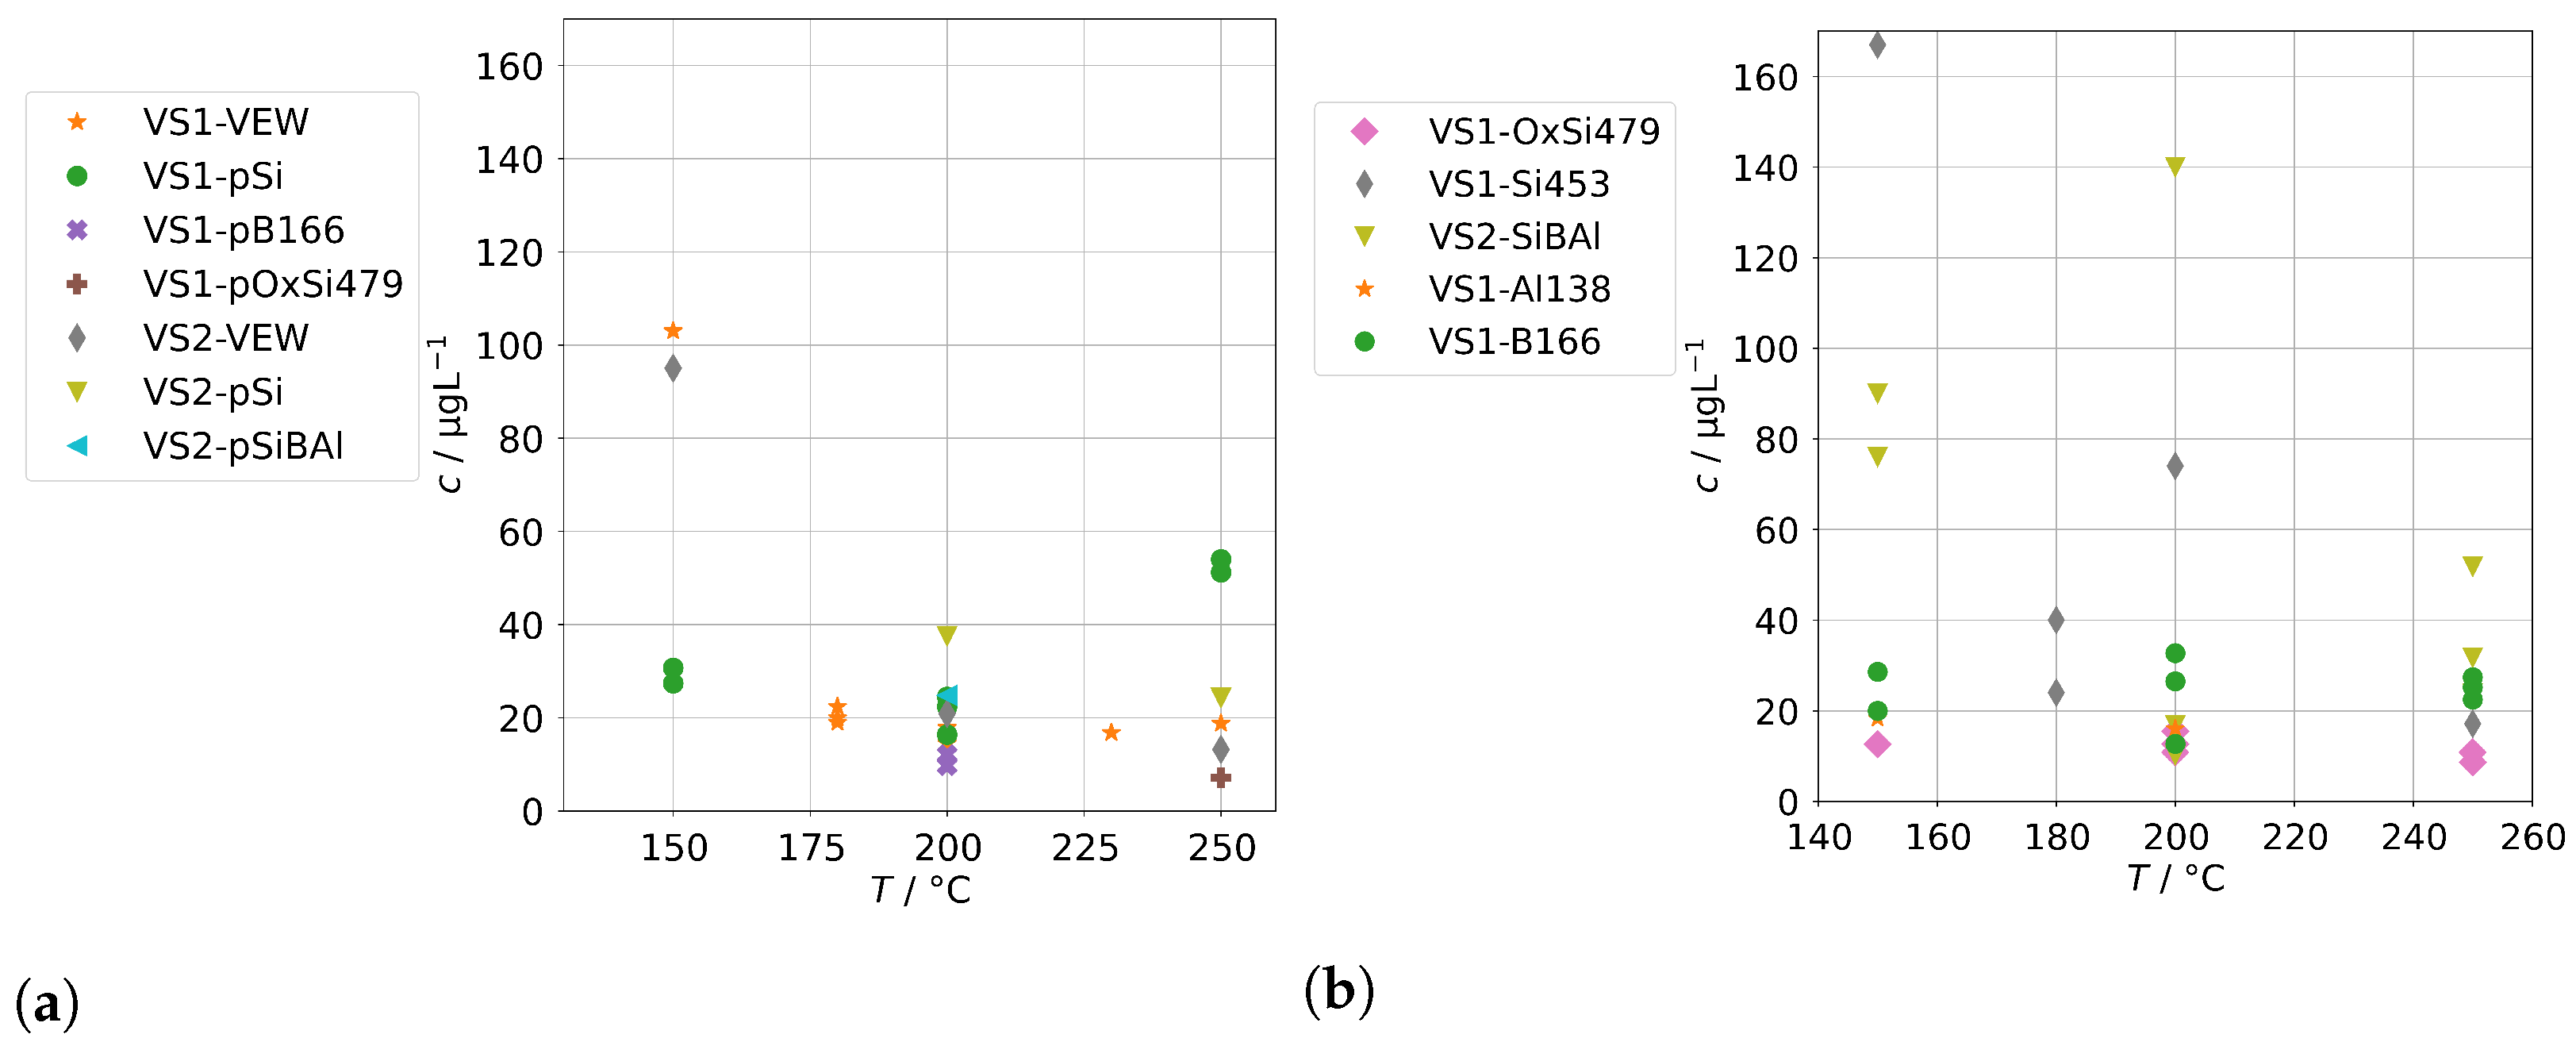
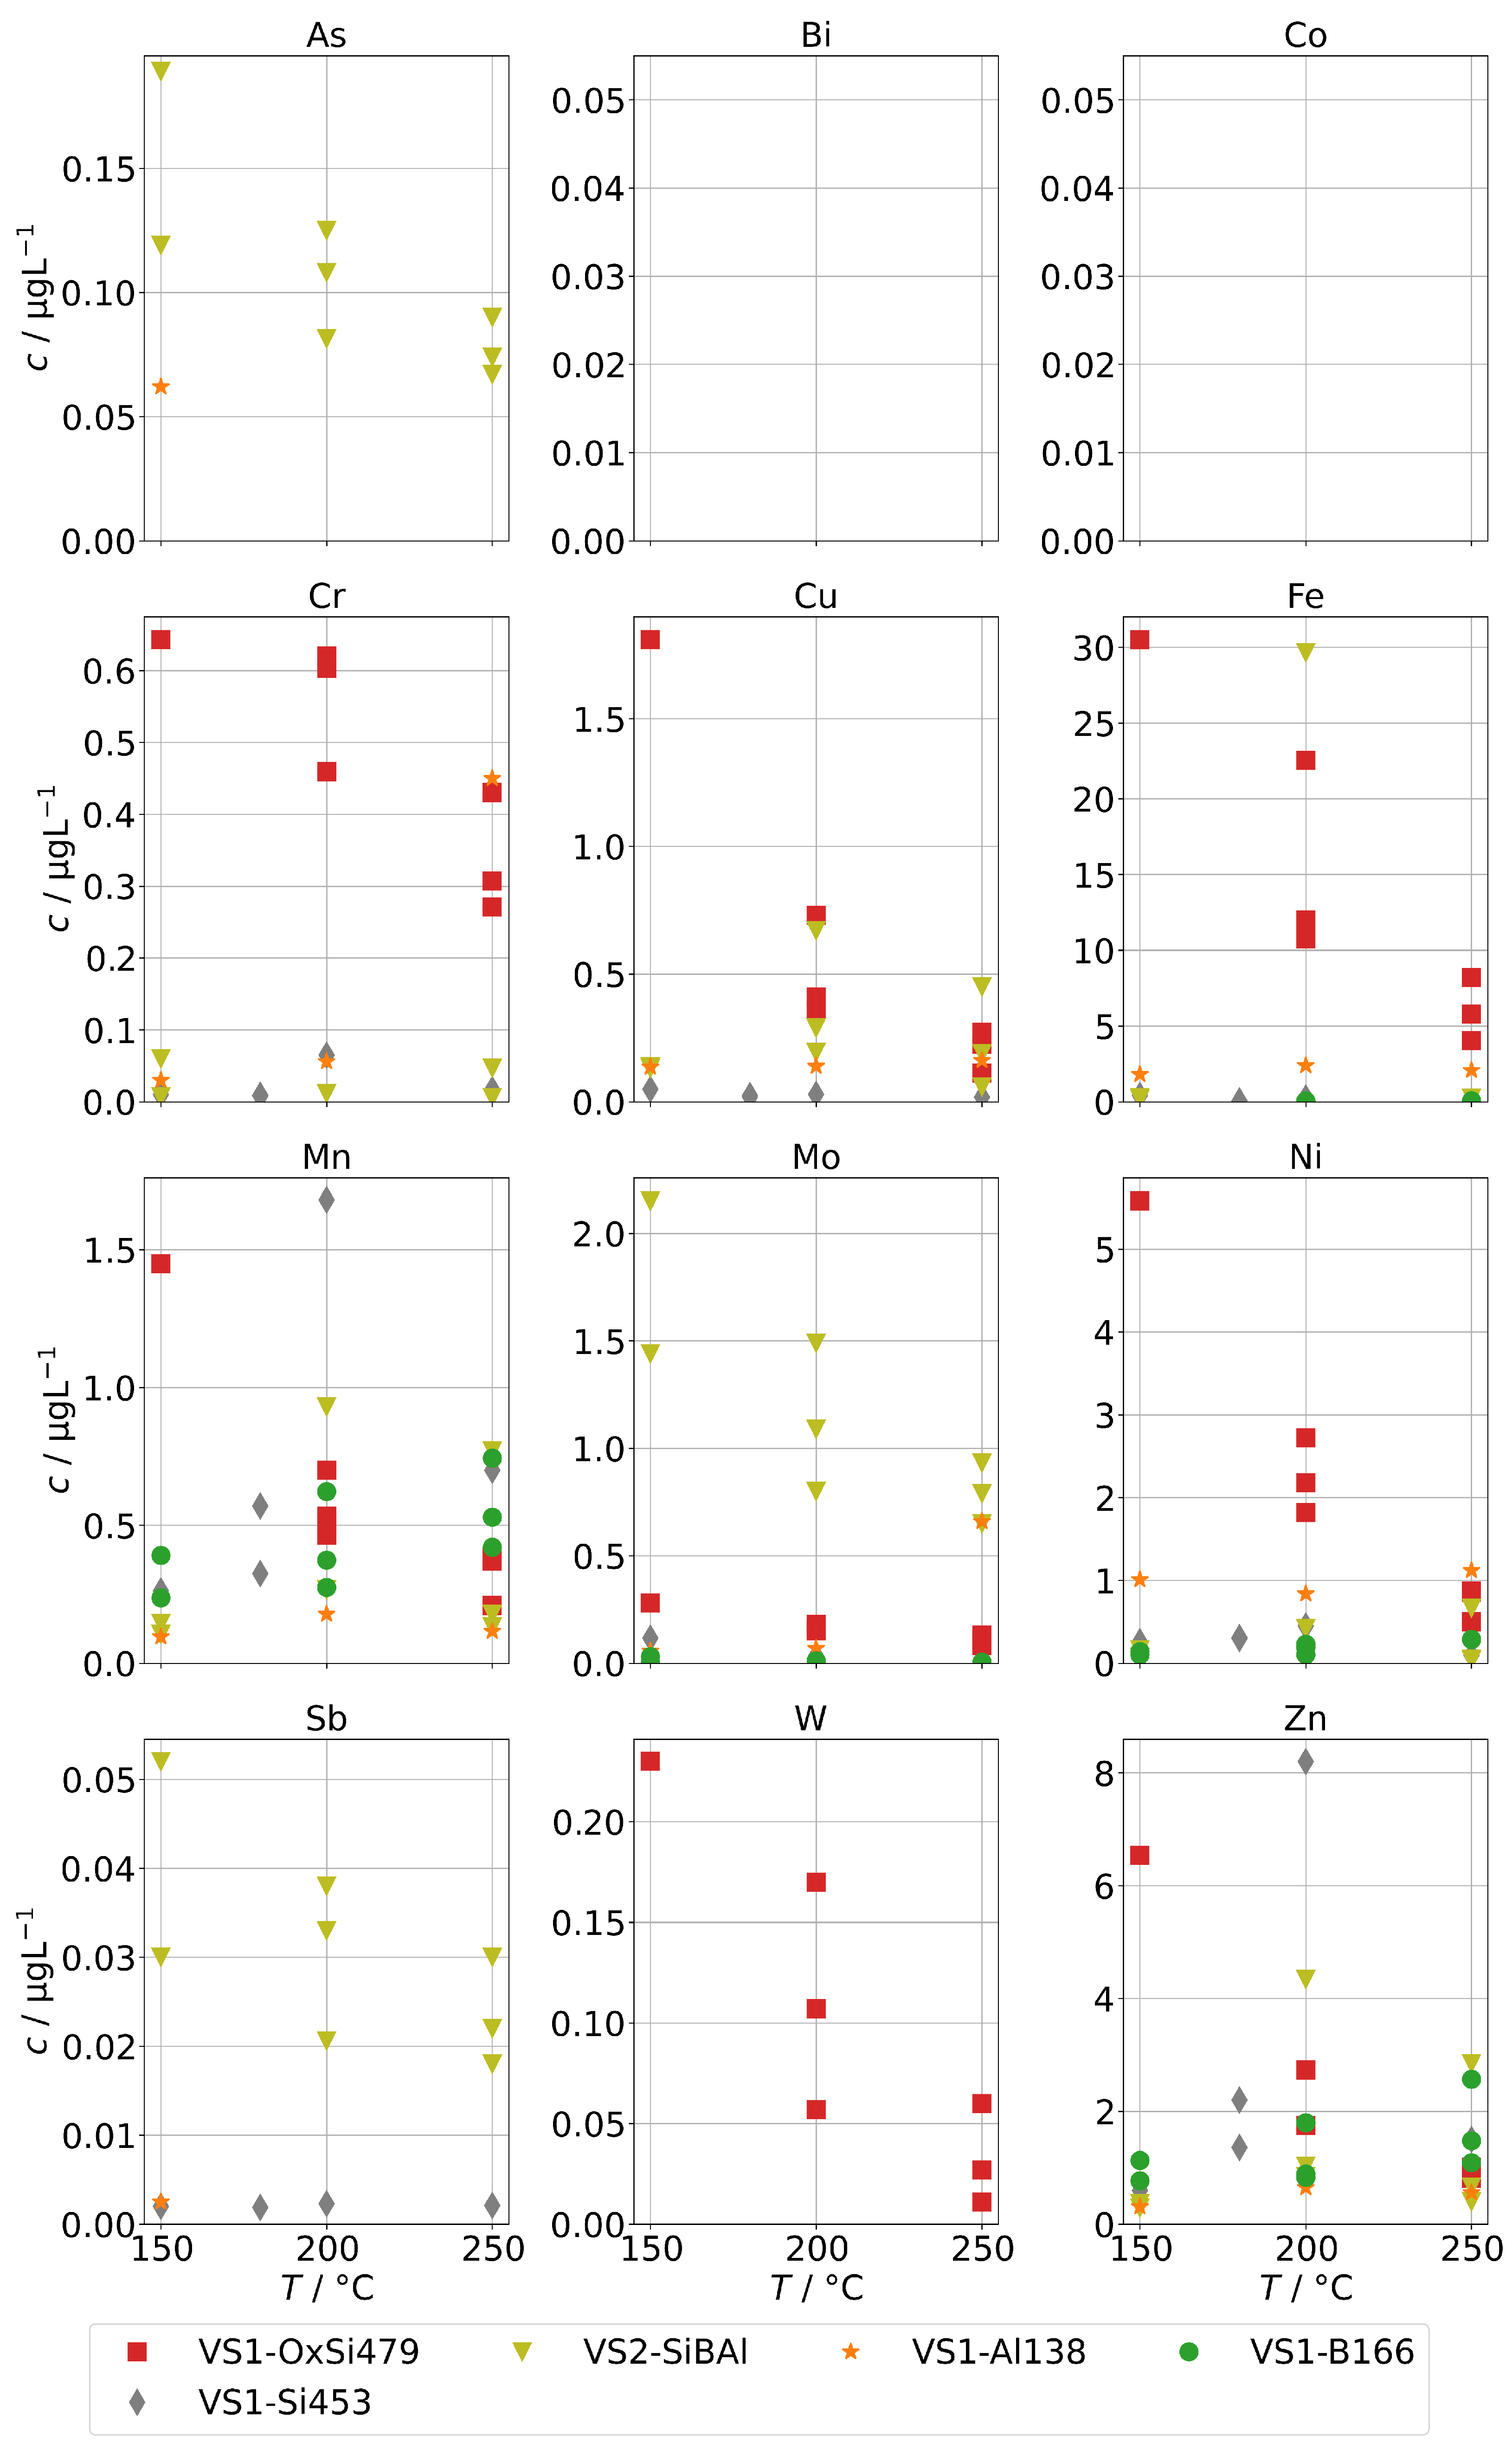
Figure 9 shows the concentrations of group A for spiked feed-waters for the two SB-SGs. Qualitatively, similar observations can be made. However, significant increases relative to the backgrounds in Figure 5 upon acidification can only be seen for Cr, Cu, Fe, and Ni, and those increases are much lower than for the annular-gap steam generator. An explanation could be the smaller metallic surface area of the SB-SG alongside different materials used in construction. As, Sb, and Mo were highest for the steam generator with high operation time (VS2) which might again point towards deposits as main source of these impurities.
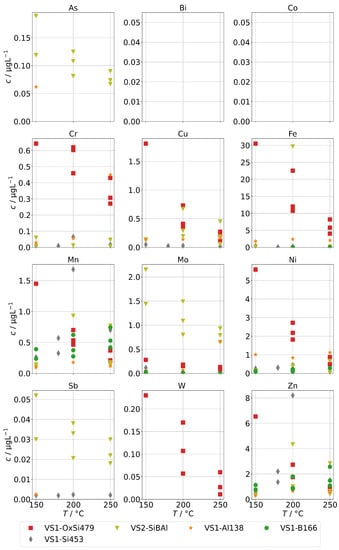
Figure 9.
Concentrations of quantifiable species in condensates of the SB-SG obtained with spiked feed-water (group A) in dependence of operation temperature (no concentrations above limit of detection for Bi and Co).
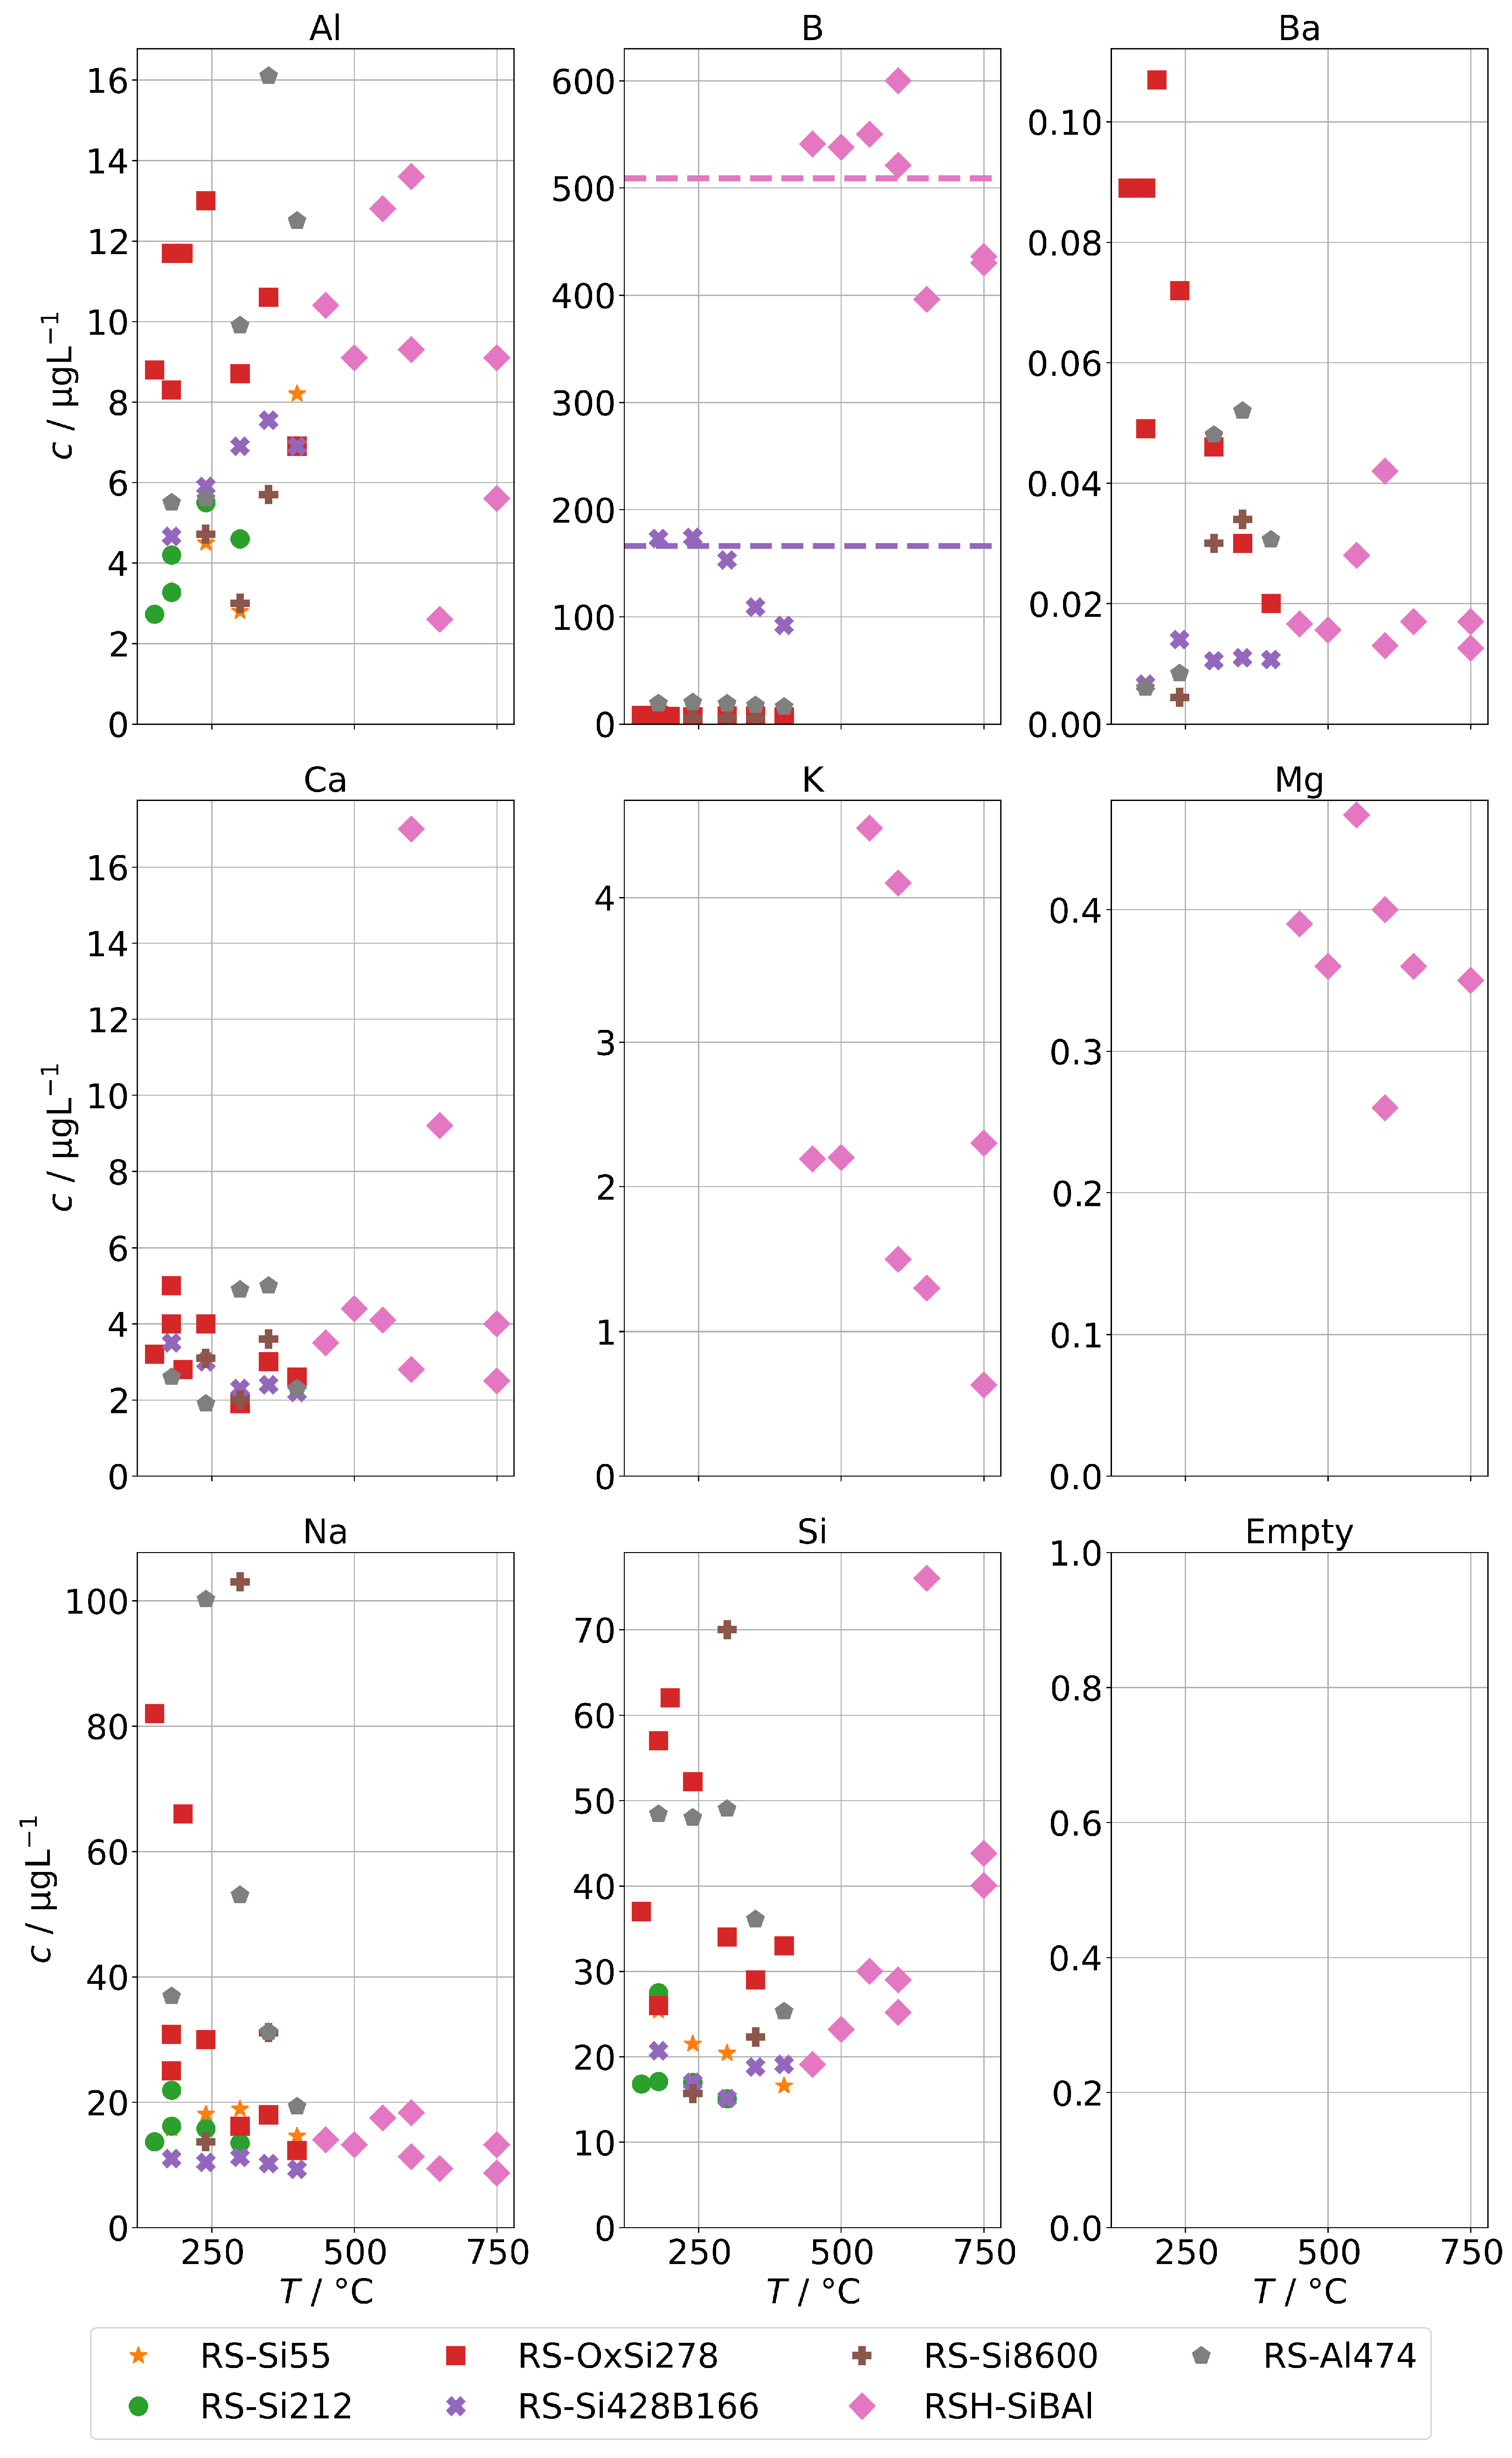
The concentrations of group B in case of the AG-SG are shown in Figure 10. In case of Ba, Na, and Si, the mechanical carryover at low temperatures can be clearly observed. In the high-temperature run RSH-SiBAl, the condensate concentrations of silicon increase with temperature which hints towards a moderately increasing chemical carryover. In comparison, the sodium concentrations are even slightly reducing with increasing temperatures, which excludes a mechanical carryover as cause for the increased silicon concentrations.
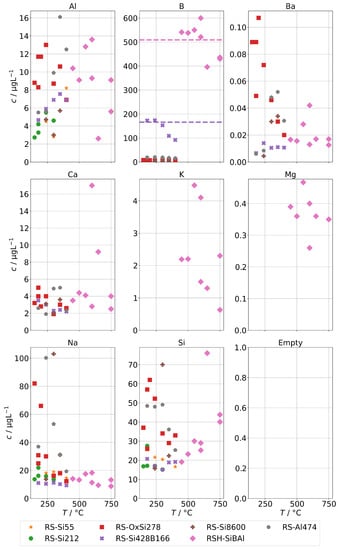
Figure 10.
Concentrations of quantifiable species in condensates of the AG-SG obtained with spiked feed-water (group B) in dependence of operation temperature. Dashed lines indicate feed-water concentrations.
Aluminum concentrations do not show any increase either by mechanical carryover at low temperatures nor at higher temperatures. In any case, the lack of mechanical carryover seems surprising, because a significant mechanical carryover in the series RS-Al474 can be observed by the increased Na concentrations below 350 . Although we attempted to introduce an aluminum species with high solubility to the feed-water, it seems likely that hydrolysis occurs fast enough, and at neutral to mildly acidic pH conditions, Al is mostly in the form of Al(OH) and Al(OH) at or near the minimum solubility in water, which may then be estimated to be as low as 3 to 30 [33].
During two series with added orthoboric acid (RS-Si428B166 and RSH-SiBAl), we determined high concentrations of boron in the condensates. For clarity, we indicated the feed-water concentrations of boron as dashed lines in the panel for B. It clearly has to be assumed that a complete volatilization occurs in the steam generator. Any boric acid present in the feed-water is likely to pass into the steam due to its high steam solubility (beside its also low boiling point). Unfortunately, at this moment we cannot offer a fully satisfactory explanation for the drop in concentrations apparent at higher temperatures. It could be related to changes at high temperatures, e.g., dehydration steps from orthoboric acid to boron trioxide via metaboric acid and pyroboric acid. This may in turn depend on the height of the water column in the steam generator, since that influences the contact time of steam and orthoboric acid with hot surfaces above the water level. The water level in the steam generator depends on temperature and flow but was not determined in these experiments.
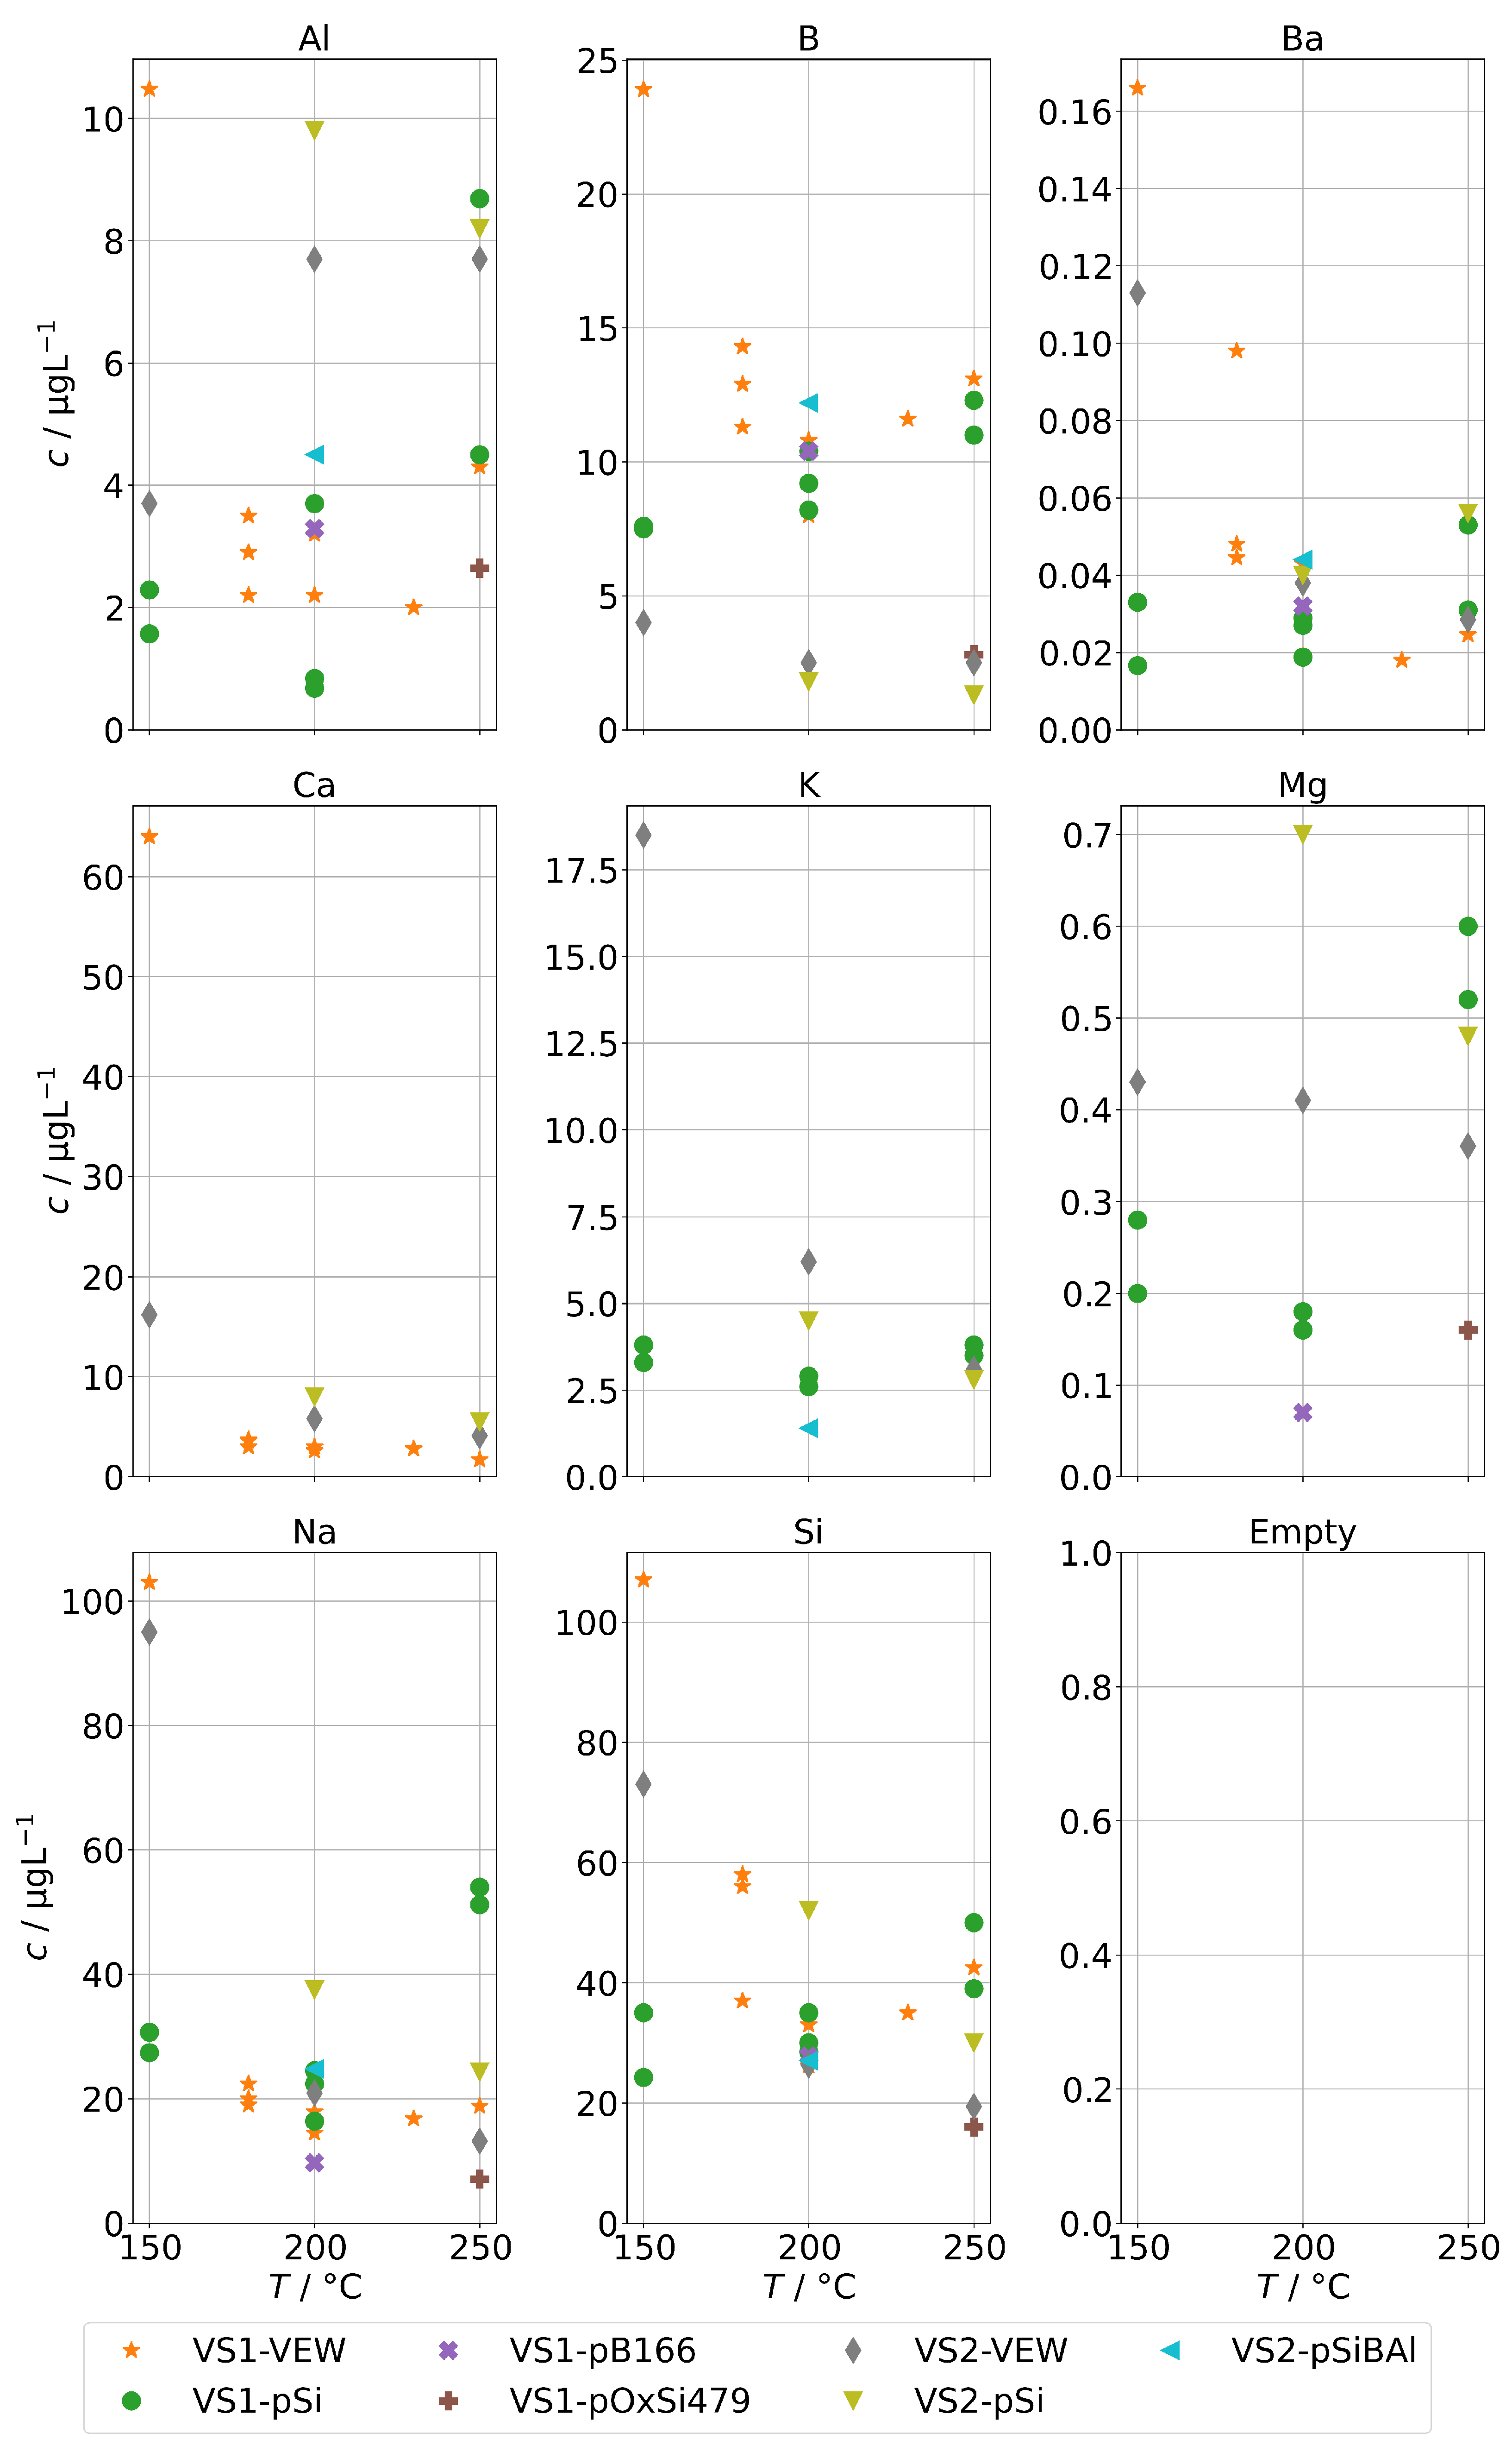
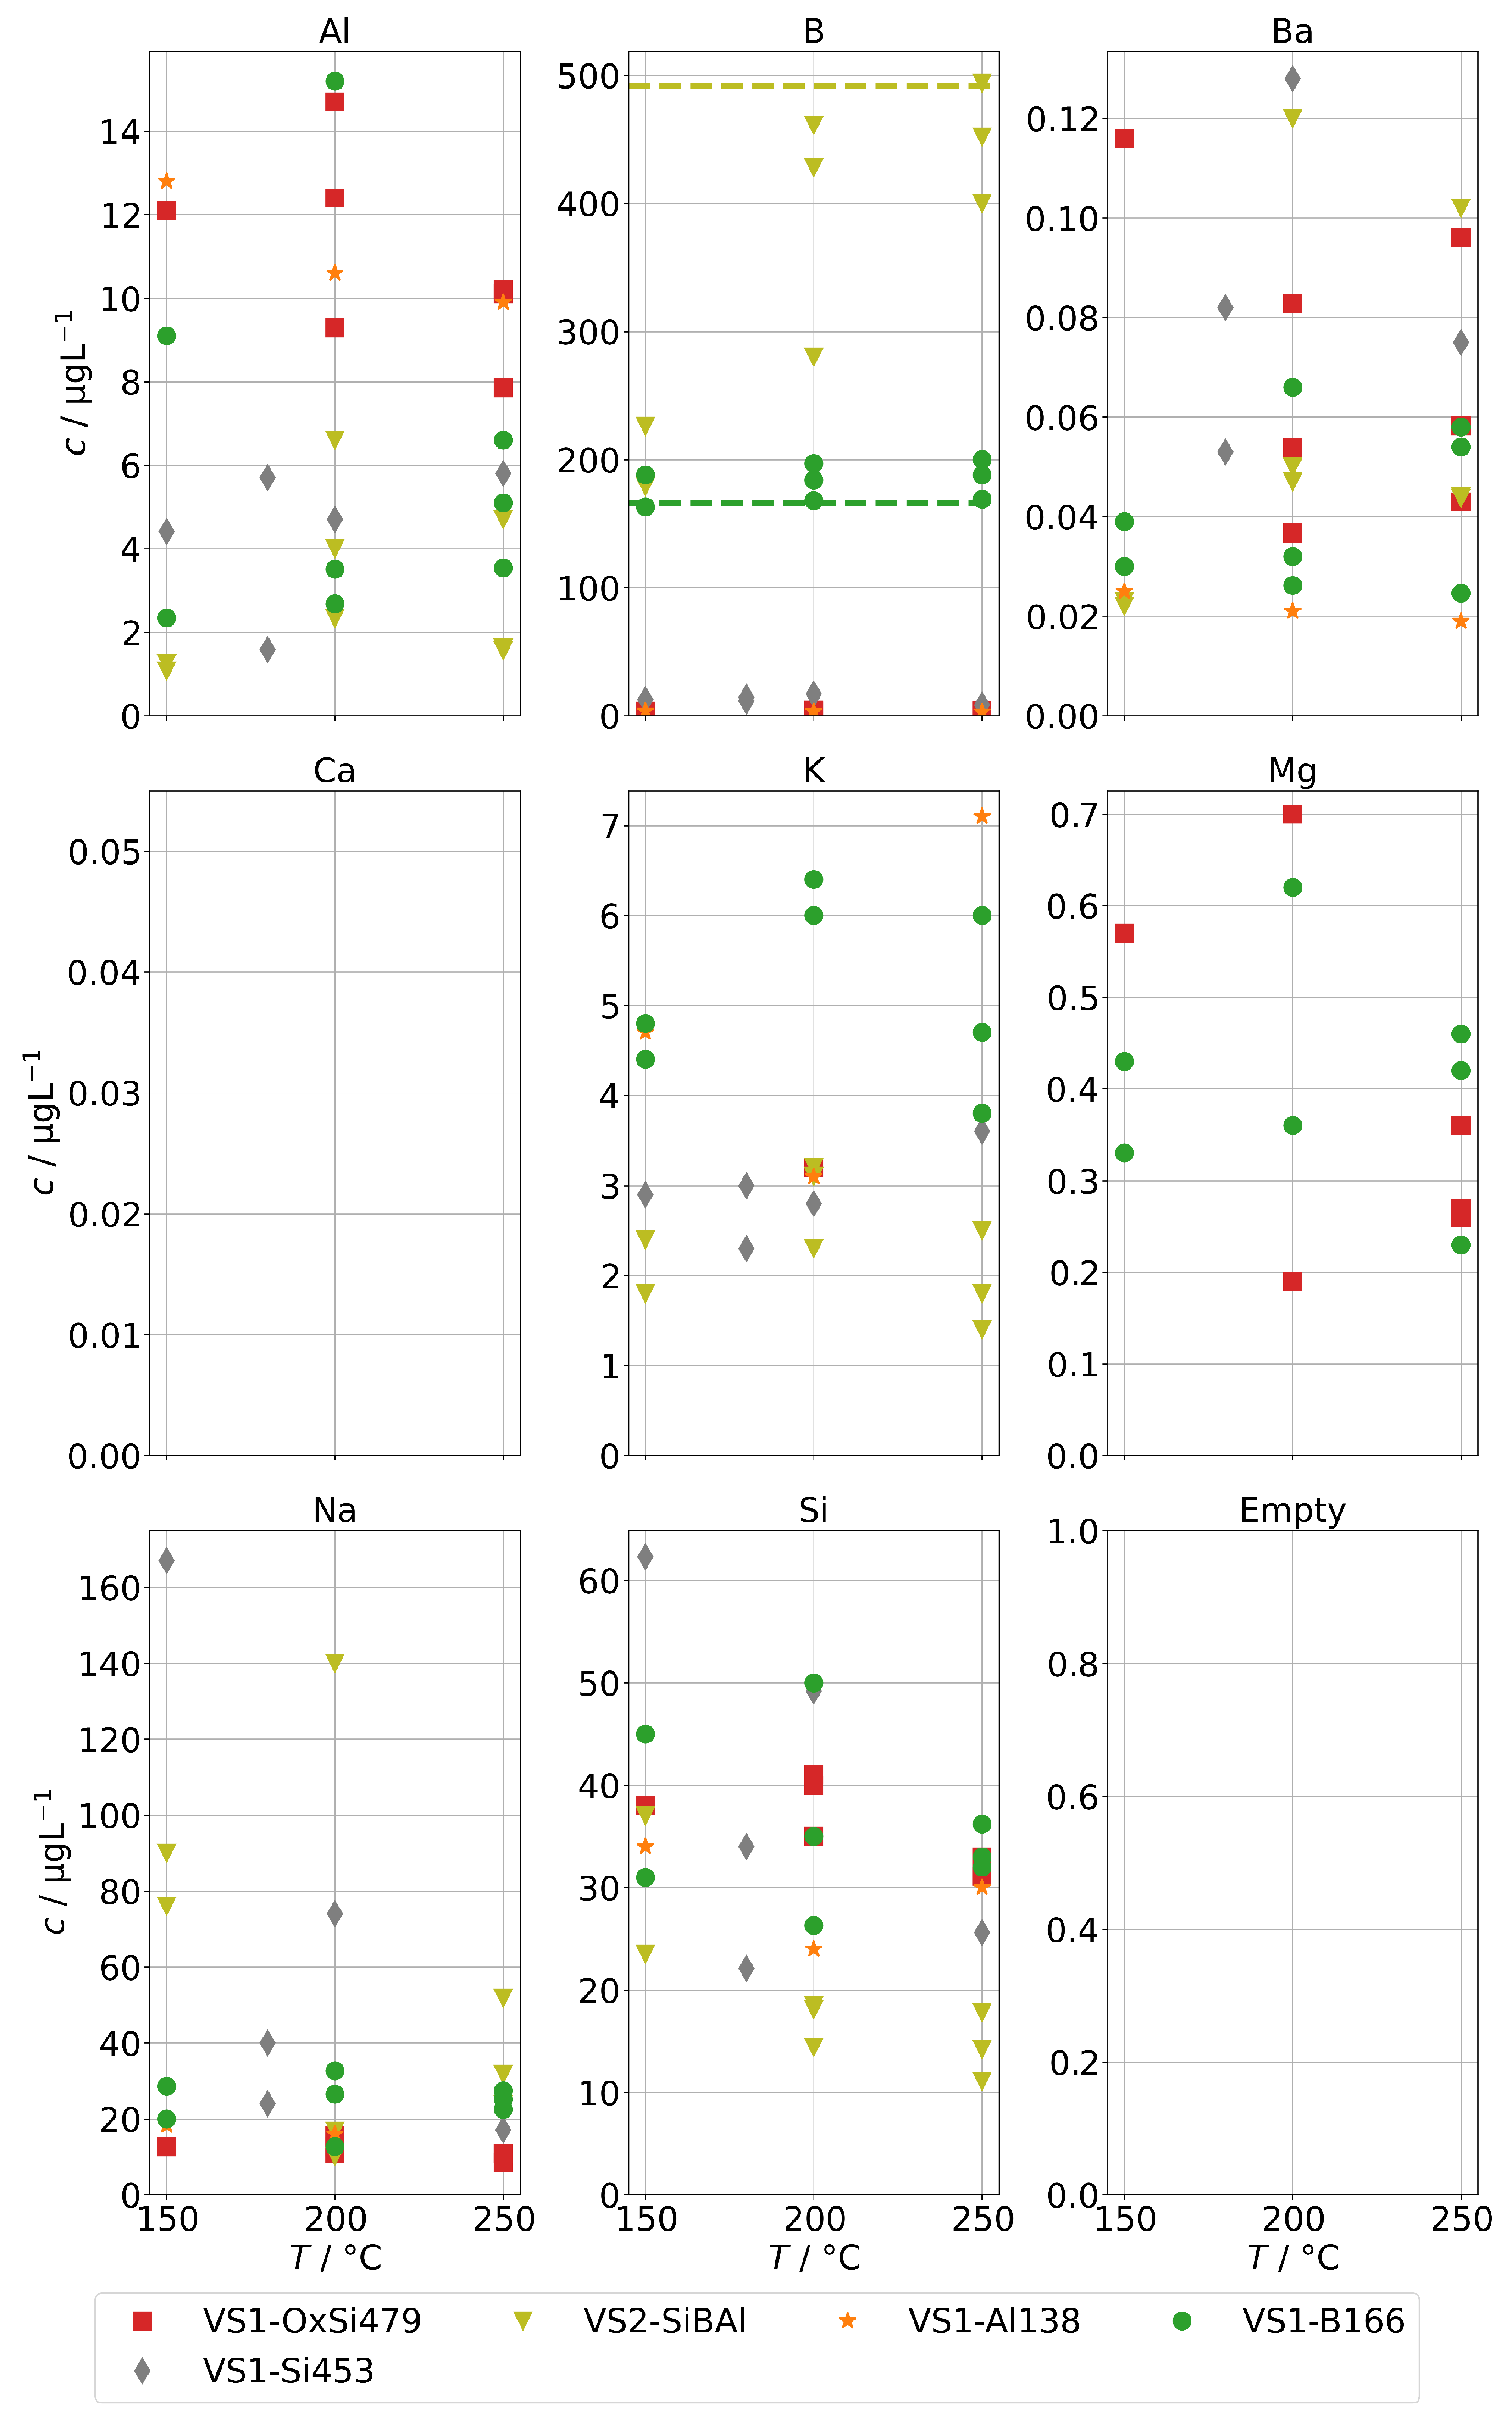
Finally, Figure 11 shows the concentrations for group B for the steam generator VS1 and VS2. We can also observe the complete volatilization of boric acid into the steam at 250 , but even at lower temperatures, about 200 were carried over. For Na and Si, we also observed a similar behavior to the AG-SG above, but since the operation temperature was limited to 250 , we cannot determine any increased chemical carryover of Si at high temperatures.
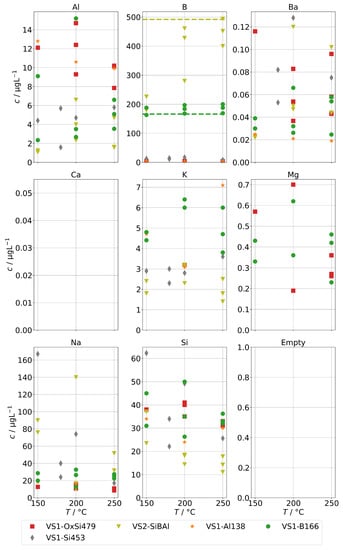
Figure 11.
Concentrations of quantifiable species in condensates of the SB-SG obtained with spiked feed-water (group B) in dependence of operation temperature. Dashed lines indicate feed-water concentrations (no concentrations above limit of detection for Ca).
3.6. Impurities Found in Condensates after Fuel Gas Preheater
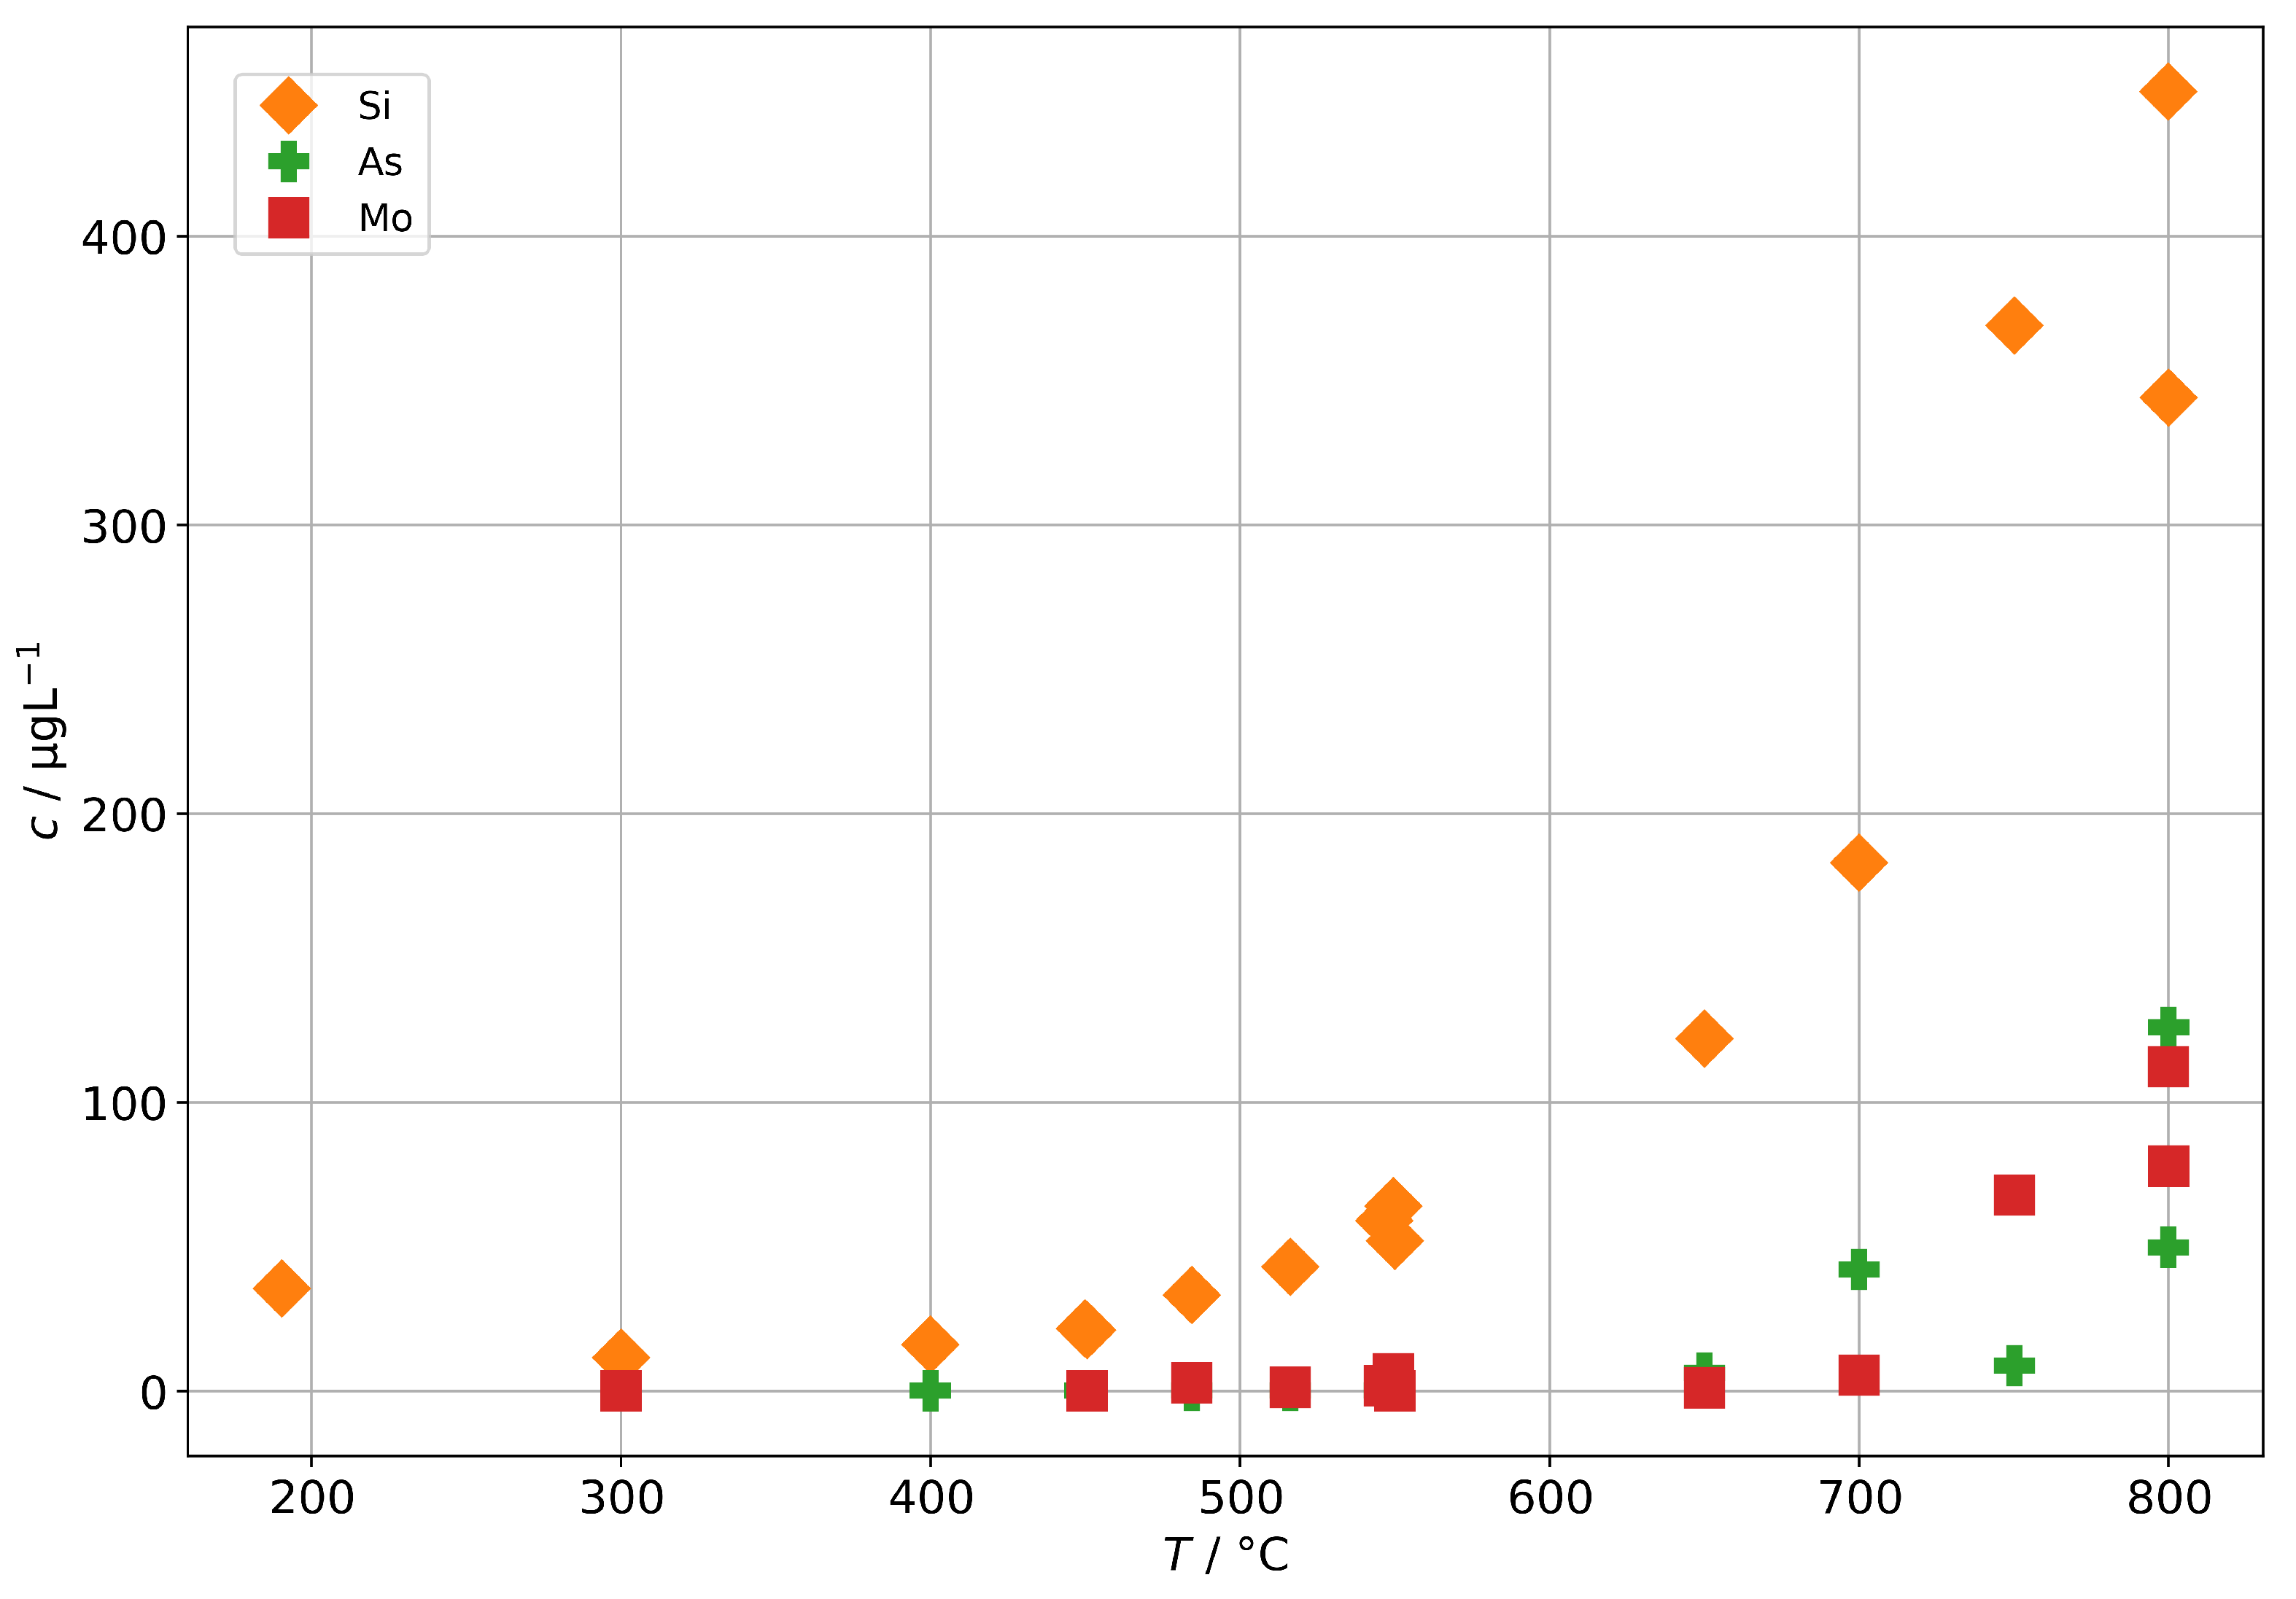
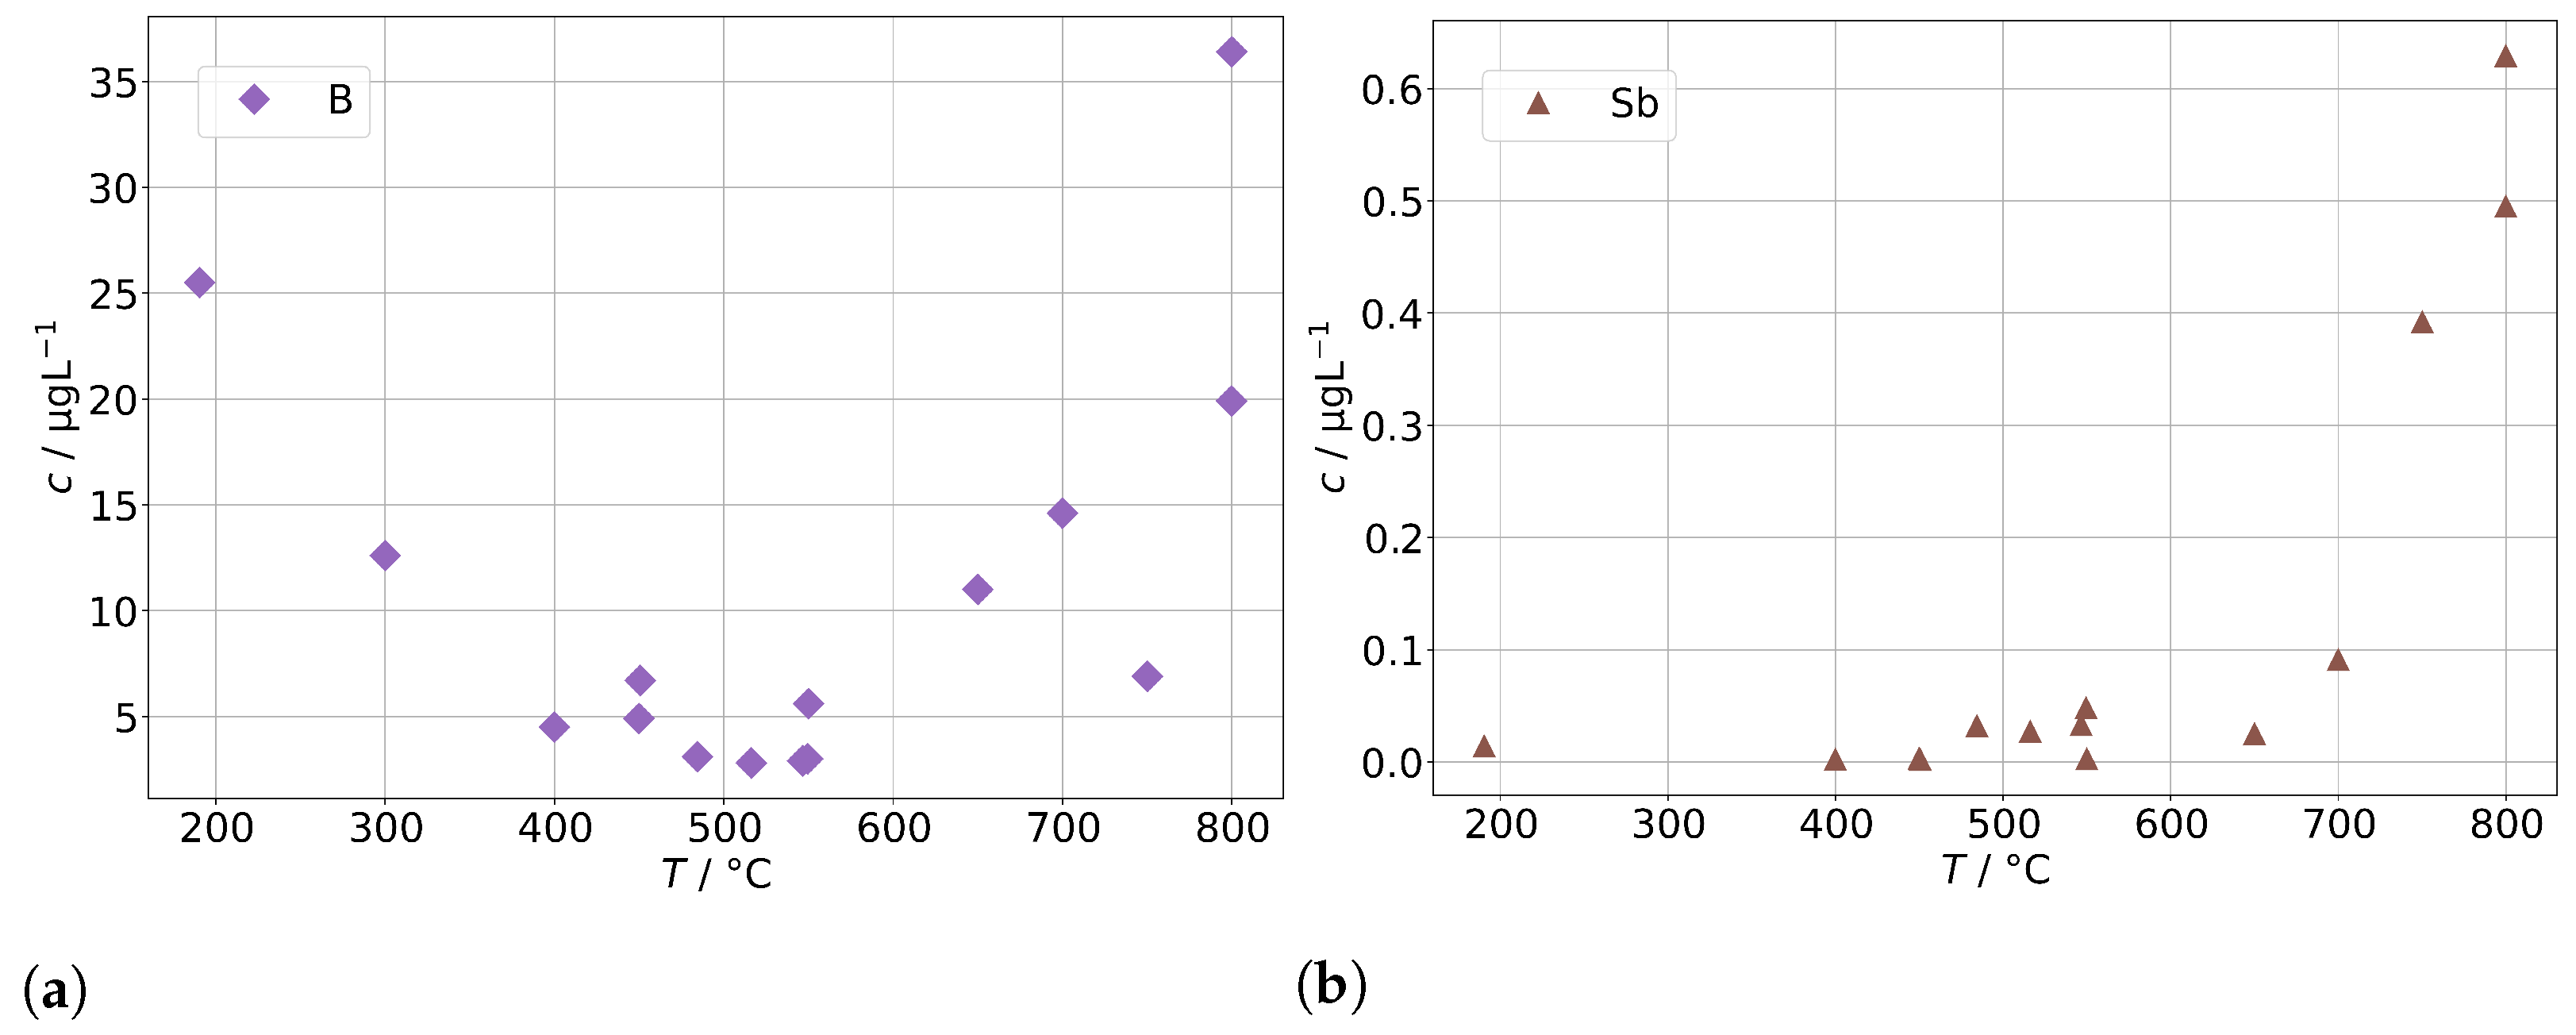
As a potential second source of impurities in solid-oxide steam electrolysis, we investigated the fuel gas preheater of a test rig, as described in Section 2.4, with operation temperatures between 190 to 800 and found elevated concentrations of silicon, arsenic, and molybdenum (shown in Figure 12) as well as boron and antimony (shown in Figure 13). At 300 , we find a silicon concentration of 12 , which is at the lower end of the background range established above for the other steam generators and without preheater. However, above 400 , the silicon concentration increases exponentially with temperature and reaches 450 at 800 , which is a common operation temperature in SOE stack experiments. A rough estimation based on typical operation parameters during steam electrolysis (0.5 to 1 , 70% steam conversion) and cell area in the stack yields that 100 to 200 of silicon may pass through the stack. At temperatures above 650 , we also observed an increase in As, Mo, B, and Sb. All these elements are a cause of concern for the degradation of solid-oxide cells, although their impact may depend on the exact species that is present in the steam.

Figure 12.
Concentrations of silicon, arsenic, and molybdenum in steam condensates obtained after the fuel gas preheater in dependence of the preheater operation temperature.
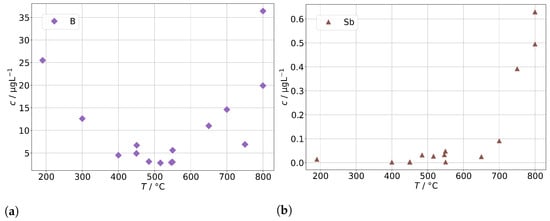
Figure 13.
Concentrations of (a) boron and (b) antimony in steam condensates obtained after the fuel gas preheater in dependence of the preheater operation temperature.
The origin of the silicon in the steam is expected to be quartz glass insulation used in the preheater. At high temperatures, the SiO reacts with steam to form volatile species [34], probably mainly Si(OH) in the given temperature range. It should be noted that this reaction is likely to be accelerated in a reductive atmosphere containing hydrogen in comparison to the oxidative atmosphere (containing Ar) that had to be used in this experiment for safety reasons. We assume that molybdenum is released in the form of MoO(OH) from stainless steel, which is used for the tubing and the casing of the preheater. Unfortunately, no specific source of origin for As and Sb could be identified in the construction materials so far. However, a potential source may be mica gaskets used for high-temperature seals, since naturally occuring mica is known to adsorb heavy metals, including arsenic species.
3.7. Cell Voltage Degradation at High Fuel Gas Preheater Temperatures
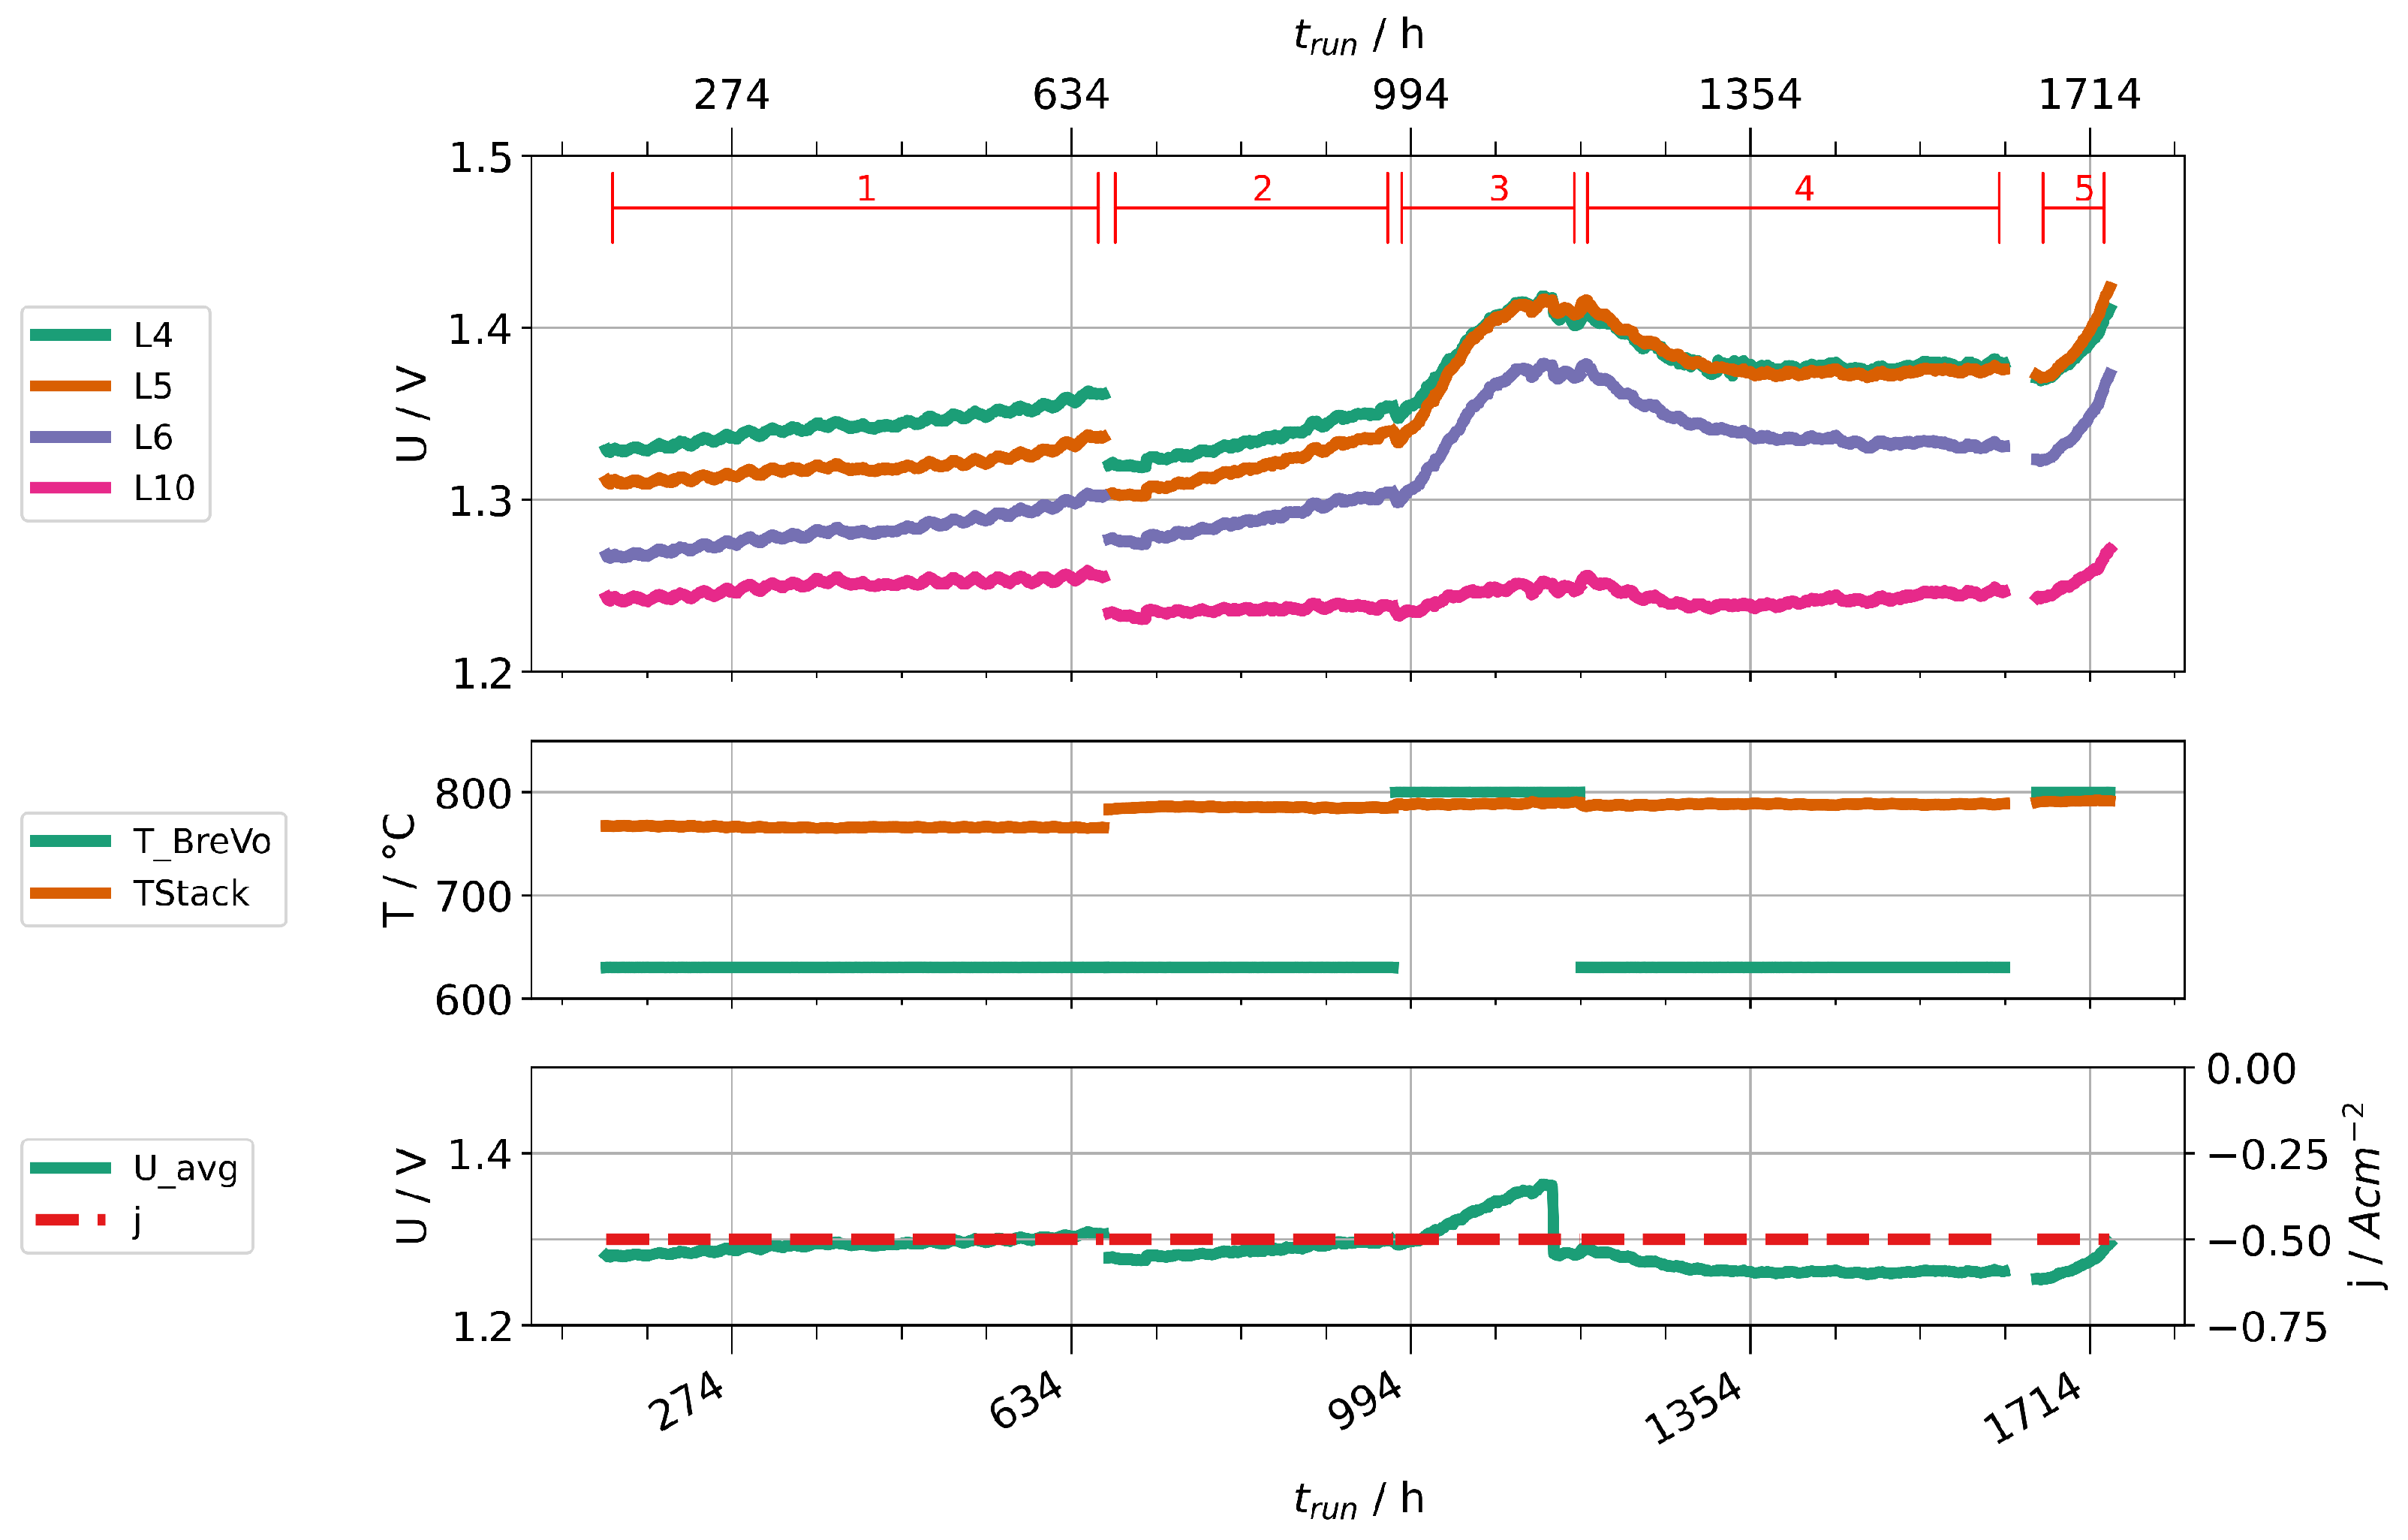
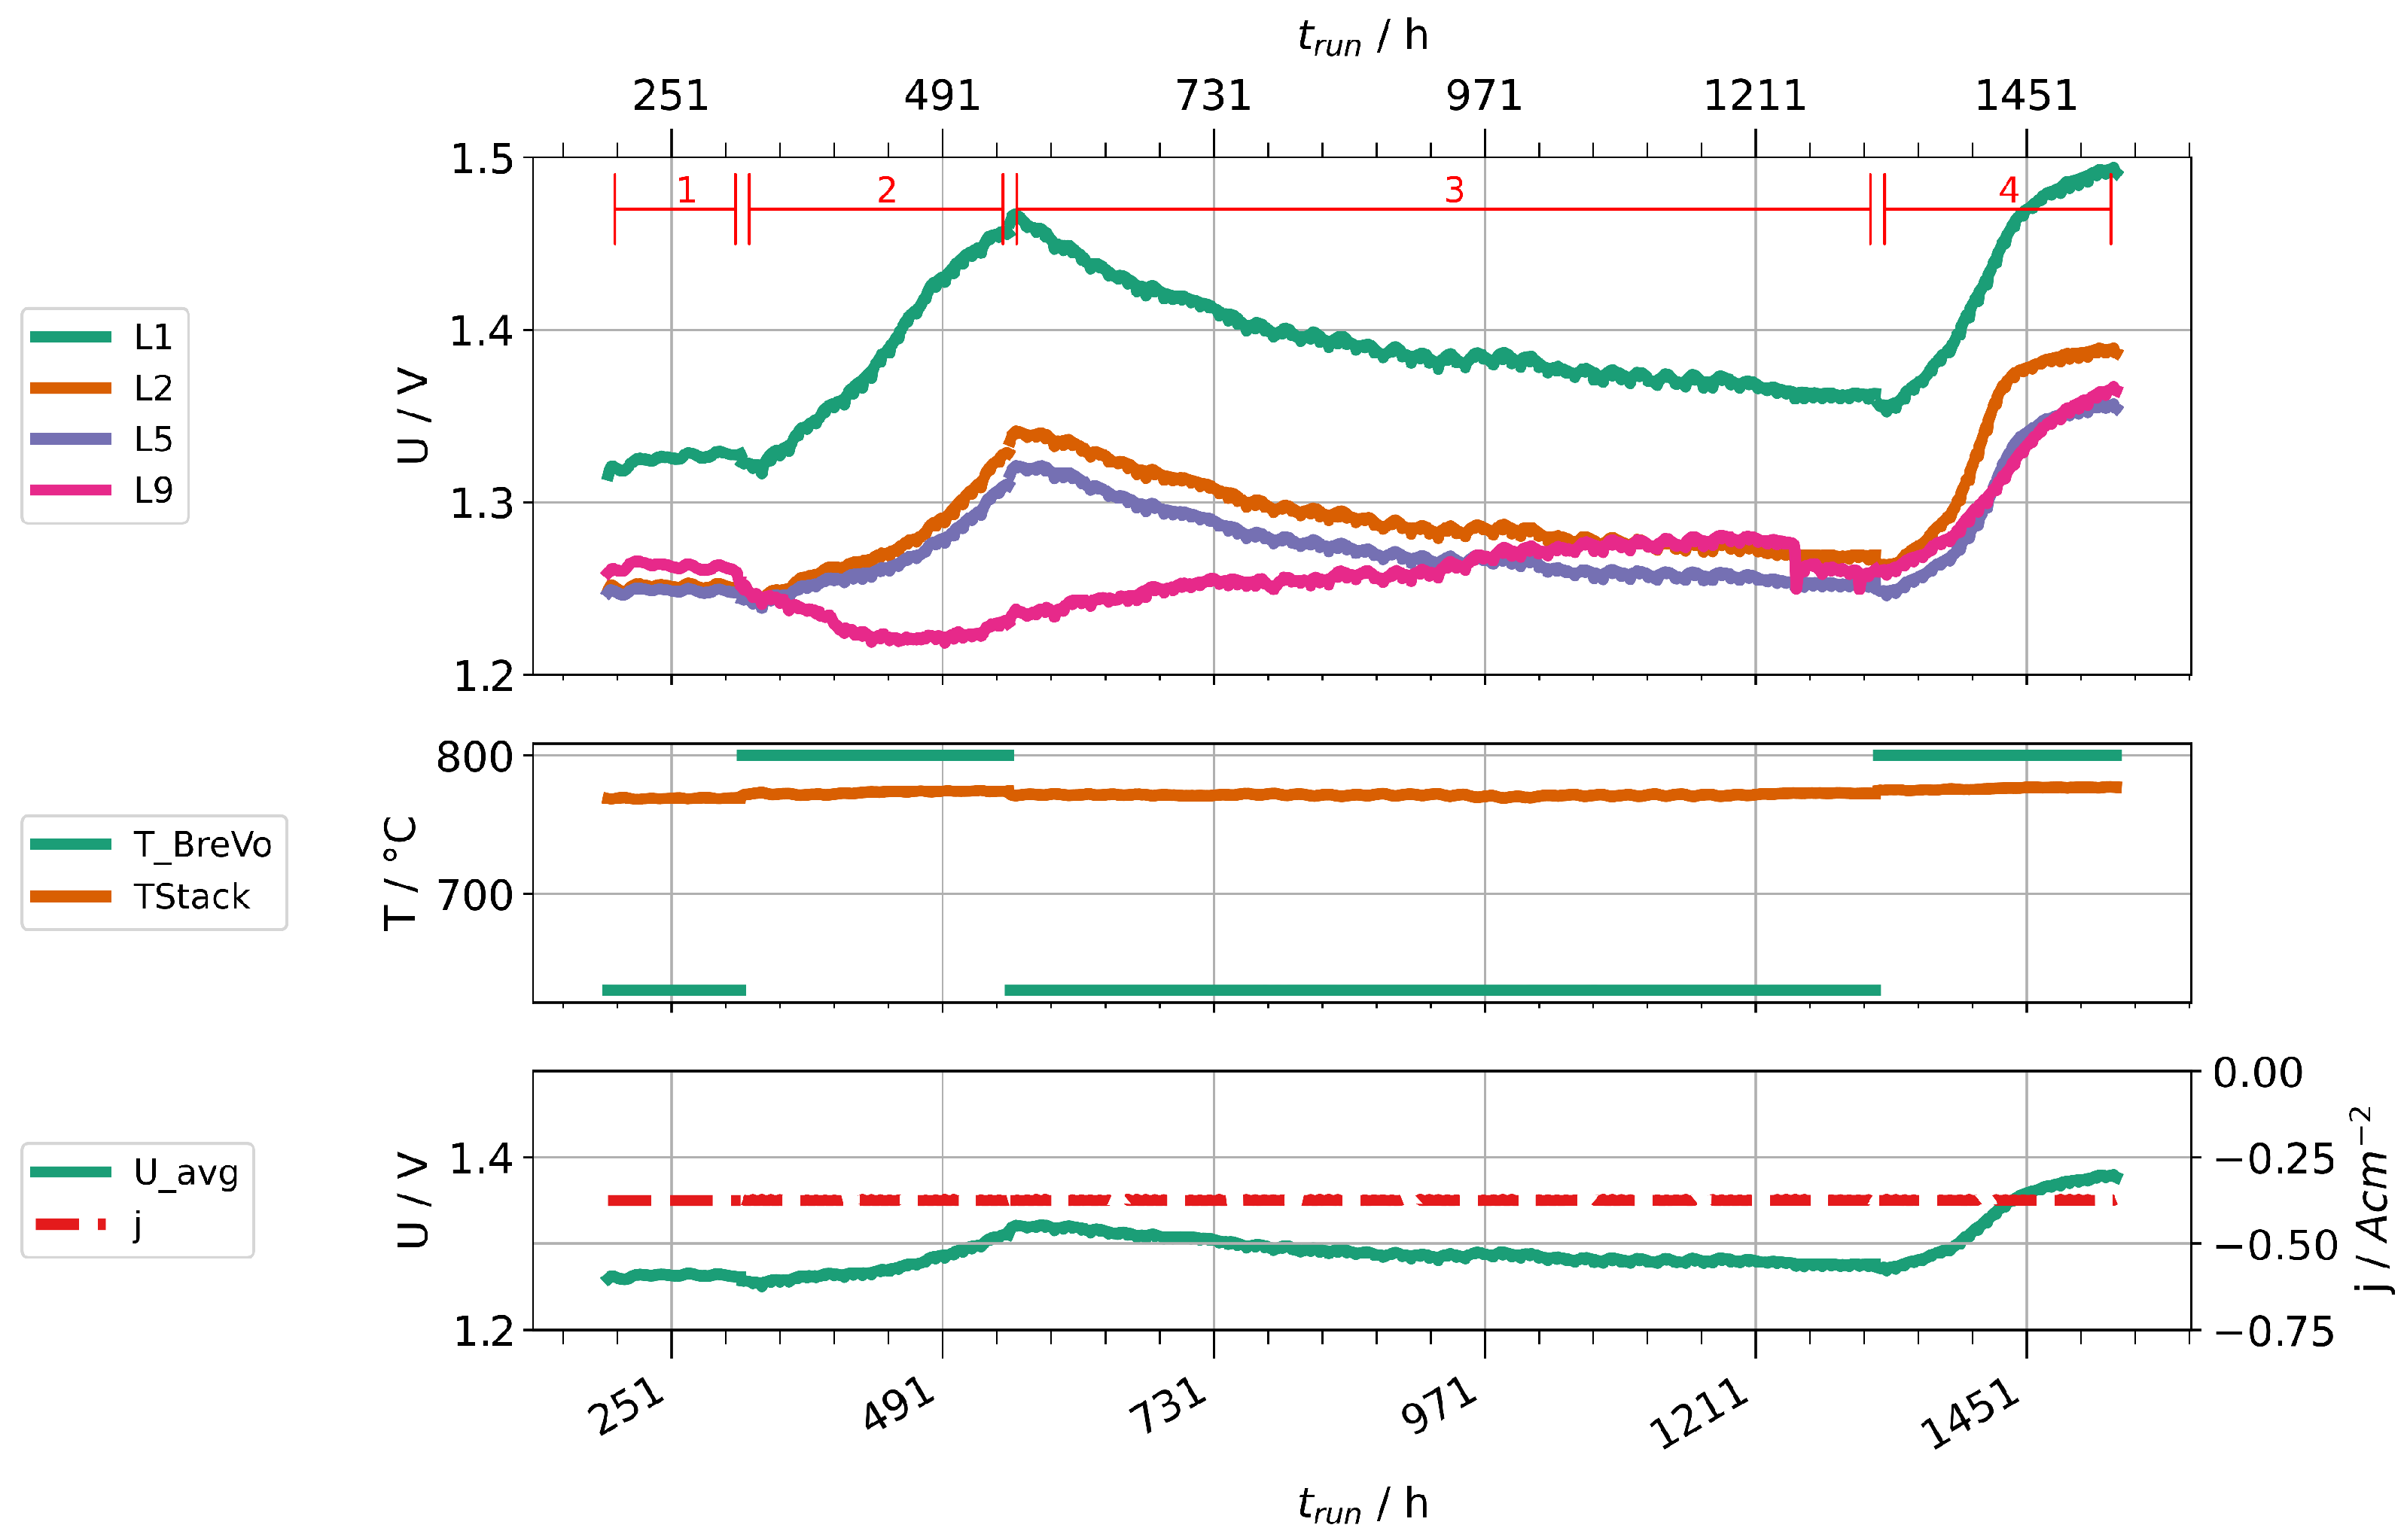
Given the high concentrations of impurities found in steam condensates at high fuel gas preheater temperatures, we performed two stack experiments to investigate their impact on cell degradation. Two stacks were operated with two different fuel gas preheater temperatures, 630 and 800 . Stack A was operated at a current density of and a steam conversion of 70%. Because of a leakage, Stack B had to be operated at lower current density ( ) and steam conversion (56 %). Figure 14 shows the time trace of the experiment with stack A, Figure 15 the one for stack B. Figure 14 shows only nine voltages, because layer one of the stack suffered an internal short-circuit during the experiment and was subsequently excluded. Both experiments start with a period of stationary operation with low preheater temperature to establish a baseline of cell deterioration. When the preheater temperature is increased, the layer voltages first drop slightly due to an increased stack temperature. After some hours, a clear increase of the rate of layer voltage increase can be observed. After about 200 h, the preheater temperatures were reduced again. Subsequently, a partial recovery of layer voltages could be observed. After a second increase of preheater temperatures, another rapid deterioration can be clearly seen. We then stopped the experiments and cooled the stacks.
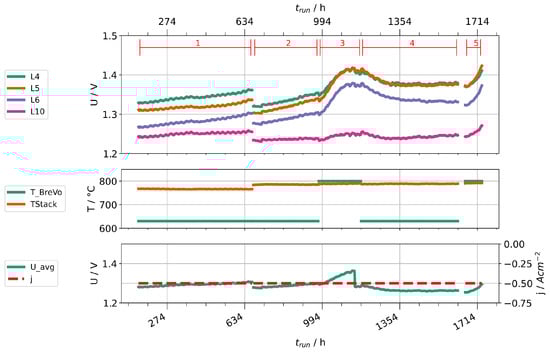
Figure 14.
Time traces showing layer voltages, current densities, stack temperatures, and preheater operation temperatures for stack A.
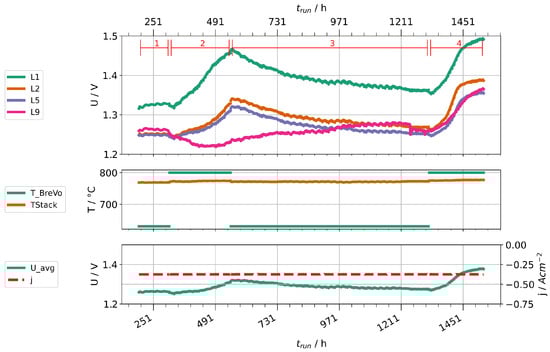
Figure 15.
Time traces showing layer voltages, current densities, stack temperatures, and preheater operation temperatures for stack B.
We would like to point out several observations in the following. First, not all voltages increase in the same amount and, especially in stack B, some are little affected. This may be caused by leakages of layers, which counteracts the consumption of steam by the electrolysis process. Since at least silicon and boron are steam-soluble, a high steam partial pressure could help to prevent impurities from depositing on surfaces. Second, the cell deterioration seems to be partially reversible when the cells are supplied with cleaner steam. This points either towards a revolatilization of impurities into the steam phase or an internal redistribution of detrimental impurities (e.g., by solid-phase diffusion) away from the triple-phase boundaries into the bulk of the material. However, it should be noted that the rate of voltage change seems to be steeper during the second phase of high preheater temperatures. Third, the rate of degradation seems to be leveling off after some time. This may also be explained by an equilibrium of deposition and transport away from TPB points. However, this needs to be confirmed by further experiments and properly studied by single cell experiments to localize deposited impurities and potential transport processes at different timescales in the cell.
Overall, we conclude that higher operation temperatures of the fuel gas preheater significantly impacted the cell performances in the two stacks. This was likely caused by impurities introduced into the steam. We expect the observed impact to be even larger if the preheater was operated at lower temperatures during baseline establishment instead of 630 . Secondly, we advise caution during short-term experiments, especially with low steam conversion, because it may well take some hours or even tens of hours until the impact of impurities is clearly visible.
3.8. Post-Test Examinations of Cells
After cooldown and stack disassembly, we took samples of the cells near the gas inlet and near the outlet from the layers 4, 5, and 10 from stack A and the layers 1, 2, and 9 from stack B. These were digested and elemental analysis was performed by ICP/OES as described in Section 2.8 to determine traces of contaminants.
For the dissolution of all oxidic cell materials, two digestions in series were needed. First, a digestion with perchlorate dissolved the components of the air electrode, the contact layer (air side), and the metallic nickel at the fuel-gas side. The rest of the cell (YSZ electrolyte, YSZ matrix of the fuel electrode, and GDC barrier layer) was dissolved during the second digestion with lithium borate. This allows for a degree of localization of contaminants, although it is possible that foreign phases at the fuel side do dissolve during the digestion with perchloric acid, if (a) they are not intimately mixed with YSZ or GDC, but do only adhere to such particles or (b) are alloying with nickel. By the same logic, the possibility exists that some foreign phases at the air electrode do not dissolve in perchloric acid. For this reason, we totalize the concentrations found in both digestions with the exception of boron, because the second digestions used lithium borate as reagent. However, because boron salts are generally well water-soluble, including boron trioxide, the concentrations found in the first digestion may be representative for the total boron concentration in the cells.
Several potential contaminants were found in the cells. Unfortunately, for most of them it is unclear what their origin is. In many cases, the source materials are the most likely origin. Therefore, and because our focus of interest was potential contaminations from the gas preheater, we concentrated mainly on Si, B, Mo, and Cr for comparison and intend to follow up on others (see Table A2 in Appendix A.3 within Supporting Material) with additional experiments at a later stage.
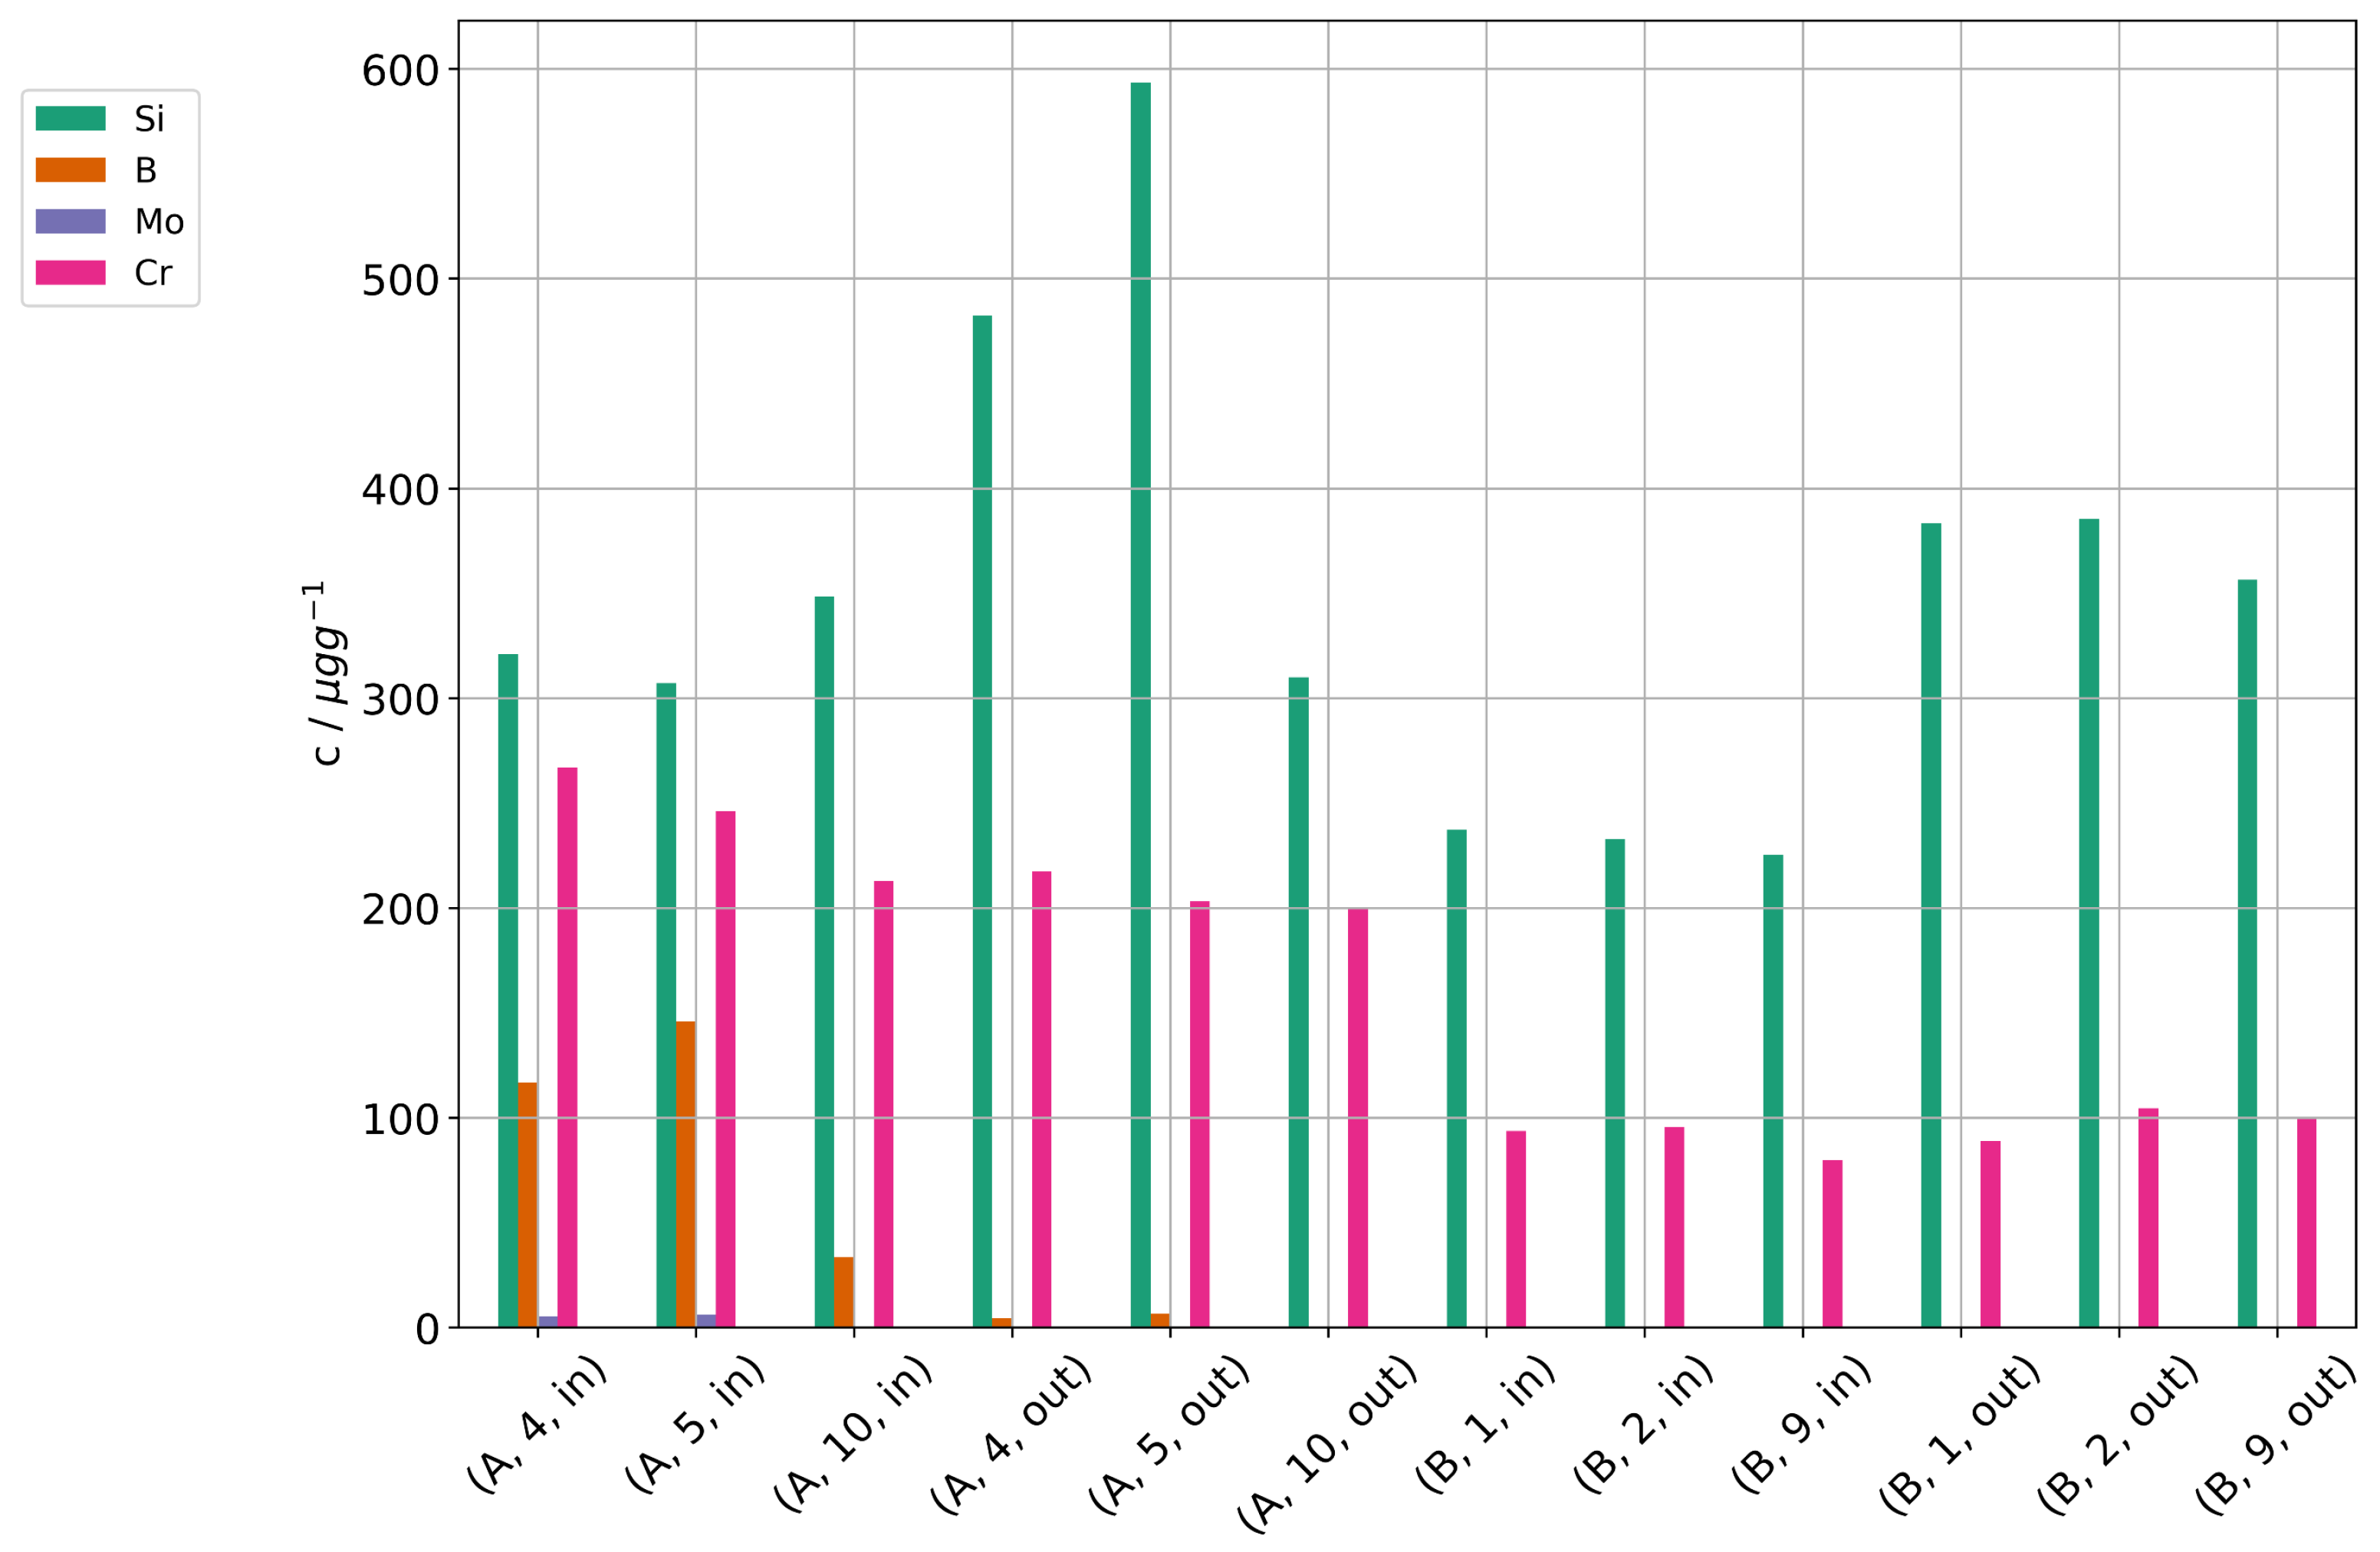
Figure 16 shows the concentrations of Si, B, Mo, and Cr in the cells of stacks A and B. Quantifiable amounts of silicon were found, and there is a gradient of silicon concentration in the direction from gas inlet to outlet. The gradient supports the assumption that silicon was introduced by the fuel gas stream. A higher concentration near the outlet sounds counterintuitive, because one might assume a high deposition near the inlet. However, silicic acid is steam-soluble and if we assume a physical deposition and not a chemical reaction with electrode materials, it will deposit where there is a strong gradient in steam partial pressure (i.e., a high steam consumption) leading to a low steam partial pressure and high concentrations of silicic acid. Near the gas entrance of the cell, the overall steam partial pressures still remain high, and the local concentrations of silicic acid low. Additionally, the temperature of this area is slightly lower, because the feed gases are colder than the stack. This causes a reduced local current density in comparison to other parts of the cells. In contrast, the temperatures in the stack were highest near the gas outlet, in part because the stack was operated in counter-flow mode. One should note here that we have to expect most deposition where there is the highest electrolysis activity, which also places it directly at the triple-phase boundary surfaces in the functional layer near the electrolyte and where the deposition of a non-conductive (electronically as well as ionically) particle causes maximum damage, even if the overall amount in the cell is low. Since any silicon deposition will reduce the local electrolysis activity and the steam consumption, the areas of high silicon deposition will also change over time and move along the cell as the current density shifts. Layer 10 in stack A is an exception and does not show the gradient of silicon concentration in direction from gas inlet to outlet. As noted above in Section 3.7, this layer degraded much less than the other layers in the stack and showed the lowest cell voltages. One explanation could be a leakage of layer 10 which allowed access of air, because the pressure on the air side of the stack was higher than on the fuel gas side. The reaction of oxygen with hydrogen would then have regenerated steam and caused a higher steam partial pressure along layer 10. The post-test examination of stack A confirmed a large leakage on the fuel gas side and showed a delamination of the air electrode near the fuel gas outlet. This damage likely reduced the current density in this area and could also have caused a leakage.

Figure 16.
Concentrations of silicon, boron, molybdenum, and chromium found in cell samples of the stacks A and B after operation.
Boron and molybdenum were found in the cells of stack A with highest concentration near the cell inlet, both lower than the silicon concentrations. This matches the much lower concentrations found in the steam condensate analyses. However, they show a different deposition profile with higher concentrations near the gas inlet. This may point towards a reaction of B and Mo with the electrode materials and not just a physical deposition due to the steam gradient.
When comparing the two stacks, higher concentrations of trace contaminants were found in stack A (including some not shown here). While the operation time at high preheater temperatures were similar at both stacks, the current density and conversion ratio at stack A was significantly higher. We think this is a likely reason for the high concentrations, because the higher steam consumption causes steeper steam gradients along the cell and higher local concentrations of contaminants in the remaining steam, thus exacerbating cell degradation at higher conversion ratios.
Chromium was detected nearly without gradient along the cells, although at different levels for both stacks. The steel components of the test rig and the interconnects in the stack are the most likely source for Cr. In our opinion, the nearly constant concentration of Cr along the cells suggests that the interconnects right next to the cells are a significant source of Cr.
4. Conclusions
It was shown that direct electrical steam generators used for solid-oxide electrolysis experiments exhibit significant carryover that are strongly dependent on their operation conditions. For most contaminants this can be explained predominantly by a physical carryover. Steam-soluble species such as boric acid show a nearly total volatilization due to vaporous carryover during evaporation of the feed-water. In the case of silica, some volatilization should be expected as well. In the case of unstable evaporation (e.g., overload, temperature transients) in steam generators, a significant amount of trace contaminants should be expected to be present in the steam. This is especially the case for acidic feed-waters and steam generators containing deposits from previous operation. The effect may explain singular damaging events in past electrolysis experiments.
The operation of electrical gas preheaters with silicon-containing electrical insulation at high temperatures in presence of steam may release high levels of silicon into the feed gas stream. This was shown to accelerate the degradation of solid-oxide cells in steam electrolysis mode vastly.
Chemical post-test analyses of cell samples of two stacks operated in steam electrolysis mode with high gas preheater temperatures showed high levels of silicon contamination in the samples. This confirms our hypothesis that the greatly increased performance degradation during electrolysis was mainly caused by silicon contamination in the feed gases, although other contaminants may also play a role.
Author Contributions
Conceptualization, D.S.; data curation, D.S.; funding acquisition, L.B.; investigation, D.S., L.Q. and V.N.; methodology, D.S. and L.Q.; project administration, Q.F. and L.B.; software, D.S.; supervision, Q.F. and D.S.; visualization, D.S.; writing—original draft, D.S.; writing—review and editing, D.S. All authors have read and agreed to the published version of the manuscript.
Funding
This research was funded by the German Federal Ministry of Education and Research (BMBF) grant number 03SFK2Z0-2.
Institutional Review Board Statement
Not applicable.
Informed Consent Statement
Not applicable.
Data Availability Statement
Not applicable.
Acknowledgments
The authors would like to thank all their colleagues engaged in SOC development at Jülich, in particular our colleagues from the institute ZEA-1 for the stack assembly and disassembly and Daniela Gesekus, Astrid Küppers, Nadine Wettengl, Frederic Finke from the institute ZEA-3 for the chemical analyses of steam condensates and cell samples.
Conflicts of Interest
The authors have no conflict of interest to declare. The funders had no role in the design of the study; in the collection, analyses, or interpretation of data; in the writing of the manuscript, or in the decision to publish the results.
Abbreviations
The following abbreviations and symbols are used in this manuscript:
| 8YSZ | 8 mol-% yttria-stabilized zirconia |
| APS | Atmospheric plasma spraying |
| CGO | Ce0.8Gd0.2O1.9 |
| CR | Net conversion ratio (utilization) of HO and CO |
| DC | Direct current |
| EDX | Energy-dispersive X-ray spectroscopy |
| GDC | Ce0.8Gd0.2O1.9 |
| GHG | Greenhouse gases |
| HT | High temperature |
| j | Current density [ cm] |
| ICP-MS | Inductively coupled plasma–mass spectrometry |
| ICP-OES | Inductively coupled plasma–optical emission spectrometry |
| LCC10 | LaMn0.45Co0.35Cu0.2O3 |
| LQ | Limit of quantification |
| LPR | Linear polarization resistance |
| LSCF | La0.58Sr0.4Co0.2Fe0.8O |
| MCF | MnCo1.9Fe0.1O4 |
| MFC | Mass flow controller |
| ND | Not determined |
| P2X | Power-to-X |
| Pr | Power relative to nominal stack power |
| pn | Standard reference pressure |
| RWGS | Reverse water–gas shift |
| RLPR | Instantaneous slope of the U–j curve [ cm] |
| SEM | Scanning electron microscope |
| SG | Steam generator |
| SOEC | Solid-oxide electrolysis cell |
| syngas | Synthesis gas |
| Tn | Standard reference temperature |
| TBreVo | Temperature of fuel gas preheater |
| Uth | Thermoneutral voltage |
| YSZ | Yttria-stabilized zirconia |
Appendix A. Supplementary Material
Appendix A.1. Mechanical Carryover
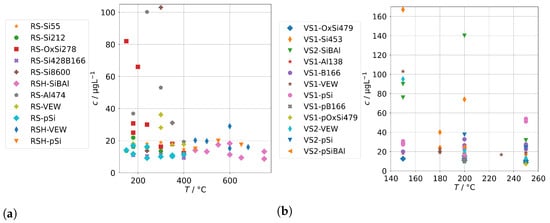
Figure A1.
Sodium concentrations in steam condensates (includes clean and spiked feed-waters): (a) for the AG-SG; (b) for the two SB-SGs.
Figure A1.
Sodium concentrations in steam condensates (includes clean and spiked feed-waters): (a) for the AG-SG; (b) for the two SB-SGs.
Appendix A.2. Concentrations in Spiked Feed-Waters
Table A1.
Concentrations in determined in spiked feed-waters.
Table A1.
Concentrations in determined in spiked feed-waters.
| Series | As | Bi | Co | Cr | Cu | Fe | Mn | Mo | Ni | Sb | W | Zn | Al | B | Ba | Ca | K | Mg | Na | Si |
|---|---|---|---|---|---|---|---|---|---|---|---|---|---|---|---|---|---|---|---|---|
| RS-Si8600 | ND | ND | 0.00 | 0.05 | 0.04 | 0.36 | 0.02 | 0.28 | 2.80 | 0.04 | 0.05 | 0.08 | 3.90 | 0.59 | 0.02 | 0.90 | ND | ND | 19,300.00 | 8600.00 |
| RS-ACl | ND | ND | ND | ND | ND | ND | ND | ND | ND | ND | ND | ND | ND | ND | ND | ND | ND | ND | ND | ND |
| RS-Al474 | ND | ND | 0.00 | 0.04 | 0.07 | 0.28 | ND | 0.01 | 4.06 | 0.04 | 0.01 | 0.31 | 474.00 | 1.90 | 0.01 | 3.40 | ND | ND | 5.43 | 15.80 |
| RS-OxSi278 | ND | 0.00 | 0.00 | 0.08 | 0.04 | 1.30 | 0.02 | 0.30 | 7.27 | 0.10 | 0.04 | 0.15 | 7.90 | 0.97 | 0.02 | 3.50 | ND | ND | 510.00 | 278.00 |
| RS-Si428B166 | ND | 0.00 | 0.00 | 0.03 | 0.05 | ND | 0.01 | 0.03 | 5.44 | 0.09 | 0.03 | ND | 2.16 | 166.00 | 0.01 | 4.40 | ND | ND | 940.00 | 428.00 |
| RS-Si55 | ND | ND | ND | 0.01 | ND | 0.20 | ND | 0.01 | 4.38 | ND | 0.12 | ND | 1.00 | 0.40 | ND | ND | ND | ND | 117.00 | 54.70 |
| RS-Si212 | ND | ND | ND | 0.01 | ND | 0.20 | ND | 0.03 | 5.14 | ND | 0.11 | ND | 1.00 | 0.40 | ND | ND | ND | ND | 503.00 | 212.00 |
| VS1-ACl | ND | ND | ND | ND | ND | ND | ND | ND | ND | ND | ND | ND | ND | ND | ND | ND | ND | ND | ND | ND |
| VS1-Al138 | ND | ND | ND | 0.01 | 0.04 | ND | 0.00 | 0.08 | 3.96 | 0.03 | ND | 0.39 | 138.00 | 0.43 | 0.01 | ND | 3.20 | ND | 7.70 | 14.20 |
| VS1-B166 | ND | ND | ND | ND | ND | 0.17 | ND | 0.01 | 5.23 | ND | 0.02 | ND | 1.64 | 166.00 | ND | ND | 3.20 | 0.27 | 6.80 | 19.00 |
| VS1-OxSi479 | ND | ND | ND | ND | ND | 0.49 | ND | 0.05 | 5.29 | ND | 0.04 | 0.89 | 5.43 | ND | 0.01 | ND | ND | 0.62 | 1084.00 | 479.00 |
| VS1-Si453 | ND | ND | ND | 0.02 | 0.01 | 1.02 | 0.01 | 0.05 | 3.27 | 0.03 | ND | 0.19 | 1.15 | 0.60 | 0.01 | ND | 2.80 | ND | 1040.00 | 453.00 |
| VS2-SiBAl | ND | ND | ND | 0.03 | 0.05 | ND | 0.01 | 0.05 | 3.41 | 0.04 | ND | 0.41 | 292.00 | 492.00 | 0.01 | ND | ND | ND | 2070.00 | 850.00 |
| RSH-SiBAl | ND | ND | ND | 0.02 | 0.07 | 0.10 | 0.01 | 0.02 | 3.95 | 0.04 | 0.03 | 0.79 | 419.00 | 509.30 | 0.03 | 10.50 | 1.32 | 0.59 | 1050.00 | 472.00 |
Appendix A.3. Concentrations in Spiked Feed-Waters
Table A2.
Concentrations in determined in cell samples after operation (boron from perchlorate digestion only, Mn(AS) from perchlorate digestion, Mn(FS) from digestion with lithium borate, other species as sum of both).
Table A2.
Concentrations in determined in cell samples after operation (boron from perchlorate digestion only, Mn(AS) from perchlorate digestion, Mn(FS) from digestion with lithium borate, other species as sum of both).
| Stack | Layer | Position | Al | B | Ba | Ca | Cr | Cu | Hf | Mg | Mn(AS) | Mo | Si | Ti | Zn | Mn(FS) |
|---|---|---|---|---|---|---|---|---|---|---|---|---|---|---|---|---|
| A | 4 | in | 406.72 | 116.79 | 91.91 | 77.49 | 267.09 | 3740.23 | 5561.08 | 29.45 | 8987.00 | 5.43 | 320.91 | 252.87 | 10.16 | 126.43 |
| 5 | in | 410.25 | 146.00 | 93.73 | 74.62 | 246.22 | 3853.06 | 4644.00 | 32.08 | 9180.58 | 6.24 | 307.15 | 255.74 | 8.00 | 106.71 | |
| 10 | in | 404.82 | 33.46 | 93.42 | 77.62 | 212.86 | 3194.37 | 5237.96 | 66.46 | 7639.90 | <1 | 348.58 | 250.05 | 9.43 | 203.57 | |
| B | 1 | in | 392.08 | <20 | 37.20 | ND | 93.72 | 1835.13 | 5450.89 | ND | 3887.35 | <2 | 237.16 | ND | 61.20 | 377.74 |
| 2 | in | 364.10 | <20 | 83.34 | ND | 95.46 | 4978.85 | 4964.39 | ND | 12,678.89 | <2 | 232.85 | ND | 86.78 | 370.97 | |
| 9 | in | 403.50 | <20 | 43.81 | ND | 79.83 | 417.71 | 5868.42 | ND | 1214.51 | <2 | 225.26 | ND | 53.18 | 516.13 | |
| A | 4 | out | 401.40 | 4.41 | 96.57 | 93.00 | 217.39 | 3760.83 | 4956.32 | 62.40 | 9192.43 | <1 | 482.47 | 245.61 | 7.71 | 250.38 |
| 5 | out | 386.20 | 6.70 | 91.73 | 71.16 | 203.11 | 4774.14 | 4422.16 | 56.78 | 11,451.97 | <1 | 593.31 | 245.80 | 9.10 | 422.96 | |
| 10 | out | 378.92 | <1 | 102.20 | 52.72 | 199.98 | 2937.68 | 4477.73 | 65.31 | 7158.99 | <1 | 309.93 | 241.30 | 9.59 | 406.97 | |
| B | 1 | out | 378.54 | <20 | 74.31 | ND | 88.79 | 4137.77 | 5191.14 | ND | 10,197.21 | <2 | 383.21 | ND | 84.87 | 495.37 |
| 2 | out | 384.51 | <20 | 84.07 | ND | 104.56 | 3262.90 | 5245.31 | ND | 8411.63 | <2 | 385.42 | ND | 77.99 | 553.64 | |
| 9 | out | 385.53 | <20 | 98.42 | ND | 100.36 | 3044.94 | 4913.05 | ND | 12,837.37 | <2 | 356.54 | ND | 72.84 | 570.34 |
References
- Peters, R.; Tiedemann, W.; Hoven, I.; Deja, R.; Kruse, N.; Fang, Q.; Blum, L.; Peters, R. Development of a 10/40kW-Class Reversible Solid Oxide Cell System at Forschungszentrum Jülich. ECS Trans. 2021, 103, 289–297. [Google Scholar] [CrossRef]
- Schäfer, D. Syngas production performance and degradation analysis of a solid oxide electrolyzer stack. J. Power Source 2019, 433, 126666. [Google Scholar] [CrossRef]
- Theuer, T.; Schäfer, D.; Dittrich, L.; Nohl, M.; Foit, S.; Blum, L.; Eichel, R.; de Haart, L.G.J. Sustainable Syngas Production by High-Temperature Co-electrolysis. Chem. Ing. Tech. 2020, 92, 40–44. [Google Scholar] [CrossRef] [Green Version]
- Küngas, R.; Blennow, P.; Heiredal-Clausen, T.; Holt, T.; Rass-Hansen, J.; Primdahl, S.; Hansen, J.B. eCOs—A Commercial CO2 Electrolysis System Developed by Haldor Topsoe. ECS Trans. 2017, 78, 2879–2884. [Google Scholar] [CrossRef]
- Loewert, M.; Hoffmann, J.; Piermartini, P.; Selinsek, M.; Dittmeyer, R.; Pfeifer, P. Microstructured Fischer-Tropsch Reactor Scale-up and Opportunities for Decentralized Application. Chem. Eng. Technol. 2019, 42, 2202–2214. [Google Scholar] [CrossRef]
- Kirsch, H.; Lochmahr, N.; Staudt, C.; Pfeifer, P.; Dittmeyer, R. Production of CO2-neutral liquid fuels by integrating Fischer-Tropsch synthesis and hydrocracking in a single micro-structured reactor: Performance evaluation of different configurations by factorial design experiments. Chem. Eng. J. 2020, 393, 124553. [Google Scholar] [CrossRef]
- Petipas, F.; Fu, Q.; Brisse, A.; Bouallou, C. Transient operation of a solid oxide electrolysis cell. Int. J. Hydrogen Energy 2013, 38, 2957–2964. [Google Scholar] [CrossRef]
- Schefold, J.; Brisse, A.; Surrey, A.; Walter, C. 80,000 current on/off cycles in a one year long steam electrolysis test with a solid oxide cell. Int. J. Hydrogen Energy 2019, 45, 5143–5154. [Google Scholar] [CrossRef]
- Schäfer, D.; Janßen, T.; Fang, Q.; Merten, F.; Blum, L. System-Supporting Operation of Solid-Oxide Electrolysis Stacks. Energies 2021, 14, 544. [Google Scholar] [CrossRef]
- Hauch, A.; Küngas, R.; Blennow, P.; Hansen, A.B.; Hansen, J.B.; Mathiesen, B.V.; Mogensen, M.B. Recent advances in solid oxide cell technology for electrolysis. Science 2020, 370, eaba6118. [Google Scholar] [CrossRef]
- Trembly, J.; Gemmen, R.; Bayless, D. The effect of IGFC warm gas cleanup system conditions on the gas–solid partitioning and form of trace species in coal syngas and their interactions with SOFC anodes. J. Power Source 2007, 163, 986–996. [Google Scholar] [CrossRef] [Green Version]
- Wang, F.; Yamaji, K.; Cho, D.H.; Shimonosono, T.; Kishimoto, H.; Brito, M.E.; Horita, T.; Yokokawa, H. Effect of strontium concentration on sulfur poisoning of LSCF cathodes. Solid State Ionics 2012, 225, 157–160. [Google Scholar] [CrossRef]
- Hauch, A.; Brodersen, K.; Chen, M.; Graves, C.; Jensen, S.H.; Jørgensen, P.S.; Hendriksen, P.V.; Mogensen, M.B.; Ovtar, S.; Sun, X. A Decade of Solid Oxide Electrolysis Improvements at DTU Energy. ECS Trans. 2017, 75, 3–14. [Google Scholar] [CrossRef] [Green Version]
- Sasaki, K.; Haga, K.; Yoshizumi, T.; Minematsu, D.; Yuki, E.; Liu, R.; Uryu, C.; Oshima, T.; Ogura, T.; Shiratori, Y.; et al. Chemical durability of Solid Oxide Fuel Cells: Influence of impurities on long-term performance. J. Power Source 2011, 196, 9130–9140. [Google Scholar] [CrossRef]
- Hauch, A.; Jensen, S.H.; Bilde-Sørensen, J.B.; Mogensen, M. Silica Segregation in the Ni/YSZ Electrode. J. Electrochem. Soc. 2007, 154, A619. [Google Scholar] [CrossRef] [Green Version]
- Bucher, E.; Gspan, C.; Hofer, F.; Sitte, W. Post-test analysis of silicon poisoning and phase decomposition in the SOFC cathode material La0.58Sr0.4Co0.2Fe0.8O3−δ by transmission electron microscopy. Solid State Ionics 2013, 230, 7–11. [Google Scholar] [CrossRef]
- Svoboda, R. Procedures for the Measurement of Carryover of Boiler Water into Steam; Technical Guidance Document TGD1-08; International Association for the Properties of Water and Steam: Berlin, Germany, 2008. [Google Scholar]
- Buecker, B. Fundamentals of Steam Generation Chemistry; PennWell Corp: Tulsa, OK, USA, 2000. [Google Scholar]
- Merritt, C. Process Steam Systems: A Practical Guide for Operators, Maintainers, and Designers; John Wiley & Sons Inc.: Hoboken, NJ, USA, 2015. [Google Scholar]
- Sasaki, K.; Haga, K.; Yoshizumi, T.; Minematsu, D.; Yuki, E.; Liu, R.R.; Uryu, C.; Oshima, T.; Taniguchi, S.; Shiratori, Y.; et al. Impurity Poisoning of SOFCs. ECS Trans. 2011, 35, 2805–2814. [Google Scholar] [CrossRef]
- Chen, K.; Ai, N.; Jiang, S.P. Chemical Compatibility between Boron Oxides and Electrolyte and Cathode Materials of Solid Oxide Fuel Cells. Fuel Cells 2013, 13, 1101–1108. [Google Scholar] [CrossRef]
- Hauch, A. Solid Oxide Electrolysis Cells: Performance and Durability. Ph.D. Thesis, Fuel Cells and Solid State Chemistry Department, Risø National Laboratory, Technical University of Denmark, Roskilde, Denmark, 2007. [Google Scholar]
- Blum, L.; Batfalsky, P.; Fang, Q.; de Haart, L.G.J.; Malzbender, J.; Margaritis, N.; Menzler, N.H.; Peters, R. SOFC Stack and System Development at Forschungszentrum Jülich. J. Electrochem. Soc. 2015, 162, F1199–F1205. [Google Scholar] [CrossRef]
- Menzler, N.H.; Tietz, F.; Uhlenbruck, S.; Buchkremer, H.P.; Stöver, D. Materials and manufacturing technologies for solid oxide fuel cells. J. Mater. Sci. 2010, 45, 3109–3135. [Google Scholar] [CrossRef]
- Blum, L.; Groß, S.M.; Malzbender, J.; Pabst, U.; Peksen, M.; Peters, R.; Vinke, I.C. Investigation of solid oxide fuel cell sealing behavior under stack relevant conditions at Forschungszentrum Jülich. J. Power Source 2011, 196, 7175–7181. [Google Scholar] [CrossRef]
- Menzler, N.H.; Han, F.; Sebold, D.; Fang, Q.; Blum, L.; Buchkremer, H.P. Sol-Gel Thin-Film Electrolyte Anode-Supported SOFC-From Layer Development To Stack Testing. ECS Trans. 2013, 57, 959–967. [Google Scholar] [CrossRef] [Green Version]
- Fang, Q.; Blum, L.; Peters, R.; Peksen, M.; Batfalsky, P.; Stolten, D. SOFC stack performance under high fuel utilization. Int. J. Hydrogen Energy 2015, 40, 1128–1136. [Google Scholar] [CrossRef]
- Patnaik, P. Handbook of Inorganic Chemicals; McGraw-Hill Handbooks; McGraw-Hill: New York, NY, USA, 2003. [Google Scholar]
- Lehrman, L.; Shuldener, H.L. Action of Sodium Silicate as a Corrosion Inhibitor in Water Piping. Ind. Eng. Chem. 1952, 44, 1765–1769. [Google Scholar] [CrossRef]
- Chase, M. NIST-JANAF Thermochemical Tables, 4th ed.; American Institute of Physics: Gaithersburg, MD, USA, 1998. [Google Scholar]
- Paoletti, F. Behavior of Oxyanions Forming Heavy Metals in Municipal Solid Waste Incineration; Universität Stuttgart: Stuttgart, Germany, 2002. [Google Scholar] [CrossRef]
- Haga, K.; Shiratori, Y.; Ito, K.; Sasaki, K. Chemical Degradation and Poisoning Mechanism of Cermet Anodes in Solid Oxide Fuel Cells. ECS Trans. 2009, 25, 2031–2038. [Google Scholar] [CrossRef]
- Benezeth, P.; Palmer, D.A.; Wesolowski, D.J. The aqueous chemistry of aluminum. A new approach to high-temperature solubility measurements. Geothermics 1997, 26, 465–481. [Google Scholar] [CrossRef] [Green Version]
- Angelici Avincola, V.; Cupid, D.; Seifert, H.J. Thermodynamic modeling of the silica volatilization in steam related to silicon carbide oxidation. J. Eur. Ceram. Soc. 2015, 35, 3809–3818. [Google Scholar] [CrossRef]

Publisher’s Note: MDPI stays neutral with regard to jurisdictional claims in published maps and institutional affiliations. |
© 2022 by the authors. Licensee MDPI, Basel, Switzerland. This article is an open access article distributed under the terms and conditions of the Creative Commons Attribution (CC BY) license (https://creativecommons.org/licenses/by/4.0/).