Article

Quantitative Measurement of Solids Holdup for Group A and B Particles Using Images and Its Application in Fluidized Bed Reactors

1
State Key Laboratory of Heavy Oil Processing, China University of Petroleum, Beijing 102249, China
2
Dalian Institute of Chemical Physics, Chinese Academy of Sciences, 457 Zhongshan Road, Dalian 116023, China
*
Author to whom correspondence should be addressed.
Processes 2022, 10(3), 610; https://doi.org/10.3390/pr10030610
Submission received: 22 February 2022 / Revised: 16 March 2022 / Accepted: 17 March 2022 / Published: 21 March 2022
(This article belongs to the Section Particle Processes)

Abstract

:
Solids holdup as one of the main parameters in characterizing the performance of fluidized bed reactors is widely concerned. With its development and improvement, visualization technology has been applied in fluidization because of its little disturbance to the flow. In this study, four types of particles with different properties are tested in a narrow rectangular fluidized bed equipped with a high-speed video camera. Calibration curves of these different types of particles are achieved by correlating the grayscale of the digital images with the corresponding solids holdup. These calibration curves are further applied to obtain the average solids holdup across the sectional area and local solids holdup from the center towards the wall in both a gas-solids turbulent fluidized bed and a circulating fluidized bed to verify the results. The calibration method works well for solids holdup of different types of particles in both dense and dilute fluidization systems. This method is important to characterize the fluidization quality and reactor performance with a wide operating condition.

1. Introduction

Fluidization technology has been widely used in industrial applications because of its good gas-solids contact which enables high heat and mass transfer rates, and uniform temperature distribution [1]. Fluidization experiences different regimes as the gas velocity increases and the characteristics of each regime are quite significant in the commercial applications of fluidized beds. Take turbulent fluidization as an example, which occurs between bubbling and fast fluidization regimes [2,3,4,5,6,7,8]; it can provide better contact between the gas and solid phase due to the absence of intense solids motion, higher gas throughout, capability of handling fine particles, etc. These special characteristics make the turbulent fluidization expected in many chemical processes such as fluid catalytic cracking (FCC) regeneration, Fischer–Tropsch synthesis, the Methanol-to-Gas (MTG) process [9], and the recent Methanol-to-Olefins (MTO) process [10]. For circulating fluidized beds (CFBs), it is operated in the transport mode, with gas and solids flowing up from the top of the riser and the separated solids returning to the bottom of the riser via a standpipe and feeding or control device. In this mode, gas and solids can be treated continuously so that there is high gas-solids throughput, effective contact between gas and particles, and a lack of bypassing of gas with minimal mass transfer limitations and opportunity for separate and complementary operations (e.g., catalyst regeneration or particle cooling) in the return loop and so on. From the above, it is known that the common characteristics for both kinds of fluidized beds are high gas-solids throughput, solids entrainment/circulation, strong gas-solids contacting, and so on. On the other hand, the strong gas-solids interaction always means there are complex gas-solids hydrodynamics, such as non-uniform axial distribution and meso-scale structures like particle clusters.
The gas-solids hydrodynamics in fluidized beds are very important because they closely relate with the industrial applications and determine the reactor performance. Solids holdup is one of the main parameters which characterize the gas-solids flow structures and has important consequences for mixing, heat and mass transfer, and reaction rates in the fluidized beds. For solids holdup measurements, the techniques used to characterize the structure of the gas-solid system can be divided into two groups: one is intrusive probes [11,12], such as the capacitance probe [13,14], sampling probe [15], and optical fiber probe [16,17,18,19,20], and the other is non-intrusive visualization methods [21,22], such as laser doppler anemometry (LDA) [23], laser-based images [24], electrical capacitance tomography (ECT) [25], radioactive particle tracking (RPT) [26], and external visualization systems with high-speed video cameras [27,28,29]. The intrusive probes are relatively simple and effective to measure the local flow properties. However, it is sensitive to the humidity, temperature, electrostatics, and interference of the electromagnetic field, which limits its measurement [30,31]. Moreover, its measuring volume is hard to define and the probe’s intrusion into the bed can cause flow disruption. Therefore, the non-intrusive techniques are more preferable due to their little disturbance to the flow.
With the development and improvement of modern video cameras and imaging process methods, the flow pattern inside the fluidized bed can be much clear as exhibited through images. It can provide fast monitoring of relatively large cross-sectional areas at high resolution, showing real images of the gas-solids flow in the fluidized bed. As a result, the external visualization system is more commonly used now as an effective method to characterize the flow structures [32,33,34,35]. However, imaging measurements are often used to provide qualitative references of the overall flow structure. Recently, it could be used to study particle cluster parameters such as cluster size, shape, and velocity [27,33,34,35,36,37,38,39,40]. However, it still has serious limitations for quantitative measurement. One of the major limitations is to get solids holdup quantitatively. The calculation of the solids holdup is almost available with only low values. It cannot work well in those fluidization systems with high solids holdup due to the limitation of the method itself [32,33,34,41]. In this work, the visualization method is applied to obtain the solids holdup in the fluidized bed of different fluidization regimes and with particles of different properties by correlating the grayscale of the digital image with the solids holdup (an image calibration method) [27].
Generally, the distribution of solids holdup in the gas-solid system is non-uniform [42,43,44,45,46]. As shown in Figure 1, the probability density distribution (PDD) of gray values of the digital image distributes in a wide range and show several peaks, leading to the difficulty in correlating the image information (the grayscale values) with the solids holdup. To obtain a stable and homogeneous fluidization with graded solids hold-up, the image calibration method is proposed with the application of a liquid-solids system instead of the original gas-solids one because of the homogeneity in the liquid-solids fluidized bed, as shown in Figure 2. The grayscale values exhibited a narrow distribution and only one narrow peak, making it possible and easier to build the relationship between the gray value and the solids holdup. Besides, the liquid used in this study was water, which has no obvious effects on the refraction of the fluidization field. Therefore, the method is available to obtain a wide range of operation conditions from dilute to dense fluidization systems.
The present work aims to propose an image calibration method which is suitable for different types of particles using the external visualization technique with a high-speed camera. The calibration curve can be further applied in gas-solids fluidization systems with a wide operation condition, from dilute fluidization, such as fast fluidization and circulating fluidized beds, to dense fluidization, such as turbulent fluidized beds. The measurement results by this method can provide detailed information of solids holdup, which is one of the most important parameters in gas-solids systems without disturbing the flow field.

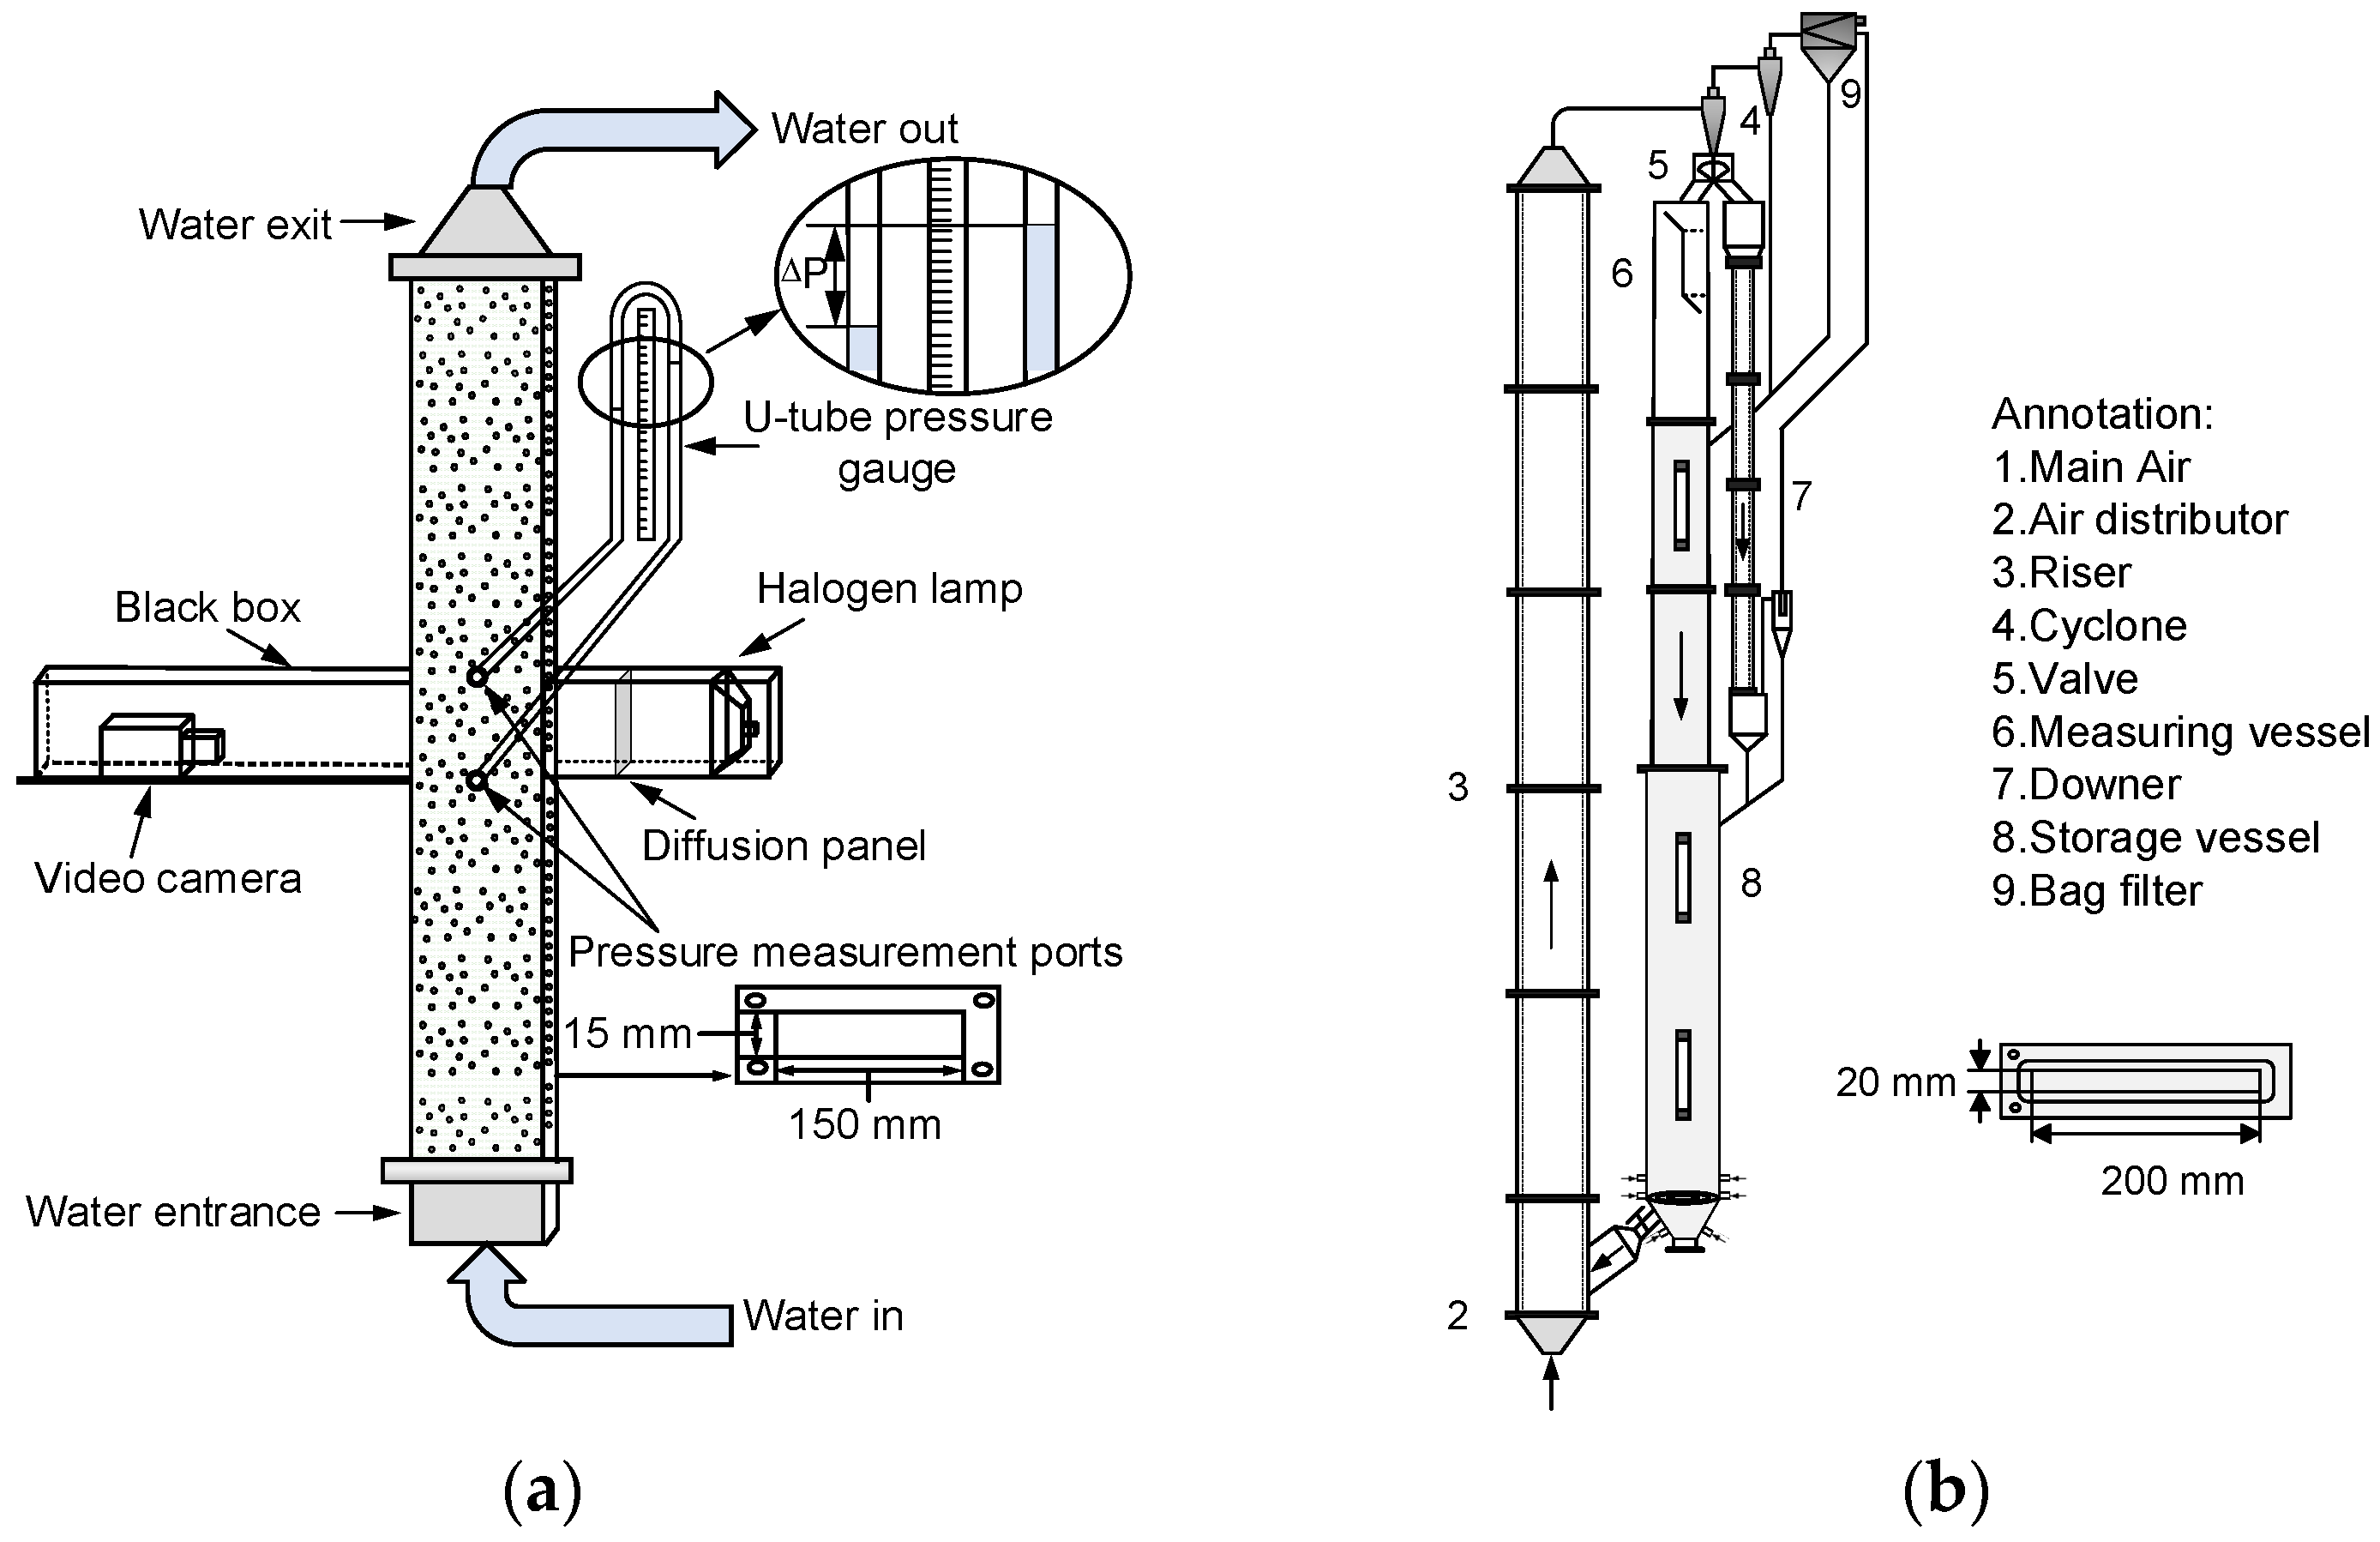
2. Experimental Apparatus

The experimental apparatus for the calibration is shown in Figure 3a, consisting of a narrow rectangular liquid-solids fluidized bed, a U-tube pressure gauge, a light source, and a high-speed video camera. The rectangular fluidized bed column was made up of Plexiglas with a cross-section of 150 mm × 15 mm and a height of 1.5 m. The pressure drop was measured by the U-tube pressure gauge at two ports with a distance of 100 mm.
To verify the calibration method, the image collection in gas-solids fluidization systems was carried out in a two-dimensional (2D) setup consisting of a riser, a downer, a gas-solids separation system, a solids storage vessel, and a solids flow-controlling system, and a schematic diagram is shown in Figure 3b. The experimental columns were rectangular in the cross-section. The riser and downer were 12.4 m and 5.0 m high, respectively, with the same cross-sectional area of 20 mm × 200 mm. The experiments for this study were done in the riser column, which can be operated as a turbulent fluidized bed and a circulating fluidized bed riser. More details of the experimental setup can be found in our previous work [47].
The liquid-solids fluidized bed and the gas-solids fluidized bed, with a relatively small depth, allowed for the visual observation of clusters and qualitative assessment of gross solid movement. The depth of the fluidized beds was also sufficient compared to the particle size so that the wall effect and the interference with particle circulation were negligible.
A 100-watt LED lamp with an angle of a light cup of 45° and a lifetime of 72 h was selected as the light source to provide higher luminance and brightness. The lamp had a size of 12 cm × 9 cm × 8 cm and a weight of 940 g. A diffusion panel was applied to make the recorded area uniformly illuminated and eliminate both undesirable shadows and hotspots from appearing in the images.
The high-speed video camera was Phatom VEO710L, equipped with a 12-bit CMOS sensor and allowing for both frame rates of up to 680,000 fps (frame per second) and a maximum resolution of 1280 × 800 pixels at 7400 fps. To ensure the same measuring conditions for the camera, the video quality was set with 640 × 320 pixels and a spatial resolution of 0.15625 mm/pixel. Output images were uncompressed full frames without any loss of the original information, guaranteeing the precision of the later image processing.
Three types of materials, including FCC particles with a mean diameter of 87 μm and white quartz sand particles with mean diameters of 76 μm and 262 μm, were used as the calibration materials. The physical properties of these experimental materials are listed in Table 1. The FCC catalyst particle was used for the experiments.
The calibration process was needed to quantitatively analyze the image information by correlating the grayscale of the digital image and the solids holdup inside the rectangular fluidized bed. To take exact measurements of the grayscale of the image, the solids holdup was the premise for the quantitative description.
As discussed in the introduction, the liquid-solids system was applied instead of the original gas-solids fluidized bed. Firstly, blank testes were needed to compare the refractive index of the air and water phases on the grayscale. Blank tests were carried out by capturing images of the fluidized bed with only air and water. The results show that the mean gray value of the image for water is 254.95, which is similar to the value of 254.97 for air, indicating that the influence reflected by the difference refractive index of the two phases is negligible and it is reasonable to apply the calibration results obtained from the water-solid system in the air-solid system.
The liquid-solids fluidized bed is good for an accurate grayscale value of the image with narrow PDD and for both the stable and homogeneous fluidization with graded solids holdup.
By measuring the pressure drop for the image-measured zoon, the solids holdup for this zoon could be calculated with the following equation:
P = ρ w a t e r g h ( 1 ε s ) + ρ p g h ε s
where P is the pressure drop between the measuring ports, ρwater is the density of water, g is the acceleration of gravity, h is the distance between two ports for the pressure drop measurement, εs is the averaged solids holdup, and ρp is the density of the particle.
Then, the solids holdup was related to the gray values of the images to obtain the calibration curves.
For image processing, it has been mentioned that the image measurement method based on high-speed video cameras can be used to investigate the overall view of solids holdup from images by using the calibration curve. By dividing the image into pixel levels and then converting the gray value of each pixel into solids holdup through correlation Equation (2), the local solids holdup can be calculated by the mean value of solids holdup, represented by all the pixels in the local area as shown in Equation (3).
G i = f ( ε s i )   or   ε s i = f ( G i )
where εsi represents the solids holdup for each pixel of the image and Gi is the grayscale valve for each pixel of the image. Then, the averaged solids holdup εs can be calculated by the following equation.
ε s i = i = N ε s i N
where N is the total number of the pixels for the image.

3. Results and Discussion

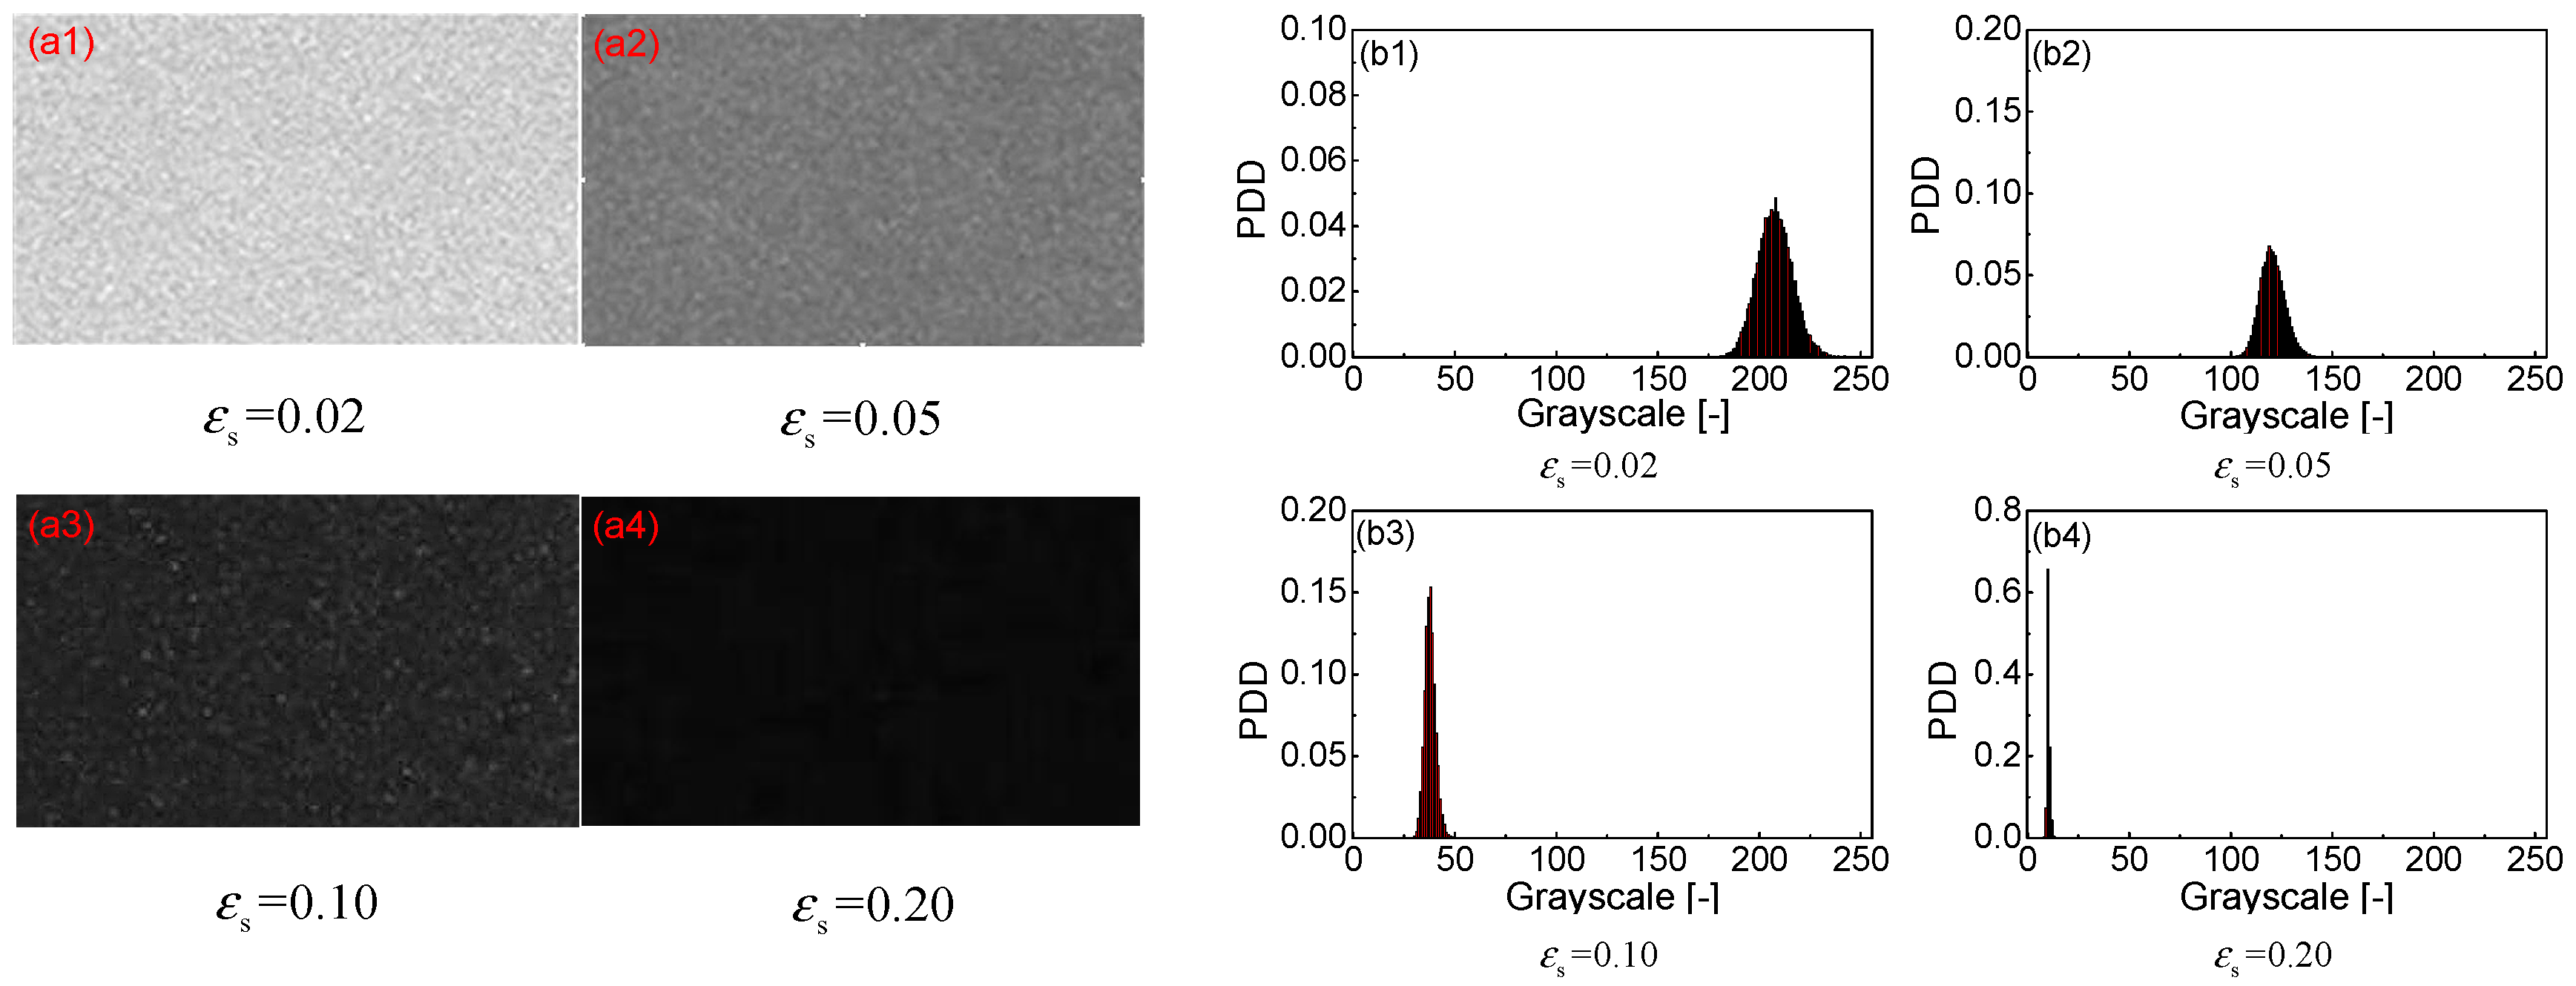
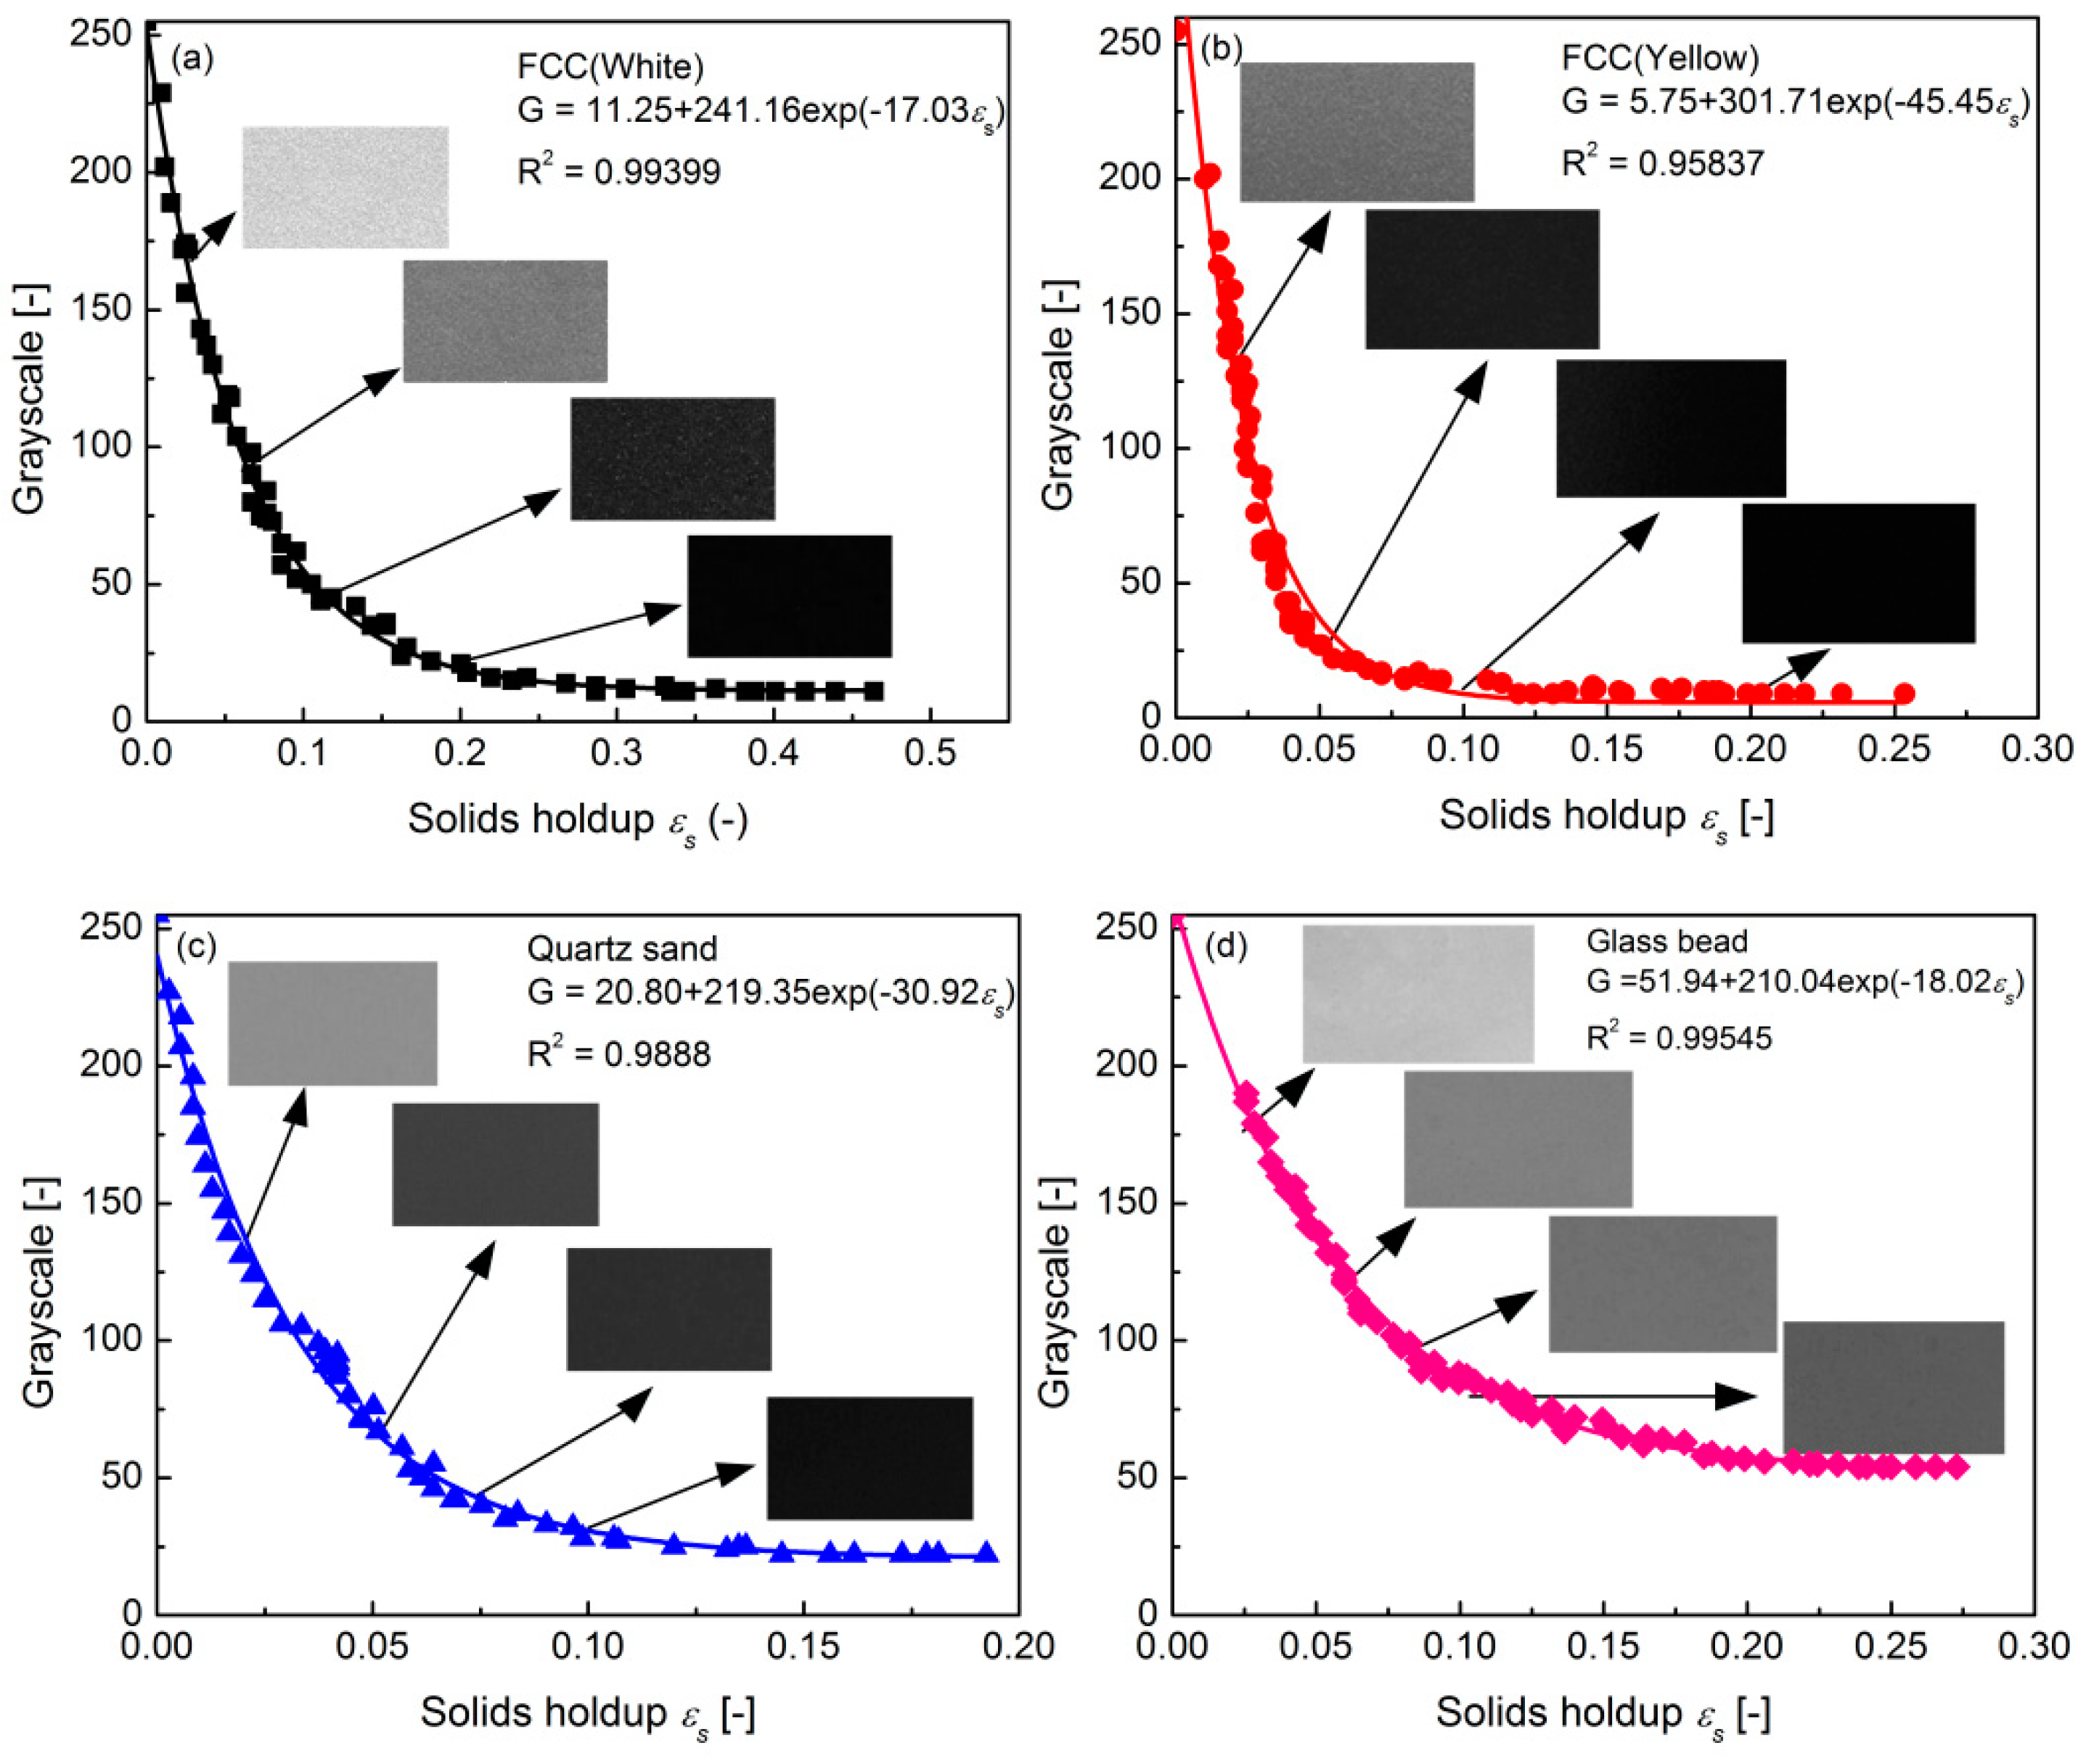
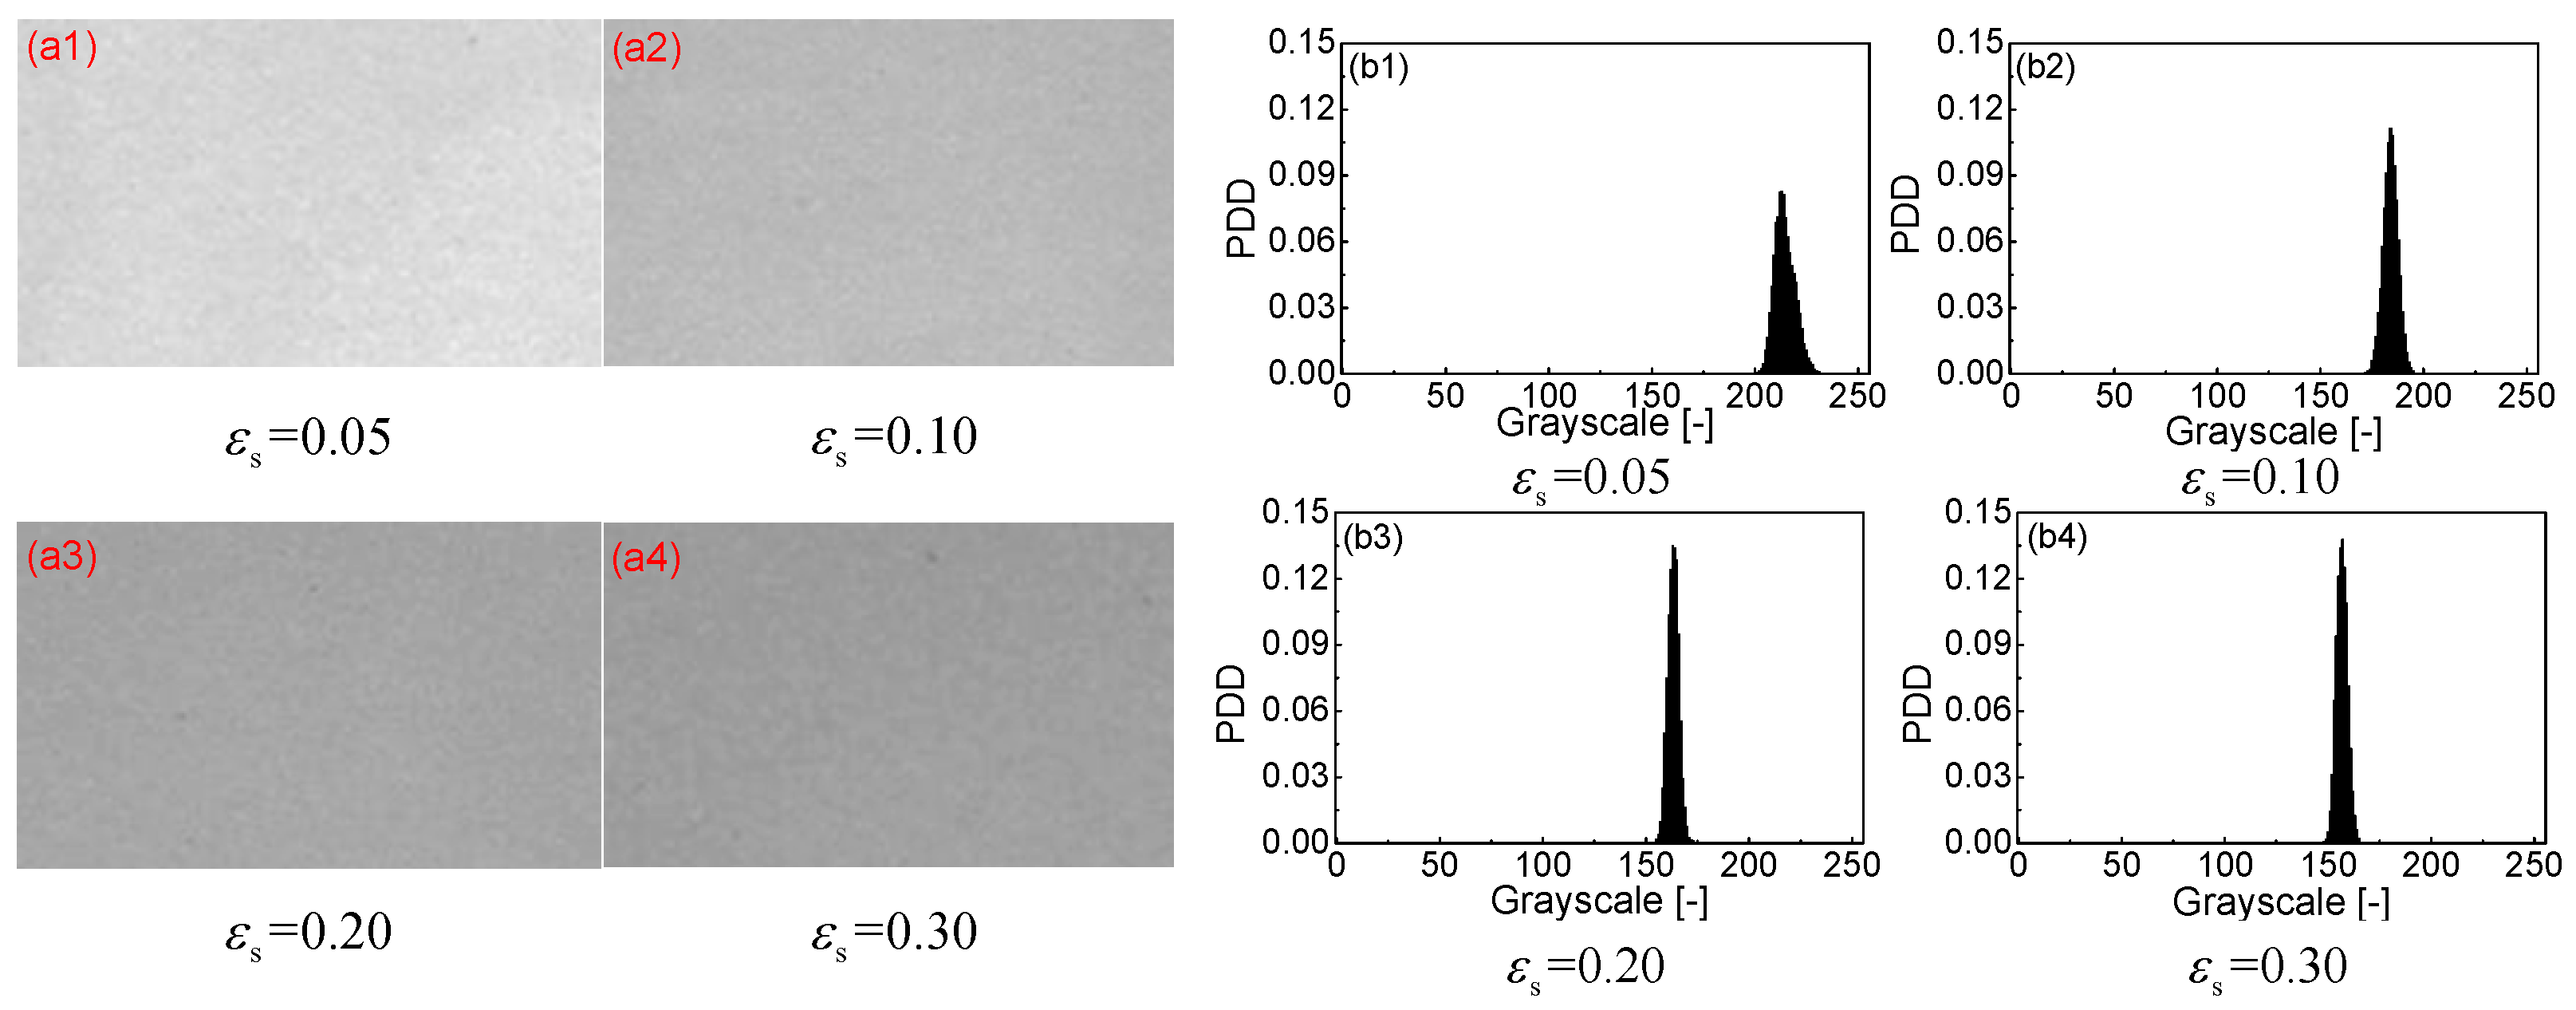
3.1. Calibration Curve for Group A FCC Particles

Figure 4 shows the grayscale images for FCC particles at different solids holdup and the related grayscale histograms. As shown in this figure, FCC particles can be uniformly fluidized and dispersed in the water, and the different solids holdup values can be achieved by adjusting the water flow rate. The gray values distribute in narrow ranges and show only one peak, indicating the homogeneity in the fluidized bed. The corresponding image grayscale at each solids holdup is the mean value. In this way, the relationship between the graded solids holdup and the corresponding mean grayscale can be built.
The calibration curve of the graded solids holdup and the mean gray value of the respective digital images for FCC particles are shown in Figure 5. The solids holdup is well correlated with the gray values: the exponential correlation between the solids holdup (εs) and grayscales (G) is obtained with an adjusted R square of 0.993.
G = 11.25 + 241.16 exp ( 17.03 ε s )
The grayscale decreases with the increase of the solids holdup. The decrease was rapid initially and then became gradually slow as the solids holdup increased. For example, the mean grayscale is 120 when the solids holdup is 0.05. When the solids holdup increased to 0.1, the corresponding grayscale quickly decreased to 40. The grayscale gradually became stable when the solids holdup was higher than 0.2.
The results demonstrate that this calibration experiment is a useful method to correlate the solids holdup and the image information. The calibration curve and the equation can be used as the basis of image processing and applied in later studies on the solids holdup in the gas-solids turbulent fluidization.

3.2. Calibration Curve for Group A Quartz Sand

Figure 6 shows the grayscale images and the corresponding histograms for Group A quartz sand particles at different solids holdups. Quartz sand particles also fluidized uniformly. The gray values showed an even narrower distribution when compared with those for FCC particles.
As shown in Figure 7, the exponential correlation between the solids holdup (εs) and grayscales (G) is obtained with an adjusted R square of 0.988:
G = 20.80 + 219.35 exp ( 30.92 ε s )
Quartz sand showed a similar relationship with FCC particles, exhibiting an exponential decrease with the increase of the solids holdup. For example, the mean grayscale was 140 at the solids holdup of 0.02 and quickly decreased to 25 when the solids holdup increased to 0.1. Finally, it became stable at the solids holdups higher than 0.1.

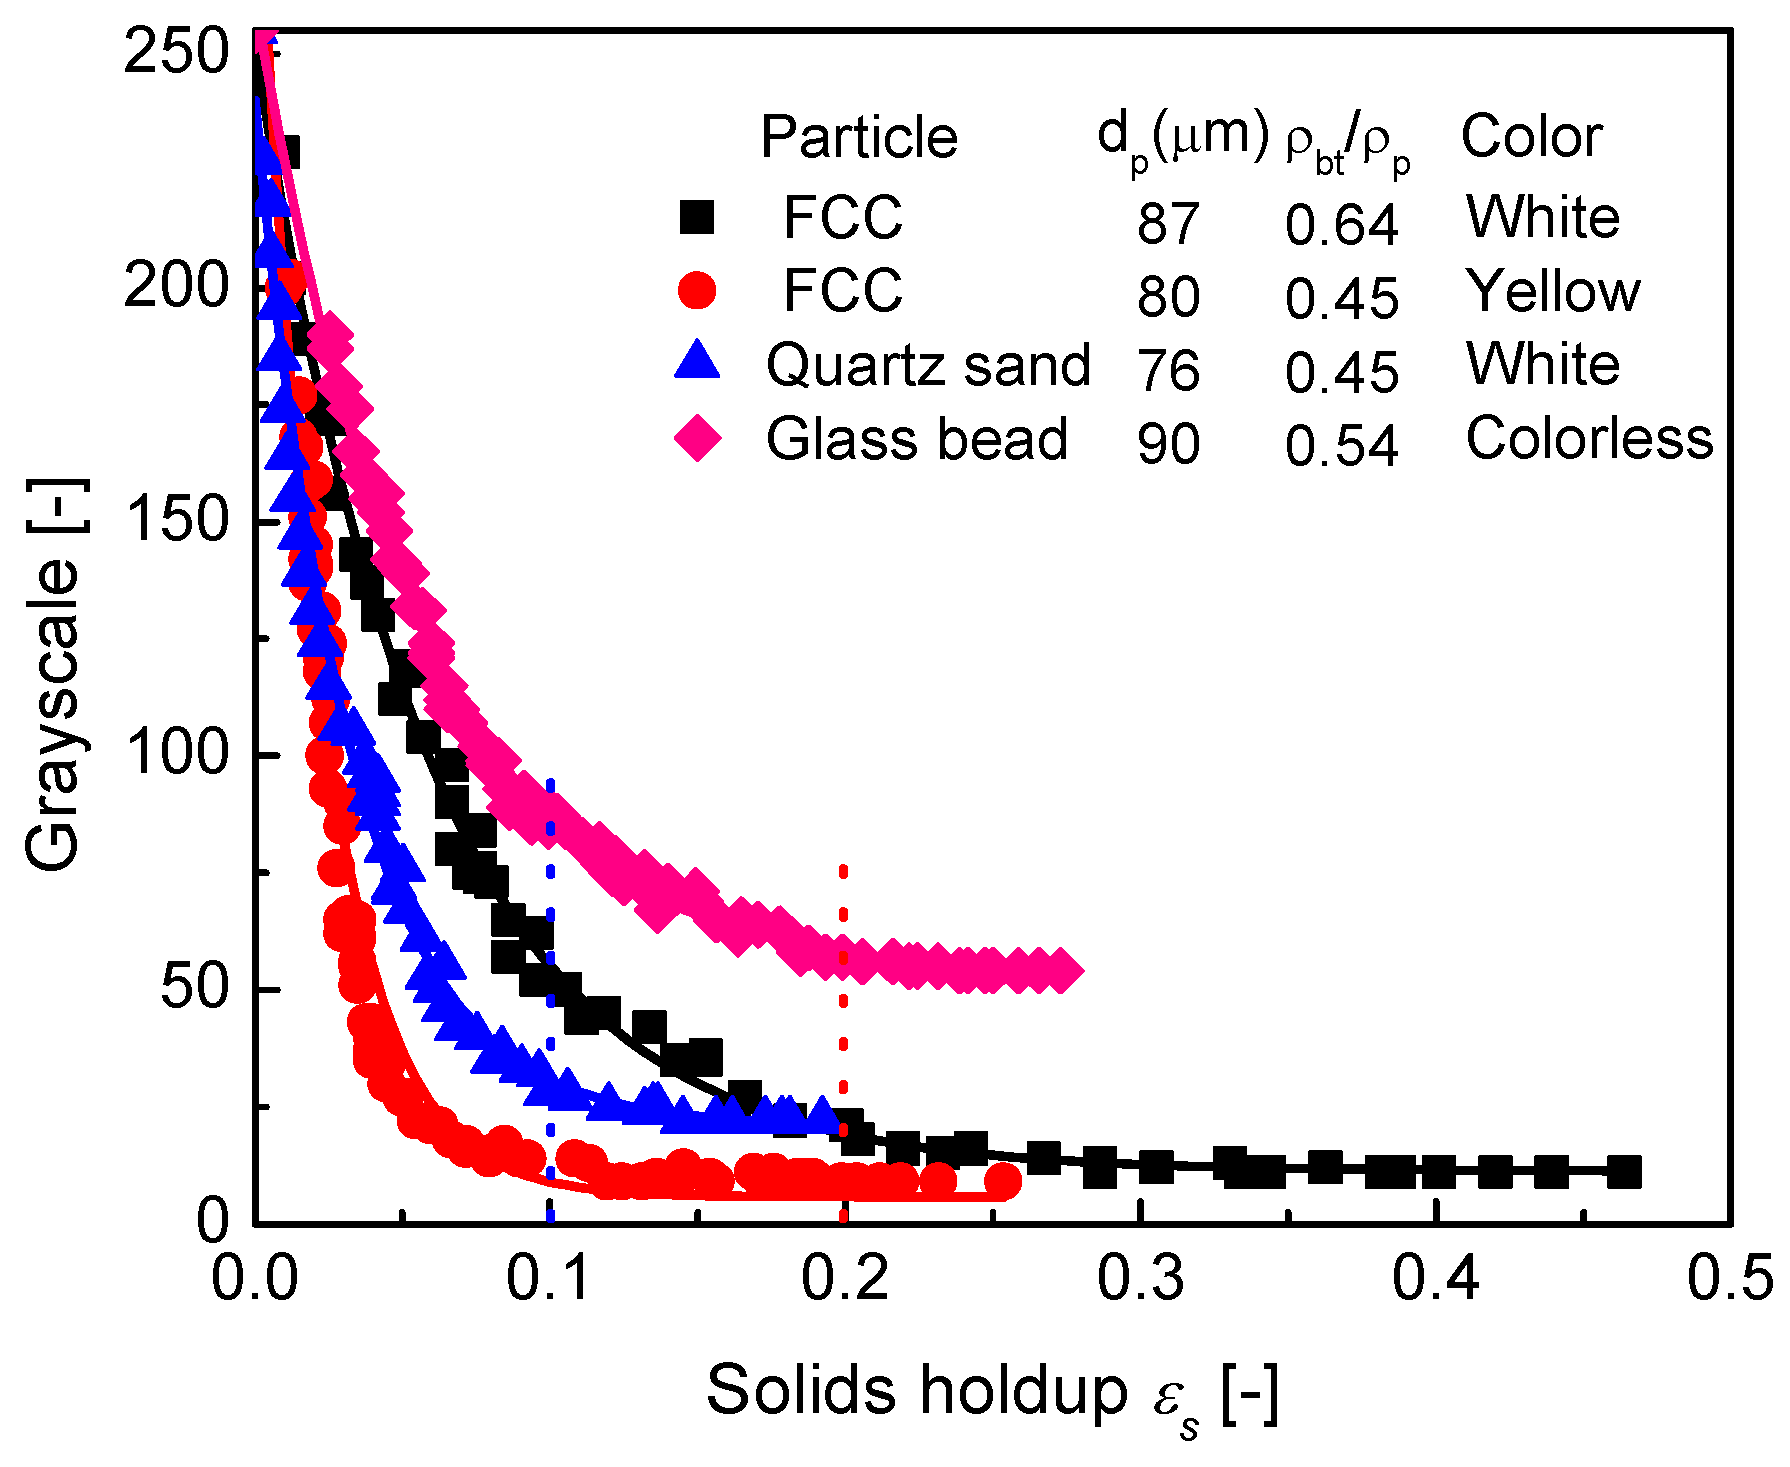
3.3. Comparison of Calibration Curves of Different Group A Particles

Figure 8 illustrates the calibration curves of four different Group A particles: two types of FCC particles with different colors, one type of quartz sand, and one type of glass bead. For all the particles, the grayscale decreased exponentially with the increasing of the solids holdup and finally became stable when the solids holdup reached a certain value.
Figure 9 compares the calibration curves of the four types of Group A/A-B particles. Under the same solids holdup, the glass bead showed the highest grayscale, followed by the white FCC particles, the quartz sand, and the yellow FCC particles, which showed the lowest grayscale, relating to the color of the particles and the bed voidage. In addition, the solids holdup of white FCC particles could be measured in a wider range because the ratio of their bulk density to their particle density was smaller. As this ratio increased, the range of the solids holdup that could be measured became narrower.

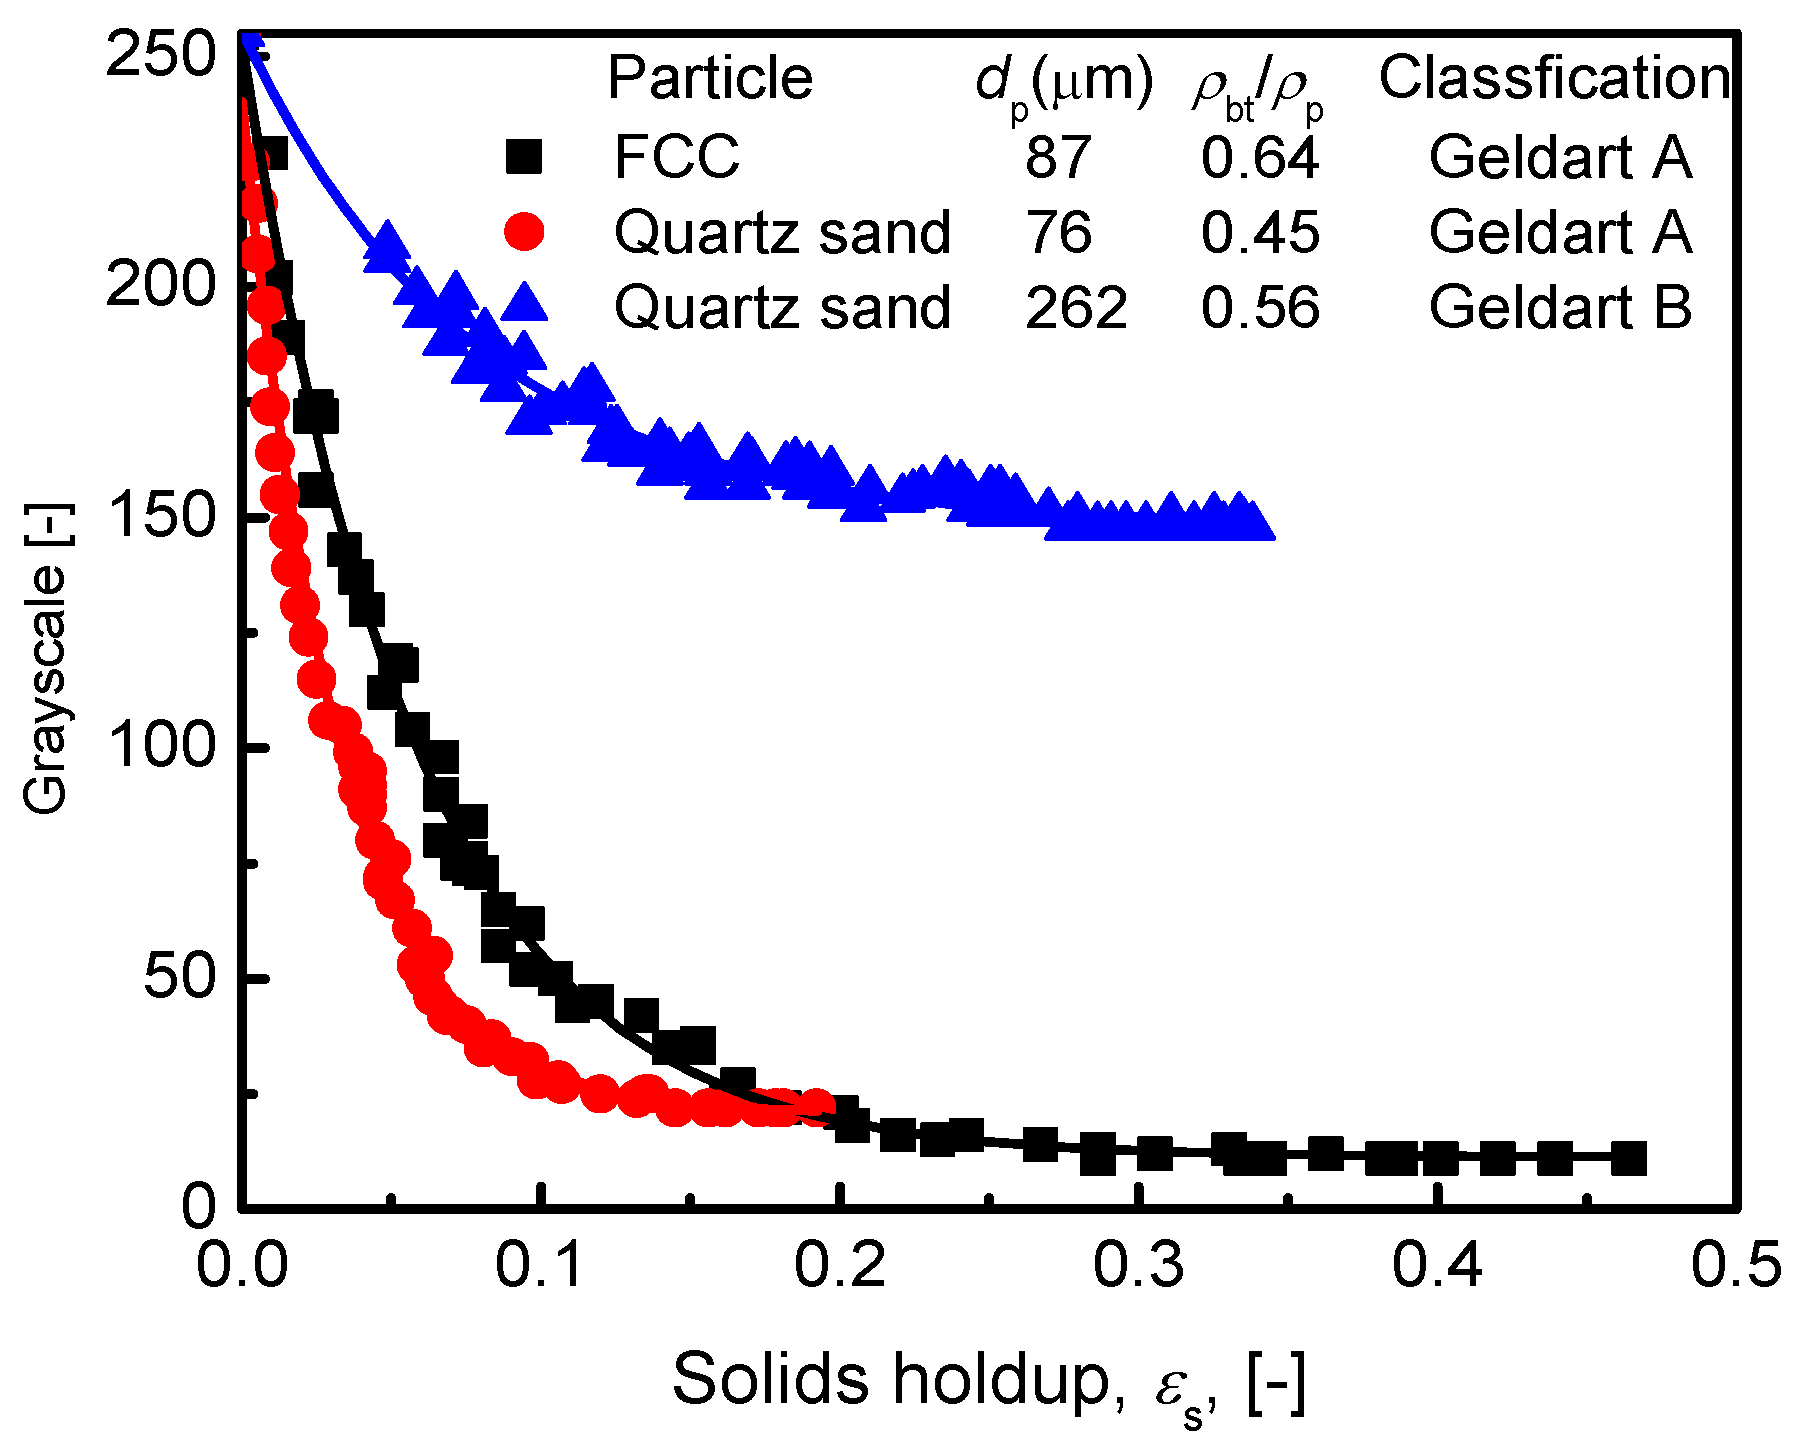
3.4. Calibration Curve for Group B Particles

Figure 10 presents the images and the related grayscale distributions for Group B quartz sand. Similar with Group A particles, Group B quartz sand could also be homogeneously suspended in the liquid, but the grayscale of them showed a wider range than that of Group A-B quartz sand.
Figure 11 shows the calibration curves of two types of Group B particles: the quartz sand and the glass bead. The exponential correlations for the two types of particles were:
Or   quartz   sand :   G = 147.83 + 107.80 exp ( 12.85 ε s )
For   glass   bead :   G = 178.49 + 77.92 exp ( 11.49 ε s )
The quartz sand had a wider range of the grayscale than the glass bead because of the darker color, which led to the stronger capability of absorbing the light. For both the two types of Group B particles, the grayscale became stable when the solids holdup increased to 0.2.
Figure 11. Calibration curve of Group B particles. (a) Quartz sand. (b) Glass bed.
Processes 10 00610 g011
Figure 12 compares the calibration curves of Group A and Group B particles. For Group A particles, the change of the grayscale was much larger than that for Group B particles, but the gray values were much lower than those for the Group B particles. Group B particles with a larger particle size had larger bed voidage during fluidization, leading to higher gray values of the images. In addition, the range of the solids holdup that could be measured varied with the types of particles: for example, the measurement of the solids holdup for FCC particles was in the range of 0–0.5, while that for quartz sand was in the range of 0–0.2. In other words, the higher particle density resulted in the narrower change of the grayscale, reflecting the influence of the particle properties on the fluidization quality.

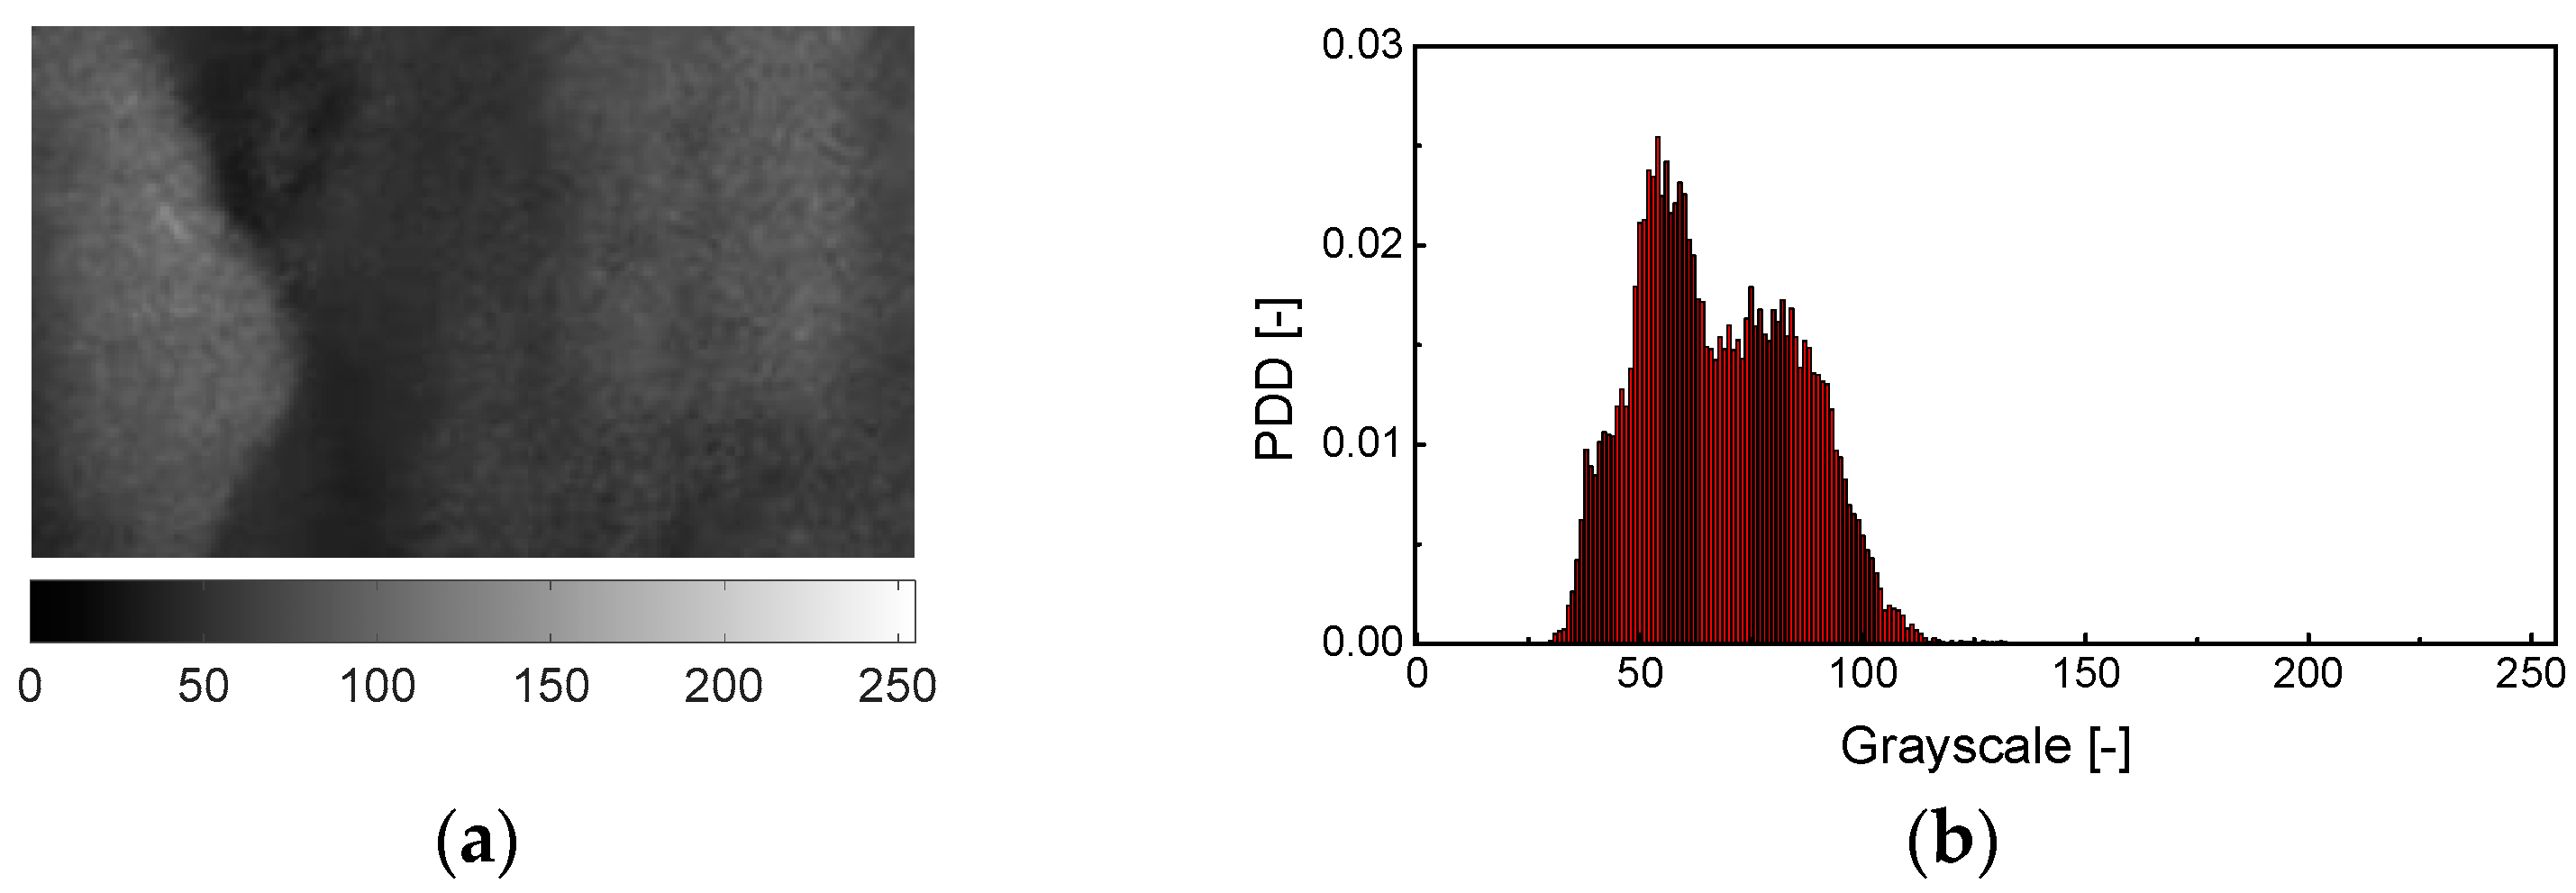
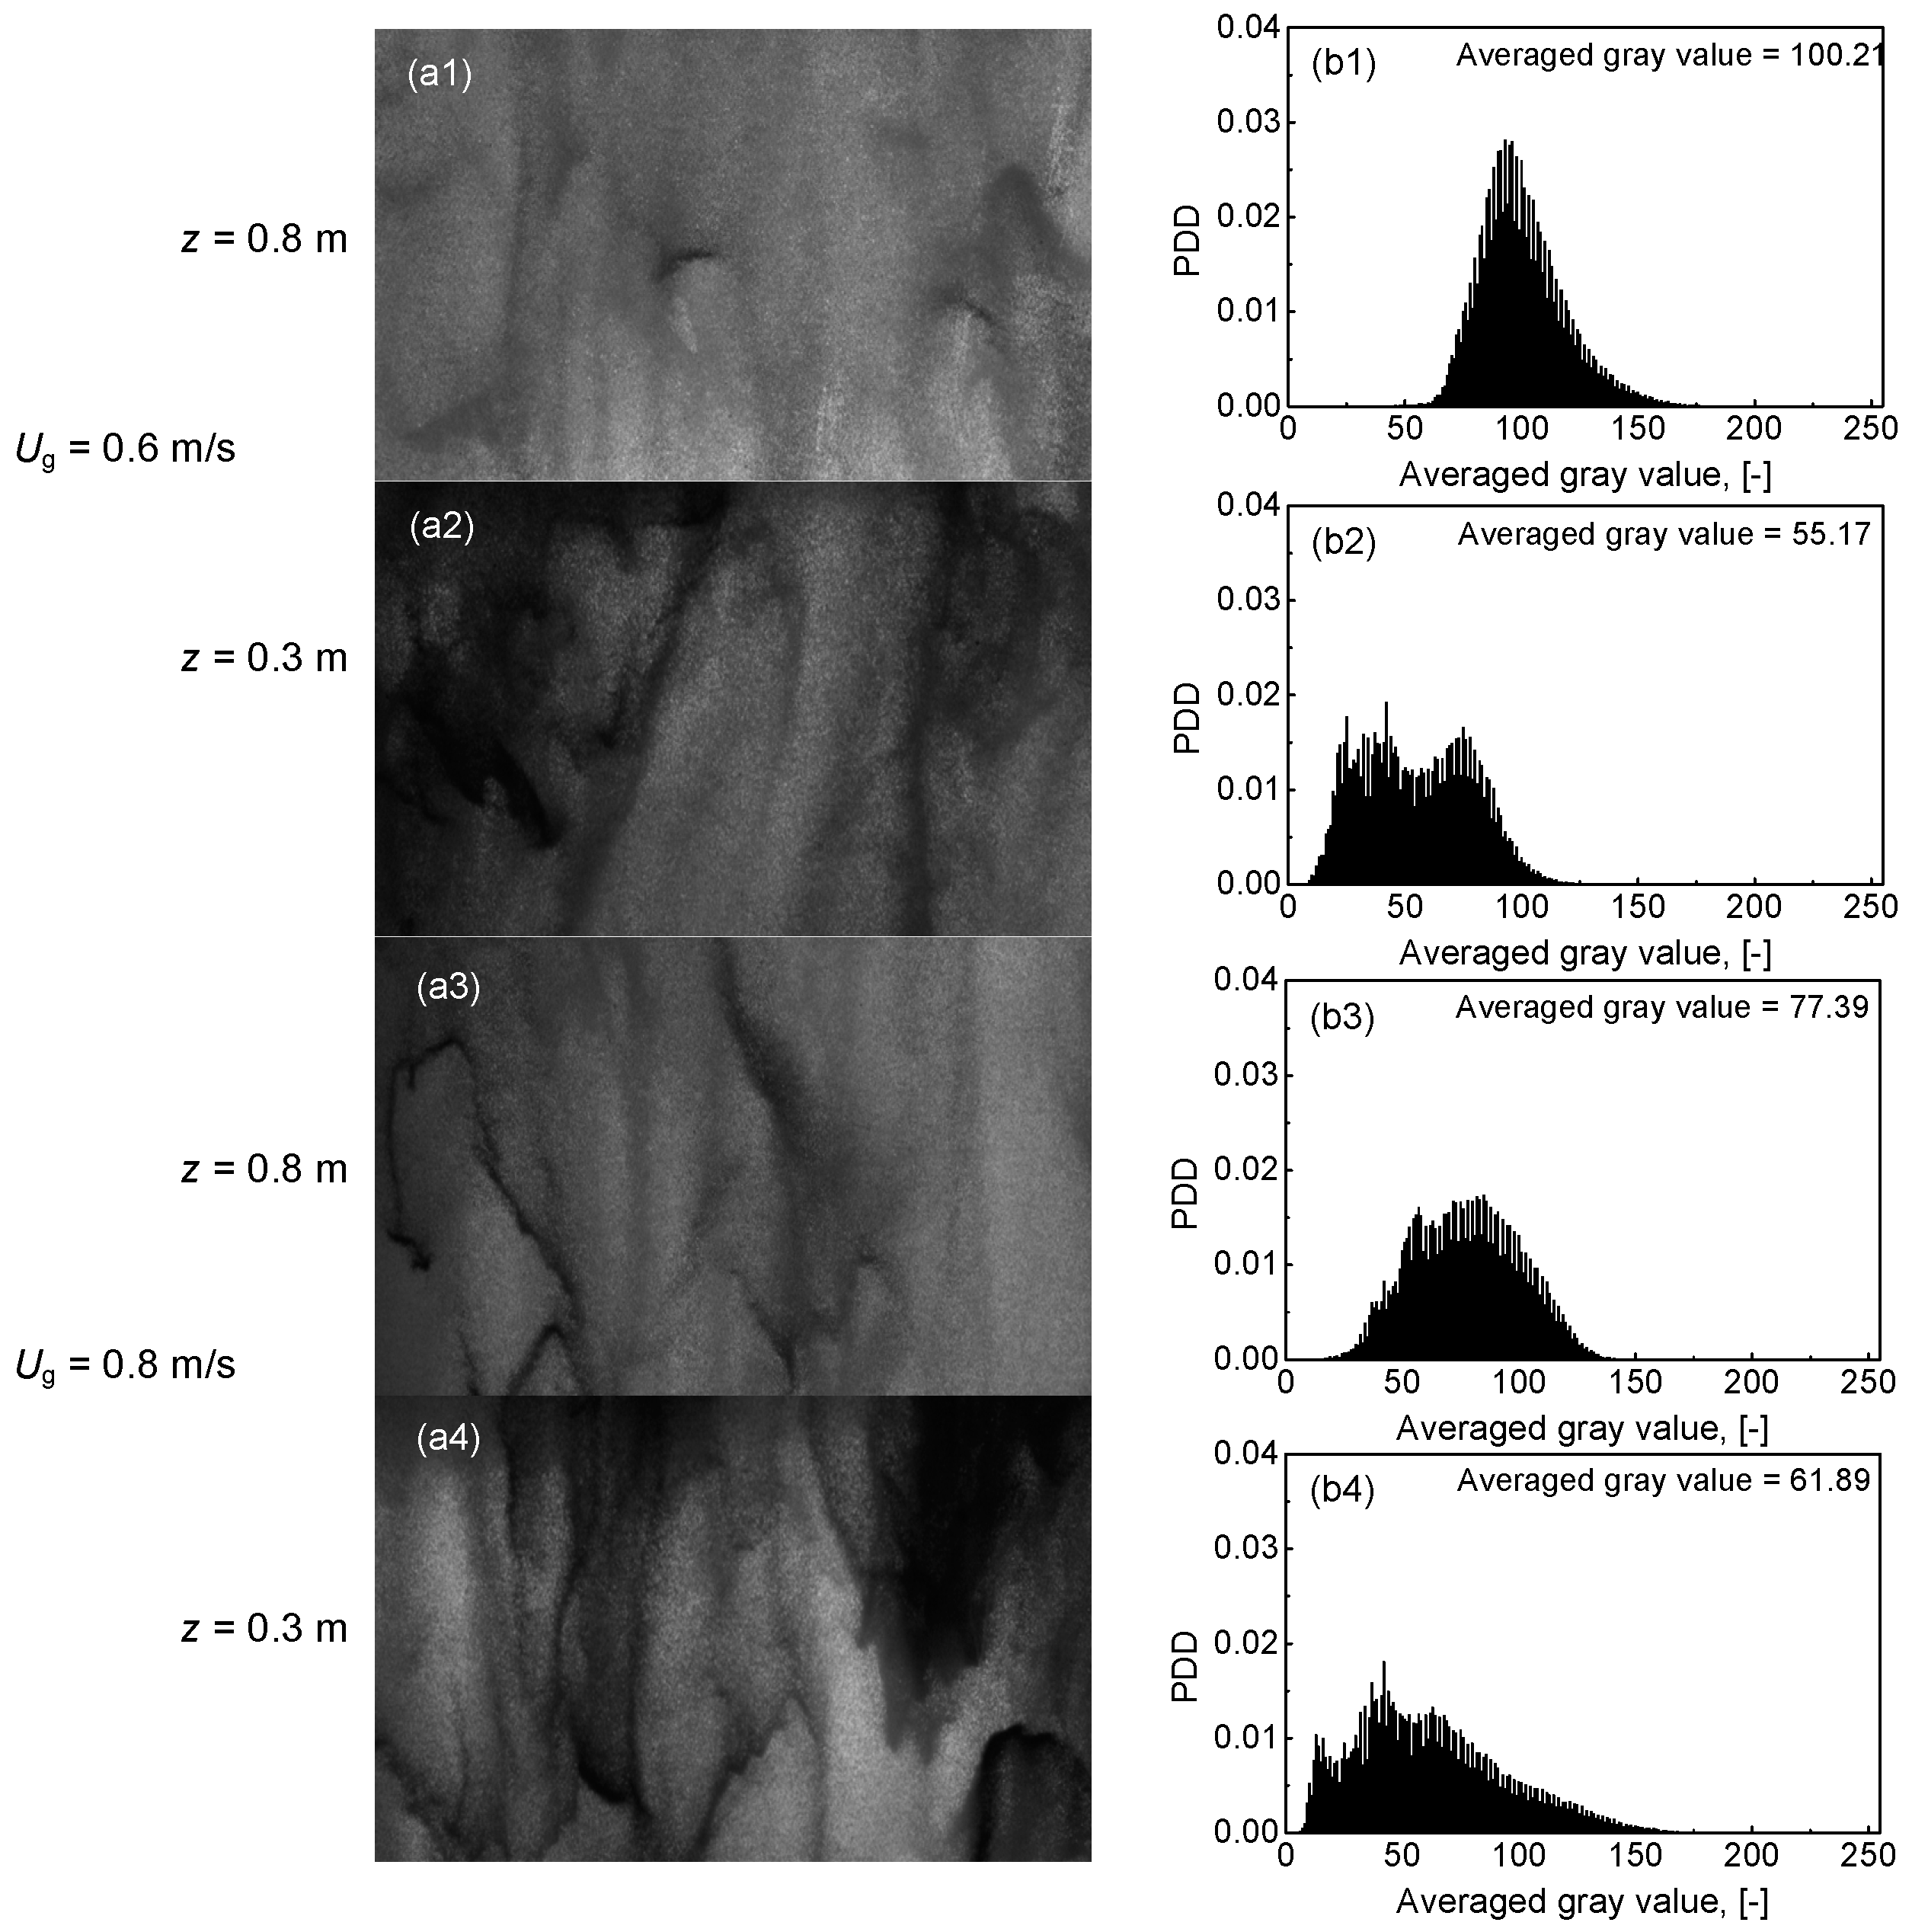
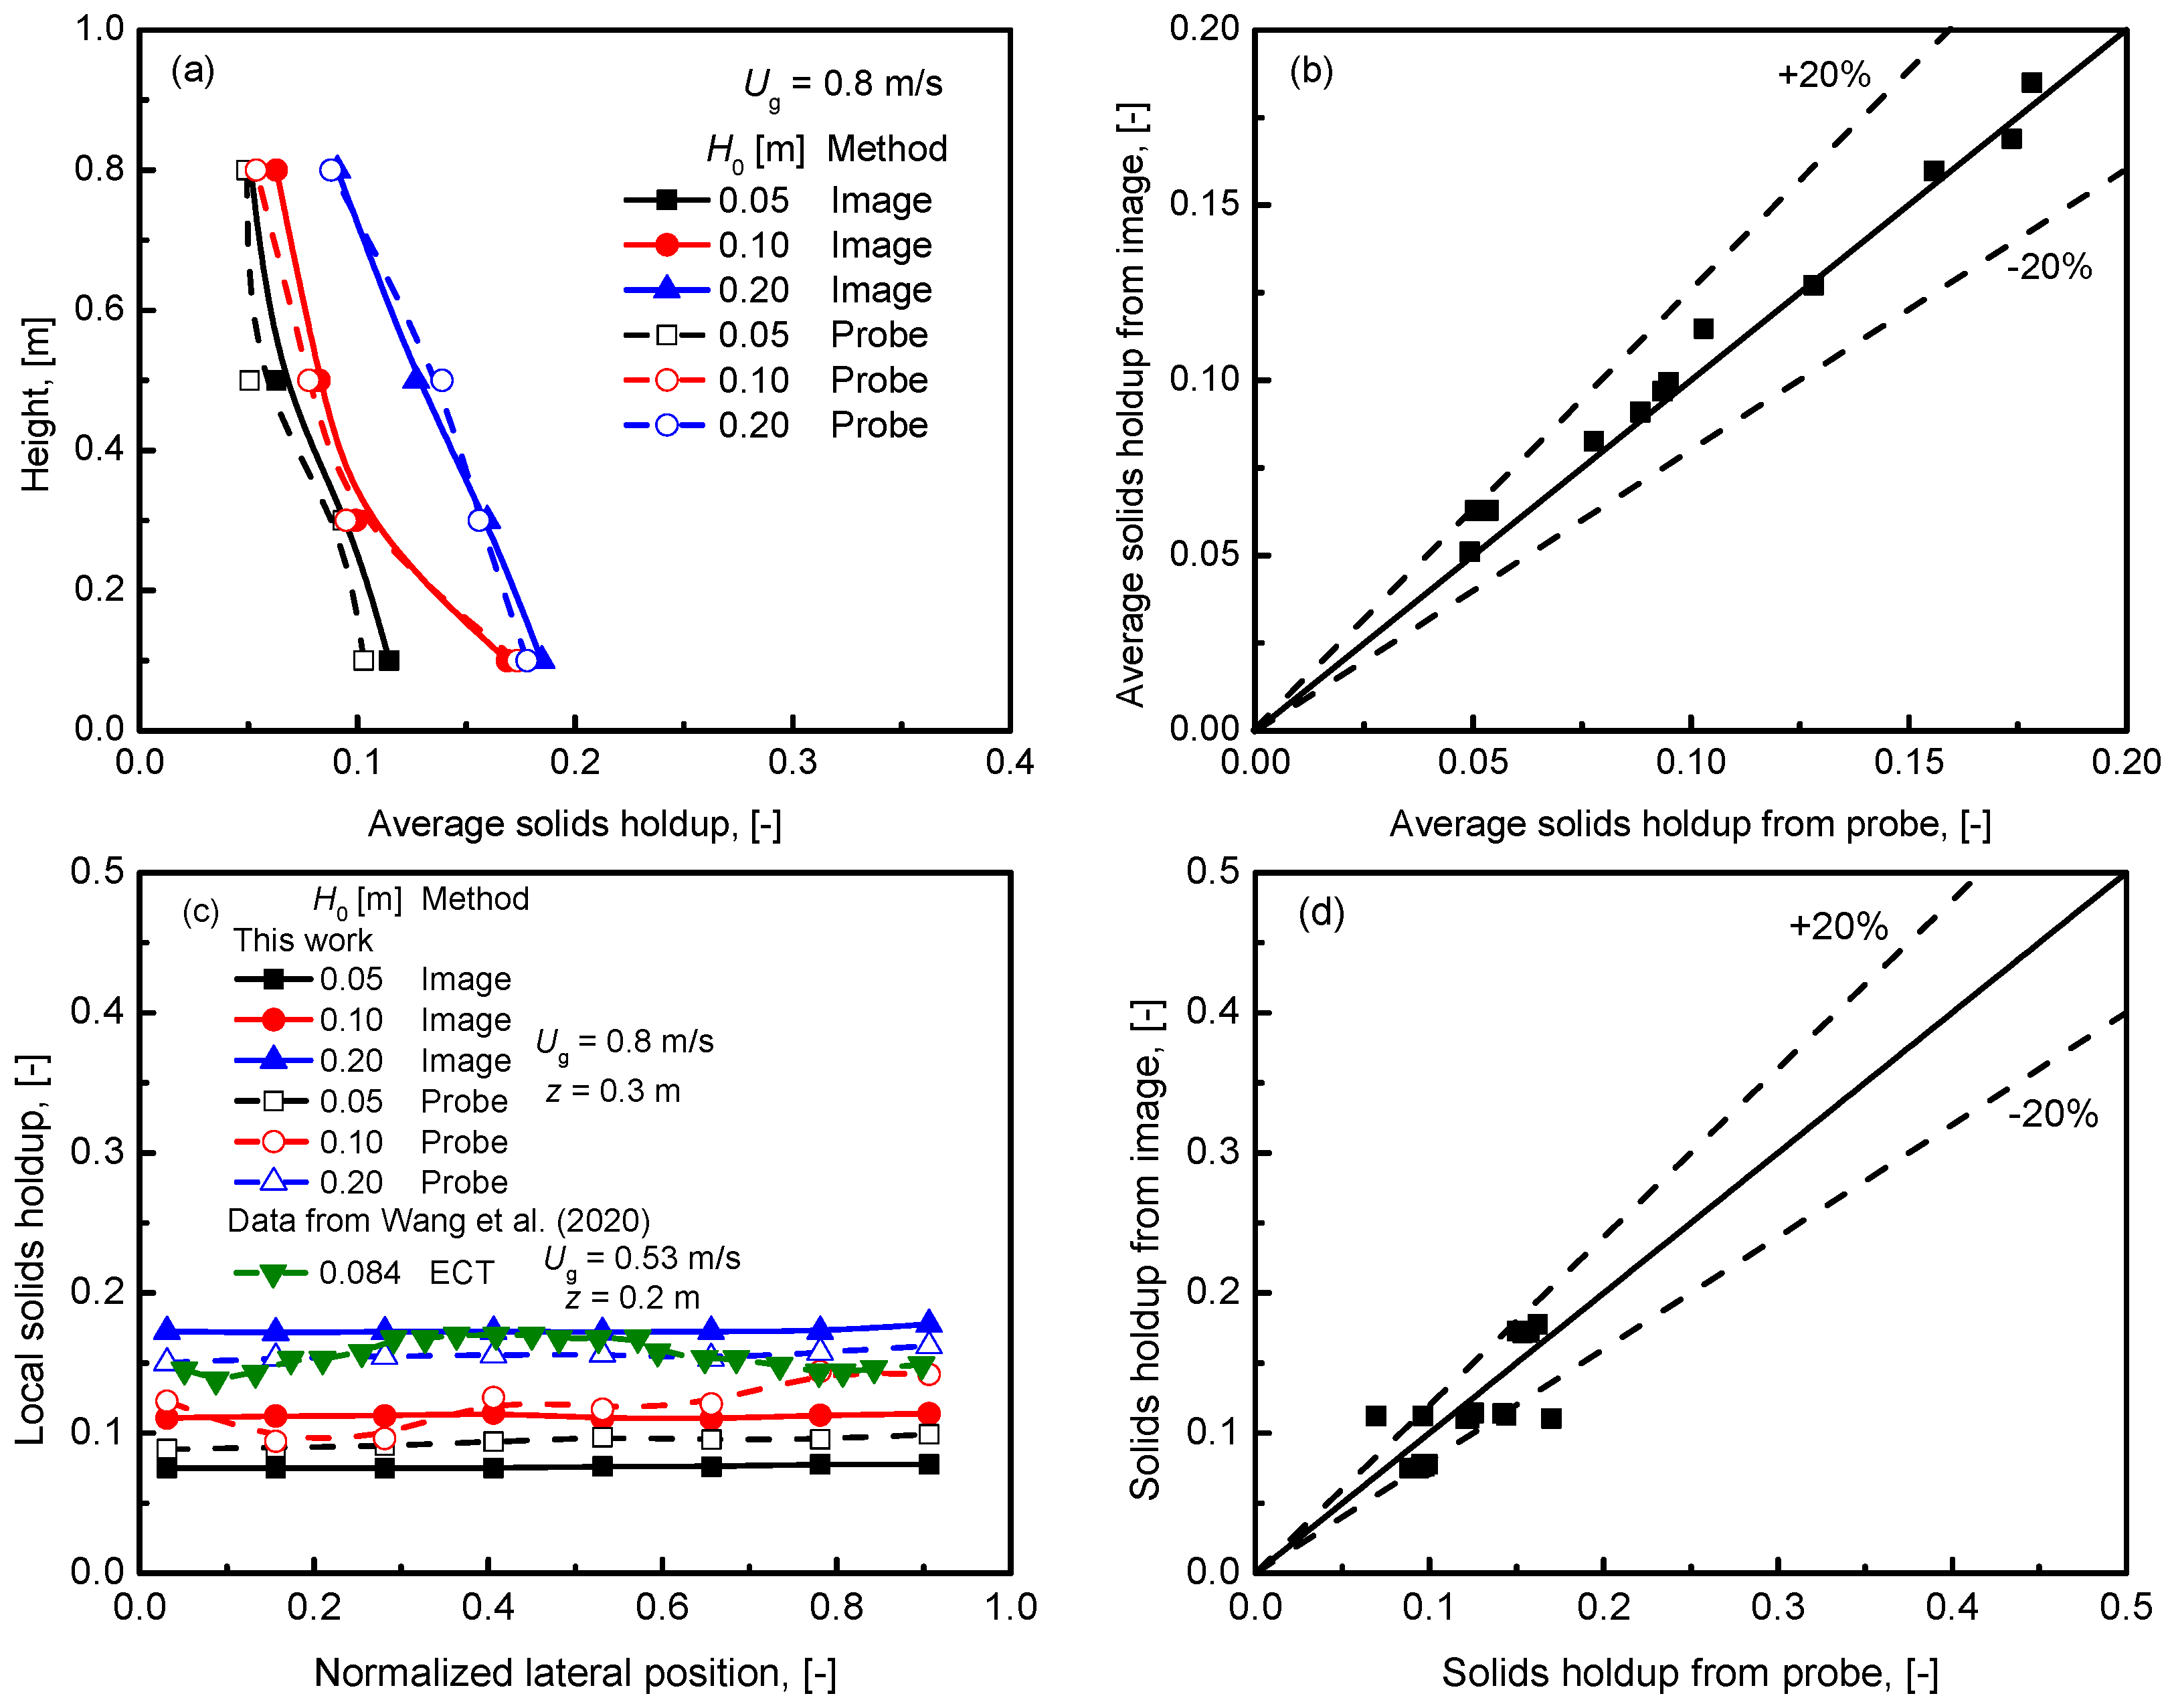
3.5. Method Application in Fluidized Bed System with Group A Particles of FCC

This method can be widely used for different fluidization systems with different kinds of particles. To show the application in gas-solids flow systems, Group A particles of FCC were chosen as the bed material and solids holdup was measured in a two-dimensional gas-solids fluidized bed, as mentioned in Section 2. Solids holdup was obtained in the riser section under the turbulent and fast fluidized regime. To verify the quantitative measured results, the experimental data were compared with that obtained by the optical fiber probe with wide operation conditions.
Figure 13 shows the images for different superficial gas velocities in the turbulent fluidization mode with an initial bed height of 0.05 m. It shows obviously that images can reflect the real flow characteristics with high solids holdup in the bottom (z = 0.3 m) and a low one at a higher axial position (z = 0.8 m) in this turbulent mode. For Ug = 0.6 m/s, the grayscale of the image becomes lighter when the axial position moves from 0.3 m to 0.8 m above the gas distributor at the bottom of the bed. The corresponding average value of the image increases from 55.17 to 100.21. For a constant axial position (take z = 0.8 m as an example), when the superficial gas velocity increases from 0.6 m/s to 0.8 m/s, the averaged gray value decreases from 100.21 to 77.39. From the above discussion, it is found that image measurement can record the gas-solids flow at different operation conditions.
The solids holdup distribution based on image testing at different operation conditions is given in Figure 14. It is shown that solids holdup decreases from the bottom to the top of the bed height at a fixed superficial gas velocity and initial bed height. At a constant superficial gas velocity of 0.8 m/s, the solids holdup increases with the increase of the initial bed height (H0). There is uniform lateral solids holdup distribution in the gas-solids turbulent fluidized bed. The results are similar to those reported by other researchers under comparable operating conditions [25]. The experimental data from the image test was also compared with that obtained by the optical fiber probe (details of the optical fiber probe can be found in the previous research [48]). From the results, good agreement is shown for these two kinds of measurement methods with an error within 20%.
The solids holdup distribution based on image testing in a gas-solids circulating fluidized bed is given in Figure 15. With the increase of the solids circulation rate, the solids holdup at z = 8.5 m of the riser, as shown in Figure 15a, increases significantly, which shows the same trend as described by other researchers [27,34]. The experimental data from the image test is well agreed with that obtained by the optical fiber probe with an error within 20%, as shown in Figure 15b. For the lateral distribution of the solids holdup across the cross-sectional area of the gas-solids circulating fluidized bed, as shown in Figure 15c, it is shown that the solids holdup increases from the central of the bed towards the wall. Su et al. reported the same lateral profile characteristic in an 18 m high riser at similar operating conditions [49]. For the constant superficial gas velocity, the solids holdup in the lateral direction increases with the increase of the circulation rate and vice versa. The agreement between the image test and the optical fiber probe measurement is good for the lateral distribution of the solids holdup, which is shown in Figure 15d.

4. Conclusions

A calibration method for quantifying the solids holdup in the fluidized bed was investigated in this work. The calibration curves of four types of particles, including Group A and Group B particles, were obtained in a narrow rectangular liquid-solids fluidized bed and compared. It was found that this calibration method can be used for a wide condition with different kinds of particles and fluidization regimes. The particles’ properties, such as the particle color, the particle size and density, and the bulk density, have effects on the calibration curves.
Both Group A and Group B particles could be uniformly fluidized and suspended in the liquid instead of non-uniformly distributed in gas-solids state, and the grayscale of the digital images shows a narrow range and only one peak rather than a wide range with several peaks, making it possible to correlate the grayscale with the corresponding solids holdup. For both Group A and Group B particles, the grayscale exhibited an exponential relationship with the solids holdup, decreasing rapidly and then becoming stable with the increase of the solids holdup.
For Group A particles, the change of the grayscale with the solids holdup was much larger than that for Group B particles and the particle density also affected the calibration curves. The higher particle density led to narrower change in the solids holdup, providing qualitative indications on the flow characteristics.
Based on the calibration method for image testing, both averaged and local solids holdup can be obtained quantitatively for different fluidization regimes and particles with different properties. The results obtained by using the calibration curve have good agreement with that obtained by the optical fiber probe, which has been widely used for flow structure-testing in fluidized bed reactors.

Author Contributions

C.W. conceptualization, methodology, resources, writing; Z.L. software; validation; formal analysis; J.W. investigation; data curation; X.L. writing-review and editing; supervision; M.Y. and J.G. project administration, funding acquisition. All authors have read and agreed to the published version of the manuscript.

Funding

This research was partially funded on a research contract by the National Science Foundation of China (no. 91834302 and 21978320), whose support is gratefully acknowledged.

Institutional Review Board Statement

Not applicable.

Informed Consent Statement

Not applicable.

Data Availability Statement

Not applicable.

Acknowledgments

We gratefully acknowledge the financial support from the National Science Foundation of China (no. 91834302 and 21978320). The authors express their gratitude to Huifang Zhang, Yang Zhou, and Lei Yu for the experiments. Chengxiu Wang would like to thank Qiang Wei for his support with the experimental facilities.

Conflicts of Interest

The authors declare no conflict of interest. The funders had no role in the design of the study; in the collection, analyses, or interpretation of data; in the writing of the manuscript; or in the decision to publish the results.

Abbreviations

dpparticle size (μm)
Ggrayscale
Gigrayscale for each pixel of the image
ggravitational acceleration (m/s2)
hheight (m)
Ugsuperficial gas velocity (m/s)
Ppressure drop (Pa)
zaxial coordinate (m)
Greek letters
εssolids holdup
εsisolids holdup for each pixel of the image
ρbbulk density of the particles (kg/m3)
ρpparticle density of solids (kg/m3)
ρwaterdensity of water (kg/m3)
Subscripts
bbulk
ggas
pparticle
ssolids

References

  1. Li, Y.; Li, T.; Zhang, H.; Sun, Q.; Ying, W. LDV measurements of particle velocity distribution and annular film thickness in a turbulent fluidized bed. Powder Technol. 2017, 305, 578–590. [Google Scholar] [CrossRef]
  2. Bi, H.T.; Ellis, N.; Abba, I.A.; Grace, J.R. A state-of-the-art review of gas–solid turbulent fluidization. Chem. Eng. Sci. 2000, 55, 4789–4825. [Google Scholar] [CrossRef]
  3. Grace, J.R. Reflections on turbulent fluidization and dense suspension upflow. Powder Technol. 2000, 113, 242–248. [Google Scholar] [CrossRef]
  4. Du, B.; Warsito, W.; Fan, L.-S. Bed nonhomogeneity in turbulent gas-solid fluidization. AlChE J. 2003, 49, 1109–1126. [Google Scholar] [CrossRef]
  5. Gidaspow, D.; Jung, J.; Singh, R.K. Hydrodynamics of fluidization using kinetic theory: An emerging paradigm: 2002 Flour-Daniel lecture. Powder Technol. 2004, 148, 123–141. [Google Scholar] [CrossRef]
  6. Andreux, R.; Gauthier, T.; Chaouki, J.; Simonin, O. New description of fluidization regimes. AlChE J. 2005, 51, 1125–1130. [Google Scholar] [CrossRef]
  7. Yan, D.; Li, H.; Zou, Z.; Zhu, Q. Simulation with a structure-based mass-transfer model for turbulent fluidized beds. Particuology 2018, 39, 40–47. [Google Scholar] [CrossRef]
  8. Chew, J.W.; Cocco, R.A. Fast versus turbulent fluidization of Geldart Group B particles. AlChE J. 2021, 67, e17216. [Google Scholar] [CrossRef]
  9. Edwards, M.; Avidan, A. Conversion model aids scale-up of mobil’s fluid-bed MTG process. Chem. Eng. Sci. 1986, 41, 829–835. [Google Scholar] [CrossRef]
  10. Zhang, C.; Lu, B.; Yuan, X.; Li, H.; Ye, M.; Wang, W. Reactive simulation of industrial methanol-to-olefins fluidized bed reactors and parameter analysis. Powder Technol. 2021, 393, 681–691. [Google Scholar] [CrossRef]
  11. Horio, M.; Clift, R. A note on terminology: ‘Clusters and agglomerates. Powder Technol. 1992, 70, 196. [Google Scholar] [CrossRef]
  12. Manyele, S.V.; Pärssinen, J.H.; Zhu, J.X. Characterizing particle aggregates in a high-density and high-flux cfb riser. Chem. Eng. J. 2002, 88, 151–161. [Google Scholar] [CrossRef]
  13. Wiesendorf, V.; Werther, J. Capacitance probes for solids volume concentration and velocity measurements in industrial fluidized bed reactors. Powder Technol. 2000, 110, 143–157. [Google Scholar] [CrossRef]
  14. Magnusson, A.; Rundqvist, R.; Almstedt, A.E.; Johnsson, F. Dual fibre optical probe measurements of solids volume fraction in a circulating fluidized bed. Powder Technol. 2005, 151, 19–26. [Google Scholar] [CrossRef]
  15. Rhodes, M.J.; Laussmann, P. A simple non-isokinetic sampling probe for dense suspensions. Powder Technol. 1992, 70, 141–151. [Google Scholar] [CrossRef]
  16. Issangya, A.S.; Bai, D.R.; Bi, H.T.; Lim, K.S.; Grace, J.R. Suspension densities in a high-density circulating fluidized bed riser. Chem. Eng. Sci. 1999, 54, 5451–5460. [Google Scholar] [CrossRef]
  17. Wu, C.; Gao, Y.; Cheng, Y.; Wang, L.; Li, X. Solid concentration and velocity distributions in an annulus turbulent fluidized bed. Chin. J. Chem. Eng. 2015, 23, 1077–1084. [Google Scholar] [CrossRef]
  18. Wei, X.; Zhu, J. Capturing the instantaneous flow structure in gas-solid circulating fluidized bed using high-speed imaging and fiber optic sensing. Chem. Eng. Sci. 2019, 207, 713–724. [Google Scholar] [CrossRef]
  19. Ma, Z.; Ma, H.; Qian, W.; Li, Y.; Zhang, H.; Sun, Q.; Ying, W. Flow development and prediction of solids concentration in a large gas-solids turbulent fluidized bed. Can. J. Chem. Eng. 2020, 99, S809–S819. [Google Scholar] [CrossRef]
  20. Yu, S.; Yang, X.; Xiang, J.; Zhou, H.; Li, Q.; Zhang, Y. Effects of bed size on the voidage in gas-solid bubbling fluidized beds. Powder Technol. 2021, 387, 197–204. [Google Scholar] [CrossRef]
  21. Rhodes, M.; Mineo, H.; Hirama, T. Particle motion at the wall of a circulating fluidized bed. Powder Technol. 1992, 70, 207–214. [Google Scholar] [CrossRef]
  22. Xu, Y.; Li, T.; Lu, L.; Gao, X.; Tebianian, S.; Grace, J.R.; Chaouki, J.; Leadbeater, T.W.; Jafari, R.; Parker, D.J.; et al. Development and confirmation of a simple procedure to measure solids distribution in fluidized beds using tracer particles. Chem. Eng. Sci. 2020, 217, 115501. [Google Scholar] [CrossRef]
  23. Yianneskis, M. Velocity, particle sizing concentration measurement techniques for multi-phase flow. Powder Technol. 1987, 49, 261–269. [Google Scholar] [CrossRef]
  24. Kim, S.W. Effect of Particle Size on Carbon Nanotube Aggregates Behavior in Dilute Phase of a Fluidized Bed. Processes 2018, 6, 121. [Google Scholar] [CrossRef] [Green Version]
  25. Wang, S.; Sun, X.; Xu, C.; Bao, J.; Peng, C.; Tang, Z. Investigation of a circulating turbulent fluidized bed with a fractal gas distributor by electrostatic-immune electrical capacitance tomography. Powder Technol. 2020, 361, 562–570. [Google Scholar] [CrossRef]
  26. Maestri, M.; Salierno, G.; Piovano, S.; Cassanello, M.; Cardona, M.A.; Hojman, D.; Somacal, H. CFD-DEM modeling of solid motion in a water-calcium alginate fluidized column and its comparison with results from radioactive particle tracking. Chem. Eng. J. 2019, 377, 120339. [Google Scholar] [CrossRef]
  27. Casleton, D.K.; Shadle, L.J.; Ross, A.A. Measuring the voidage of a CFB through image analysis. Powder Technol. 2010, 203, 12–22. [Google Scholar] [CrossRef]
  28. Yang, J.; Zhu, J. A novel method based on image processing to visualize clusters in a rectangular circulating fluidized bed riser. Powder Technol. 2014, 254, 407–415. [Google Scholar] [CrossRef]
  29. Yin, S.; Zhong, W.; Song, T.; Lu, P.; Chen, Y. Clusters identification and meso-scale structures in a circulating fluidized bed based on image processing. Adv. Powder Technol. 2019, 30, 3010–3020. [Google Scholar] [CrossRef]
  30. Zhang, H.; Johnston, P.M.; Zhu, J.X.; de Lasa, H.I.; Bergougnou, M.A. A novel calibration procedure for a fiber optic solids concentration probe. Powder Technol. 1998, 100, 260–272. [Google Scholar] [CrossRef]
  31. Chen, R.C.; Fan, L.S. Particle image velocimetry for characterizing the flow structure in three-dimensional gas-liquid-solid fluidized beds. Chem. Eng. Sci. 1992, 47, 3615–3622. [Google Scholar] [CrossRef]
  32. Lackermeier, U.; Rudnick, C.; Werther, J.; Bredebusch, A.; Burkhardt, H. Visualization of flow structures inside a circulating fluidized bed by means of laser sheet and image processing. Powder Technol. 2001, 114, 71–83. [Google Scholar] [CrossRef]
  33. Cocco, R.; Shaffer, F.; Hays, R.; Reddy Karri, S.B.; Knowlton, T. Particle clusters in and above fluidized beds. Powder Technol. 2010, 203, 3–11. [Google Scholar] [CrossRef]
  34. Xu, J.; Zhu, J. A New Method for the Determination of Cluster Velocity and Size in a Circulating Fluidized Bed. Ind. Eng. Chem. Res. 2012, 51, 2143–2151. [Google Scholar] [CrossRef]
  35. McMillan, J.; Shaffer, F.; Gopalan, B.; Chew, J.W.; Hrenya, C.; Hays, R.; Karri, S.B.R.; Cocco, R. Particle cluster dynamics during fluidization. Chem. Eng. Sci. 2013, 100, 39–51. [Google Scholar] [CrossRef]
  36. Chew, J.W.; Parker, D.M.; Cocco, R.A.; Hrenya, C.M. Cluster characteristics of continuous size distributions and binary mixtures of Group B particles in dilute riser flow. Chem. Eng. J. 2011, 178, 348–358. [Google Scholar] [CrossRef]
  37. Xu, J.; Zhu, J.X. Visualization of particle aggregation and effects of particle properties on cluster characteristics in a CFB riser. Chem. Eng. J. 2011, 168, 376–389. [Google Scholar] [CrossRef]
  38. Yang, J.S.; Zhu, J. Cluster identification using image processing. Particuology 2015, 23, 16–24. [Google Scholar] [CrossRef]
  39. Mondal, D.N.; Kallio, S.; Saxén, H. Length scales of solid clusters in a two-dimensional circulating fluidized bed of Geldart B particles. Powder Technol. 2015, 269, 207–218. [Google Scholar] [CrossRef]
  40. Wei, X.; Zhu, J. Tracking the flow dynamics in circulating fluidized bed through high-speed photography. Ind. Eng. Chem. Res. 2019, 58, 17540–17548. [Google Scholar] [CrossRef]
  41. Shaffer, F.; Gopalan, B.; Breault, R.W.; Cocco, R.; Karri, S.B.R.; Hays, R.; Knowlton, T. High speed imaging of particle flow fields in CFB risers. Powder Technol. 2013, 242, 86–99. [Google Scholar] [CrossRef]
  42. Gao, X.; Wu, C.; Cheng, Y.-w.; Wang, L.-j.; Li, X. Experimental and numerical investigation of solid behavior in a gas–solid turbulent fluidized bed. Powder Technol. 2012, 228, 1–13. [Google Scholar] [CrossRef]
  43. Zhu, H.; Zhu, J.; Li, G.; Li, F. Detailed measurements of flow structure inside a dense gas–solids fluidized bed. Powder Technol. 2008, 180, 339–349. [Google Scholar] [CrossRef]
  44. Qiang, G.; Zhu, X.; Liu, Y.; Liu, Y.; Li, C.; You, X. Gas–solid flow behavior and contact efficiency in a circulating-turbulent fluidized bed. Powder Technol. 2013, 245, 134–145. [Google Scholar]
  45. Zhu, H.; Zhu, J. Comparative study of flow structures in a circulating-turbulent fluidized bed. Chem. Eng. Sci. 2008, 63, 2920–2927. [Google Scholar] [CrossRef]
  46. Cui, H.; Mostoufi, N.; Chaouki, J. Gas and solids between dynamic bubble and emulsion in gas-fluidized beds. Powder Technol. 2001, 120, 12–20. [Google Scholar] [CrossRef]
  47. Wang, C.; Yang, X.; Wang, M.; Zhang, J.; Lan, X.; Gao, J.; Ye, M.; Zhu, J. Particle Velocity Distribution and Its Prediction in a 14 m Two-Dimensional Circulating Fluidized Bed Riser. Ind. Eng. Chem. Res. 2021, 60, 1901–1911. [Google Scholar] [CrossRef]
  48. Su, X.; Wang, C.; Lan, X.; Pei, H.; Mao, X.; Gao, J. Flow of high solids density suspensions in an 18 m high circulating fluidized bed. Ind. Eng. Chem. Res. 2020, 59, 1336–1349. [Google Scholar] [CrossRef]
  49. Su, X.; Wang, C.; Pei, H.; Li, J.; Lan, X.; Gao, J. Experimental study of solids motion in an 18 m gas–solids circulating fluidized bed with high solids flux. Ind. Eng. Chem. Res. 2019, 58, 23468–23480. [Google Scholar] [CrossRef]
Figure 1. Original image of particle flow in gas-solid fluidized bed and its grayscale histogram. (a) Original image. (b) Grayscale histogram.
Processes 10 00610 g001
Figure 2. Original image of particle flow in liquid-solid fluidized bed and its grayscale histogram. (a) Original image. (b) Grayscale histogram.
Processes 10 00610 g002
Figure 3. Schematic diagram of the calibration system and the fluidized bed for image collection. (a) Liquid-solids fluidized bed for calibration. (b) Gas-solids fluidization system for image collection.
Processes 10 00610 g003
Figure 4. Particle image under different solids holdups for Group A FCC particles.
Processes 10 00610 g004
Figure 5. Calibration curve of solids holdup and image grayscale for FCC particles.
Processes 10 00610 g005
Figure 6. Particle image under different solids holdups for Group A sand particles.
Processes 10 00610 g006
Figure 7. Calibration curve of solids holdup and image grayscale for Group A sand particles.
Processes 10 00610 g007
Figure 8. Calibration curve of Geldart A/A-B particles. (a) Whtie FCC catalyst particle. (b) Yellow FCC catalyst particle. (c) Quartz sand. (d) Glass bead.
Processes 10 00610 g008
Figure 9. Comparison of calibration curves for Geldart A/A-B particles.
Processes 10 00610 g009
Figure 10. Particle image under different solids holdups for Group B sand particles.
Processes 10 00610 g010
Figure 12. Calibration curves of Group A-A-B and Group B particles.
Processes 10 00610 g012
Figure 13. Gas-solids flow images in the gas-solids turbulent fluidized bed of Group A particles with an initial bed height of 0.05 m. (a) Original iamge. (b) Grayscale histogram.
Processes 10 00610 g013
Figure 14. Solids holdup distribution based on image measurement along the gas-solids turbulent fluidized bed with Group A particles. (a) Comparison of axial distribution of solids holdup. (b) Comparison of error between image and probe in axial distribution. (c) Comparison of lateral distribution of solids holdup. (d) Comparison of error between image and probe in lateral distribution.
Processes 10 00610 g014
Figure 15. Solids holdup distribution based on image measurement in the gas-solids circulating fluidized bed with Group A particles. (a) Comparison of solids holdup between image and probe. (b) Comparison of error between image and probe in axial distribution. (c) Comparison of lateral distribution of solids holdup. (d) Comparison of error between image and probe in lateral distribution.
Processes 10 00610 g015
Table 1. Different experimental particle properties.
Particledp (μm)ρp (kg/m3)ρb (kg/m3)ρb/ρpParticle ColorGeldart
Classification
FCC8715199600.64White/YellowGeldart A
Quartz sand76278512510.45WhiteGeldart A-B
Quartz sand262253014150.56WhiteGeldart B
Publisher’s Note: MDPI stays neutral with regard to jurisdictional claims in published maps and institutional affiliations.

