Article

Biosorption of Precious Metals Present at Dilute Concentrations on Fungal Pellets

by
Adriana Jazmín Legorreta-Castañeda
,
Carlos Alexander Lucho-Constantino
,
Claudia Coronel-Olivares
,
Rosa Icela Beltrán-Hernández
and
Gabriela A. Vázquez-Rodríguez
*
Área Académica de Química, Universidad Autónoma del Estado de Hidalgo, Carretera Pachuca-Tulancingo Km. 4.5, Pachuca C.P. 42184, Hidalgo, Mexico
*
Author to whom correspondence should be addressed.
Processes 2022, 10(4), 645; https://doi.org/10.3390/pr10040645
Submission received: 28 February 2022 / Revised: 22 March 2022 / Accepted: 24 March 2022 / Published: 25 March 2022
(This article belongs to the Special Issue Recent Advances in Biosorption Technology)

Abstract

:
Biosorption on fungal pellets constitutes a promising way of removing precious metals, which are often present at dilute concentrations in wastewater. Herein, we studied the Ag and Au biosorption by Aspergillus tabacinus and Cladosporium cladosporioides pellets. For A. tabacinus pellets the optimum pH values for the biosorption of Ag and Au were 5 and 4, respectively, while for C. cladosporioides granules, the best-suited values were 3 and 4, respectively. Biosorption kinetics of both metals were also studied at low adsorbate concentrations (1 mg/L) and the pH values mentioned above, and the contact times that allow maximum recovery of the two metals were defined. At the pH values estimated as optimum, A. tabacinus pellets adsorbed greater amounts of Ag than C. cladosporioides pellets, while for Au the opposite occurred. We found that the pseudo-second-order model adequately represents Ag and Au biosorption kinetics under the conditions tested. Due to the growing demand and limited availability of these metals, their recovery from aqueous residual solutions is economically attractive and desirable in the expanding circular economy scheme.

Graphical Abstract

1. Introduction

Fungal biosorption is emerging as an ecological, economical, and effective alternative for removing contaminants from wastewater [1,2]. Fungal hyphae contain all the components of eukaryotic cells, and are covered by a wall with significant amounts of glycoproteins, chitin, and glucans. Moreover, functional groups that allow biosorption, such as hydroxyl, amino, or carboxyl, are frequent in fungal cell walls [3]. Various industrial processes generate abundant residual fungal biomass, thereby assuring the supply of sustainable biosorbents for environmental remediation purposes [4,5].
Depending on several factors, filamentous fungi can form pellets or granules. They consist of stable agglomerates of filaments with a spherical or ellipsoidal shape that are composed of a branching network of intertwined hyphae [6]. Pellets present several advantages compared to dispersed mycelium in industrial and environmental processes, such as a lower viscosity of the culture medium and easier biomass separation [7,8]. In addition, fungal pellets have been shown to be resistant to severe conditions, such as acid media or low nutrient concentrations, which is favorable for the treatment of industrial wastewater or acid mine drainage [1].
Biosorption on fungal pellets also constitutes a promising way of removing precious metals such as silver (Ag) and gold (Au) from wastewater. On the one hand, the discharge of these metals from secondary sources (such as electronic waste or waste products from the electrolytic refining of raw materials) and in wastewater from the mining industry has created severe water and soil pollution [9,10,11,12,13]. This is particularly true for Ag, as this metal may negatively affect the environment and human health when its concentration is above specific limit values [14]. In the aquatic environment, high Ag concentration can result in damage to different organisms, such as plants and algae [14]. Several studies have reported the toxicity of Ag compounds, especially Ag nanoparticles, in algae, fish, and humans [15]. That is why several standards worldwide have established maximum allowable limits for freshwater and marine waters varying from 0.1 to 7.5 mg Ag/L, while in leachates, the U.S. Environmental Protection Agency set a maximum permissible content of 5 mg Ag/L [14]. On the other hand, due to the growing demand and limited availability of precious metals, their recovery from aqueous residual solutions is economically attractive and desirable in the expanding circular economy scheme [13,16,17,18]. Table 1 presents some studies related to the recovery of Ag and Au through biosorption.
Among the biosorption drawbacks, the low adsorption capacity of the biosorbents and the long process time have been pointed out. However, these parameters can be improved after correctly selecting the fungal strain and the process conditions [10]. The study of these factors becomes even more critical in the case of the recovery of precious metals, mainly due to their limited availability. That is why removing these metals, even though they are present at dilute concentrations in wastewater, represents an economically viable alternative [17,18].
Wastewater from hydrometallurgical processes typically has low concentrations of precious metals [21,22]. For example, cyanide heap leachates may contain between 0.5 and 2 mg/L of Au, mainly as Au(CN)2− [23]. This range is similar to that reported for effluents of a gold mine in Central Victoria, Australia (0.12–0.22 mg/L), which, however, was considered sufficiently concentrated for metal recovery through ion flotation in a pilot plant built in the field [24]. Likewise, the Ag content in heap leach liquors usually varies between 1 and 10 mg/L [22]. It follows from the above that, on the one hand, a reduced concentration in the effluent slows the diffusion of the adsorbate from the solution to the surface of the adsorbent due to a decrease in the concentration gradient [1]. On the other hand, this low concentration may be insufficient for the available sites in the adsorbent, leading to the determination of a limited adsorption capacity [17].
Regarding the control of the adsorption time, in the case of Ag, it has been found that many fungal cultures adsorb half the concentration of the medium in the first five minutes of the process and that it ends after two or three hours [10]. However, several other factors influence biosorption, including the medium pH [1,25], which we investigated herein. This variable affects the speciation of metal ions and also influences the surface properties of adsorbents [26], which modifies the dissociation of linking groups and their surface charge, the activity of functional groups (mainly carboxylate, phosphate, and amino groups) in biomass [27], as well as the competition of metal ions with hydronium ions for adsorption sites [28].
This study aimed to determine the optimal pH for Ag and Au biosorption by two fungal strains, namely, Aspergillus tabacinus and Cladosporium cladosporioides, in granular form. Subsequently, the adsorption kinetics were studied at the pH values determined as optimal, and the contact times that allow maximum recovery of the two metals were defined. For the analysis of adsorption kinetics, we used the pseudo-second-order model.

2. Materials and Methods

2.1. Culture of Fungal Pellets

First, a substrate based on Opuntia sp. was prepared following the methodology established by García-Reyes [29]. One-year-old cladodes were collected in a crop field (Mineral de la Reforma, Hidalgo, Mexico) and later cut into pieces. Pieces were oven-dried for two days at 60 °C. Once dried, the cladodes were ground in a manual mill until a fine powder was obtained. Opuntia sp. powder was suspended in one liter of deionized water. Subsequently, the suspension was heated and maintained boiling for less than 10 min while it was sporadically stirred. After being removed from heat, the suspension was left to settle until two phases were formed. The supernatant was filtered through filter paper and further used as the fungal culture medium.
Second, 300 mL of the filtered culture medium of Opuntia sp. was placed in 500 mL Erlenmeyer flasks, which were then sterilized at 121 °C and 15 psi for 15 min. Sterilized flasks were inoculated under aseptic conditions with spores of A. tabacinus or C. cladosporioides at an average rate of around 2.10·106 spores/mL. The flasks were incubated in an oscillating plate (PolyScience®, Niles, IL, USA) at 150 rpm and room temperature. After six days of incubation, the pellets were collected from the culture medium. Before being used in the biosorption experiments, the pellets were rinsed three times with abundant deionized water to eliminate the rest of the culture medium. Figure 1 shows the full methodology of this study.

2.2. Determination of the Optimal pH for Ag and Au Biosorption on Fungal Pellets

Ag and Au removal percentages and adsorption capacities were determined at different pH values (2–7) with A. tabacinus and C. cladosporioides pellets. Au stock solution was prepared from Au powder reagent < 45 µm (99.99% based on trace metals; Sigma-Aldrich, St. Louis, MO, USA), while Ag stock solution was prepared from powder reagent < 250 µm (99.99% based on trace metals, Sigma-Aldrich, St. Louis, MO, USA). Working solutions (50 mL) were prepared separately by dilution of each metal stock solution with deionized water to obtain initial concentrations of 1 mg/L and then placed in polyethylene containers (previously washed with deionized water and phosphorous-free soap, which were subsequently left to rest for six hours with a 3% HNO3 solution to eliminate any metal ion residues). Solutions were adjusted to different pH values (2–7) by adding NaOH or 3% HNO3. The fungal species were evaluated individually; for this, 0.05 g of the pellets in wet weight (ww) were added to each container. The experiments were carried out in quintuplicate for each pH value.
The containers were kept at room temperature and under agitation at 150 rpm in an oscillating plate (PolyScience®, Niles, IL, USA) for 24 h. Samples of 5 mL were taken before introducing the pellets to determine the initial concentration of the metal ions (Ci) and after 1, 3, and 24 h of contact with either A. tabacinus or C. cladosporioides pellets. The samples were refrigerated at 4 °C until their analysis by flame atomic absorption spectroscopy, for which a spectrophotometer (SpectraAA 800, Varian, Australia) was used.
Blanks were prepared for each pH value evaluated, in which fungal pellets were not added, to unequivocally attribute the decrease in the metal ion concentration to the biosorption on the fungal pellets.
Ag and Au removal percentages were calculated by the following equation
%   R e m o v a l = C i C t     100 C i
where Ci is the initial concentration of the metal, and Ct is the concentration at a given time (1, 3, or 24 h).
Likewise, the amounts of Ag and Au adsorbed by a given mass of pellets (q) of each strain were determined through the following equation
q = C i C t     v m
where v is the volume of the solution (0.05 L), and m is the dry weight (dw, in grams) of the adsorbent introduced to the test.
After 24 h of contact, each of the remaining solutions of the experiments was filtered, and the fungal pellets were recovered from the filter paper to be placed in aluminum trays previously brought to constant weight. Next, the trays were oven-dried at 50 °C for 48 h and weighed [30]. From this weight, the initial weight of the tray was subtracted to obtain the dry weight (dw) of the fungal biomass.

2.3. Ag and Au Biosorption Kinetics by Fungal Pellets

These experiments were carried out in pre-washed polyethylene containers as described above. They were filled with 110 mL of solution with 1 mg Ag/L or 1 mg Au/L, prepared as indicated above. The pH of each solution was adjusted to the best-suited value for either Ag or Au biosorption (determined from the previous experiments). Different amounts of pellets of each strain were evaluated (0.025, 0.050, 0.075, 0.100, 0.125, and 0.150 g; in ww). The containers were placed for 24 h under agitation at the same conditions as described previously. Each biosorbent dosage was tested in quintuplicate. Aliquots of 10 mL were taken to determine the metal concentration at the beginning of the tests (Ci) and at the following contact times: 1, 2, 3, 4, 5, 6, 12, and 24 h. At the end of the tests, the dry weight of the biomass was determined as described above. Aliquots were refrigerated at 4 °C until the metal concentration was determined by the same analytical method as referred in the prior section. For each contact time and as a function of the different dosages of fungal biomass added, the removal percentages of Ag and Au were determined using Equation (1), while the amount of metal adsorbed at each contact time (qt) was calculated through Equation (2).

2.4. Pseudo-Second-Order Kinetic Modeling

Ag and Au biosorption kinetics were modeled through the pseudo-second-order model, which is represented by the following differential equation
d q t d t = k 2 q e q t 2
where qt is the amount of metal ion on the biosorbent surface (mg metal ion/g biosorbent, dw) at any time, t; k2 is the pseudo-second-order rate constant (g dw biosorbent/mg metal ion·h); qe is the amount of metal ion adsorbed at the equilibrium (mg metal ion/g biosorbent, dw). The number of available adsorption sites decreases during adsorption, along with the concentration of adsorbate molecules. If there exists a linear correlation between these two effects, the pseudo-second-order model can describe the adsorption kinetics [31]. Integration of Equation (3) from t = 0 to t = t, and from qt = 0 to qt = qt gives
1 q e q t = 1 q e + k 2 t
Equation (4) can be rearranged to at least five different linear forms [32]. Equation (5) is one of these linear equations [33], and it was used in this study to calculate the rate constants qe and k2 by regression analysis of t/qt versus t.
t q t = 1 k 2 q e 2 + 1 q e t
Most of the published studies used Equation (5) because it enables an adequate fitting of experimental data [31]. However, it has been signaled that the latter does not imply for certain that the model reflects the physical nature of adsorption processes in any meaningful sense, and that results obtained from performing linear regression for non-linear models should be taken with precaution [31]. Other authors have pointed out that sorption processes require the analysis under non-stationary conditions, which is not frequent in the bibliography [34].

2.5. Data Statistical Analysis

To evaluate the effect of the pH value and the biosorbent dosage on the Ag and Au removal percentages by pellets of A. tabacinus and C. cladosporioides, as well as on the amounts of metal adsorbed, we performed a one-way analysis of variance analysis (ANOVA). pH values and biosorbent dosages were taken as factors, while the removal percentage of each metal ion and the amount of metal adsorbed were considered as dependent variables. First, it was verified that the data met the hypotheses underlying the parametric tests (normality and homogeneity of variances), for which the Kolmogorov–Smirnov and Shapiro–Wilks methods were used. Then, an exploratory analysis, descriptive statistics, and post hoc parametric tests were also conducted. A significance level of 0.05 and the SPSS Statistics v.21 software (IBM Corp., Armonk, NY, USA) were used in these statistical analyses.
Post hoc multiple comparison tests (HSD-Tukey, least significant difference, and Bonferroni and Student–Newman–Keuls tests) were performed to find significant differences (0.05 ≤ p ≤ 0.1) between the percentages of Ag and Au removal and the factors studied (pH value and biosorbent amount). Among these tests, the HSD-Tukey test was selected because it allows for all possible pairwise comparisons, which give an estimate of the difference between the groups and a confidence estimate for this estimate [35].

3. Results and Discussion

3.1. Determination of the Optimal pH for Biosorption on Aspergillus tabacinus Pellets

3.1.1. Biosorption of Ag

Figure 2 shows the Ag removal achieved by A. tabacinus pellets at different pH values (2–7) after 1, 3, and 24 h of contact. In general, Ag removal increases along with contact time. The decrease in Ag concentration observed in the tests can be unequivocally attributed to biosorption on the pellets because the initial concentrations of the blanks at different pH values (2–7) did not present significant variations (p ≤ 0.05) in the samples taken.
During the first hour of contact, the highest removal percentages (32.34% and 28.46%) occurred at pH values of 3 and 5, respectively. After three hours of contact, no significant differences were found (p ≤ 0.05) in the removal obtained with pH values 2, 4, 6, and 7, among which the highest percentage occurred at pH 4 (92.61%). Removals determined at these pH values differed significantly from those obtained at pH 3 and 5. After 24 h of contact, the Ag removal percentages were higher than 99% at all the pH values evaluated, and no significant differences were found between them (Figure 2).
Tyupa et al. [10] evaluated the Ag biosorption by live pellets of Penicillium glabrum, Fusarium nivale, and F. oxysporum, and they noted that the adsorption process was completed in shorter contact times than those used in the present study. The pellets of the species mentioned above were put in contact with initial concentrations of 200, 300, and 500 mg Ag/L, which were mostly eliminated (at 80%, 85%, and 95%, respectively) after 30 min. However, the authors concluded that the optimal pH for biosorption was 9, which may imply that the removals achieved were actually due to the precipitation of Ag as oxyhydroxide [36].
Once the dry weight of the biomass added to each trial was obtained, the amount of Ag adsorbed on the A. tabacinus pellets was determined as a function of pH. In the first hour of contact between the Ag solution and the biomass, the highest amounts of Ag were adsorbed (6.63 and 6.77 mg Ag/g dw pellets) at pH values of 3 and 5, respectively (Figure 3).
On the one hand, after three hours of contact, the highest amounts of Ag were adsorbed (14.84, 14.63, and 13.21 mg Ag/g dw pellets) at pH 4, 6, and 7, respectively. These amounts of Ag adsorbed are similar to those reported for the fungal strains of P. chrysogenum (4.6 mg/g) and F. coccineum (15.0 mg/g) [37,38]. On the other hand, after 24 h of contact, there were no significant differences (p ≤ 0.05) in the Ag adsorbed (11.24–12.35 mg Ag/g dw pellets) in the range of pH 2 to 7.
In Ag biosorption tests (Ci = 10 mg/L) carried out with dry biomass of A. niger functionalized with hexadecyltrimethylammonium bromide, a contact time of five minutes was sufficient to remove the silver in solution. Moreover, the amounts of Ag adsorbed at pH between 3 and 7 were similar, around 5 mg/g [36]. Our experiments show that it is not necessary to functionalize biomass to adsorb significant amounts of Ag.
As Figure 3 indicates, the best Ag adsorption capacities in A. tabacinus for 3 and 24 h were obtained at pH 4, which agrees with previous reports about the recovery of Ag(I) from electronics industry wastewater on a clay mineral compound [39]. However, in the present study, a suboptimal pH value (5) was selected for the subsequent experiments because it allows more reproducible values of metal concentration to be obtained. Regarding the contact time, the highest removal percentages were observed after 24 h of contact in the entire pH range evaluated.

3.1.2. Biosorption of Au

Figure 4 shows the Au removal rates obtained for A. tabacinus pellets. As with the removal of Ag demonstrated in the previous section, the decrease in Au concentration could be attributed solely to fungal biosorption since the Au concentrations of the blanks prepared at different pH values (2–7) did not present significant variations (p ≤ 0.05) during the experiments. Au biosorption by A. tabacinus also seems to increase along with contact time, although a smaller increase than that observed for Ag. In the first hour of contact, no statistically significant differences were observed (p ≤ 0.05) in the Au removal percentages (17.12–19.65%) obtained at pH values 3, 6, and 7, but these removals did differ significantly (p ≤ 0.05) from those determined at the other pH values evaluated. After three hours of contact, no significant differences (p ≤ 0.05) were found in the removal percentages obtained (28.49–33.08%) at the different pH values considered (2–7). After twenty-four hours, no differences were observed (p ≤ 0.05) in the removal percentages obtained at pH 2, 3, and 7, but these percentages did differ significantly (p ≤ 0.05) from those resulting at pH 4, 5, and 6. However, the highest percentages of Au removal (33.91%, 57.11%, and 69.94%) were observed at pH 4, regardless of the contact time (1, 3, and 24 h, respectively). After three hours of contact, Au removal at pH 4 (57.11%) is similar to the value reported (i.e., 60%) for the same contact time at pH 3.5 for live pellets from a coculture of A. niger and the algae Tetradesmus obliquus AS-6-1 [9].
Solution pH is a critical parameter in fungal biosorption [8]. At acidic pH values, the protonation of the functional groups on the fungal cell surface increases [40]. Therefore, the interaction between AuCl4 and protonated binding sites is enhanced by electrostatic attractions and ion pairing [41]. However, in very acidic solutions (for example, at pH 2 or 3), there may be competition between counterions (chloride ions, negatively charged) and AuCl4, which reduces the adsorption capacity [9], as is shown in Figure 4.
Figure 5 shows the amounts of Au adsorbed on A. tabacinus pellets as a function of pH. During the first hour of contact, no statistically significant differences (p ≤ 0.05) were observed between the amounts of Au adsorbed at pH 2, 3, 6, and 7, but these did differ from the lowest (1.11 mg Au/g dw pellets) and the highest (5.17 mg Au/g dw pellets) amounts measured (at pH 5 and 4, respectively) After three hours of contact, there were no significant differences (p ≤ 0.05) in the amounts of Au adsorbed in the 2–7 pH range, except for pH 4. Finally, after a contact time of 24 h, the amounts of Au adsorbed on A. tabacinus pellets at the 4–6 pH values did not show significant differences (p ≤ 0.05).
In general, it was observed that the highest amounts of Au adsorbed (5.17, 6.79, and 6.28 mg Au/g dw pellets of A. tabacinus) were obtained at pH 4 in the three contact times evaluated (1, 3, and 24 h). These values are much lower than those found in the study mentioned above regarding a coculture of A. niger and Tetradesmus obliquus (70–90 mg Au/g), which was most likely due to the high initial concentrations of Au used in those assays (80–200 mg/L) [9]. It is worth mentioning that the concentrations of Au used in most of the reported studies [41,42,43] are high concentrations that are not commonly present in effluents from mining industries [11,44,45]. Thus, the main contribution of our work would be the study of precious metals biosorption under realistic conditions, which represents a subject of great interest from fundamental and applied research viewpoints for some authors [41].
The Au removal and the amount of Au adsorbed on A. tabacinus pellets were maximal at pH 4 (as shown in Figure 4 and Figure 5, respectively), regardless of the contact time. Therefore, this pH value was considered optimal in the subsequent experiments. Various authors have suggested that the significant biosorption of Au at acidic pH is due to the protonation of the functional groups of the fungal cell wall [9,41,46]. Sathishkumar et al. [41] evaluated Au recovery by dry Sargassum sp. They observed that at acidic pH values (2–4), the percentage of AuCl4 adsorption increased, while it decreased considerably in the 6–10 pH range. The maximum amount of Au adsorbed (32.94 mg Au/g) in dry Sargassum sp. was obtained at pH 2, with an initial metal concentration of 100 mg/L. Similarly, Shen and Chirwa [47] reported the maximum amount of Au adsorbed (50 mg Au/g) on the algae Scenedesmus obliquus AS-6-1 at pH 2.0 and under optimum conditions (biomass dosage, 0.10 g/L; temperature, 20–25 °C; initial Au concentration, 5 mg/L). In another work, the maximum biosorption of Au(III) by Pseudomonas maltophilia occurred at acidic pH (2–3), while at pH values above and below this range, Au biosorption decreased rapidly [46]. Amounts of Au adsorbed on A. tabacinus pellets are much lower in our study compared to the bibliography. However, our view is that evaluating the potential of fungal pellets as biosorbents at low metal concentrations (<10 mg/L) allows for a more realistic approach in precious metal removal and recovery from wastewater.
When comparing Ag and Au biosorption by A. tabacinus pellets, it was observed that this strain tends to adsorb more Ag than Au. In fact, amounts of Ag adsorbed after 3 and 24 h of contact are up to twice as large as those obtained for Au under the same conditions.

3.2. Determination of the Optimal pH for Biosorption on Cladosporium cladosporioides Pellets

3.2.1. Biosorption of Ag

Figure 6 shows the Ag removal in C. cladosporioides pellets, at different pH values (2–7), and after 1, 3, and 24 h of contact. The highest removal rates were observed at acidic pH values (2 and 3), which were 10.39–58.35% and 16.69–60.87%, respectively, in the different contact times evaluated. At pH 4–7 no significant differences were found (p ≤ 0.05) in the Ag removals, but these values did differ from the percentages obtained at pH 2 and 3. This agrees with the results of Singleton and Simmons [48] for the Ag biosorption on Saccharomyces cerevisiae, because there were no significant differences (p ≤ 0.05) in the removals and amounts of metal adsorbed at pH values of 4.1 and 6.5. As is evident, C. cladosporioides pellets removed Ag less efficiently than A. tabacinus pellets.
As occurred for the Ag removal percentages achieved by this strain (Figure 6), the amounts of metal adsorbed at pH 4–7 (Figure 7) did not present significant differences (p ≤ 0.05) between them, but they did differ from the results corresponding to the more acidic pH values. After 1, 3, and 24 h of contact, the highest amounts of Ag were adsorbed at pH 2 (1.79, 2.63, and 5.66 mg Ag/g dw pellets, respectively) and pH 3 (2.65, 3.39, and 5.69 mg Ag/g dw pellets, respectively). Therefore, pH 3 was selected as the optimum for Ag biosorption with C. cladosporioides pellets. This is in good agreement with Pethkar et al. [49], who concluded that pH 4 was the optimum for Ag biosorption in C. cladosporioides. In another study carried out at higher pH values (5–7), any influence of this parameter on Ag biosorption by A. niger pellets was observed [50].

3.2.2. Biosorption of Au

Au removal achieved by C. cladosporioides pellets at different pH values (2–7) after 1, 3, and 24 h of contact is presented in Figure 8. During the first hour, the highest removal of Ag was obtained at pH 3 (17.12%), while the lowest rates were achieved at pH 6 and 7. However, no statistically significant differences (p ≤ 0.05) were detected at the pH values evaluated. After three hours of contact, no significant differences (p ≤ 0.05) between the Au removal rates obtained at pH 2, 6, and 7 were observed, but these values did differ significantly (p ≤ 0.05) with those obtained at pH 3, 4, and 5. After 24 h of contact, statistically significant differences (p ≤ 0.05) were found in the removals obtained at the different pH values evaluated, except between the pH values 3 and 4, for which the highest Au removals (82.23 and 83.43%, respectively) were measured. The lowest removals were also determined at pH 6 and 7.
Figure 9 shows the amounts of Au adsorbed on C. cladosporioides pellets. For the first hour of contact, the highest amount of Au was adsorbed at pH 3, while after 3 and 24 h of contact, the highest amounts (4.00 and 7.82 mg Au/g dw pellets, respectively) were adsorbed at pH 4. Hence, the Au biosorption kinetic study with this fungal strain (Section 3.4.2) was conducted at pH 4.
For Au, the highest removal percentages (Figure 8) and adsorbed amounts (Figure 9) by C. cladosporioides were measured after 24 h of contact. This time is considerably higher than the 100 min applied in a previous study [49], after which about 90% of a 100 mg Au/L solution was removed, and an adsorption capacity of 100 mg/g was determined. However, these authors used pellets of dry biomass of C. cladosporioides bound to keratin, which prevents direct comparison with the values reported here.
Several authors [9,41,46] reported a 2–4 pH range as optimum for the Au biosorption, which is in line with the value proposed by the present study, among other works. For instance, the maximum Au adsorption capacity of Candida krusei (1300 µmol/g dw cells) was measured at pH 4. After 72 h, Au removal was also high (>70%, with Ci = 50 mg Au/L at this pH value [16]. Han et al. [51] evaluated the Au biosorption by Tepidimonas fonticaldi AT-A2 protein for Au recovery from wastewater containing 15 mg Au/L, at different pH values (2–7), 30 °C, 1 atm, and an incubation time of 60 min. The maximum amount of metal adsorbed (0.94 mg Au/mg protein) was obtained at pH 4–5, while the metal adsorbed dropped to around 0.54 mg Au/mg protein when the pH values increased to 6–7.
Finally, it was observed that the C. cladosporioides pellets are more suited to gold than to silver biosorption, contrary to what was concluded for A. tabacinus pellets. A similar result was reported for processing an electronics industry wastewater with a clay mineral composite because the adsorption capacities of Au and Ag were 108.3 and 85 mg/g, respectively [39].

3.3. Biosorption Kinetics on Aspergillus tabacinus Pellets

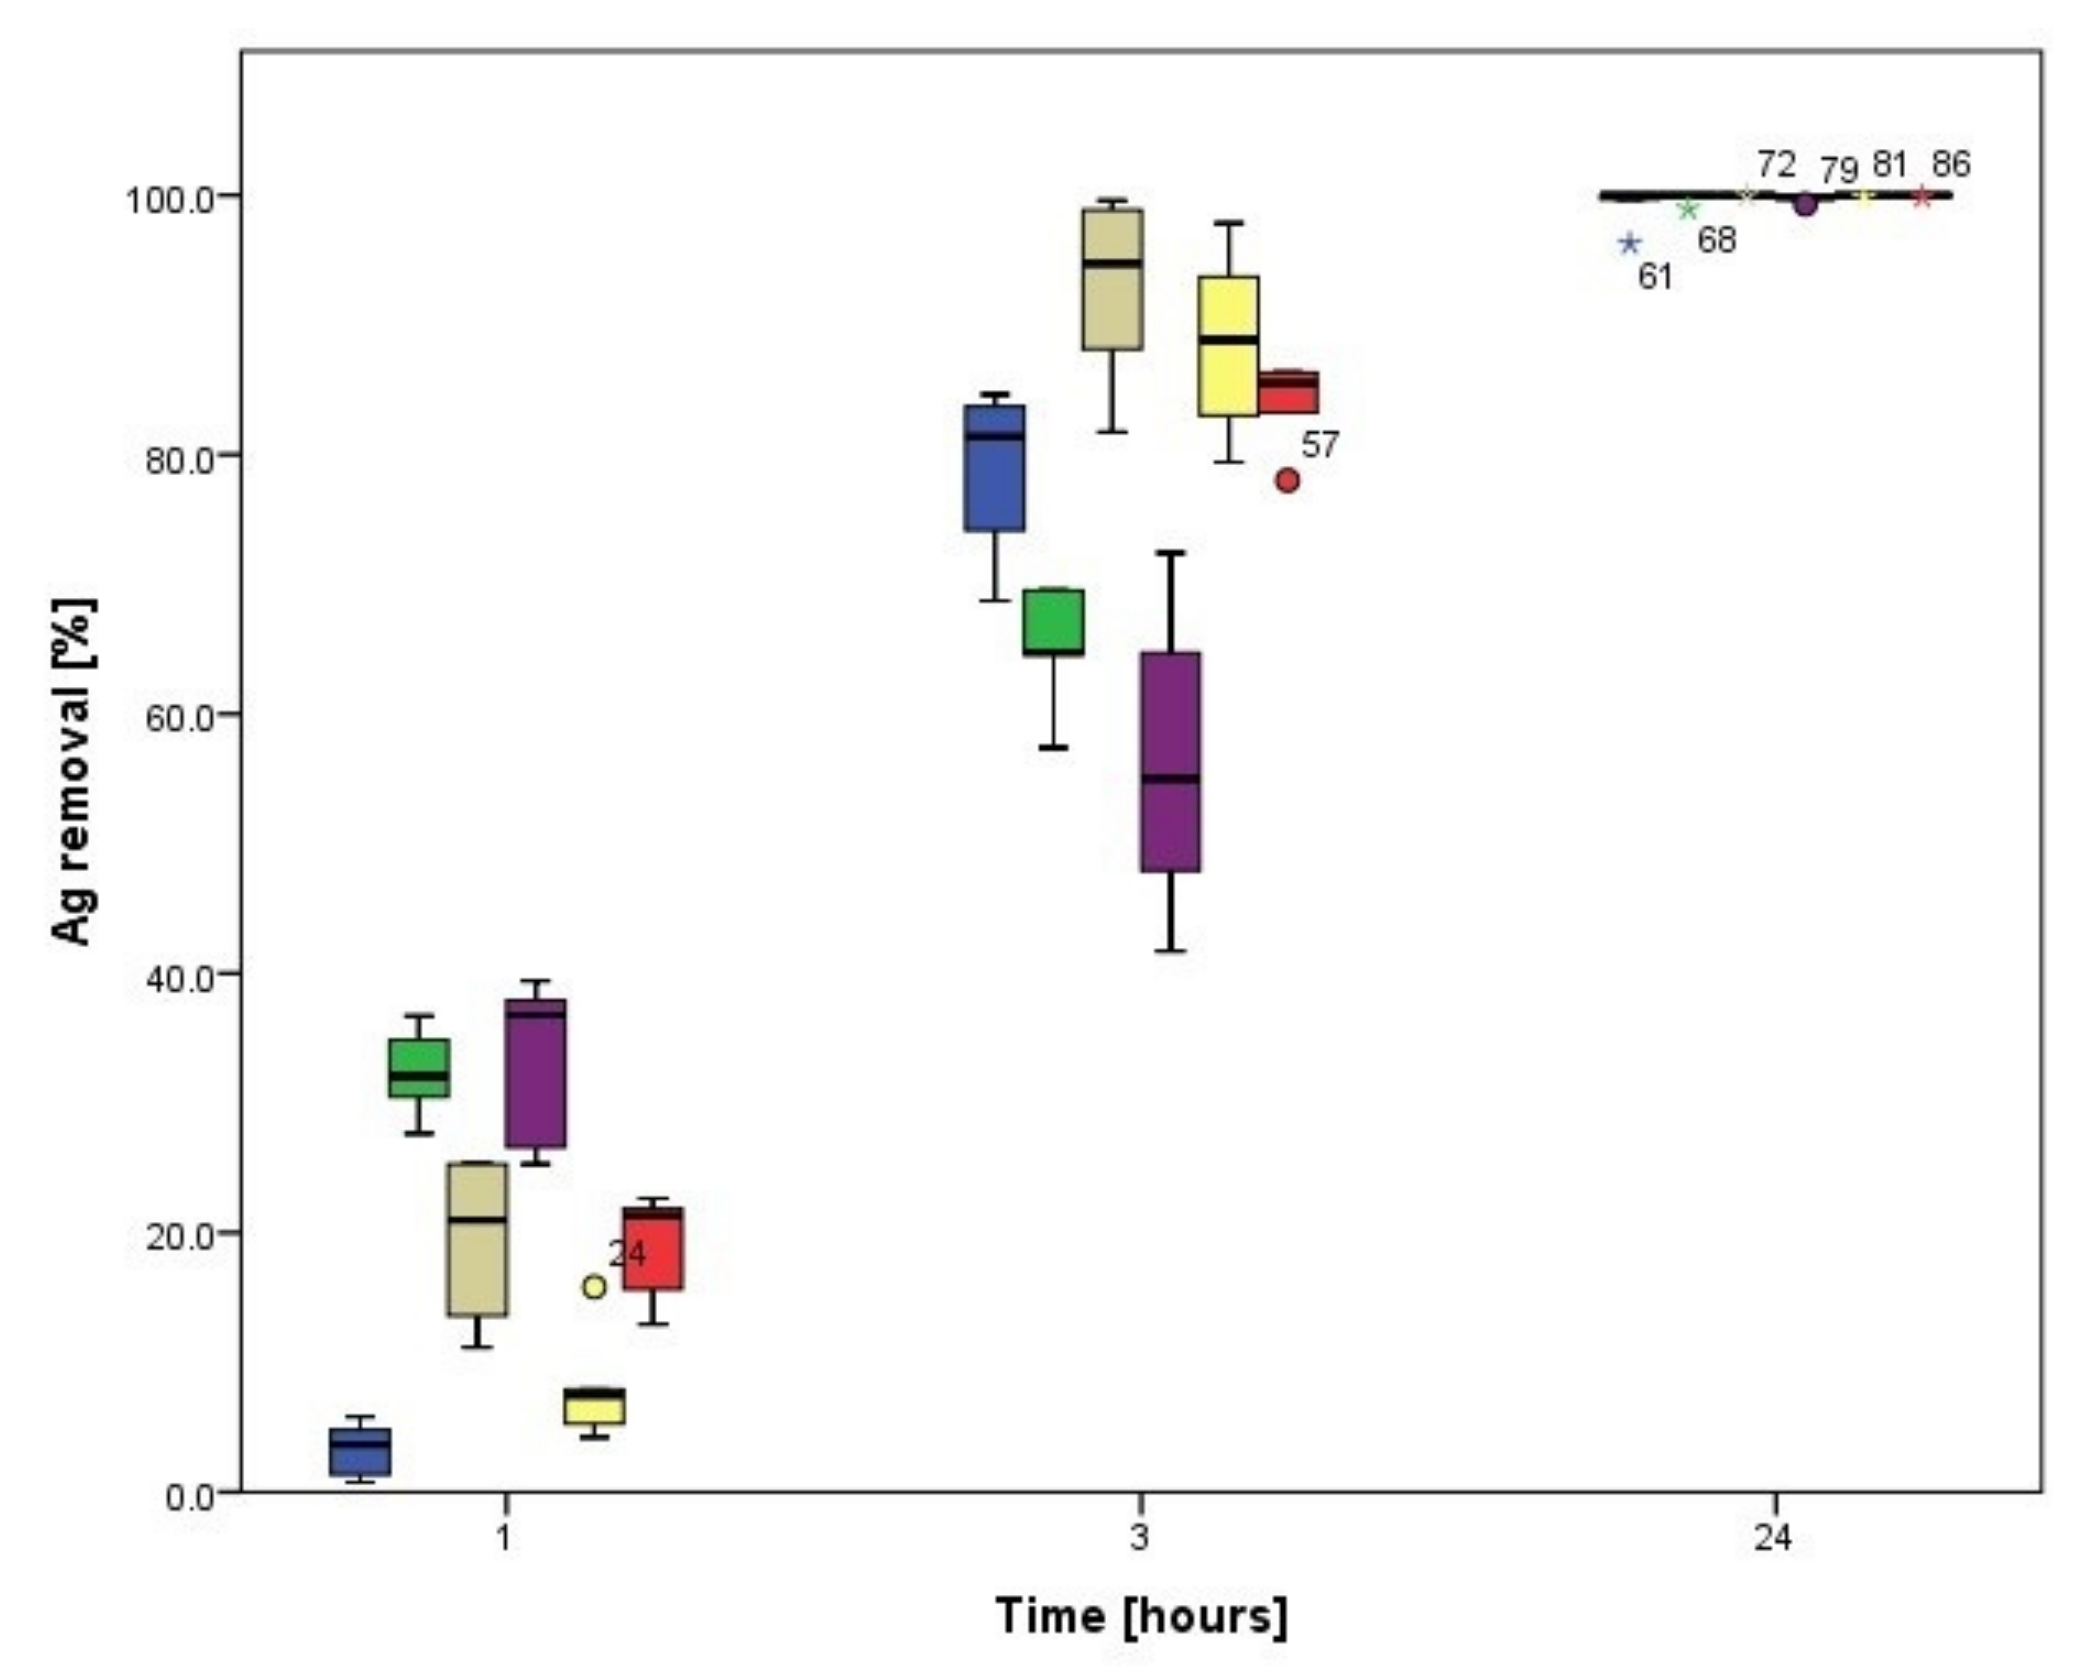
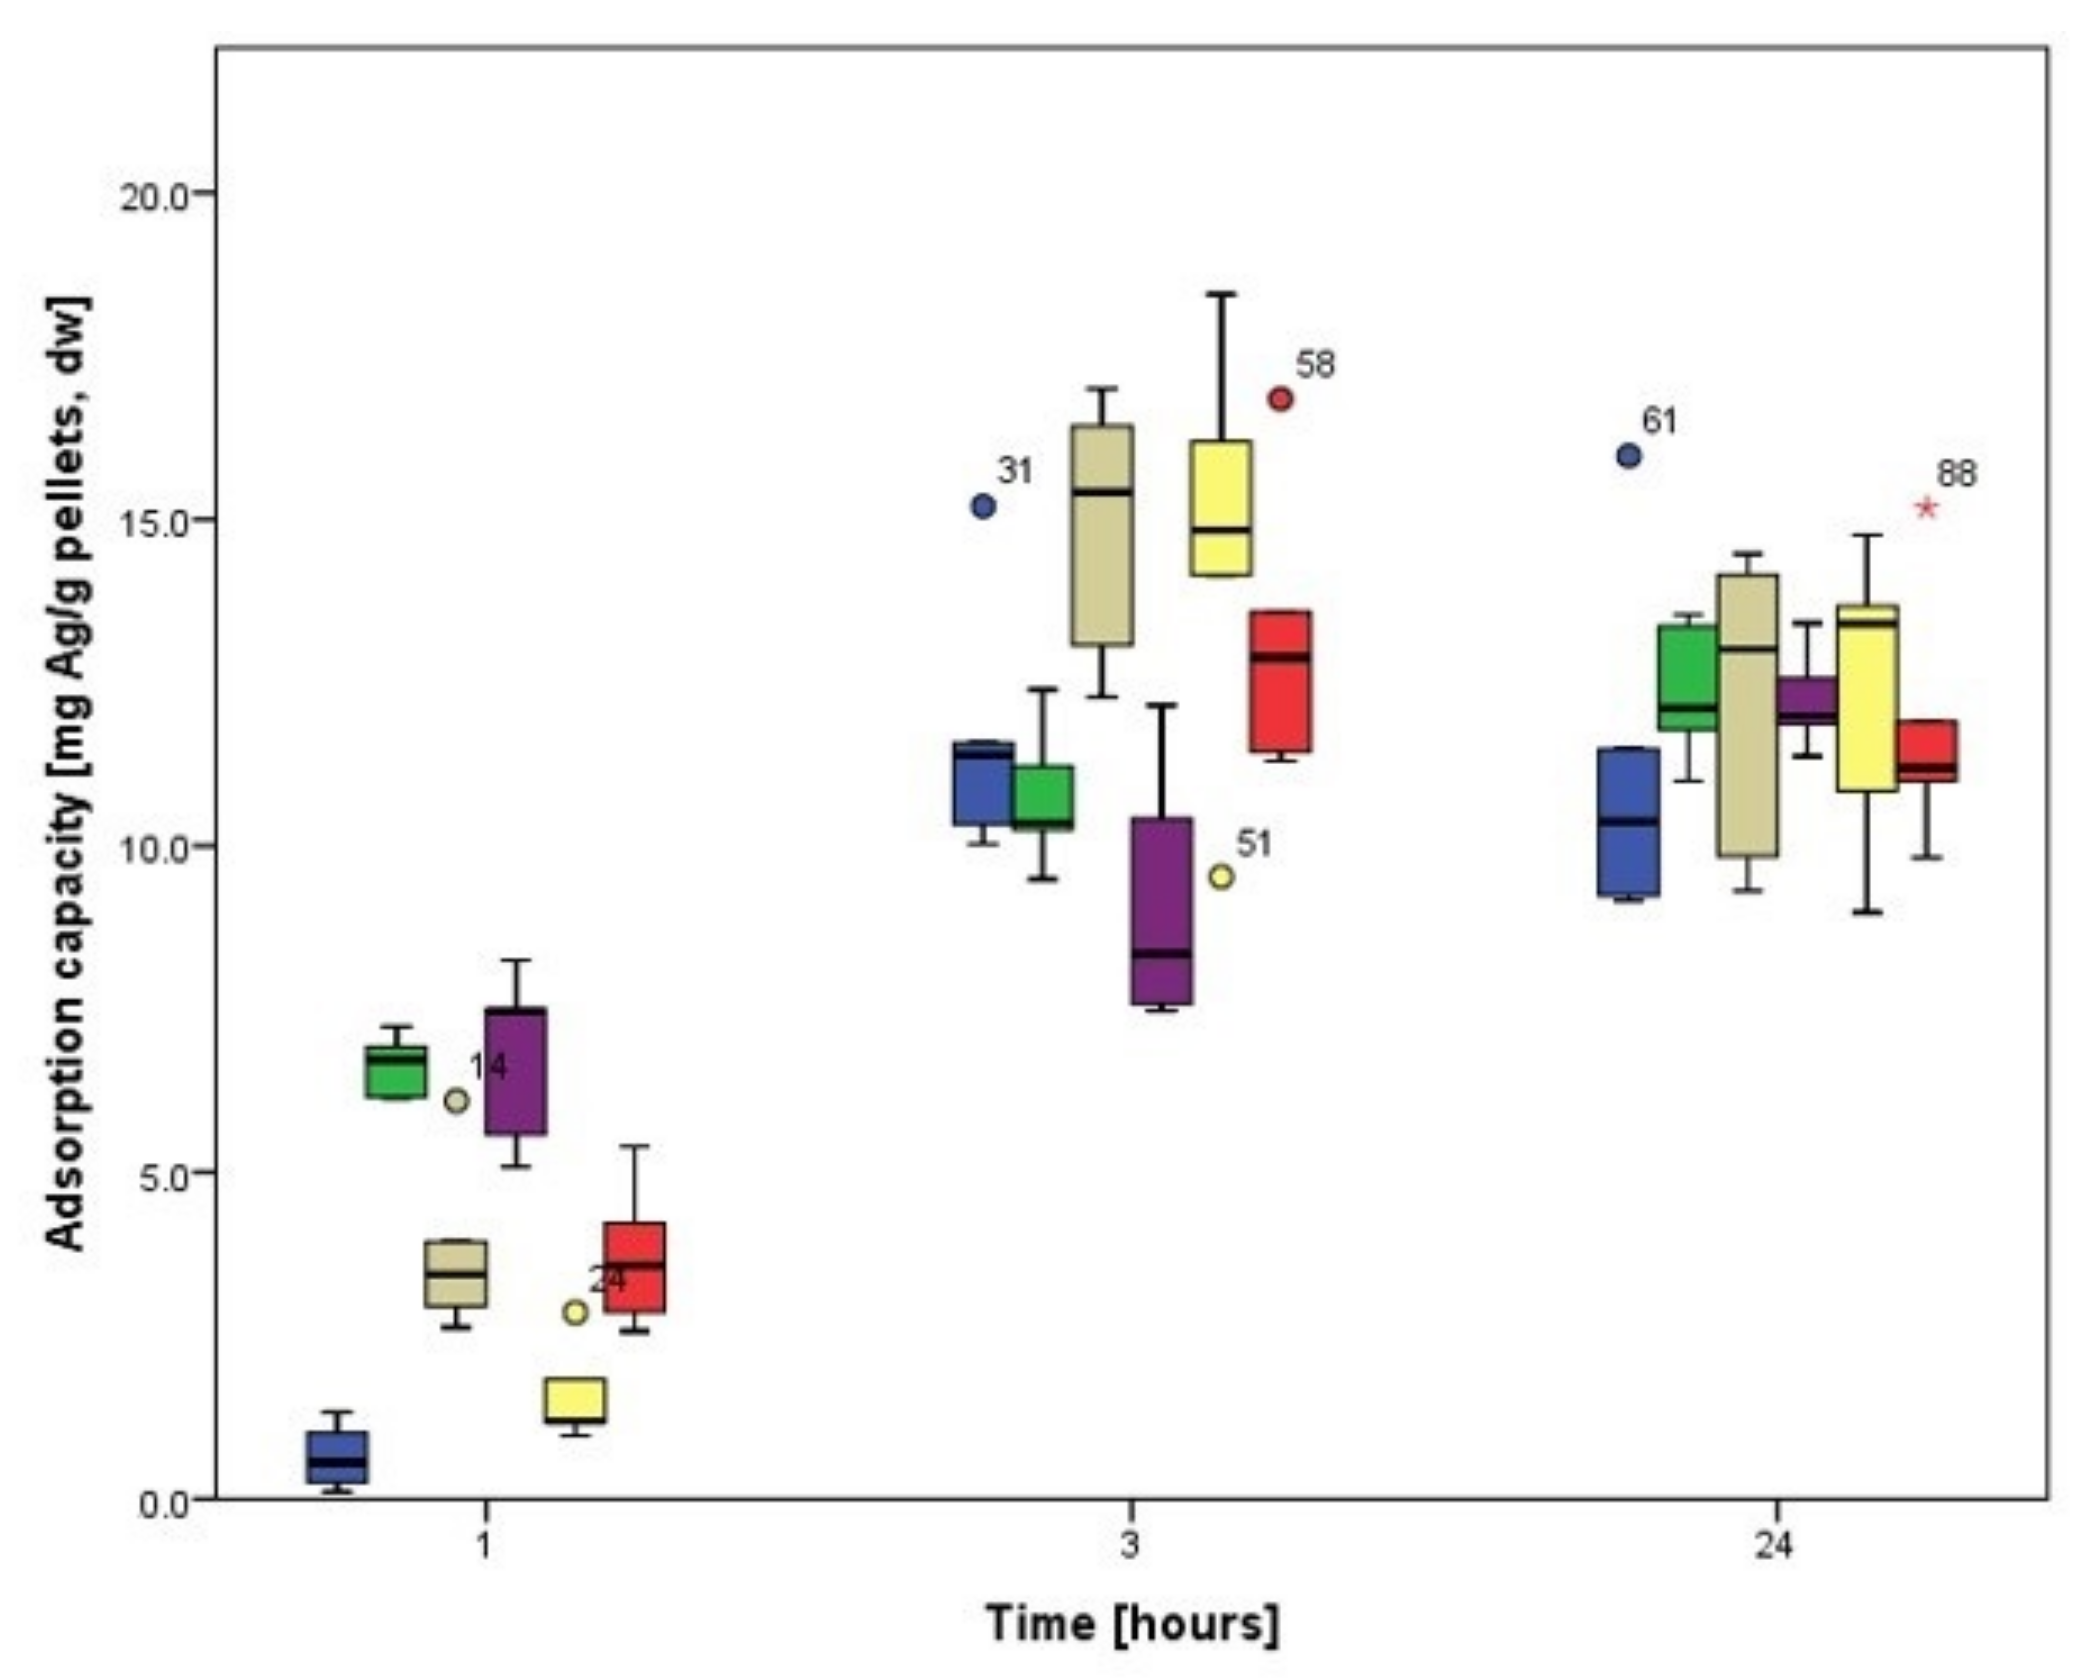
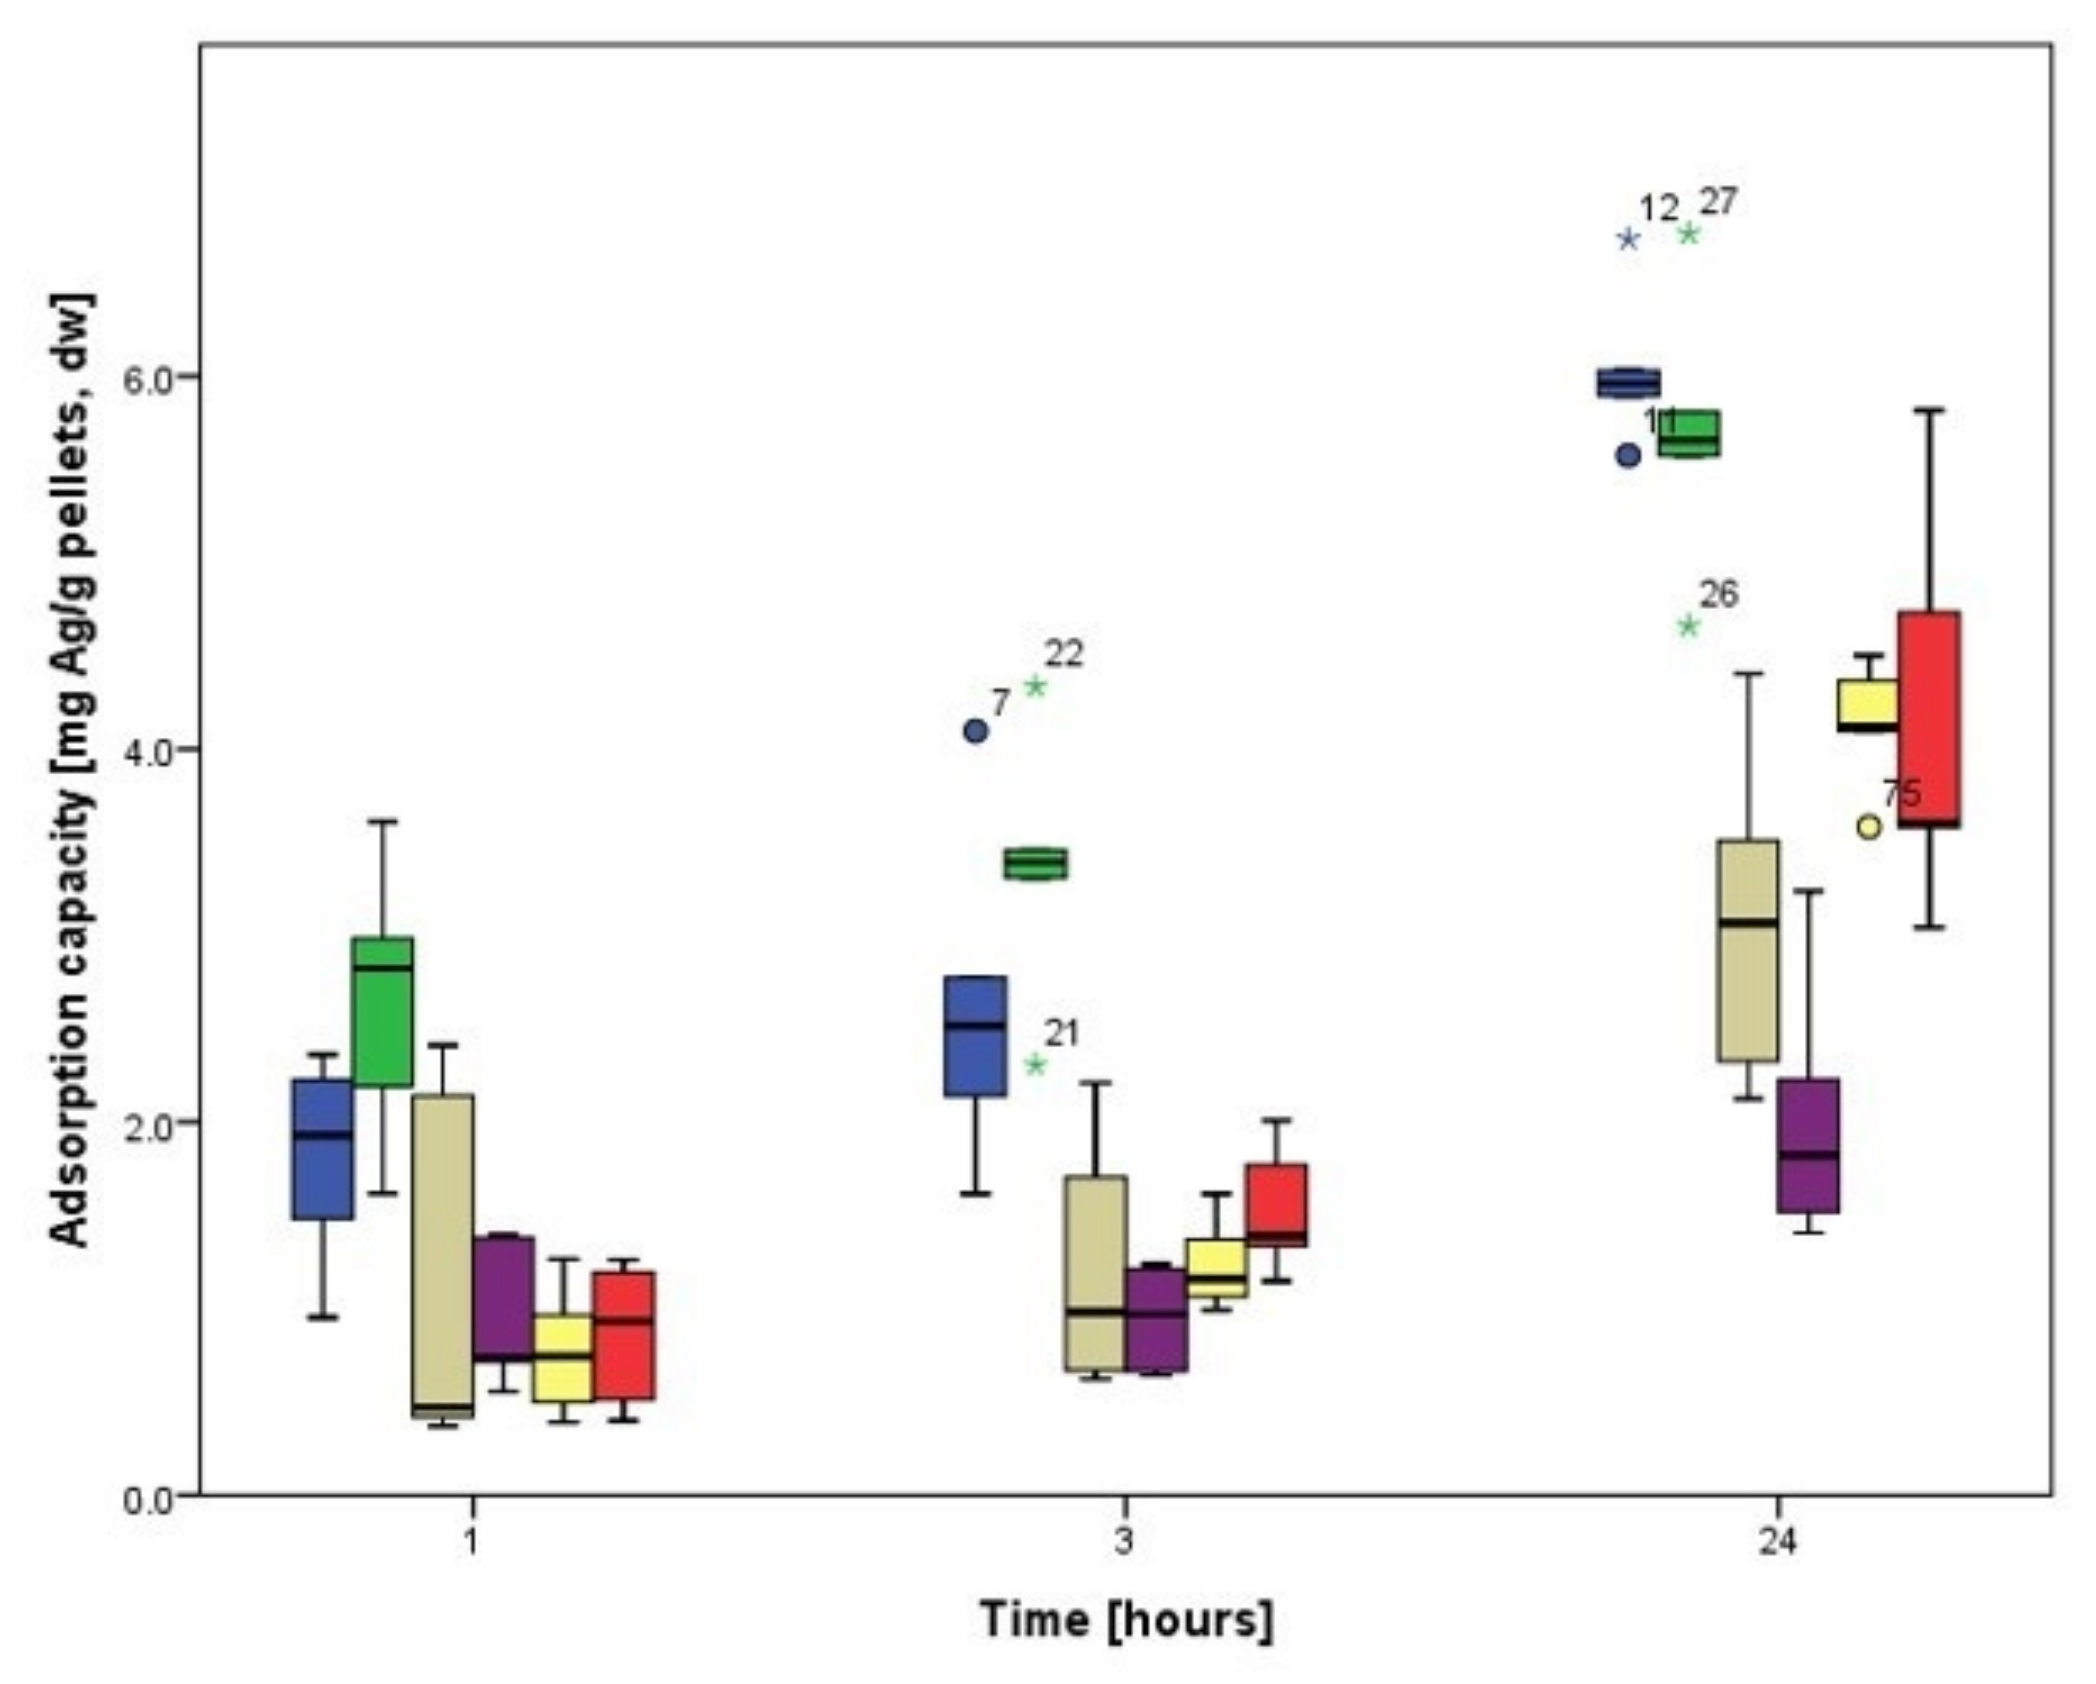
3.3.1. Biosorption Kinetics of Ag

Figure 10 shows the Ag removal at pH 5 and as a function of both the dosage of A. tabacinus pellets and the contact time. Regardless of the biomass dosage, Ag removal was more significant at higher contact times; that is, no metal desorption was observed during the first 24 h. When using between 0.05 and 0.075 g ww of A. tabacinus pellets, and after 24 h of contact, the highest Ag removal percentages were obtained, and not with the highest biomass quantity evaluated (0.150 g ww).
During the first two hours of contact, there were no significant differences (p ≤ 0.05) in Ag removal when 0.025, 0.050, 0.075, and 0.100 g ww of A. tabacinus pellets were used. After three hours of contact, no significant differences (p ≤ 0.05) were observed between the six amounts of biomass evaluated. However, after four hours, significant differences (p ≤ 0.05) were only found when 0.075 and 0.125 g ww of A. tabacinus were used, and after six hours only with 0.075 g ww (72.98%). Finally, after a contact of twenty-four hours, the removal of Ag obtained with 0.050, 0.075, 0.100, and 0.125 g ww did not differ significantly (p ≤ 0.05) from each other, but these values did differ from those resulting from the addition of 0.025 and 0.150 g ww of A. tabacinus pellets.
Ag biosorption kinetics obtained for each amount of A. tabacinus (in dry weight) were adjusted to the pseudo-second-order model by linearization (Equation (5)), which is presented in Figure S1 (Supplementary Material). Table 2 shows the values of the parameters k (rate constant) and qe (equilibrium biosorption capacity) calculated from the straight lines obtained, as well as the Pearson linear correlation coefficients (r2). Since the values of r2 determined are close to 1, it can be considered that Ag biosorption in A. tabacinus pellets adequately fits the pseudo-second-order kinetic model. In addition, it was found that there are no pronounced differences between the experimental and simulated amounts of Ag adsorbed on A. tabacinus pellets with the calculated constants (Figure 11).
As Figure 11 suggests, the amount of Ag adsorbed on A. tabacinus pellets increases with time until saturation occurs (i.e., a plateau appears) due to a decrease in the adsorption concentration gradient. Both the level of the plateau and the initial slope of the curve depend on the mass of adsorbent used. At low dosages of biosorbent, its active sites are entirely exposed to the adsorbate, leading to a fast and efficient occupation of the available adsorption surface [52,53]. Therefore, biosorption kinetics can only be compared if similar amounts of adsorbent are used and other variables, such as the initial adsorbate concentration, are held constant [52]. For example, in the tests carried out with the highest doses of adsorbent (0.0076 and 0.0108 g dw), the plateau was reached after the first hour of contact, while with the lowest amounts of pellets (0.0019–0.0050 g dw), the plateaus were less sharp and reached after about five hours.
Despite the notorious differences in the experimental conditions, in the scarce bibliography available, it is reported that the fit to the pseudo-second-order model of the Ag(I) biosorption kinetics by the dry fruiting bodies of Pleurotus platypus, a macrofungus, values of 50.50 mg Ag/g and 0.0662 g dw/mg·min were obtained for qe and k, respectively [54]. These values, obtained with adsorbate concentrations between 100 and 300 mg/L and at pH 6, are similar to those determined using 0.025 g dw of A. tabacinus pellets (Table 1). In another study, carried out with dry residues of Saccharomyces cerevisiae with 100 mg Ag/L as an initial concentration and at pH 3, the constants qe and k were estimated at 31.1 mg Ag/g and 1.58 g/mg·h, respectively [55].

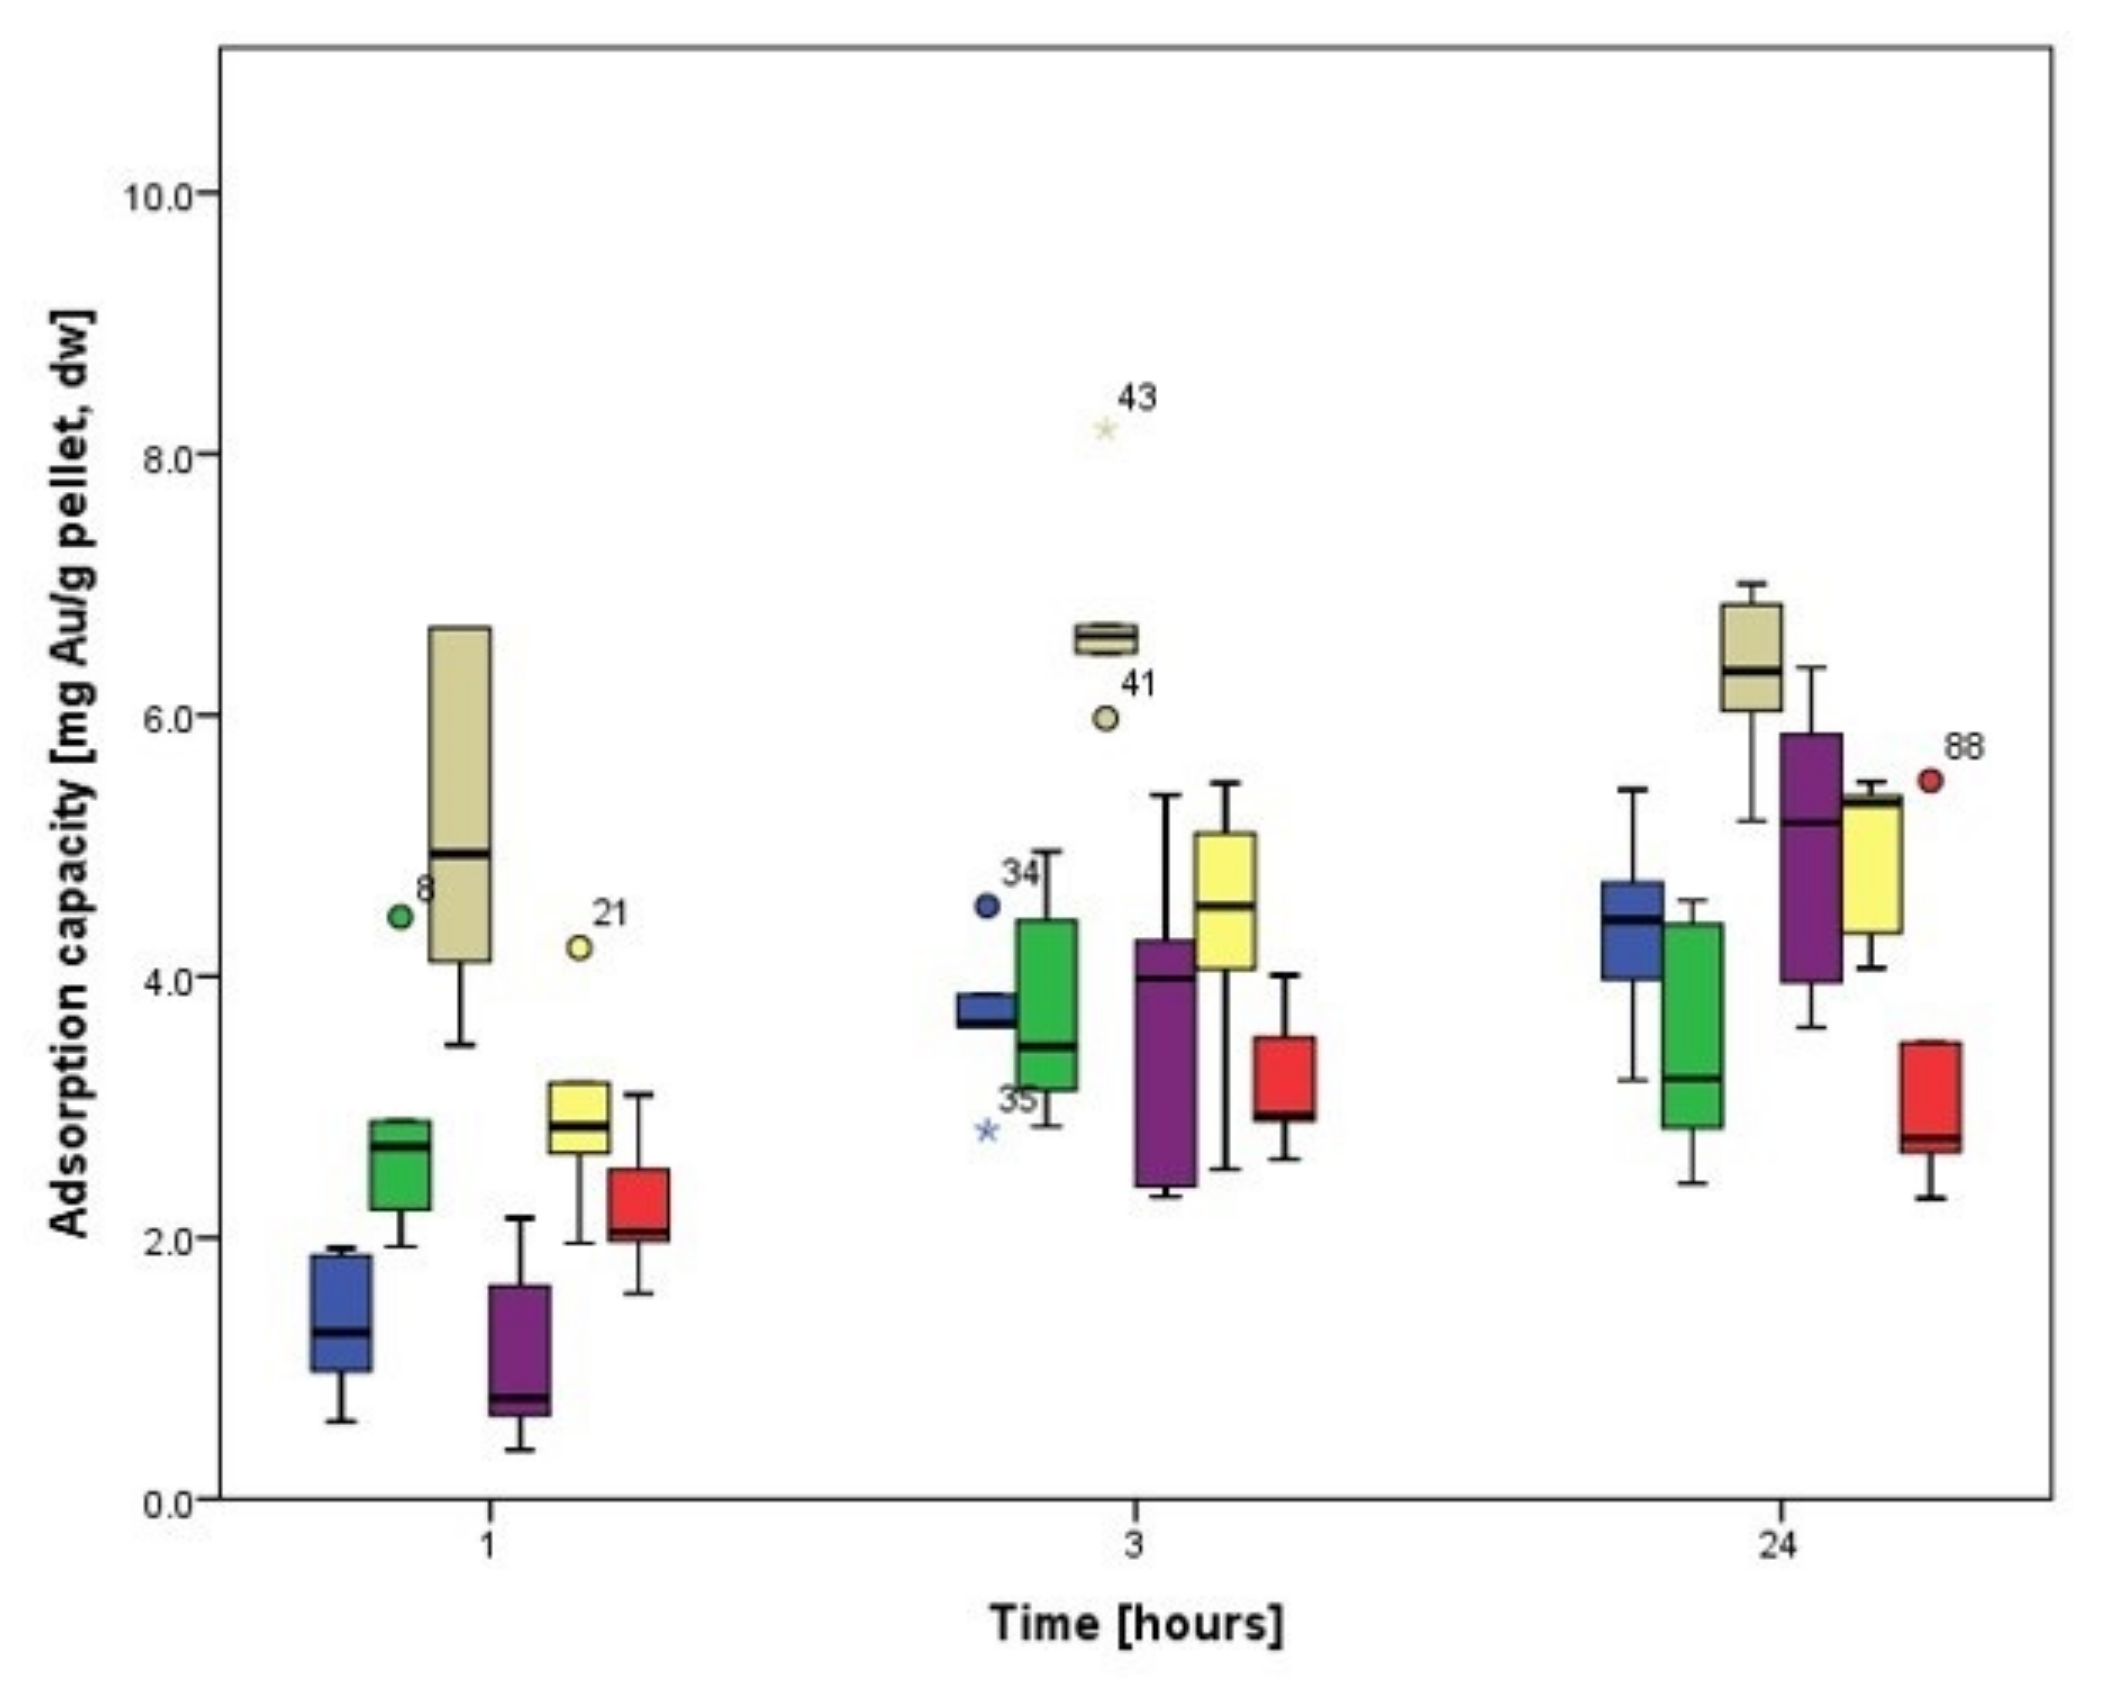
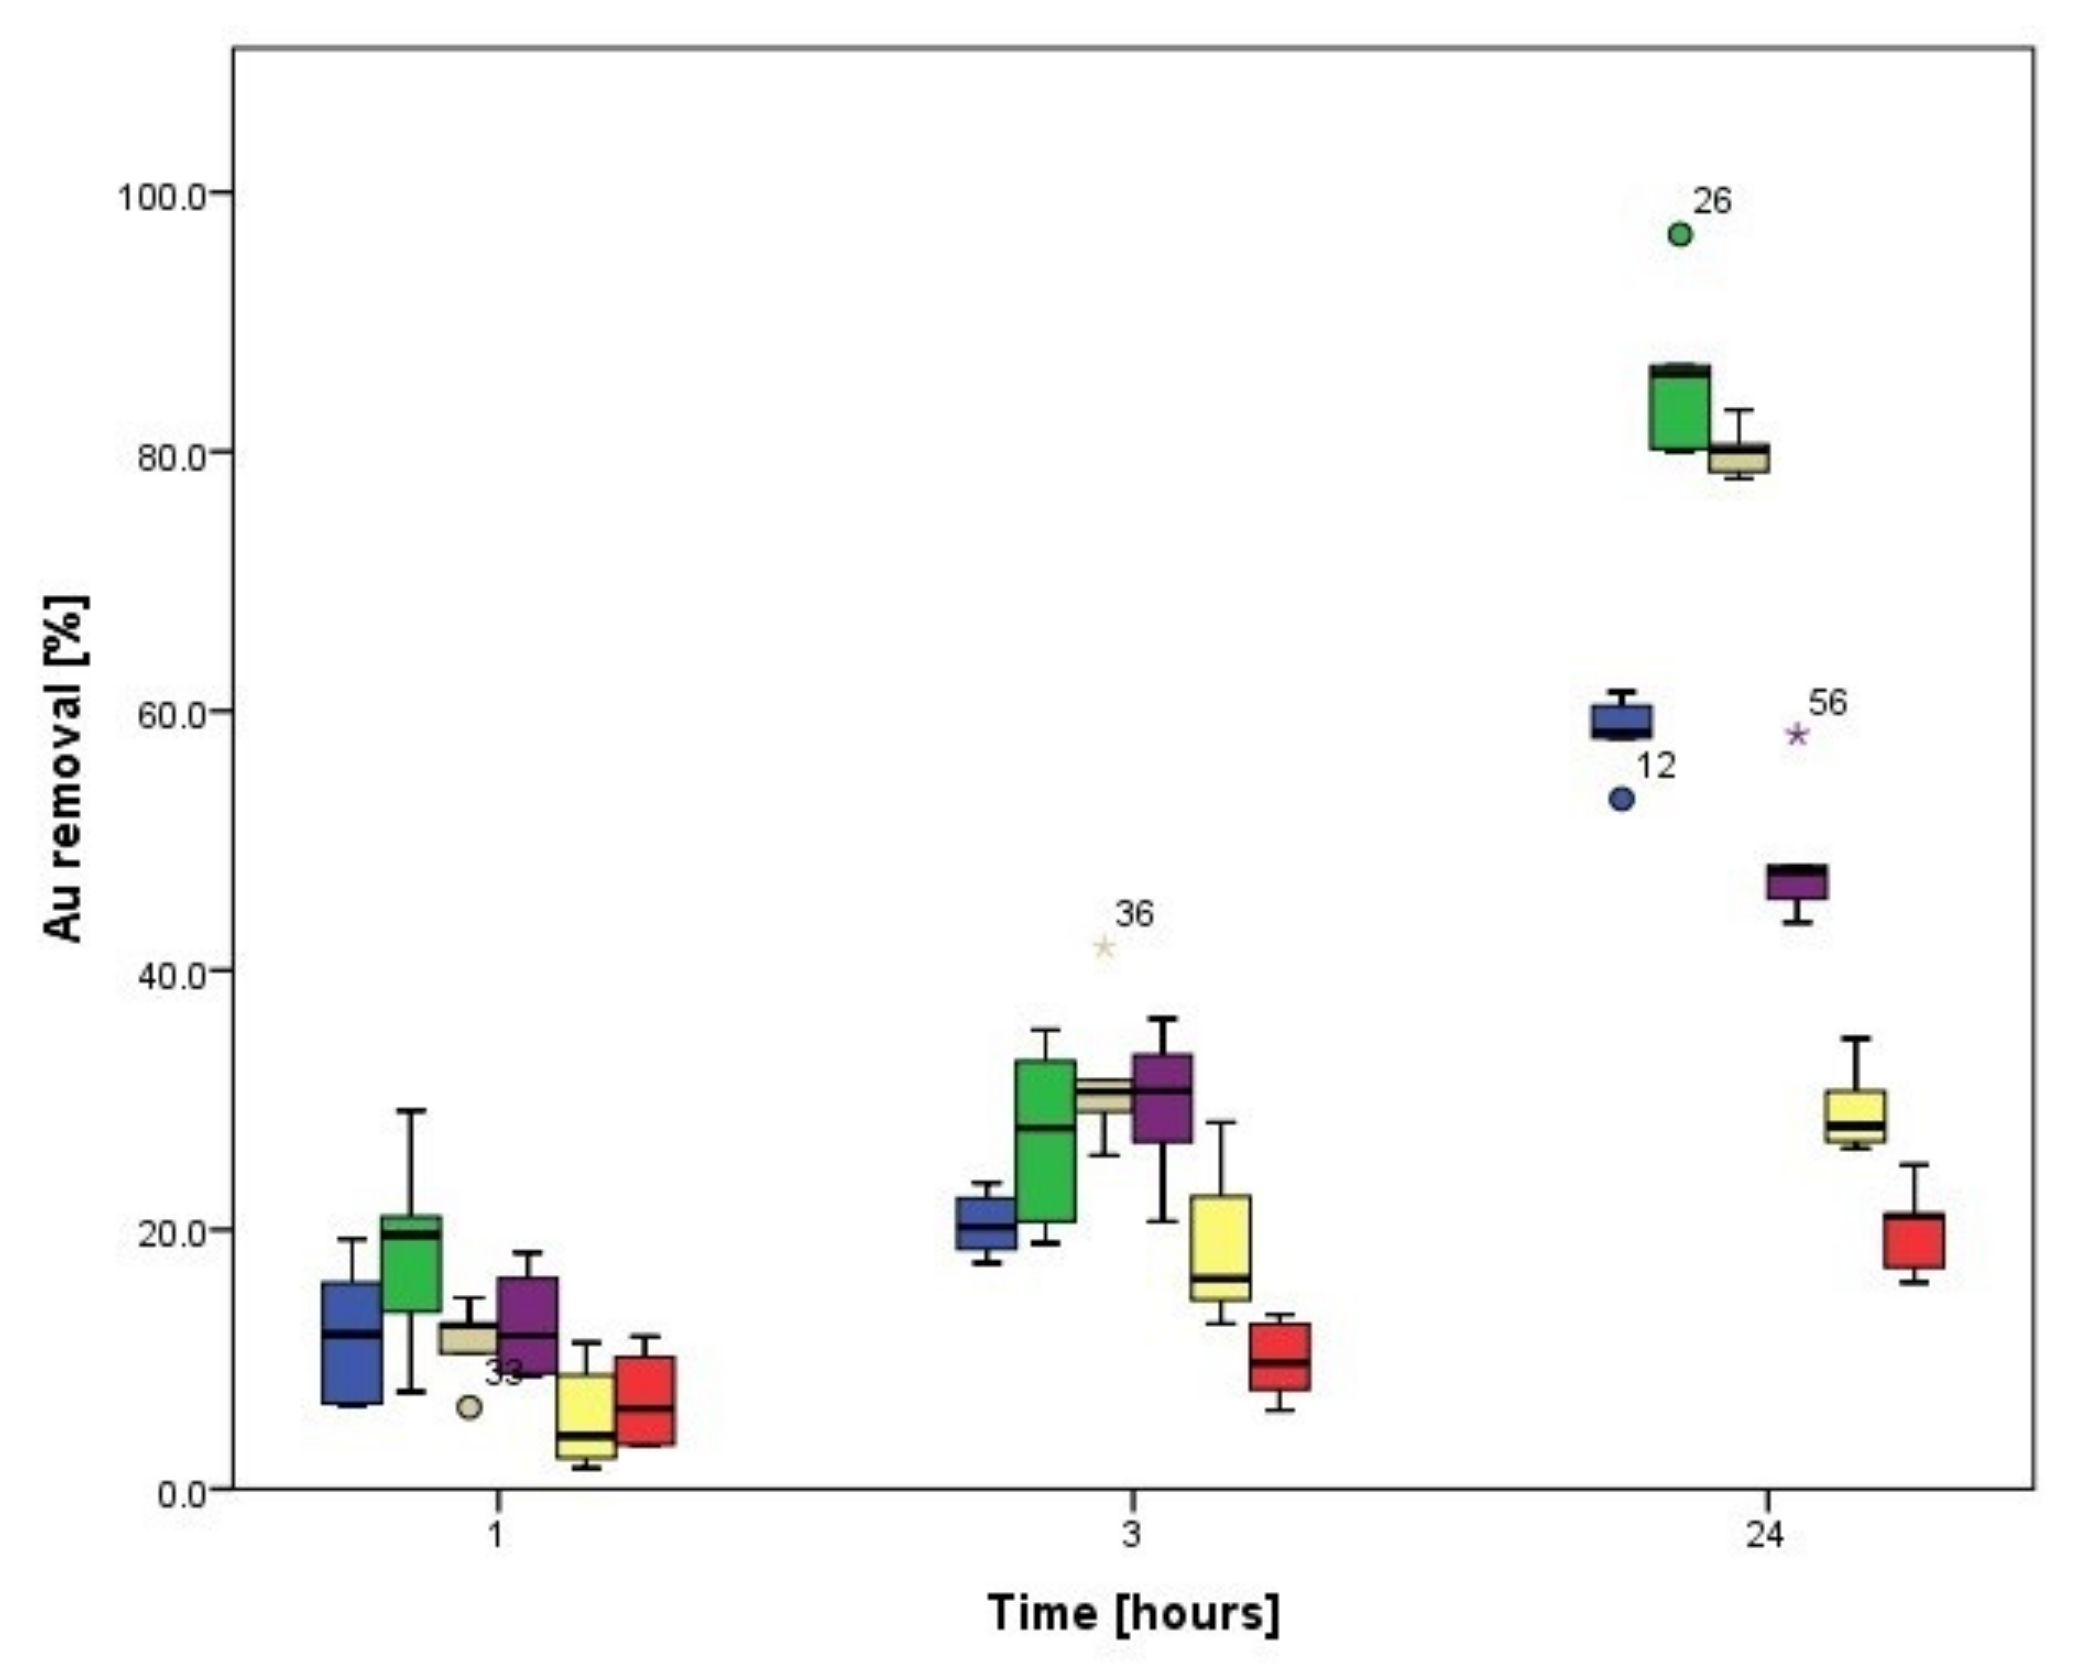
3.3.2. Biosorption Kinetics of Au

Figure 12 shows Au removal as a function of both the A. tabacinus dosage and the contact time. As observed in the previous section, for each quantity of biomass, removal increases along the contact time. The highest removal percentages were obtained using 0.125 g ww (equivalent to 0.0078 g dw) of A. tabacinus pellets and after 24 h of contact.
The post hoc analysis of Au removals by A. tabacinus pellets performed using the HSD-Tukey test evidenced the formation of two homogeneous subsets (p ≤ 0.05) during the first hour of contact: subset 1 (consisting of the assays performed with 0.025, 0.050, and 0.100 g ww of pellets) and subset 2 (0.075, 0.125, and 0.150 g ww), for which no significant differences (p ≤ 0.05) were found in each group. For the other contact times (2, 3, 5, 12, and 24 h), no significant differences (p ≤ 0.05) were observed in the subset grouping 0.050, 0.075, 0.100, and 0.150 g ww of biosorbent. Au removals in A. tabacinus pellets in this subset did differ from the values observed at 0.025 and 0.125 g ww. When 0.025 g ww of pellets were used, the lowest Au removals were obtained (13.55–32.96%), while the highest (33.11–73.28%) were obtained with 0.125 g ww of pellets, in the contact times mentioned above.
The linearized kinetics of Au adsorption in different amounts of A. tabacinus pellets are presented in Figure S2 (Supplementary Material). The adequate fit of the data to this model is again evidenced by the Pearson correlation coefficients presented in Table 3.
The parameters displayed in Table 3 were used to simulate the amounts of Au adsorbed as a function of time (qt). The simulation results are presented in Figure 13. Again, the good fit of the experimental data to the pseudo-second-order model is evident, and it was confirmed that the Au adsorption was practically complete after a contact time of 12 h. This differs from what was reported by do Nascimento et al. [56] for Au adsorption on Trichoderma harzianum pellets. These authors observed kinetics in two stages: in the first stage, which only lasted 30 min, removal efficiencies of 70% were measured; two hours after starting the process, there was a desorption stage, and then, after another hour, equilibrium was reached. It is likely that the speed of the kinetics, as well as the high adsorption capacities determined by these authors (1343 mg/g), were due to the high initial concentrations of the metal used in their tests (400 mg/L) [56].

3.4. Biosorption Kinetics on Cladosporium cladosporioides Pellets

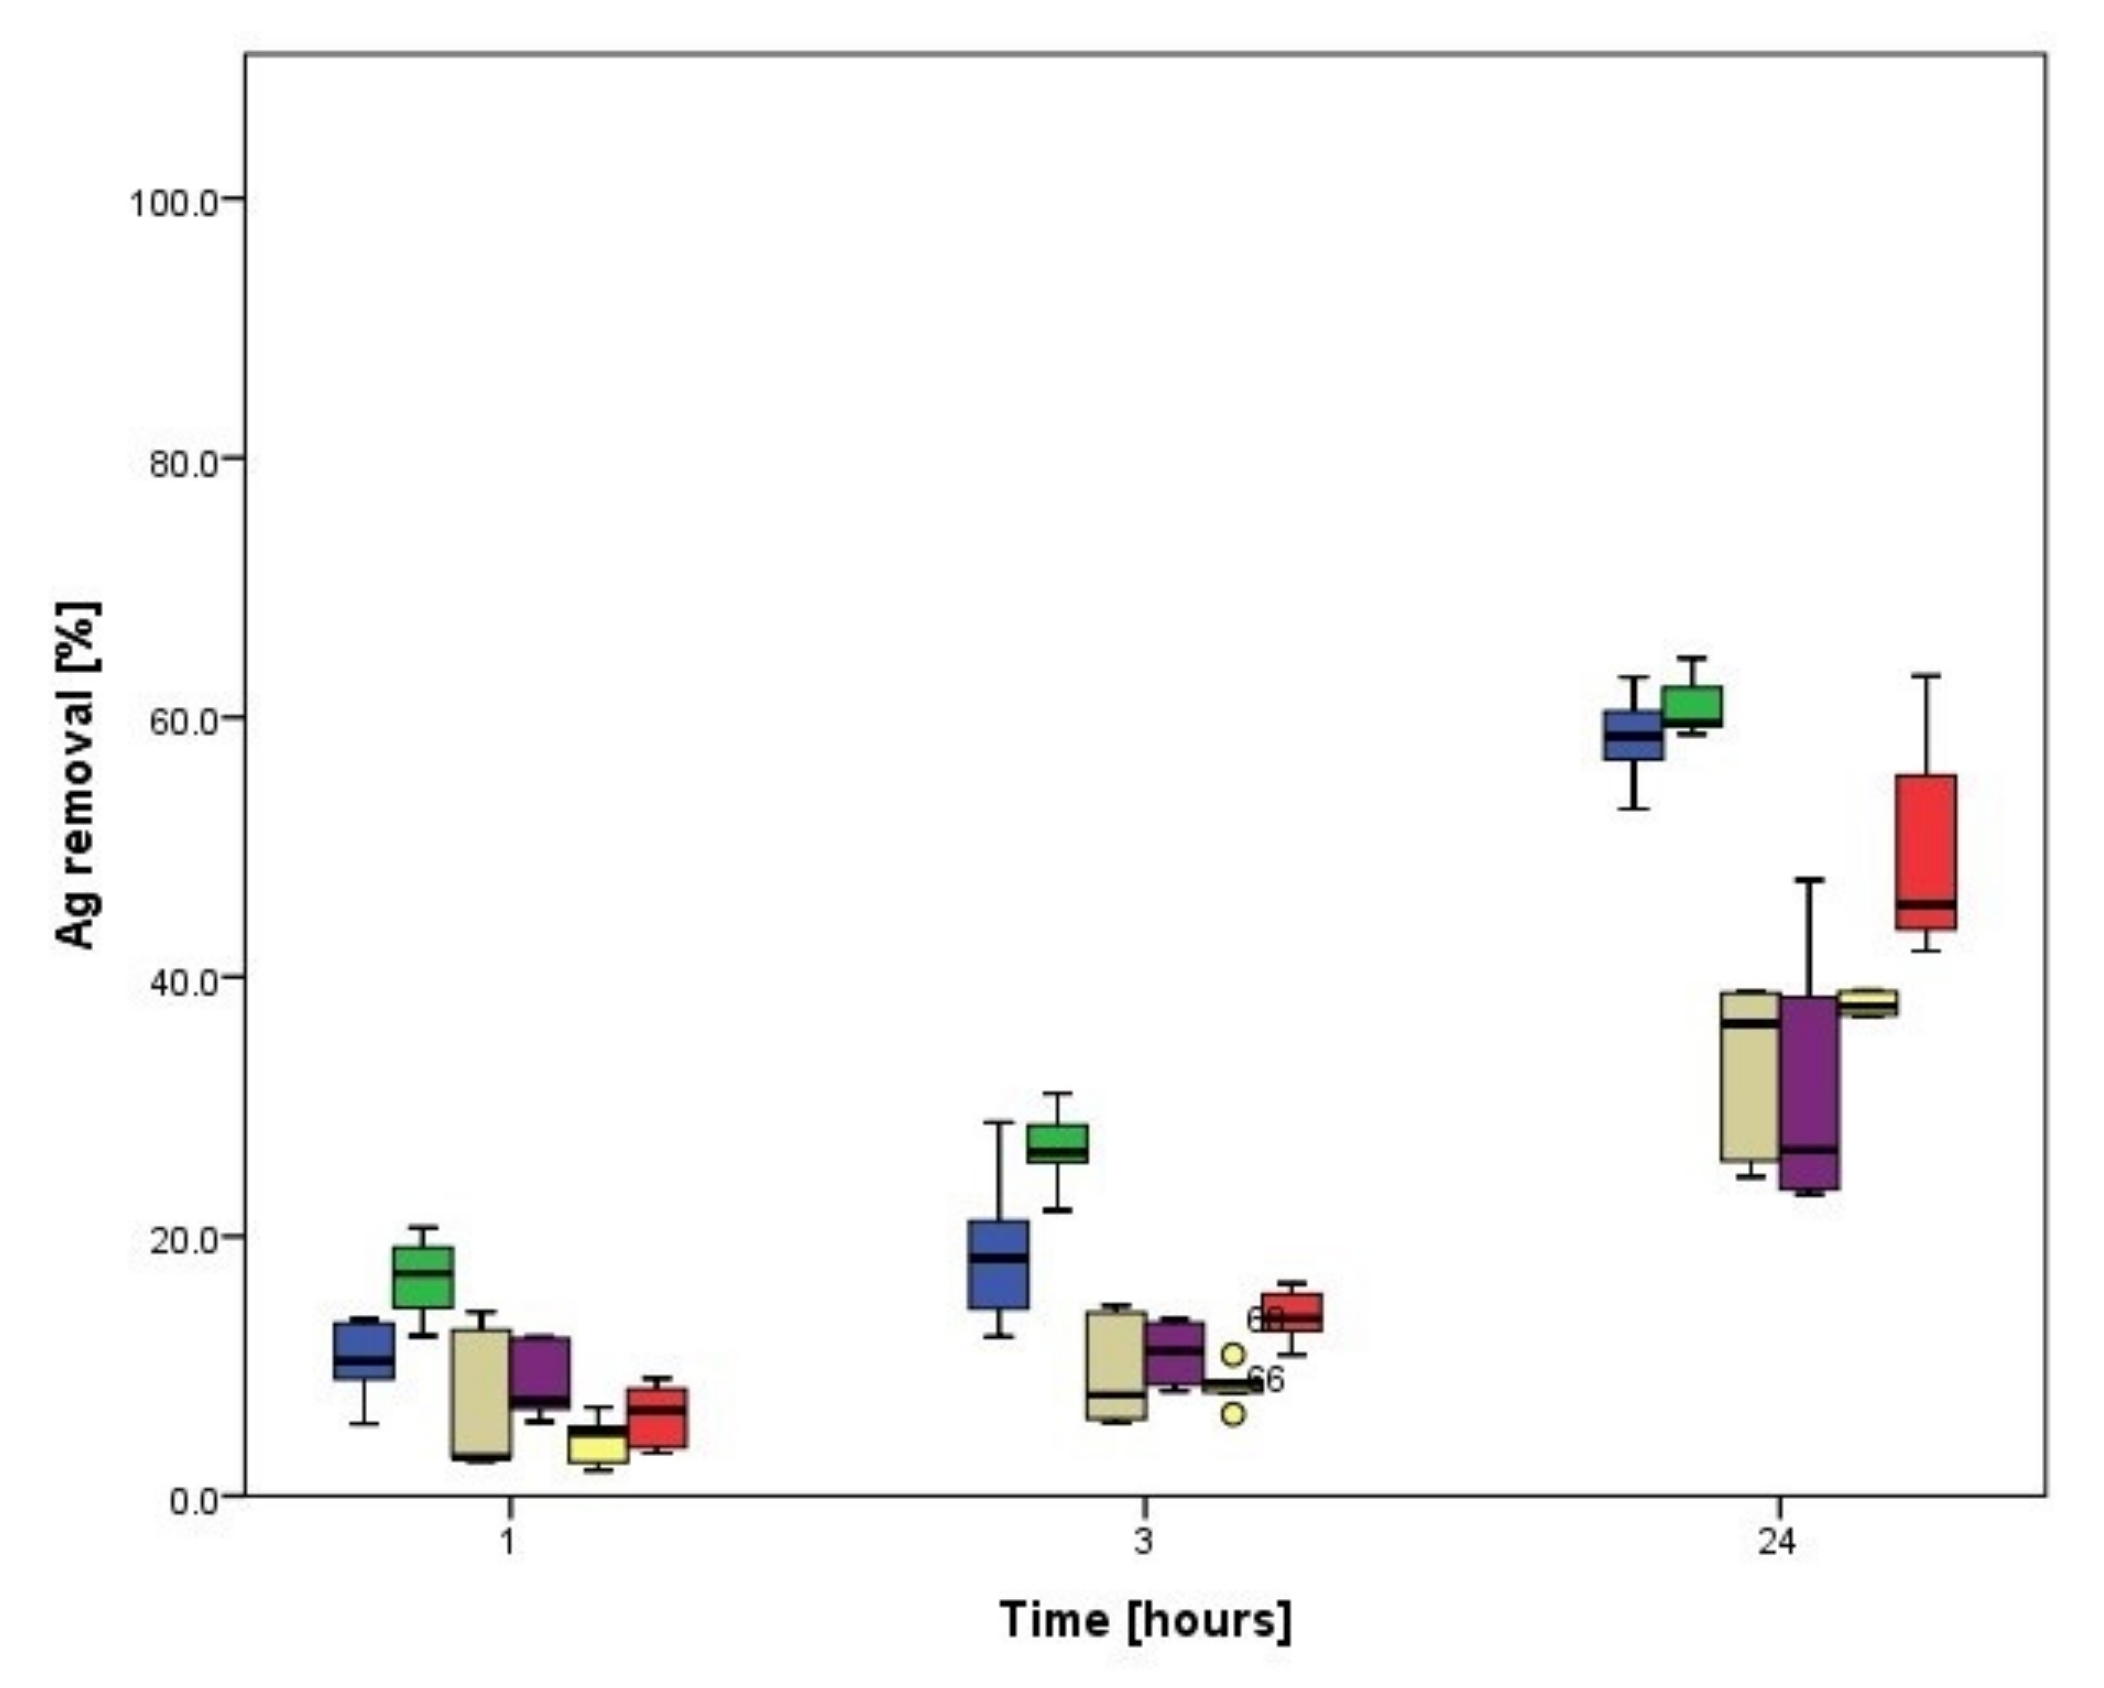
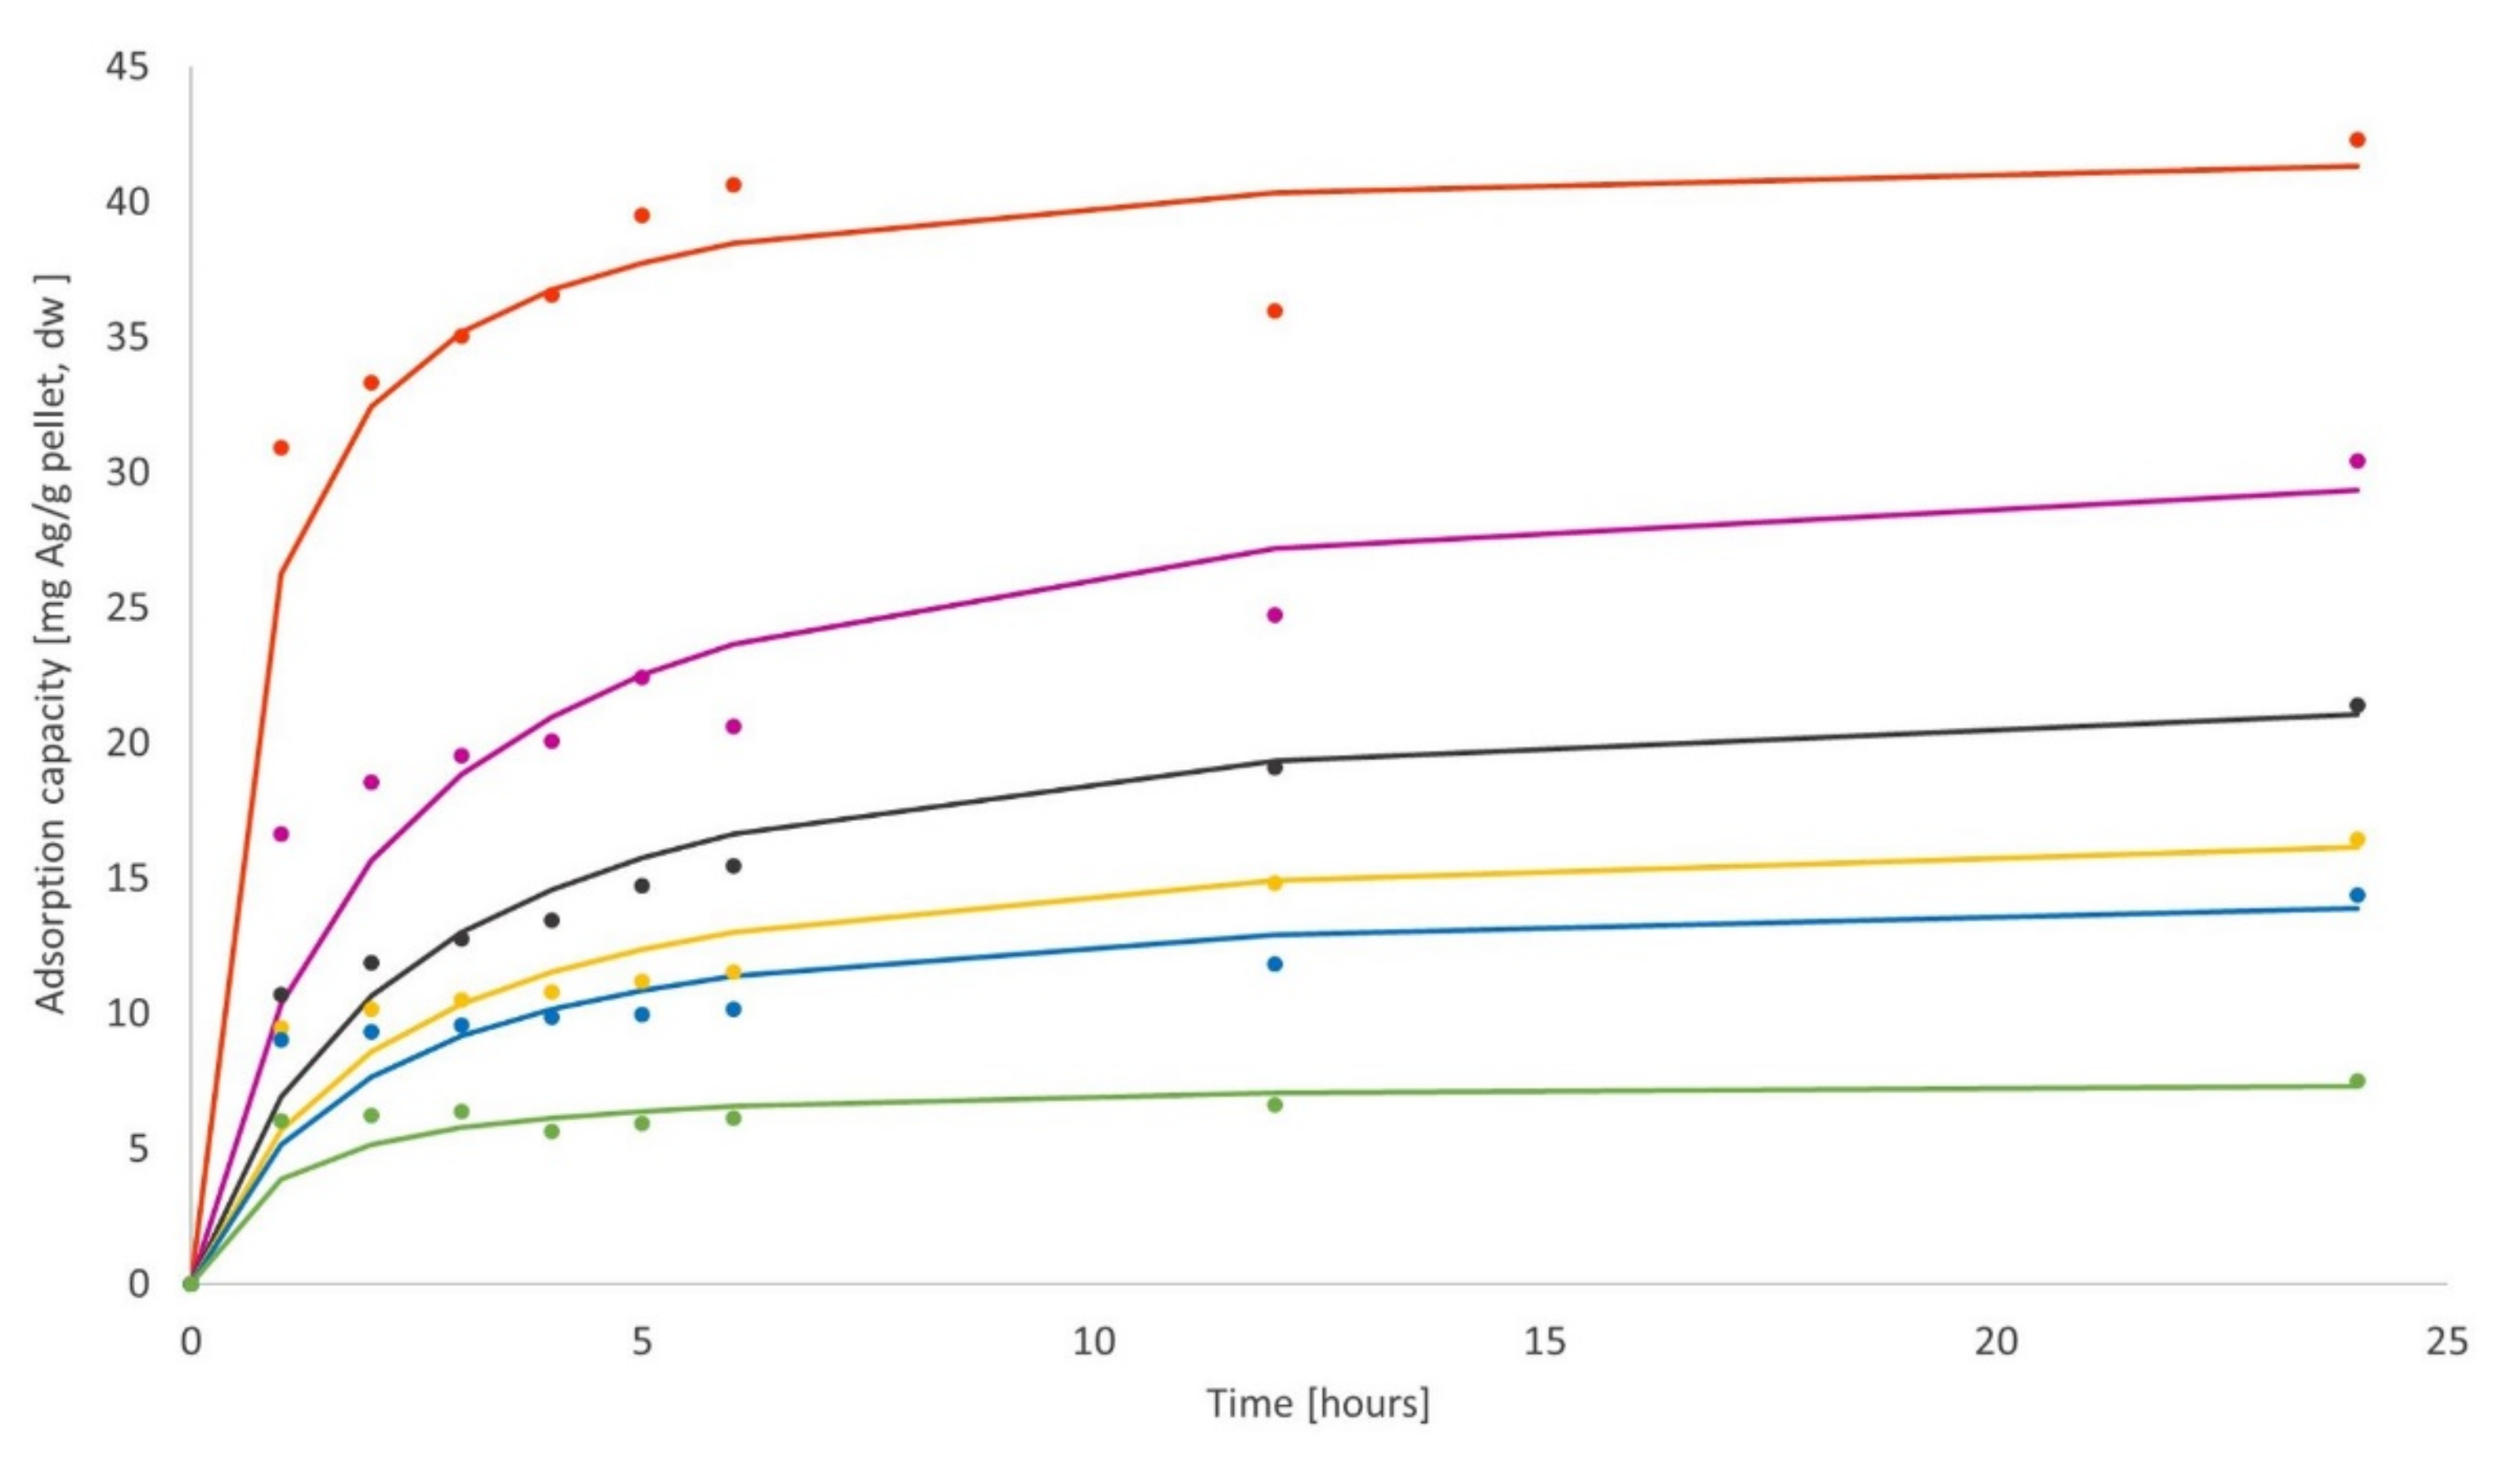
3.4.1. Biosorption Kinetics of Ag

Figure 14 shows the Ag removal as a function of C. cladosporioides dosage and the contact time. For each quantity of biomass, the removal was more significant in the contact times between 12 and 24 h; that is, no metal desorption was observed during this period. The highest removal percentages (15.50–81.99%) were obtained using 0.150 g of C. cladosporioides pellets after 1, 2, 3, 12, and 24 h. This disagrees with the results obtained with A. tabacinus pellets, where the highest Ag removals did not result from the addition of the highest dose of biosorbent evaluated (0.150 g ww) but from the doses comprised between 0.05 and 0.075 g ww (Section 3.3.1).
During the first hour of contact, no statistically significant differences (p ≤ 0.05) were detected in Ag removal percentages resulting from the doses of C. cladosporioides pellets evaluated. After two hours of contact, the formation of two homogeneous subsets was observed (p ≤ 0.05): subset 1 (consisting of the results obtained with 0.050, 0.075, 0.100, and 0.125 g ww of fungal pellets) and subset 2 (results obtained with 0.025 and 0.150 g ww of pellets). No significant differences (p ≤ 0.05) were found within each subset.
After 3, 4, 5, and 6 h of contact, no significant differences were observed among the results obtained with 0.025, 0.050, and 0.125 g ww of fungal pellets. In addition, no statistically significant differences were found when adding 0.075 and 0.150 g ww of C. cladosporioides biomass, for which the highest Ag removals were observed (33.79–61.63% and 38.53–59.09%, respectively). With a 12-h contact time, the Ag removals obtained with the doses of 0.025, 0.075, and 0.125 g ww of pellets did not show to be significantly different (p ≤ 0.05); however, the lowest removal of Ag (55.74%) was obtained with a dose of 0.100 g ww of biosorbent, while the highest removal (75.49%) was obtained with a dose of 0.150 g ww of pellets. Lastly, HSD-Tukey’s post hoc test indicated that, after 24 h of contact, there were no significant differences (p ≤ 0.05) in the Ag removal resulting from the tests grouped in the following subsets: 0.025 and 0.100 g ww; 0.050 and 0.075 g ww; 0.125 and 0.150 g ww. The highest Ag removal (81.91%) was obtained with 0.150 g ww of fungal pellets at this contact time.
Table 4 shows the parameters of the adjusted pseudo-second-order model, as well as the correlation coefficient (r2), for Ag adsorption on C. cladosporioides. The r2 values obtained (>0.9837) indicate that the pseudo-second-order model is adequate to describe the kinetics of Ag adsorption on these fungal pellets. The linearized kinetics of the adjusted pseudo-second-order model are presented in Figure S3 (Supplementary Material). The parameters presented in Table 4 were used to simulate the changes in the Ag adsorbed as a function of time (qt). These simulation results are presented in Figure 15. It was confirmed that the Ag adsorption is practically complete after a contact time of 12 h.

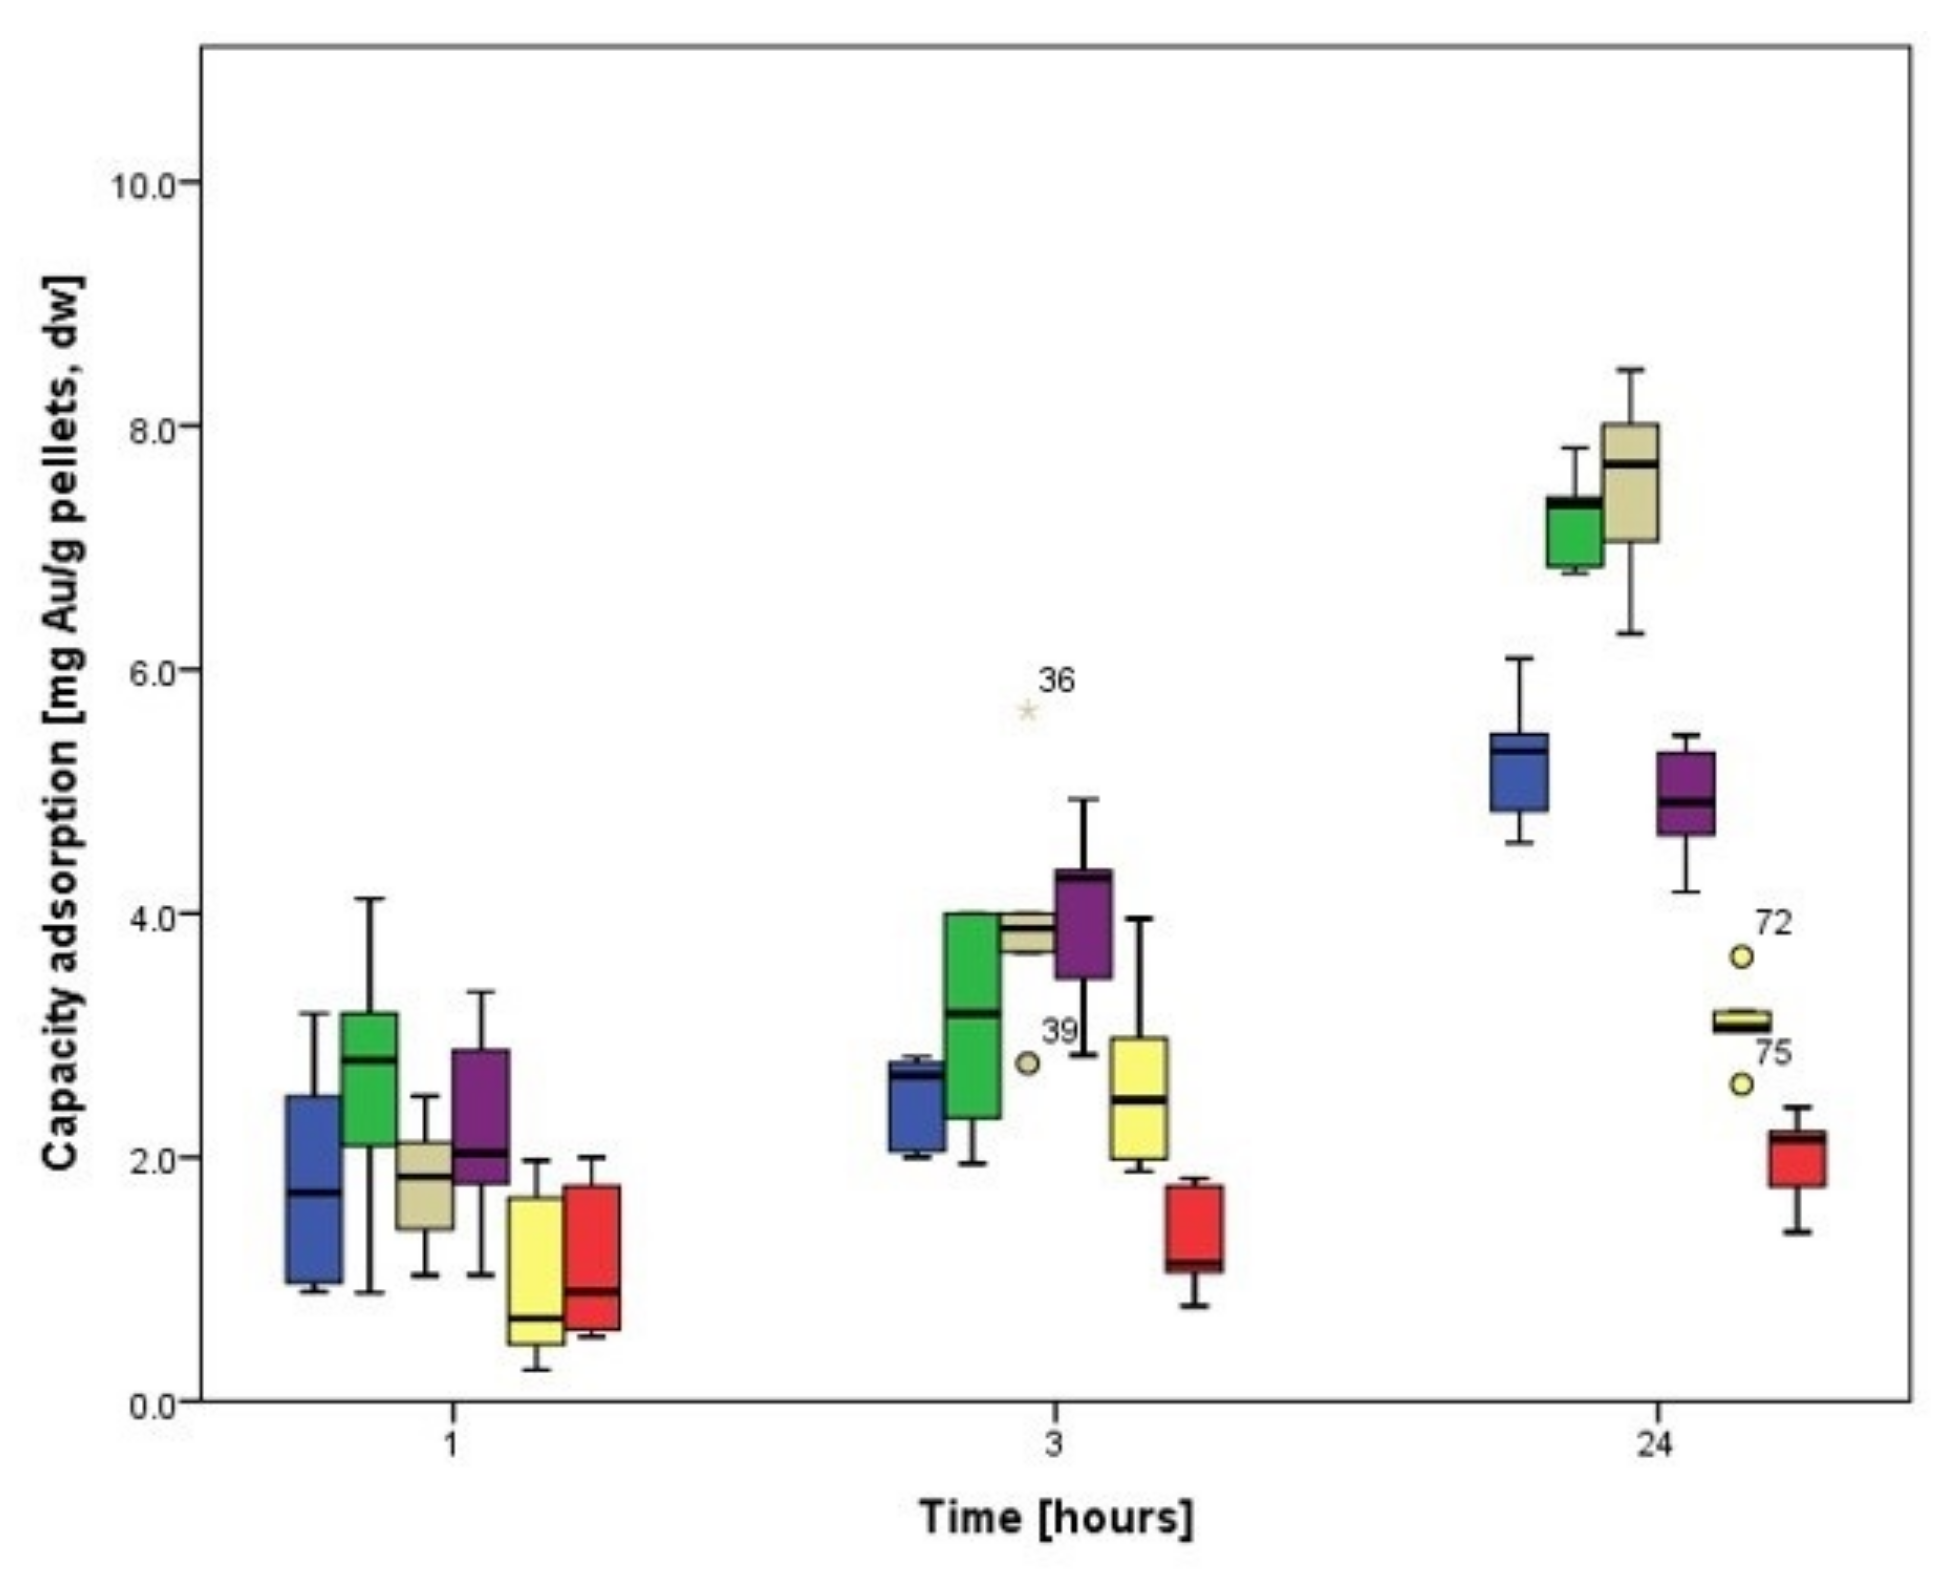
3.4.2. Biosorption Kinetics of Au

Au removal as a function of granular C. cladosporioides quantity and contact time is shown in Figure 16. On the one hand, as observed for the kinetics of Ag biosorption with this fungal strain, the highest removals were obtained at contact times of 12 and 24 h for each dose of biomass. When using 0.100, 0.125, and 0.150 g ww of pellets, 100% Au removal rates were obtained after 24 h of contact. On the other hand, unlike the removals of Au and Ag obtained with A. tabacinus pellets in this study, C. cladosporioides showed a clear trend when using the highest doses of biosorbent (0.100, 0.125, and 0.150 g of granules in ww), for which the highest removal percentages were obtained in all established contact times.
The post hoc analysis of the Au removal by C. cladosporioides pellets indicated, for the first hour of contact, the formation of two homogeneous subsets within which no statistically significant differences were found (p ≤ 0.05). The results of the tests carried out with 0.025, 0.050, 0.075, and 0.100 g ww of pellets were comprised in the first subset, while the second subset was made up by the results of the tests carried out with 0.125 and 0.150 g ww of fungal pellets.
For 2, 4, 5, and 24 h of contact, different homogeneous subsets, within which there were no significant differences (p ≤ 0.05), were detected. On the one hand, the results of the tests carried out with the lowest biomass doses (i.e., 0.025, 0.050, and 0.075 g ww of pellets), and, on the other hand, the results obtained from using the highest biosorbent doses (0.100, 0.125, and 0.150 g ww of granules). After 6 h of contact, no statistically significant differences (p ≤ 0.05) were observed between the biosorption in, on the one hand, 0.050 and 0.075 g ww of fungal pellets and, on the other hand, by using 0.100 and 0.125 g ww of pellets. When 0.025 and 0.150 g ww of biomass were used, the lowest (41.32%) and the highest (82.01%) Au removal percentages were obtained, respectively, which were statistically different (p ≤ 0.05) from both subsets.
As mentioned above, Au removal increased when using the highest doses of biosorbents and the most extended contact times. After 12 h of contact, the removal percentages obtained (42.48–99.22%) differed significantly (p ≤ 0.05) between the doses of biosorbents analyzed. In addition, at a contact time of 24 h, Au removal percentages did not present significant differences (p ≤ 0.05) from those obtained at a contact time of 12 h.
Table 5 shows the parameters of the pseudo-second-order model, as well as the correlation coefficient for Au adsorption in C. cladosporioides. The r2 values obtained (>0.9908) suggest that the pseudo-second-order model is the most adequate to describe the kinetics of Au adsorption on fungal granules.
The linearized kinetics of the adjusted pseudo-second-order model are presented in Figure S4 (Supplementary Material), which also shows the good agreement of the data to this model. Parameters summarized in Table 5 were used to simulate the changes that occurred in the amount of Au adsorbed at a given time (qt); the simulation results are presented in Figure 17. The good fit of the experimental data to the pseudo-second-order model was confirmed. Moreover, as evidenced by the statistical analysis, the Au adsorption was almost complete after a contact time of 12 h.

4. Conclusions

Fungal pellets were obtained from the cultivation of A. tabacinus and C. cladosporioides in Opuntia sp.-based medium. The amounts of metal adsorbed (qt) for dilute concentrations (1 mg/L) of Ag and Au at different pH values (2–7) were evaluated for pellets of both fungal strains. For A. tabacinus pellets, the optimum pH value for the biosorption of both metals was 4. However, for Ag, a suboptimal pH value (5) was chosen for the subsequent experiments because it allowed more reproducible values of metal concentration to be achieved. For C. cladosporioides granules, the best-suited pH values for the Ag and Au biosorption were 3 and 4, respectively. At the pH values estimated as optimum, A. tabacinus pellets adsorbed higher amounts of Ag than C. cladosporioides pellets, while for Au the opposite occurred.
Adsorption kinetics of both metals at the optimum pH previously determined was studied by varying the biosorbent concentration and keeping the initial adsorbate concentration constant (1 mg/L). In general, it was observed that the greater the amount of adsorbent, the adsorption capacity decreases, and that the biosorption kinetics of Ag and Au on pellets of the studied strains is well represented by the pseudo-second-order model under the operating conditions tested. Therefore, our results allow exploration of the use of these fungal pellets as an alternative to the detrimental impacts of mining in the environment.

Supplementary Materials

The following supporting information can be downloaded at: https://www.mdpi.com/article/10.3390/pr10040645/s1, Figure S1: Linearized Ag biosorption kinetics by different quantities (dry weight) of Aspergillus tabacinus pellets; Figure S2: Linearized Au biosorption kinetics by different quantities (dry weight) of Aspergillus tabacinus pellets; Figure S3: Linearized Ag biosorption kinetics by different quantities (dry weight) of Cladosporium cladosporioides pellets; Figure S4: Linearized Au biosorption kinetics by different quantities (dry weight) of Cladosporium cladosporioides pellets.

Author Contributions

Conceptualization, C.A.L.-C. and G.A.V.-R.; methodology, A.J.L.-C., C.A.L.-C. and C.C.-O.; software, A.J.L.-C.; data curation, A.J.L.-C. and G.A.V.-R.; writing—original draft preparation, A.J.L.-C. and G.A.V.-R.; writing—review and editing, C.A.L.-C., R.I.B.-H., C.C.-O. and G.A.V.-R.; supervision, G.A.V.-R. All authors have read and agreed to the published version of the manuscript.

Funding

This research received no external funding.

Institutional Review Board Statement

Not applicable.

Informed Consent Statement

Not applicable.

Data Availability Statement

The raw/processed data required to reproduce these findings cannot be shared at this time due to technical or time limitations.

Acknowledgments

A.J.L.-C. acknowledges the PhD scholarship provided by the Consejo Nacional de Ciencia y Tecnología (CONACYT-Mexico).

Conflicts of Interest

The authors declare no conflict of interest.

References

  1. Legorreta-Castañeda, A.J.; Lucho-Constantino, C.A.; Beltrán-Hernández, R.I.; Coronel-Olivares, C.; Vázquez-Rodríguez, G.A. Biosorption of water pollutants by fungal pellets. Water 2020, 12, 1155. [Google Scholar] [CrossRef] [Green Version]
  2. Manguilimotan, L.C.; Bitacura, J.G. Biosorption of cadmium by filamentous fungi isolated from coastal water and sediments. J. Toxicol. 2018, 2018, 7170510. [Google Scholar] [CrossRef]
  3. Lo, Y.C.; Cheng, C.L.; Han, Y.L.; Chen, B.Y.; Chang, J.S. Recovery of high-value metals from geothermal sites by biosorption and bioaccumulation. Bioresour. Technol. 2014, 160, 182–190. [Google Scholar] [CrossRef] [PubMed]
  4. Rozman, U.; Kalčíková, G.; Marolt, G.; Skalar, T.; Gotvajn, A.Ž. Potential of waste fungal biomass for lead and cadmium removal: Characterization, biosorption kinetic and isotherm studies. Environ. Technol. Innov. 2020, 18, 100742. [Google Scholar] [CrossRef]
  5. Ighalo, J.O.; Adeniyi, A.G. Statistical modelling and optimisation of the biosorption of Cd (II) and Pb (II) onto dead biomass of Pseudomonas aeruginosa. Chem. Prod. Proc. Model. 2021, 16, 20190139. [Google Scholar] [CrossRef]
  6. Cox, P.W.; Paul, G.C.; Thomas, C.R. Image analysis of the morphology of filamentous micro-organisms. Microbiology 1998, 144, 817–827. [Google Scholar] [CrossRef] [Green Version]
  7. Veiter, L.; Rajamanickam, V.; Herwig, C. The filamentous fungal pellet-relationship between morphology and productivity. Appl. Microbiol. Biotechnol. 2018, 102, 2997–3006. [Google Scholar] [CrossRef] [Green Version]
  8. Espinosa-Ortiz, E.J.; Rene, E.R.; Pakshirajan, K.; van Hullebusch, E.D.; Lens, P.N. Fungal pelleted reactors in wastewater treatment: Applications and perspectives. Chem. Eng. J. 2016, 283, 553–571. [Google Scholar] [CrossRef]
  9. Shen, N.; Chirwa, E.M. Live and lyophilized fungi-algae pellets as novel biosorbents for gold recovery: Critical parameters, isotherm, kinetics and regeneration studies. Bioresour. Technol. 2020, 306, 123041. [Google Scholar] [CrossRef]
  10. Tyupa, D.V.; Kalenov, S.V.; Baurina, M.M.; Kabanov, O.V.; Skladnev, D.A.; Kuznetsov, A.Y. Optimization of silver biosorption by fungi forming granules from aqueous solutions of silver nitrate. Clean Technol. Environ. Policy 2017, 19, 53–62. [Google Scholar] [CrossRef]
  11. Bindschedler, S.; Bouquet, T.Q.T.V.; Job, D.; Joseph, E.; Junier, P. Fungal biorecovery of gold from e-waste. Adv. Appl. Microbiol. 2017, 99, 53–81. [Google Scholar] [PubMed]
  12. Fashola, M.O.; Ngole-Jeme, V.M.; Babalola, O.O. Heavy metal pollution from gold mines: Environmental effects and bacterial strategies for resistance. Int. J. Environ. Res. Public Health 2016, 13, 1047. [Google Scholar] [CrossRef] [PubMed] [Green Version]
  13. Syed, S. Recovery of gold from secondary sources—A review. Hydrometallurgy 2012, 115, 30–51. [Google Scholar] [CrossRef]
  14. Islam, M.A.; Jacob, M.V.; Antunes, E. A critical review on silver nanoparticles: From synthesis and applications to its mitigation through low-cost adsorption by biochar. J. Environ. Manag. 2021, 281, 111918. [Google Scholar] [CrossRef] [PubMed]
  15. Khan, M.S.; Jabeen, F.; Qureshi, N.A.; Asghar, M.S.; Shakeel, M.; Noureen, A. Toxicity of silver nanoparticles in fish: A critical review. J. Biodivers. Environ. Sci. 2015, 6, 211–227. [Google Scholar]
  16. Maeda, I.; Tsuruta, T. Microbial Gold Biosorption and Biomineralization from Aqueous HAuCl4 Solution. Minerals 2020, 10, 285. [Google Scholar] [CrossRef] [Green Version]
  17. Pan, H.W.; Iizuka, A.; Shibata, E. Gold recovery from dilute aqueous solution by a biosorbent derived from woody biomass. Chem. Eng. Commun. 2021, 208, 1711–1724. [Google Scholar] [CrossRef]
  18. Das, N. Recovery of precious metals through biosorption—A review. Hydrometallurgy 2010, 103, 180–189. [Google Scholar] [CrossRef]
  19. Soundararajan, R.K.V.; Varjani, S.; Chandrasekaran, R.; Kandasamy, D. Recovery of Gold and Other Precious Metals by Biosorption. In Sustainable Resource Management; Guo, W., Ngo, H.H., Surampalli, R.Y., Zhang, T.C., Eds.; John Wiley & Sons: Weinheim, Germany, 2021; Volume 2, pp. 463–488. [Google Scholar]
  20. Legorreta-Castañeda, A.J. Biominería de Au y Ag por Gránulos Fúngicos en Efluentes de la Industria Minera. Ph.D. Thesis, Mineral de la Reforma, Universidad Autónoma del Estado de Hidalgo, Pachuca de Soto, Mexico, 2021. (In Spanish). [Google Scholar]
  21. Stavart, A.; Leroy, C.; Van Lierde, A. Potential use of carbon felt in gold hydrometallurgy. Miner. Eng. 1999, 12, 545–558. [Google Scholar] [CrossRef]
  22. Reyes-Cruz, V.; Oropeza, M.T.; González, I.; Ponce-De-León, C. Electrochemical recovery of silver from cyanide leaching solutions. J. Appl. Electrochem. 2002, 32, 473–479. [Google Scholar] [CrossRef]
  23. Galvin, K.P.; Nicol, S.K.; Waters, A.G. Selective ion flotation of gold. Colloids Surf. 1992, 64, 21–33. [Google Scholar] [CrossRef]
  24. Galvin, K.P.; Engel, M.D.; Nicol, S.K. The potential for reagent recycle in the ion flotation of gold cyanide—A pilot scale field trial. Int. J. Miner. Proc. 1994, 42, 75–98. [Google Scholar] [CrossRef]
  25. Ting, Y.P.; Mittal, A.K. Effect of pH on the biosorption of gold by a fungal biosorbent. Resour. Environ. Biotechnol. 2002, 3, 229–239. [Google Scholar]
  26. Bayramoğlu, G.; Arica, M.Y. Removal of heavy mercury (II), cadmium (II) and zinc (II) metal ions by live and heat inactivated Lentinus edodes pellets. Chem. Eng. J. 2008, 143, 133–140. [Google Scholar] [CrossRef] [Green Version]
  27. Wang, J.; Chen, C. Biosorbent for heavy metals removal and their future. Biotechnol. Adv. 2009, 27, 195–226. [Google Scholar] [CrossRef]
  28. Filipović-Kovačević, Ž.; Sipos, L.; Briški, F. Biosorption of chromium, copper, nickel and zinc onto fungal pellets of Aspergillus niger 405 from aqueous solutions. Food Technol. Biotechnol. 2000, 38, 211–216. [Google Scholar]
  29. García-Reyes, M. Efecto del pH en la Generación, Producción y Morfología de los Gránulos de Cladosporium cladosporioides Crecidos en SUSTRATOs de Opuntia sp. y Caldo Papa Dextrosa (PDB). Bachelor’s Thesis, Universidad Politécnica de Pachuca, Zempoala, Mexico, 2016. (In Spanish). [Google Scholar]
  30. Singh, K.; Nizam, S.; Sinha, M.; Verma, P.K. Comparative transcriptome analysis of the necrotrophic fungus Ascochyta rabiei during oxidate stress: Insight for fungal survival in the host plant. PLoS ONE 2012, 7, e33128. [Google Scholar]
  31. Bujdák, J. Adsorption kinetics models in clay systems. The critical analysis of pseudo-second order mechanism. Appl. Clay Sci. 2020, 191, 105630. [Google Scholar] [CrossRef]
  32. Kumar, K.V. Linear and non-linear regression analysis for the sorption kinetics of methylene blue onto activated carbon. J. Hazard. Mater. 2006, 137, 1538–1544. [Google Scholar] [CrossRef]
  33. Ho, Y.S.; McKay, G. Pseudo-second order model for sorption processes. Process Biochem. 1999, 34, 451–465. [Google Scholar] [CrossRef]
  34. Vigdorovich, V.I.; Vigdorowitsch, M.V.; Tsygankova, L.E.; Uryadnikova, M.N.; Shel, N.V. A lean method for determination of dynamic capacity of a sorbent at multiple sorption of cations. Int. J. Environ. Sci. Technol. 2019, 16, 6227–6236. [Google Scholar] [CrossRef]
  35. Foster, G.C.; Lane, D.; Scott, D.; Hebl, M.; Guerra, R.; Osherson, D.; Zimmer, H. Post-hoc tests. In An Introduction to Psychological Statistics; University of Missouri’s Affordable and Open Access Educational Resources Initiative: Houston, TX, USA, 2021. [Google Scholar]
  36. Zabala, Y.; Pomares-Alfonso, M.S.; Govin, A.; Villanueva-Tagle, M.E. Study of Ag (I) sorption on biomass of Aspergillus niger O-5 chemically treated with cetyltrimethylammonium bromide. Afinidad 2020, 77, 31–41. [Google Scholar]
  37. Strizkho, L.S.; Zakharova, V.I.; Bezrukova, Z.N. Extraction of silver from the diluted solutions by biosorbents. Nonferrous Metal. 2006, 2, 32–40. [Google Scholar]
  38. Tuzen, M.; Soylak, M. Column solid-phase extraction of nickel and silver in environmental samples prior to their flame atomic absorption spectrometric determinations. J. Hazard. Mater. 2009, 164, 1428–1432. [Google Scholar] [CrossRef]
  39. Rakhila, Y.; Elmchaouri, A.; Mestari, A.; Korili, S.; Abouri, M.; Gil, A. Adsorption recovery of Ag (I) and Au (III) from an electronics industry wastewater on a clay mineral composite. Int. J. Miner. Metall. Mater. 2019, 26, 673–680. [Google Scholar] [CrossRef]
  40. Li, L.; Liang, T.; Liu, W.; Liu, Y.; Ma, F.A. Comprehensive Review of the Mycelial Pellet: Research Status, Applications, and Future Prospects. Ind. Eng. Chem. Res. 2020, 59, 16911–16922. [Google Scholar] [CrossRef]
  41. Sathishkumar, M.; Mahadevan, A.; Vijayaraghavan, K.; Pavagadhi, S.; Balasubramanian, R. Green recovery of gold through biosorption, biocrystallization, and pyro-crystallization. Ind. Eng. Chem. Res. 2010, 49, 7129–7135. [Google Scholar] [CrossRef]
  42. Colica, G.; Caparrotta, S.; Bertini, G.; De Philippis, R. Gold biosorption by exopolysaccharide producing cyanobacteria and purple nonsulphur bacteria. J. Appl. Microbiol. 2012, 113, 1380–1388. [Google Scholar] [CrossRef]
  43. Pethkar, A.V.; Paknikar, K.M. Recovery of gold from solutions using Cladosporium cladosporioides biomass beads. J. Biotechnol. 1998, 63, 121–136. [Google Scholar] [CrossRef]
  44. Figueroa, G.; Valenzuela, J.; Parga, J.R.; Vázquez, V.; Valenzuela, A. Recovery of gold and silver and removal of copper, zinc and lead ions in pregnant and barren cyanide solutions. Mater. Sci. Appl. 2015, 6, 171. [Google Scholar] [CrossRef] [Green Version]
  45. Low, B.T.; Ting, Y.P.; Deng, S. Surface modification of Penicillium chrysogenum mycelium for enhanced anionic dye removal. Chem. Eng. J. 2008, 141, 9–17. [Google Scholar] [CrossRef]
  46. Tsuruta, T. Biosorption and recycling of gold using various microorganisms. J. Gen. Appl. Microbiol. 2004, 50, 221–228. [Google Scholar] [CrossRef] [PubMed] [Green Version]
  47. Shen, N.; Chirwa, E.M.N. Biosorption and desorption potential of gold (III) by freshwater microalgae Scenedesmus obliquus AS-6-1. Chem. Eng. Trans. 2018, 65, 19–24. [Google Scholar]
  48. Singleton, I.; Simmons, P. Factors affecting silver biosorption by an industrial strain of Saccharomyces cerevisiae. J. Chem. Technol. Biotechnol. 1996, 65, 21–28. [Google Scholar] [CrossRef]
  49. Pethkar, A.V.; Kulkarni, S.K.; Paknikar, K.M. Comparative studies on metal biosorption by two strains of Cladosporium cladosporioides. Bioresour. Technol. 2001, 80, 211–215. [Google Scholar] [CrossRef]
  50. Akthar, M.N.; Sastry, K.S.; Mohan, P.M. Biosorption of silver ions by processed Aspergillus niger biomass. Biotechnol. Lett. 1995, 17, 551–556. [Google Scholar] [CrossRef]
  51. Han, Y.L.; Wu, J.H.; Cheng, C.L.; Nagarajan, D.; Lee, C.R.; Li, Y.H.; Chang, J.S. Recovery of gold from industrial wastewater by extracellular proteins obtained from a thermophilic bacterium Tepidimonas fonticaldi AT-A2. Bioresour. Technol. 2017, 239, 160–170. [Google Scholar] [CrossRef]
  52. Vázquez-Rodríguez, G.A.; Mailly, J.; Stoquart, C.; Barbeau, B. Adsorption capacity of biological powdered activated carbon in a hybrid membrane process for drinking water treatment. In Proceedings of the II AMIDIQ International Conference, San José del Cabo, Mexico, 1–4 May 2012. [Google Scholar]
  53. Ayele, L.; Pérez, E.; Mayoral, Á.; Chebude, Y.; Díaz, I. Synthesis of zeolite A using raw kaolin from Ethiopia and its application in removal of Cr (III) from tannery wastewater. J. Chem. Technol. Biotechnol. 2018, 93, 146–154. [Google Scholar] [CrossRef] [Green Version]
  54. Das, D.; Das, N.; Mathew, L. Kinetics, equilibrium and thermodynamic studies on biosorption of Ag (I) from aqueous solution by macrofungus Pleurotus platypus. J. Hazard. Mater. 2010, 184, 765–774. [Google Scholar] [CrossRef]
  55. Zhao, Y.; Wang, D.; Xie, H.; Won, S.W.; Cui, L.; Wu, G. Adsorption of Ag (I) from aqueous solution by waste yeast: Kinetic, equilibrium and mechanism studies. Bioproc. Biosyst. Eng. 2015, 38, 69–77. [Google Scholar] [CrossRef]
  56. do Nascimento, J.M.; Cruz, N.D.; de Oliveira, G.R.; Sa, W.S.; de Oliveira, J.D.; Ribeiro, P.R.S.; Leite, S.G. Evaluation of the kinetics of gold biosorption processes and consequent biogenic synthesis of AuNPs mediated by the fungus Trichoderma harzianum. Environ. Technol. Innov. 2021, 21, 101238. [Google Scholar] [CrossRef]
Figure 1. Methodology of this study.
Processes 10 00645 g001
Figure 2. Ag removal by 0.050 g (wet weight) of Aspergillus tabacinus pellets at different pH values and contact times. pH: : 2; : 3; : 4; : 5; : 6; : 7.
Processes 10 00645 g002
Figure 3. Ag adsorbed on Aspergillus tabacinus pellets at different pH values and contact times. pH: : 2; : 3; : 4; : 5; : 6; : 7.
Processes 10 00645 g003
Figure 4. Au removal by 0.050 g (wet weight) of Aspergillus tabacinus pellets at different pH values and contact times. pH: : 2; : 3; : 4; : 5; : 6; : 7.
Processes 10 00645 g004
Figure 5. Au adsorbed on Aspergillus tabacinus pellets at different pH values and contact times. pH: : 2; : 3; : 4; : 5; : 6; : 7.
Processes 10 00645 g005
Figure 6. Ag removal by 0.050 g (wet weight) of Cladosporium cladosporioides pellets at different pH values and contact times. pH: : 2; : 3; : 4; : 5; : 6; : 7.
Processes 10 00645 g006
Figure 7. Ag adsorbed on Cladosporium cladosporioides pellets at different pH values and contact times. pH: : 2; : 3; : 4; : 5; : 6; : 7.
Processes 10 00645 g007
Figure 8. Au removal by 0.050 g (wet weight) of Cladosporium cladosporioides pellets at different pH values and contact times. pH: : 2; : 3; : 4; : 5; : 6; : 7.
Processes 10 00645 g008
Figure 9. Au adsorbed on Cladosporium cladosporioides pellets at different pH values and contact times. pH: : 2; : 3; : 4; : 5; : 6; : 7.
Processes 10 00645 g009
Figure 10. Ag removal by different dosages (wet weight) of Aspergillus tabacinus pellets and at different contact times. : 1 h; : 2 h; : 3 h; : 4 h; : 5 h; : 6 h; : 12 h; : 24 h.
Processes 10 00645 g010
Figure 11. Ag adsorbed on different quantities (dry weight) of Aspergillus tabacinus pellets. : 0.0019 g; : 0.0035 g; ●: 0.0050 g; : 0.0065 g; : 0.0076 g; : 0.0108 g. Symbols represent experimental data, while continuous lines represent simulation results of the adjusted pseudo-second-order model.
Processes 10 00645 g011
Figure 12. Au removal by different quantities (wet weight) of Aspergillus tabacinus pellets and at different contact times. : 1 h; : 2 h; : 3 h; : 4 h; : 5 h; : 6 h; : 12 h; : 24 h.
Processes 10 00645 g012
Figure 13. Au adsorbed on different quantities (dry weight) of Aspergillus tabacinus pellets. : 0.0020 g; : 0.0035 g; ●: 0.0050 g; : 0.0063 g; : 0.0075 g; : 0.0101 g. Symbols represent experimental data, while continuous lines represent simulation results of the adjusted pseudo-second-order model.
Processes 10 00645 g013
Figure 14. Ag removal by different quantities (wet weight) of Cladosporium cladosporioides pellets and at different contact times. : 1 h; : 2 h; : 3 h; : 4 h; : 5 h; : 6 h; : 12 h; : 24 h.
Processes 10 00645 g014
Figure 15. Ag adsorbed on different quantities (dry weight) of Cladosporium cladosporioides pellets. : 0.0023 g; : 0.0036 g; ●: 0.0051 g; : 0.0063 g; : 0.0077 g; : 0.0106 g. Symbols represent experimental data, while continuous lines represent simulation results of the adjusted pseudo-second-order model.
Processes 10 00645 g015
Figure 16. Au removal by different quantities (wet weight) of Cladosporium cladosporioides pellets and at different contact times. : 1 h; : 2 h; : 3 h; : 4 h; : 5 h; : 6 h; : 12 h; : 24 h.
Processes 10 00645 g016
Figure 17. Au adsorbed on different quantities (dry weight) of Cladosporium cladosporioides pellets. : 0.0025 g; : 0.0036 g; ●: 0.0048 g; : 0.0062 g; : 0.0078 g; : 0.0100 g. Symbols represent experimental data, while continuous lines represent simulation results of the adjusted pseudo-second-order model.
Processes 10 00645 g017
Table 1. Recovery of Ag and Au by several biosorbents. Modified from Soundararajan et al. [19] and Legorreta-Castañeda [20].
MetalBiosorbentAmount of Metal Adsorbed
(mg/g)
Ci *
(mg/L)
AgChemically-modified chitosan resin226.5647.2
AgDried and ground Cladosporium cladosporioides pellets13.3–42.6 107.9
AgDried Bacillus cereus91.75203.5
AuChemically-modified chitosan resin709.11181
AuDried and ground Cladosporium cladosporioides pellets81.1–101197
AuDried and ground Sargassum natans4208.5–1000
* Ci: Initial metal concentration.
Table 2. Parameters of the pseudo-second-order model kinetic model adjusted to the Ag biosorption on different quantities of Aspergillus tabacinus pellets.
Biomass Quantity
(g ww *)
Biomass Quantity
(g dw *)
qe
(mg/g dw)
k
(g dw/mg·min)
r2
0.0250.001942.3730.03840.9929
0.0500.003531.8470.01510.9851
0.0750.005023.0950.01850.9933
0.1000.006517.5130.02750.9903
0.1250.007614.9700.03510.9857
0.1500.01087.6100.13660.9938
* ww: wet weight; dw: dry weight.
Table 3. Parameters of the pseudo-second-order kinetic model adjusted to the Au biosorption on different quantities of Aspergillus tabacinus pellets.
Biomass Quantity
(g ww *)
Biomass Quantity
(g dw *)
qe
(mg/g dw)
k
(g dw/mg·min)
r2
0.0250.002024.3900.01290.9946
0.0500.003521.2770.01640.9937
0.0750.005017.4220.01630.9878
0.1000.006314.4090.01500.9851
0.1250.007513.3510.02090.9880
0.1500.01018.3750.03480.9845
* ww: wet weight; dw: dry weight.
Table 4. Parameters of the pseudo-second-order model kinetic model adjusted to the Ag biosorption on different quantities of Cladosporium cladosporioides pellets.
Biomass Quantity
(g ww *)
Biomass Quantity
(g dw *)
qe
(mg/g dw)
k
(g dw/mg·min)
r2
0.0250.002347.1700.00500.9837
0.0500.003636.1010.00360.9902
0.0750.005126.1780.00570.9943
0.1000.006317.8250.00610.9947
0.1250.007717.1230.00650.9917
0.1500.010611.3770.01220.9858
* ww: wet weight; dw: dry weight.
Table 5. Parameters of the pseudo-second-order kinetic model adjusted to the Au biosorption on different quantities of Cladosporium cladosporioides pellets.
Biomass Quantity
(g ww *)
Biomass Quantity
(g dw *)
qe
(mg/g dw)
k
(g dw/mg·min)
r2
0.0250.002530.8640.01480.9908
0.0500.003629.7620.00760.9902
0.0750.004826.7380.00720.9934
0.1000.006220.2430.01260.9914
0.1250.007817.0650.01670.9919
0.1500.010012.1360.03230.9980
* ww: wet weight; dw: dry weight.
Publisher’s Note: MDPI stays neutral with regard to jurisdictional claims in published maps and institutional affiliations.

