1. Introduction
In the current climate of constant change in the market, inventory management becomes a serious issue requiring systematic planning, monitoring and control.
Because large companies produce several hundred different types of products each, it is a daunting task to effectively maintain control over the storage and handling processes of components. This article wishes to propose a combination of methods to tackle this inventory problem, namely the ABC inventory analysis method and the MRP method (Material Resources Planning). To date, several approaches have been suggested to deal with the inventory issue by involving ABC analysis. The inventory concepts and advantages of ABC classification were analyzed and the method’s various steps were implemented using ABC analysis to analyze an original case discussed by [
1]. Kumar [
2] suggested that the inventory problem in compressor manufacturing can be evaluated and understood using inventory management and ABC analysis.
Kavitha [
3] proposed the performance of ABC analysis in order to determine the effectiveness of inventory management in a manufacturing company in the area of agricultural machine production. Similar research was conducted by [
4] to analyze a case study on the efficiency of the ABC analysis of inventory management in a giant warehouse. Asana [
5] proposed stock control methods using ABC analysis and MinMax analysis. The approach was implemented in a retail management information system. Additionally, Ref. [
6] explored the effectiveness of using a reorder point (ROP) automated system in combination with inventory control using the ABC analysis method within a textile industry company.
However, the above research did not consider implementing the ABC analysis in combination with subsequent MRP planning, especially when facilitated by modern resource-planning software. This method, demonstrated by using a real-life case study scenario, wishes to fill the existing gap. The article further proposes a methodological framework, describing the implementation of such a combined approach.
For the proposed methodological framework, the classification of stocks using the ABC inventory analysis is used, the purpose of which is to divide stocks into three main groups. The MRP method is used to determine material requirements in terms of the actual needs for particular products, as required by customers or based on a forecast of expected market needs. The proposed methodological framework is subsequently tested on a real case-study company focused on the area of engineering production.
Furthermore, the work contains an analysis of the current state of planning in the case-study company with a focus on a short-term planning. At present, there is a frequent recasting of machines needed, resulting in a costly time waste.
It is Lean management that deals with reducing downtimes. The planning work is performed in the environment of the SAP information system. The number of changes made to the machines is based on the output of a sequence of products flowing from a four-month plan report. The main criterion for setting the parameters for optimal output is Material Resources Planning (MRP). Part of the work is a description of the theoretical basis in the fields of planning and Lean management. An additional analysis of the current state of planning in the investigated company is performed; its material and capacity planning are detailed in the climate of the current epidemiological situation. The article suggests a procedure of creating a four-month plan within the SAP IS interface in a chronological arrangement of the use of transactions. The selection of MRP parameters is innumerable, and therefore, the four most-likely possible variants are selected to optimize the planning process. In the end, the cost balance is quantified, corrective measures are set and a specific pivot table is created to facilitate the work of a planner. Finding the optimal variant for the most numerous PAR component line means the possibility of an application for other assembly and component lines in order to increase the productivity of the given company.
2. Problem Formulation in the Case Study Company
The priority of every manufacturing company is to constantly improve, innovate and move forward to a higher level, in terms of both technology and logistics, to meet customer and market requirements. Due to special customer requirements for products, the amount of “tailor-made” products is significantly increasing. The case study company is focused on the production of equipment for specific devices. As organizations/companies want to prosper and increase their market shares, they need to respond flexibly to changes. The priority of organizations in the long run is to strive to produce the widest possible range of products to satisfy the requirements of their customers. The result is an increasing variability of manufactured products. It should be emphasized that the result cannot have a negative impact on the basic parameters of a product. At present, the idea of streamlining production with the application of Lean management can be considered a major trend in production companies. The implementation of Lean management is focused on increasing productivity while maintaining or eliminating incurred costs.
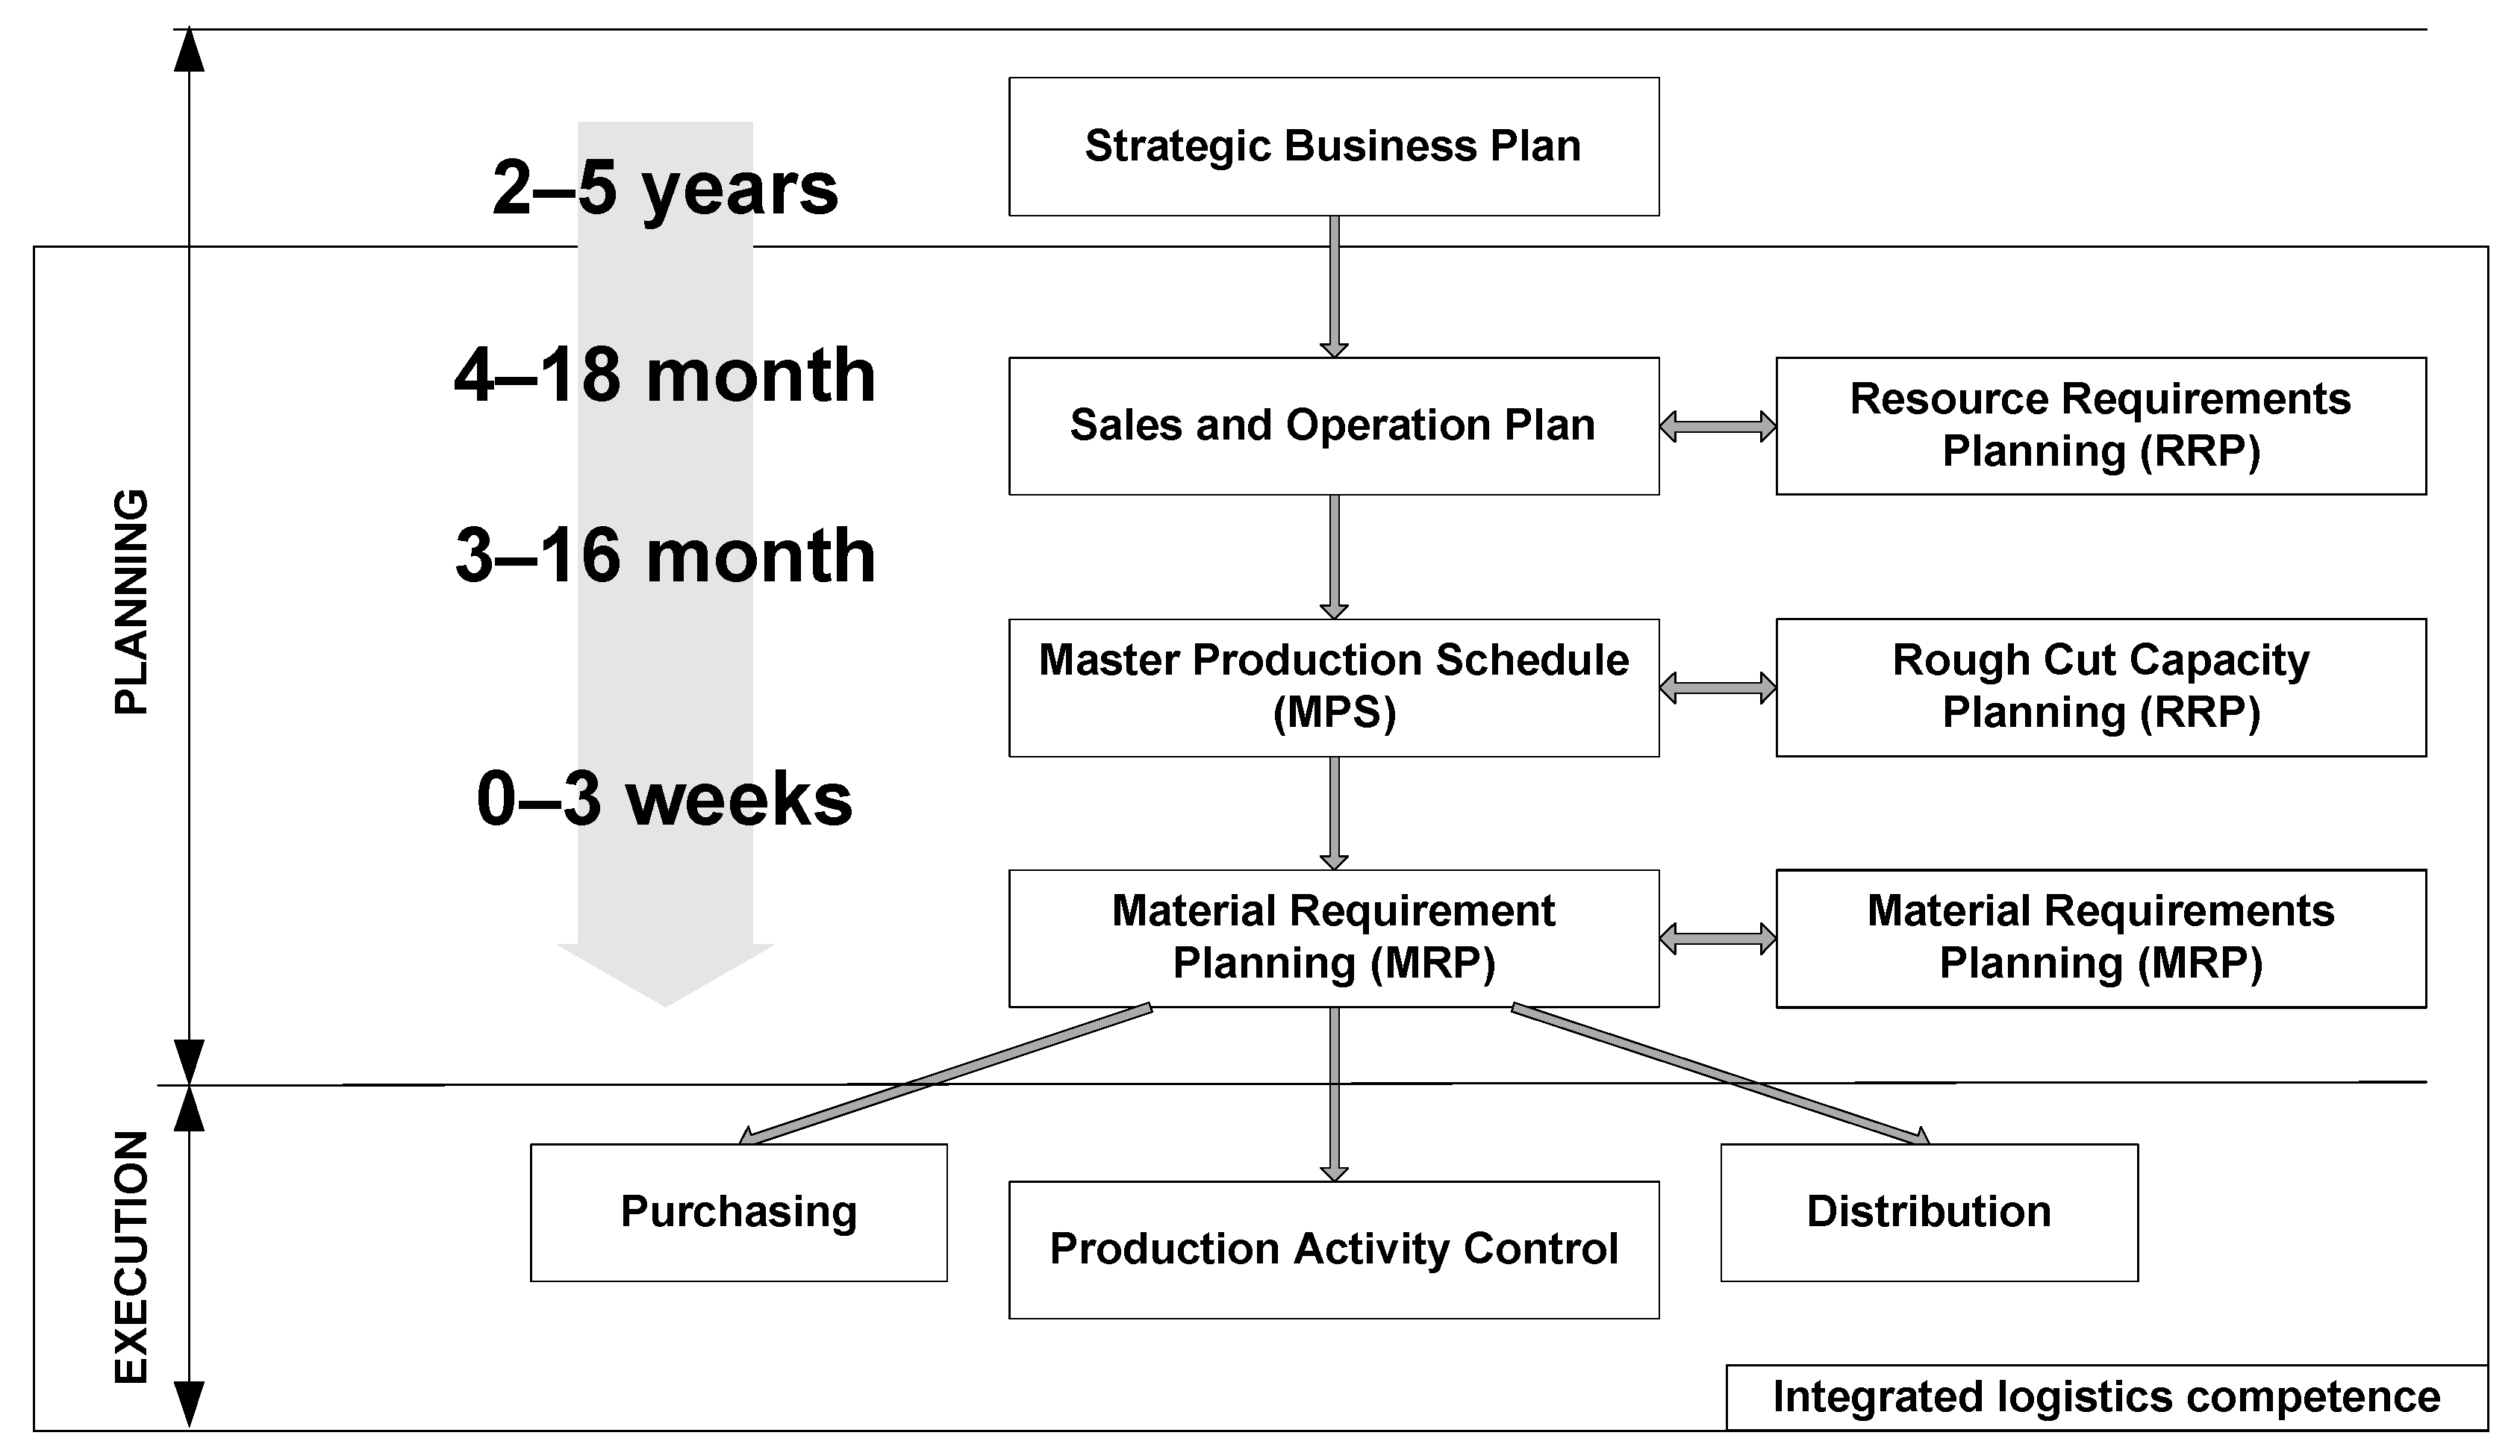
The problem of planning in the researched company (
Figure 1) was the ad-hoc scheduling of production. This problem resulted in a frequent changeover of the machines, which created downtimes in the production process. A significant number of downtimes reduces productivity and consequently increases costs. Because only intuitive methods were used in the production management process, although they were effective, the results of these methods were often unpredictable and caused errors.
To improve production planning and management, the ABC inventory analysis was applied, which is focused on the division of products according to a main criterion. In this case, the main criterion was the consumption of products in the last 60 days. It is also important to determine the ratio of products in each group (A, B and C) in terms of batch size. When creating the production plan, the MRP parameter was determined, which was based on the results of the analysis strategy, batch size and ABC analysis.
The application of MRP parameters is based on product structure, setting deadlines for ordering materials and initiating individual operations so that the final delivery dates of goods are determined. The determination of material requirements in terms of actual production needs is linked to the determination of the batch size. Based on the determination of the dose sizes for the individual groups A, B and C, the planning in the case was optimized and the amount of machine changeovers was reduced. Ultimately, the application of the ABC method with a link to MRP parameters also contributed to the efficiency of the production process as well as to cost minimization.
Ways to improve the planning process:
Determine (in advance) the real dates of the implementation of production tasks;
Shorten the deadline for the order delivery;
Accept the required change in the volume or order date;
Assign a new order and reconsider the production schedule in connection with the currently executed orders;
Solve the problems of bottlenecks and a narrower capacity of tools as well as operators;
Find a timely solution to the problems of planned maintenance and downtimes.
2.1. Lean Management
Lean management as a management technique became widespread in various industries. The fact that this technique became a universal management tool happened precisely due to its basic values and positive impact on the overall performance of companies. This management system can be used in a business or production process from production to marketing and software development [
7]. The goal of Lean management is to produce value for the customer that is ensured by using resource optimization. The second goal is to create a stable workflow that is based on real customer requirements.
The aim of Lean management’s methodology is to eliminate the loss of time, effort or money by identifying every step in the business process. Subsequently, it is necessary to carry out a review to identify the steps and processes that do not add value [
8]. Lean management is focused on:
The methodology of Lean management can be understood as the continuous improvement of not only work processes and purposes but also people. Within management, shared responsibility as well as shared management take precedence over a full control over work processes [
8].
The Benefits of Lean Management
Lean management is the provision of multiple benefits in organizations by improving the work process at each hierarchical level of the company. These benefits include [
8]:
Intelligent pull process—it requires all members of the chain to flexibly adapt the range, volumes and production capacities to changing market requirements;
Efficient use of resources—the production process is oriented to the real demand in terms of using the number of resources that is necessary for the continuous operation of the production process;
Elimination of uneconomical activities—focus on job opportunities and force those that add value into the production process;
Increased productivity and efficiency—thanks to a better focus, it is possible to contribute to the increased productivity and efficiency of employees as activities that have no added value are eliminated.
Ensuring these benefits aims to increase the company’s flexibility to respond more flexibly and quickly to customer requirements. By applying Lean management, it is possible to create a stable production system to contribute to increasing the performance of the entire company.
2.2. ABC Analysis Specification
Working with priorities should be an important element of inventory planning and management. ABC analysis is a technique of categorizing inventory items according to their substantial impacts on the overall expenditure of an organization [
9]. The main principle of ABC analysis is the fact that a small percentage of items usually represents a considerable amount of the financial value of the total inventory used in the production process, while a relatively large number of items often represents a small part of the financial value of the stored inventory. The money value is determined by multiplying the quantity of the material of each item by its unit price. Each item in the inventory is split into an A, B or C category depending upon the amount spent for that particular item [
10]. More specifically, the ABC inventory classification approach categorizes inventory items as A, B and C classes according to their annual consumption values [
7] in order to group them based on their estimated importance [
8]. Labels for the classes A, B and C can provide priority information for handling inventory based on the value of an item [
9].
Category A represents the items that need the most attention in terms of inventory management. The items in this group make up approximately 80% of the value of consumption, and it is necessary to monitor them regularly [
10]. A significant amount of capital is tied to these items. For this group of items, 15% of the volume of input variables produces 65% of the volume of output variables [
11].
Category B includes intermediate items. In this group of items, 20% of the volume of input variables produces 20% of the volume of output variables. Deliveries of items in this group are used less compared to the previous group. However, the size of the supplies as well as the value of the insurance stock is usually higher [
11].
Category C contains the least important items, which means that 65% of the volume of input variables produces 15% of the volume of output variables. An estimate of the ordered quantity according to the average consumption based on the previous period is used to manage stocks. It is important to have these items in stock as the insurance stock must be at a high level [
11].
This distribution is arbitrary, and the groups are defined in accordance with the enterprise’s needs [
12].
The reason for such an item classification is to determine suitable quantities of each item in order to optimize the item’s usage. The items are classified based on their annual usage value. Although this value specification may not be the most accurate, it has been found to be close to the existing occurrence in companies with remarkable accuracy [
11].
ABC inventory analysis is also referred to as the 80/20 rule, a method of classifying products as specified by their respective importance [
11], stating that “80% of the overall consumption value is based on only 20% of total items [
9].”
The main objective of this technique is to manage, in an effective way, a set of inventory items by determining which inventory control policy to use for each category in order to keep the inventory costs under control [
13].
2.3. Material Requirements Planning
The traditional manufacturing planning and control systems were not developed to work in such a volatile environment typical for the current market environment [
14].
Correct planning is crucial for effective production planning and, subsequently, the quality of products [
15]. Materials Resources Planning (MRP) is a technique used to determine the quantities and the times needed to purchase specific goods depending on the demand for the given items based on the requirements of the production schedule. It is a technique that uses a bill of material, inventory, receipts that were estimated, and the master production schedule to determine material requirements [
16]. Thus, Material Resources Planning (MRP) schedules material deliveries based on sales forecasts [
1].
Material Resources Planning works well in manufacturing companies, considering its suitability for planning items with dependent demand. However, its major strength is its suitability for the planning of complex standardized products or products with long manufacturing lead times and items with time variations and uneven demand [
17]. The potential weakness is that the production function performance is measured by focusing on the output values of finished goods, which often encourages planners to create big batch sizes [
18].
Based on orders assigned to the system based on customer needs that the customer has requested, or based on market expectations, a forecasting method called Material Resources Planning is used to create a forecast. The amount of material requirements is also indicated by the stock level, the size of the BOM or the four-month production plan itself. In addition, this method can be used in the field of purchasing as a design to secure material and production orders for different types of parts or other groups [
8].
To apply the material planning method, it is necessary to ensure:
The existence of a BOM for each product that is produced;
The existence of items that are either produced or purchased and have an identifier that contains essential information about the item;
The existence of knowledge about the current levels of the stocks of orders, which can be planned or can also be in the form of an open order;
Sufficient knowledge of batch size determination, which is related to the duration of the purchasing process as well as the duration of the production process [
8].
3. The Proposed Methodological Framework Combining ABC Analysis and MRP
In the current climate of constant change in the market, inventory management becomes a serious issue requiring monitoring and control. Because large companies produce several hundred different types of products each, it is a daunting task to effectively maintain control over the storage and handling processes of components. This article wishes to propose a combination of methods to tackle this inventory problem, namely the ABC inventory analysis method and the MRP method (Material Resources Planning). This section proposes a methodological framework, describing how to implement this combined approach (
Figure 1).
For the proposed methodological framework, the classification of stocks using the ABC inventory analysis is used, the purpose of which is to divide stocks into three main groups. The MRP (Material Resources Planning) method is used to determine the material requirements in terms of the actual needs for particular products as required by customers or based on the forecast of expected market needs. The proposed methodological framework was subsequently tested on a real case-study company from the area of engineering production. The purpose of the methodological framework was to integrate the ABC and MRP methods through the information system SAP ERP in order to optimize the production planning process and ultimately eliminate the costs of the production process.
The inputs into the ABC inventory analysis constitute the requirements for the total quantity of products and batch sizes. Another task is to divide the requirements into three groups according to the total number of products. The effectiveness of Material Resources Planning lies in distribution based on the size of the batch and the time horizon in terms of its production. The total amount of products, split into the groups A, B and C, is expressed as a percentage. The main criterion for the division into the groups A, B and C is considered to be the consumption of the product inventory stock in the last 60 days. Subsequently, it is necessary to determine the available batch size using Material Resources Planning (MRP) by setting the batch size method in the SAP information system. For Material Resources Planning purposes, it is important to classify the products into these three groups according to batch size:
The products of group A, which will be produced every day—ZT;
The products of group B, which will be produced at least once every 5 days—A2;
The products of group C, which will be produced at least once every 10 days—A3.
Subsequently, the SAP information system is used—specifically transaction ZPP26N—to optimize resource planning. Information regarding the quantities of products, the availability of stocks and the size of a batch in a given time interval can be used to generate production plan variants in terms of the optimal settings of MRP parameters.
Using the MRP method, the production of finished products is planned based on the outputs of the ABC analysis. The outputs of the integration of the ABC and MRP methods are the determination of the schedule and the sequence of manufactured products during the working week. The amount of material requirements also indicates the stock level, the size of the BOM or the actual four-month production plan.
In case of changes in MRP parameters from applying the ABC inventory analysis, it is possible to obtain an optimal calculation of the batch size. The determination of an optimal setting of MRP parameters by using the application of the ABC method can contribute to the elimination of the number of needed changeovers. This ultimately leads to a smaller number of recasting machines and the elimination of downtimes.
4. The Planning Process in the Case Study Company
The main task of planning in the company is to set the plan so that the company can meet the requirements of its customers. Scheduling can provide an optimum allocation of resources, and planning is an optimum utilization of these allocated resources to cover the requirements of multiple customers [
19]. Rolling horizon production plans can be revised with new information becoming available as time moves forward. However, frequent adjustments to production plans cause an increase of instability in the production system, which might result in a surplus or deficiency in production resources [
20].
The entire planning cycle takes place from the beginning of entering the order into the system until the precise planning of the production of a specific product in advance for a period of up to four months in advance. The level of stocks is an important factor in the planning process [
21].
The planning in the surveyed company is divided into long-term planning, medium-term planning and short-term planning (
Figure 2).
4.1. Sales and Operations Planning (S&OP)
The long-term planning in the case-study company is carried out for a period of 4 to 18 months in advance. Based on archived data from previous years on sales, it is also possible to predict market requirements for the current year. The aim of planning was therefore to find the optimum balance between supply and demand [
22].
4.2. Profit Plan
A profit plan is a long-term outlook for the future. This plan is used to compare the actual values with the planned values. It is a vision of whether the production is good enough or, conversely, whether something needs to be improved in the future. It is a prepared plan for a period of 1 year [
22].
4.3. Middle Level Planning (MLP)
Medium-term planning is planning with a focus of one to three months. The whole medium-term planning cycle is shown in
Figure 3 [
22].
4.4. Short-Term Planning
The analysis of the planning process is a more complicated process. When creating a production plan, it is important to pay attention to capacity or material planning. Planning processes are commonly supported by computer solutions; however, manual interactions are commonly needed as sometimes, the problems do not fit general-purpose planning systems. Manual planning approach is tedious, time consuming and prone to errors. Therefore, solutions to automatize structured problems are needed [
15]. The entire planning process is carried out with the help of the SAP information system, which enables a detailed analysis of production scheduling in the SAP environment [
22].
The production plan is applied in production, and the finished product is then shipped. The case-study company operates based on a Make-to-Order strategy, which means that their stocks of finished products are exclusive as insurance stocks in case of unexpected situations. Usually, the product is distributed to the customer as soon as possible by means of transport [
22].
4.5. Four-Month Plan
The output of the planning process cycle is the finished production plan. This plan is specified for a time horizon of four months. The plan is a basic set of information and data for the planner [
23]. Basic production information can be read from the plan. An intelligent information system can work with a huge amount of data. The four-month plan is a report of the SAP information system, specifically transaction ZPP28N. SAP must include many criteria when creating an IS plan, such as analysis strategy, a dose size and the results of an ABC analysis. These parameters can be referred to as MRP parameters when creating a production plan. In addition, it is important to consider line capacity, human resources and stock levels [
22].
Finding the optimal plan can therefore be included in the area of Lean management. The task of streamlining production is to minimize waste in the production process. Large manufacturing companies use information systems to help run a business. One of them is the SAP information system. The main issue in the case-study company was the frequent recasting of machines and consequent downtimes. It was not possible to shorten these downtimes, but it was possible to reduce their number by finding an optimal setting of MRP parameters. The production plan presented when and how many specific products of a specific model using the given components would exit the assembly line.
Another important variable for production scheduling is capacity planning. Capacity planning works based on forecasts and orders entered into the system, thus creating a four-month production plan. This plan is then balanced in terms of capacity, and an exact plan of 4 months in advance is created with specific instructions on which specific product model will be produced at an exact time on a given line. The four-month plan is produced by planners. The creation of the plan is limited by the line capacity. The production plan is optimized by planners with the help of the SAP program based on the following criteria:
Results of the ABC analysis (consumption oriented);
Grouping of the same models within one day into only one contract;
Basis on the critical components in regards to production support.
The order focuses on a horizon of up to 6 weeks, and the forecast is defined for 7 or more weeks in advance. The difference between a forecast and an order is that the forecast is a long-term estimate of the customer demand. Thus, it is actually a vision on the part of the customer that is influenced by the forecast based on previous periods as a result of the application of various statistical methods. The order is already a confirmed, transformed forecast. Forecasts are inaccurate and are therefore supplemented by the planners themselves based on empiricism, experience and estimates. This planning process is associated with a frozen period and significantly affects the capacity strategy planning. The impact on the indistinct success of forecasts is that customers often change the numbers and types of models in an order, given that their customers often change their item requirements. This is also called the bullwhip effect in the supply chain.
The starting point for solving the planning problem is a four-month production plan for the assembly line. For the purposes of this case study, the ABC analysis was created in the SAP information system. The main criterion for assigning the characters A, B and C to a specific product was the consumption of specific products in the last 60 days. The classification criteria were the elimination of changeovers (downtimes) and the resulting elimination of costs. This strategy is presented in
Table 1.
Subsequently, planning optimization and dose-size determination were performed. The procedure for entering the batch size is presented in
Table 2.
The chosen strategy was as follows:
Group A—products made up of the total number of products (80%) will be produced every day (ZT);
Group B—products made up of the total number of products (15%) will be produced at least once every 5 days (A2);
Group C—products created according to the total number of products (5%) will be produced at least once every 10 days (A3).
If the production line is switched from the production of specific products of Group A to the production of specific products of Group B, it is necessary to change the settings of the production equipment. Each change takes a certain amount of time, and this means that production is suspended. An ideal production, according to production managers, is one that produces specific products of a certain type in the longest possible time. According to planners, production settings can be changed according to current orders [
24].
This is where disagreements arise between planners and production management. It is therefore important to find a compromise between these two parties. It is necessary to find a setting where there are as few changeovers as possible and therefore a higher line output. At the same time, the stock of finished products should not be too high. These solutions are tested in SAP. It should be noted that each four-month plan is unique as different needs come from the customers. However, if an ideal setting is found, it is very likely that this setting will not only work for a specific line but also be applicable to other lines. All this must relate to the amount of stock in the warehouse, whilst it is also necessary to focus on minimizing the production in small batches for one pallet, for example, for 36/37 pieces. Based on the information obtained, it will be possible to compare the amount of stock in the warehouse against the current stock, so it will be clear how many models have been increased by merging batches and how many are waiting in the warehouse for dispatching. Forecasts are accurate only up to 30%, so in order to cover inconsistencies, so-called safe stocks are prepared for the purchased materials.
4.5.1. Frozen Period
To maintain a stable plan, a frozen period is needed—the proportion of planning horizon being frozen [
25]. The frozen period is a plan for seven days in advance during which no further interventions in the production plan should be made. A frozen period is updated three times a week. The task of this planning is to consolidate production. A frozen period serves to ensure that production is no longer disturbed. It fulfills the function of stability in production and prevents possible chaos. This is also necessary because certain components must be manufactured 2 to 3 days in advance of the actual assembly.
4.5.2. Slushy Period
This is a planning period that follows the frozen period. After seven days of the frozen period, a slushy period is planned for another seven days. Changes can be made to this plan, but only in exceptional situations and with due justification. Within the case-study company, with a more detailed approach to production in 2020, it was possible to see a decline in production starting in April and thus a significant weakening and decline in production, due to the pandemic, until October, when production stabilized and production resumed, as can be seen in
Figure 4.
Most manufacturing companies are dependent on production technologies, which means that their production sequences are predetermined. The case-study company produced about 4000 models of products, and other models were designed for individual orders. It had a specific production for each model and thus a different number and order of production operations for production facilities. If the operations for the production of all models were identical, that is, if they were carried out in the same order and the durations of all the production operations were the same, the sequence of products would be irrelevant. The subsequent scheduling of production is a significant problem. The durations of the operations between the different product models are different and are not performed in the same order, and the settings of equipment are not the same; therefore, resetting is necessary. The resetting takes into account the SAP IS transaction called ZPP26N, which processes this data and enables the creation of the best production sequence. The aim of this transaction is to find a sequence of production models in which the minimum lead times of all the models can be achieved and, at the same time, the capacity of lines and equipment will be used to the maximum [
21].
4.5.3. ZPP26N Transaction Application
The initial cycle of creating a four-month production plan begins when creating transaction ZPP26N. In this transaction, the initial plan setup, and thus the optimization, takes place. The sequence is based on real orders entered in the SAP system and assigned to specific products. Sequencing means grouping production operations into production batches and arranging them according to priority. By properly arranging products in a sequence, one reduces unproductive times or downtimes associated with resetting production, thus increasing productivity and yield. Using Lean management, small quantities can be produced in chronological order, but in order to meet the objectives and satisfy all customer requirements, it is appropriate to choose production for long production series instead. Both approaches have their advantages and disadvantages. Short production series mean many time periods and reduced productivity, and long production series result in long lead times and unfavorably excessive capital tied up in inventory. In practice, this means that this production sequence must be optimized. It is important to find a sequence of production that makes the most of the time available and that the products are set up so that the grouping makes sense. The best product sequence has a significant impact on product delivery times; it also affects works in progress and thus affects the resulting productivity. Therefore, those production orders for which delivery times have approximately the same time horizons are grouped together. Another important factor in grouping product models is the priority that the scheduler sets in the transaction.
5. Results
5.1. The First Variant
Part of the first variant is the setting of the MRP parameters. Within this variant, an analysis of the settings for the specific products in production is processed in percentage terms, while the set parameters are as follows:
Group A products account for 80% of the total amount of products;
Group B products account for 15% of the total amount of products;
Group C products account for 5% of the total amount of products.
The purpose of the second phase is the process of grouping the relevant models. Subsequently, the specific products are grouped so that the products within the 5-day range are combined into one batch. Therefore, the setting of the MRP parameters, and thus the batch size, is for:
Group A products that will be produced daily (ZT);
Group B products that will be produced at least once every 5 days (A2);
Group C products that will be produced every 10 days (A3).
The case plan optimized in this way had to be recalculated to determine the number of changes each day for four months in advance. It was necessary to consider how many changes per day would be made with this variant. The course of the changes is shown in
Figure 5.
With this strategy and batch setting, a value of 25.21 was calculated, which represented the daily average count of changeovers.
5.2. The Second Variant
For the second variant, the MRP parameters were completely changed, whether they were in terms of the strategy in the ABC analysis or the second phase of grouping specific products and setting the batch size, where the method of the optimal calculation of batch size was used. The percentage redistribution of MRP parameter settings was represented by the total amounts of product produced:
Group A products account for 50% of the total amount of products;
Group B products account for 30% of the total amount of products;
Group C products account for 20% of the total amount of products.
In terms of setting the MRP parameters as well as the dose size, the following groups were determined:
Group A products are produced daily (ZT);
Group B products are produced at least once every 5 days (A2);
Group C products are produced every 10 days (A3).
The percentage of products set in this batch in this way, as well as the processed capacity planning up to the final report, are presented in
Figure 6. During the period from 24 July 2021 to 9 August 2021, the company did not produce due to a company-wide holiday. Thus, the total number of changeovers in this plan was 3808. The recorded changes are shown in
Figure 6.
For this variant, a value of 28.85 was calculated, which represented the daily average count of changeovers. Compared to the first variant, this represented a significant increase, so another variant was sought.
5.3. The Third Variant
Another possible variant of the optimal setting of MRP is the layout of the ABC analysis so that a product of Group A is assigned a larger share in the total amount used. At the same time, one can complement this possible strategy with the second phase of grouping while changing the optimal dose size into larger batches. Thus, the setting of specific ABC group products was set as follows:
Group A will be allocated products accounting for 60% of the total quantity used;
Group B will be allocated products accounting for 25% of the total quantity used;
Group C will be allocated products accounting for 15% of the total quantity used.
The optimal batch size was as follows:
Products classified in group A are produced daily (ZT);
Group B products are produced at least once every 10 days (A3);
Products in Group C are produced at least once every 15 days (A4).
The number of changeovers increased significantly compared to the first variant and was therefore considered unsuccessful. Based on the calculation of the third variant, a value of 28.75 was calculated, which represented the daily average number of changes (
Figure 7).
This variant showed only a very small improvement over the second variant.
5.4. Number of Changes in the Optimal Variant
The whole process of finding the optimal variant is based on the principle of the ABC method belonging to Lean management. For the best settings of MRP parameters in order to obtain the smallest number of changeovers and achieve the smallest possible number of machine recasts (and thus reduce the number of downtimes), it was necessary to reset the strategy phase and batch size applied in transaction CR02 in IS SAP. According to ABC analysis, the setting of MRP parameters is a criterion of the strategy, and the determination of MRP parameters depends on the total amount of products (in percent). Therefore, it is necessary to break down specific products and apply this analysis strategy:
The products in Group A account for 50% of the total quantity used;
Group B products account for 30% of the total quantity used;
Group C products account for 20% of the total quantity used.
During the grouping phase taking place in transaction CR02, the specific products were grouped in order to be combined into one batch over a subsequent period of 5 days. The setting of MRP parameters was done in the second phase, and thus, the batch sizes were:
Group A products are produced daily (ZT);
Group B products are produced at least once every 5 days (A2);
Group C products are produced at least once every 10 days (A3).
Under normal circumstances, the planners would have already considered such a finished plan to be final and would have gone to production, where the production operators would have followed this plan. This variant reduced the average daily number of changeovers by almost four changes a day compared to the current parameter settings. As a result, the MRP parameters set in this way, processed using SAP IS, considerably streamlined the production. This was greatly reflected in the number of products produced during a shift. The productivity in this variant had visibly increased, and so had profits. This variant could therefore eliminate waste in the entire production process. Although recasting machines does not take an extremely long time and such changes can no longer be shortened, they can be eliminated by using numbers.
The recalculations showed that the best variant was a variant with an average value of 21.51 changeovers per day. This was the smallest number of all the variants, and therefore, this variant represented the best solution. The graph shows the number of changeovers for each day in this variant. This variant was a considerable improvement over the previous variants and the current state. It is possible to see that the sequence and the correct settings of parameters can strongly influence production and the possibility of downtimes. With this variant, the recasting of machines does not occur as frequently as before, which reduces the risk of light and heavy changeovers. The daily changeover numbers are shown in
Figure 8.
6. Conclusions
The article presents a combination of the ABC inventory analysis combined with MRP planning in a modern SAP ERP environment. By taking this approach in the case-study company, the current average daily number of changeovers was 25. This represented four changes per day. One changeover lasts 1 to 2 min. This means that in this way, the company could save an average of about 6 min per day. The production of one specific product takes about 11.1 s. On average, five products are produced per minute. The selling value of one specific product is EUR 40. This means that in a short time of 6 min, potentially 30 products are produced. This means a daily profit of 30 × 40 = EUR 1200. With this variant, it would be possible to save EUR 37,200 per month, which could mean a profit of up to EUR 446,400 per year.
A special pivot table (
Table 3) has been designed for the company, which has been applied to the system and will make the work of the planners much easier. The purpose of the pivot table is to offer a simple and undemanding solution with a clear display of data on changeovers in specific product models. In the table, it is possible to practically manage data on each product model, and the result is a classification of models by date. Row labels stand for months, and one can use a link to sort the months into specific days. In addition, under each product, there are the codes of the components used, which are necessary for the model’s production. For an illustration, shows a selected product model (A) and its variants.
Using the Lean management principle and utilizing the proposed combination of methods, it was possible within the fourth variant to achieve a decrease in the number of changeovers compared to the initial state by up to four per day, which meant that production productivity increased significantly.
The prepared contingency table shows the number of changeovers per number of products displayed clearly in the graph, which visually tells a planner at first glance which product model caused a machine changeover in what quantity and on what date (
Figure 9).
A potential limitation of the study is the specific requirement of having the advantage of a software solution for MRP in a form (for example, the SAP information system) that greatly reduces the time needed for production planning. In the day-to-day reality of a company’s production, an additional limitation is represented by the willingness of the company’s management and staff to implement proposed changes in their practices.
Additional studies might focus on refining future demand forecasting to reduce the uncertainty in planning. For the purposes of this specific case-study company, an additional study might explore the potential of the SMED approach to further reduce the changeover times.
The leanness of a company means acting in such a way that its activities are performed successfully right away so that the company can perform them smarter than the competition and, at the same time, spend less money than the competition. The specificity of a lean company compared to a regular company is precisely in finding the processes that take less time yet produce more products and thus can process more orders in a shorter time than the competition.


