Article

Biodegradation Kinetics of Phenol and 4-Chlorophenol in the Presence of Sodium Salicylate in Batch and Chemostat Systems

Department of Safety, Health and Environmental Engineering, Central Taiwan University of Science and Technology, 666, Bu-zih Road, Bei-tun District, Taichung 406053, Taiwan
*
Author to whom correspondence should be addressed.
Processes 2022, 10(4), 694; https://doi.org/10.3390/pr10040694
Submission received: 16 March 2022 / Revised: 30 March 2022 / Accepted: 31 March 2022 / Published: 2 April 2022

Abstract

:
The biodegradation of phenol, sodium salicylate (SA), and 4-chlorophenol (4-CP) by Pseudomonas putida (P. putida) was evaluated by batch and chemostat experiments in single and binary substrate systems. The Haldane kinetics model for cell growth was chosen to describe the batch kinetic behavior to determine kinetic parameters in the single or binary substrates system. In the single phenol and SA system, the kinetic constants of μm,P = 0.423 h−1, μm,A = 0.247 h−1, KS,P = 48.1 mg/L, KS,A = 71.7 mg/L, KI,P = 272.5 mg/L, and KI,A = 3178.2 mg/L were evaluated. Experimental results indicate that SA was degraded more rapidly by P. putida cells compared to phenol because SA has a much larger KI value than phenol, which makes the cells less sensitive to substrate inhibition even though the μm,P value is larger compared to μm,A. The ratio of inhibition of phenol degradation due to the presence of SA (IA1) to the inhibition of SA degradation due to the presence of phenol (IA2) is 2.3, indicating that SA has a higher uncompetitive inhibition on phenol biodegradation compared to that of phenol on SA biodegradation in the binary substrate system. In the ternary substrate system, the time required for the complete degradation of SA and phenol was 14 and 11.5 d and an approximately 90% removal efficiency for 4-CP was achieved within 14 d. In the chemostat system, the removal rates of phenol and SA were 96.6 and 97.0%, while those of SA and 4-CP were 91.4% and 95.2%, respectively. The model prediction agreed satisfactorily with the experimental results of the chemostat system.

1. Introduction

Phenols and chlorophenols (CPs) are considered xenobiotic contaminants and are widely used in various industries such as petroleum refineries, pharmaceutical, pesticides, paper, leather, resin, and dyes [1,2,3]. The use of phenols and CPs has garnered considerable attention owing to their toxic, carcinogenic, bioaccumulative, and mutagenic properties [4,5,6]. Phenols from the improper discharge of industrial wastewater treatment plants are toxic and harmful to fish even at the low concentrations of 5–25 mg/L [7]. The effluent concentrations of 4-CP from these industries range from 100 to 1000 mg/L [8]. The effluent discharge of 4-CP, even at the low concentrations of 3–4 mg/L, may reduce the enzyme activity or be lethal to living organisms because of its toxicity [9].
Various treatment techniques have been applied for the treatment of wastewater containing phenol and 4-CP, in order to remove them from wastewater, and thereby diminish the load of environment contaminants from wastewater discharge [10]. These removal techniques include physical, chemical, and biological treatments. Physicochemical methods including adsorption, distillation, reverse osmosis, ion exchange, membrane pervaporation, solvent extraction, ozonation, and electrocoagulation, etc., are widely used to remove phenol and 4-CP from the industrial effluents [11,12,13,14]. However, these techniques have some limitations owing to their high treatment cost, toxic byproduct generation, and secondary waste production [15,16]. In contrast, biological methods are promising alternatives for the removal of phenol and 4-CP owing to their lower costs and eco-friendly properties [17,18]. Thus, several microorganisms such as Pseudomonas putida (P. putida), Candida sp., and Bacillus sp. have been isolated for the degradation of phenol and 4-CP by utilizing them as sources of carbon and energy [8,19].
Organic compound mixtures are widely found in the effluents of industrial wastewater. The organic contaminants in the mixture are an important issue as the biodegradation of one compound could be inhibited by another. Juang and Tsai [20] conducted a series of batch tests to observe the biodegradation of single and mixed phenol and sodium salicylate (SA) by P. putida CCRC 14365. Their results indicate that the cells preferentially degraded phenol rather than SA. Furthermore, the interactive kinetic parameters between phenol and SA were successfully determined in their extended Haldane model system. Although the high degradation rate of phenol and SA by P. putida was demonstrated in previous studies [7,20,21,22], the interaction parameters due to the inhibition of phenol and SA by P. putida 49451 have not been studied in detail. Moreover, the biodegradation performance of phenol and SA in the chemostat system by P. putida 49451 has not yet been reported.
The simultaneous biodegradation of SA and 4-CP by P. putida was regarded as a cometabolic biological reaction. Cometabolism is the biotransformation of nongrowth organic compounds through the growth of microorganisms by the metabolism of the growth substrate or by resting cells [23]. In our preliminary batch experiment to observe the degradation of 4-CP with an initial nominal concentration of 75 mg/L, which acted as the sole carbon source for the growth of P. putida 49451, we found that neither cell growth nor a biotic reduction occurred in the 4-CP concentration during a period of one week. Based on this experimental result, we decided to use SA as the growth substrate for the cometabolic biodegradation of 4-CP. Loh and Yu [24] successfully used SA as the growth substrate to degrade the nongrowth substrate of carbazole by P. putida ATCC 17484. Wang et al. [25] successfully used a cold-adapted bacteria, P. putida LY1, to degrade the phenol and 4-CP simultaneously. Their results show that the complete removal of phenol and 4-CP was achieved at two initial 4-CP concentrations of 15 and 40 mg/L with initial phenol concentrations of 20–400 mg/L. Wang and Sun [26] carried out the sequencing batch reactor (SBR) to investigate the effect of carbon addition on the biodegradation of 2,4,6-trichlorophenol (2,4,6-TCP). The experimental results show that a suitable carbon dosage enhances the biodegradation of 2,4,6-TCP, however, an excessive carbon dosage inhibits the biodegradation of 2,4,6-TCP in the cometabolic system. Some kinetic models of cometabolism, that involve one specific growth substrate for the cell growth and one cometabolizing nongrowth substrate, have mostly focused on batch systems [25]. However, only some studies have investigated the kinetic model used to describe the simultaneous biodegradation of SA as the growth substrate and 4-CP as the nongrowth substrate due to cometabolism in a chemostat system. Knowledge of mixed substrates biodegradation and cell growth kinetics is quite important for improvements in the process control and removal efficiency of mixed substrates. The approaches of experiments and modeling presented in this study can be used to design a pilot or full-scale chemostat system to treat phenol and chlorophenol simultaneously in industrial wastewater.
This study aimed to investigate the biodegradation kinetics of single and mixed phenol and SA and mixed SA and 4-CP by P. putida 49451. The objectives of the present study were to (1) determine the kinetic constants of P. putida cells on both phenol and SA; (2) investigate the interaction parameters due to the inhibition of phenol and SA on each other; (3) develop the simultaneous biodegradation kinetics of phenol and SA in a chemostat system; (4) evaluate the kinetic constants of 4-CP in binary substrates of SA and 4-CP; (5) develop the kinetic model of synchronous biodegradation of SA and 4-CP; and (6) compare the experimental data with the model prediction in chemostat systems.

2. Model Development

2.1. Kinetic Model for Single Phenol and SA Biodegradation in a Batch Reactor

For each batch reactor with a certain concentration of phenol or SA for cell biodegradation, the specific growth rate of cells can be expressed as follows [20,27]:
μ = γ S X = 1 X d X d t
where μ is the specific growth rate (1/h); γS is the cell growth rate (mg/L-h); and X is the cell concentration (mg/L).
The Haldane model used to describe the cell growth kinetics due to the inhibition of phenol or SA is expressed as follows [20,27]:
μ = μ m S K S + S + S 2 / K I
where μm is the maximum specific growth rate (h−1); KS is the half-saturation constant of the substrate (mg/L); S is the substrate concentration (mg/L); and KI is the self-inhibition constant of the substrate (mg/L). The kinetic constants of μm, KS, and KI can be determined from the cell growth kinetics on the substrate.
The yield coefficient (Y) of cells on the substrate can be calculated as follows [28]:
Y = X m X 0 Δ S C
where Xm and X0 are the maximum and initial cell concentrations (mg/L), and ΔSc is the amount of substrate consumed (mg/L). The maximum specific substrate utilization rate (k) can be described as:
k = μ m Y

2.2. Kinetic Model for Phenol and SA Biodegradation in a Batch Reactor

The specific cell growth rate on binary substrates of phenol and SA can be described as follows [10,20]:
μ P = μ m , P S P K S , P + S P + S P 2 / K I , P + I A 1 S A + + I B 1 S P S A
μ A = μ m , A S A K S , A + S A + S A 2 / K I , A + I A 2 S P + I B 2 S A S P
where μP and μA are the specific growth rates on phenol and SA, respectively (h−1); μm,P and μm,A are the maximum specific growth rates on phenol and SA, respectively (h−1); SP and SA are the concentrations of phenol and SA, respectively (mg/L); KS,P and KS,A are the half-saturation constants of phenol and SA, respectively (mg/L); KI,A and KI,P are the inhibition constants of phenol and SA, respectively (mg/L); IA1 is the inhibition of phenol degradation due to the presence of SA (dimensionless); IB1 is the inhibition of phenol degradation due to the presence of phenol and SA (dimensionless); IA2 is the inhibition of SA degradation due to the presence of phenol (dimensionless); and IB2 is the inhibition of SA degradation due to the presence of SA and phenol (dimensionless). Thus, the overall specific cell growth rate (μX) on dual substrates of phenol and SA can be expressed as follows:
μ X = μ P + μ A

2.3. Kinetic Model for 4-CP and SA Biodegradation in a Batch reactor

The P. putida cells could not degrade the 4-CP alone due to its toxicity. Thus, the toxicity of the 4-CP on cells can be described by a maintenance/death term as follows [29]:
k d , C P = k d , A ( 1 + m d , C P S C P )
where kd,CP is the specific death rate due to 4-CP (h−1); kd,A is the endogenous decay coefficient of cells on SA alone (h−1); md,CP is the decay constant due to 4-CP (L/mg); and SCP is the 4-CP concentration (mg/L). In the binary substrate system, the specific growth rate on the binary substrates of SA and 4-CP can be expressed as [24]:
μ A = μ m , A S A K S , A + S A + S A 2 / K I , A k d , A ( 1 + m d , C P S C P )
For the specific growth rate of cells on SA alone, in the absence of 4-CP, Equation (9) can be simplified as [24]:
μ A = μ m , A S A K S , A + S A + S A 2 / K I , A k d , A
The cell concentration can be represented by
X = X 0 e μ t
where X is the cell concentration (mg/L); X0 is the initial cell concentration (mg/L); and t is the time (h).
In the presence of 4-CP, the specific SA utilization rate (qA), with the incorporation of the inhibition of 4-CP to SA biodegradation, can be expressed as follows [24]:
q A = d S A X d t = k A S A K S , A + S A + S A 2 / K I , A + S C P 2 / I C P
where kA is the maximum specific SA degradation rate by cells (mg SA/mg cell-h); and ICP is the inhibition constant of 4-CP to SA (mg/L). We assumed that the degradation of 4-CP is uninhibited by SA. Thus, a similar Haldane-like equation can be represented to describe the specific 4-CP utilization rate as follows [24]:
q C P = d S C P X d t = k C P S C P K S , C P + S C P + S C P 2 / K I , C P
where kCP is the maximum specific degradation rate of 4-CP by the cells (mg 4-CP/mg cell-h); and KI,CP is the self-inhibition constant of 4-CP (mg/L).

2.4. Kinetic Model for Phenol and SA in a Chemostat System

Based on the specific cell growth rate on the binary substrates of phenol and SA described in the Equations (5)–(7), the phenol and SA utilization and cell growth rates modeled in the chemostat reactor are expressed as follows [30,31,32]:
d S P d t = D ( S P 0 S P ) μ m , P S P X Y P ( K S , P + S P + S P 2 / K I , P + I A 1 S A + I B 1 S P S A )
d S A d t = D ( S A 0 S A ) μ m , A S A X Y A ( K S , A + S A + S A 2 / K I , A + I A 2 S P + I B 2 S A S P )
d X d t = D ( X ) + ( μ P + μ A ) X
where D is dilution rate (h−1); SP0 and SA0 are the concentrations of phenol and SA, respectively, in the feed (mg/L).

2.5. Kinetic Model for SA and 4-CP in a Chemostat System

The dynamic performance of binary substrates of SA and 4-CP in the chemostat reactor was expressed using mass balances for the simultaneous biodegradation of SA and 4-CP and the cell growth as follows:
d S A d t = D ( S A 0 S A ) k A S A X K S , A + S A + S A 2 / K I , A + S C P 2 / I C P
d S C P d t = D ( S C P 0 S C P ) k C P S C P X K S , C P + S C P + S C P 2 / K I , C P
d X d t = D ( X ) + μ m , A S A X ( K S , A + S A + S A 2 / K I , A ) k d , A ( 1 + m d , C P S C P ) X
where SCP0 is the 4-CP concentration in the feed (mg/L).

3. Materials and Methods

3.1. Culture Activation

P. putida ATCC 49451 cell growth on phenol, sodium glutamate, and cometabolized 4-CP was reported by Wang and Loh [23]. Thus, P. putida ATCC 49451 was used as an inoculum throughout all the experiments. The freeze-dried powder strain of P. putida ATCC 49451 was originally purchased from the American Type Culture Collection (ATCC) and stored at 4 °C in the refrigerator. To activate the strain, 0.5 mL of Luria Bertani (LB) broth was added to the vial to melt the freeze-dried stock strain. The activated strain was then transferred to a tube with 2.5 mL of LB. The tube with a cap was placed in a shaker at 150 rpm and 30 °C to ensure the viability of the P. putida cells. 0.9 mL of inoculum added with 0.1 mL glycerin was placed in a freezer at −80 °C for preserving the inoculum. The stock strain was inoculated in the LB agar plate using a platinum inoculation loop and transferred into a shaking incubator at 30 °C for cultivation for 17 h. Several colonies grown on the agar plate were picked, and soaked in a 250 mL Erlenmeyer flask containing 200 mL of growth medium for cultivation in the shaking incubator at 150 rpm and 30 °C for 17 h. The growth medium contained the following components: 3000 mg/L beef extract; 5000 mg/L peptone; 650 mg/L K2HPO4; 190 mg/L KH2PO4; 500 mg/L NaNO3; 100 mg/L MgSO4·7H2O; 5.56 mg/L FeSO4·7H2O; and 500 mg/L (NH4)2SO4 [33].
Then, 25 mL of activated cells were obtained as the inoculum from the late exponential growth phase. The inoculum was centrifuged at 6000 rpm for 10 min and suspended in the phosphate buffer solution and re-centrifuged to obtain concentrated cultures. The concentrated cultures were inoculated into a culture medium in each Erlenmeyer flask. After inoculation, phenol, SA, and 4-CP were added directly from stock solutions to provide the desired initial concentration. Flasks containing mineral medium were autoclaved at 121 °C for 20 min before conducting the batch experiments. All batch culture experiments were conducted in 250 mL Erlenmeyer flasks with mineral medium volumes of 200 mL on an orbital shaker incubator (JSL-530, Lenon Instruments Co., Ltd., Taichung, Taiwan) at 120 rpm and 30 °C.

3.2. Nutrient Medium

All the chemicals of analytical grade used were obtained from Sigma Aldrich Ltd., Germany. Test solutions of phenol, SA, and 4-CP were diluted by 1000 mg/L stock solutions. The mineral salt medium comprised the following components [20]: 4360 mg/L K2HPO4; 3450 mg/L NaH2PO4; 1000 mg/L NH4Cl; 1 mg/L CoCl2·2H2O; 36 mg/L CaCl2·2H2O; 5.56 mg/L FeSO4·7H2O; 1 mg/L MnCl2·4H2O; 0.2 mg/L (NH4)Mo7O24·4H2O; 190 mg/L KH2PO4; 500 mg/L NaNO3; and 500 mg/L (NH4)2SO4. The trace mineral solution contained: 500 mg/L MnSO4·H2O; 100 mg/L CoCl2·6H2O; 100 mg/L CaCl2; 100 mg/L ZnSO4·7H2O; 10 mg/L CuSO4·5H2O; 10 mg/L H3BO3; 10 mg/L Na2MoO4·2H2O; and 10 mg/L Alk(SO4)2·12H2O [33]. A 10 mL trace mineral solution was added into each run of the batch and chemostat tests. The mineral salt medium and Erlenmeyer flasks with caps were autoclaved at 121 °C for 30 min for sterilization before use.

3.3. Batch Experiments

Eight batch experiments for the biodegradation of phenol or SA by cell growth, were conducted first to evaluate the kinetic constants for single substrate utilization. The nominal initial concentrations of phenol and SA ranged from 35 to 600 mg/L, respectively. The initial cell concentrations for phenol and SA utilization ranged from 16.4 to 19.3 mg/L and 18.2 to 23.6 mg/L, respectively.
Furthermore, we investigated the simultaneous degradation of phenol and SA as well as the cell growth. The various initial phenol and SA concentrations were 80–454 and 158–235 mg/L, respectively, with initial cell concentrations of 19.0–34.7 mg/L. The kinetic interaction between phenol and SA was considered in the expression of the specific growth rate on binary inhibitory substrates of phenol and SA. The kinetic interaction parameters (IA1, IA2, IB1, and IB2) were determined by comparing the model-fitted specific growth rate with that of experimental results. Batch kinetic tests were also conducted using SA and 4-CP to examine the kinetic constants (md,CP, kCP, KS,CP, KI,CP, and ICP). The initial concentration of 4-CP ranged from 31 to 42 mg/L, while that of SA was maintained at 124 mg/L. The initial cell concentration was measured from 49.0 to 64.4 mg/L.

3.4. Chemostat Experiments

Two chemostats comprising of 24 L glass cylinders with a working volume of 15.68 L were used to evaluate the biodegradation of phenol plus SA, and SA plus 4-CP. The initial phenol and SA concentrations in the influent tank were 192 and 286 mg/L, respectively, and contained the mineral medium for cell growth. The initial influent concentrations of SA and 4-CP in the influent tank were 85 and 12 mg/L, respectively. A water jacket was designed to surround the reactor body for temperature control at 30 ± 0.1 °C using a circulating water bath. One air aquarium compressor connected with aerated stone was used to supply the air into the chemostat reactor at a rate of 2 gas volume per reactor volume per minute (VVM) [34]. The air bubble was sterilized with a 0.2 μm membrane filter before being sparged into the reactor. The influent flow rate was maintained at 627.2 mL/h to yield a dilution rate of 0.04 h−1.

3.5. Analytical Methods

To quantify phenol, SA, and 4-CP in the liquid samples, high-performance liquid chromatography-ultraviolet (HPLC-UV) instruments including an Alliance 2695 liquid chromatograph (Waters Co., Miford, MA, USA), a Waters 2707 auto-sampler, and a Waters 2487 UV/Vis detector were equipped and packed into a Symmetry® C18 column with a particle size of 5 μm [35]. A Millipore filter (0.22 μm) was applied to filter the liquid samples before the analysis of the phenol, SA, and 4-CP. The mobile phase comprising of potassium phosphate (50 mM) and acetonitrile (70/30, v/v) was applied to elute the phenol, SA, and 4-CP. The amounts of phenol, SA, and 4-CP were measured by setting the absorbance at 254 nm. The injection volume for each vial placed in the auto-sampler was set at 6 μm. Three calibration plots obtained from several given concentrations versus area were used to evaluate the phenol, SA, and 4-CP concentrations. The linear regression equations for phenol, SA, and 4-CP are as follows: phenol (mg/L) = 3 × 10⁻⁴ × (Area) + 2.4464, R2 = 0.9999; SA (mg/L) = 5 × 10⁻⁴ × (Area) − 0.7896, R2 = 0.9964; and 4-CP (mg/L) = 8 × 10⁻⁴ × (Area) − 3.3099, R2 = 0.9999. The calibration curve was obtained between the cell concentration and the absorbance (OD600) as follows: X (mg cell/L) = 357.83 × (OD600). A pH meter with a pH electrode (Model HI 9021, HANNA Instruments, Smithfield, RI, USA) was used to detect the pH value of the liquid samples.

4. Results and Discussion

4.1. Biodegradation of Single Phenol and SA

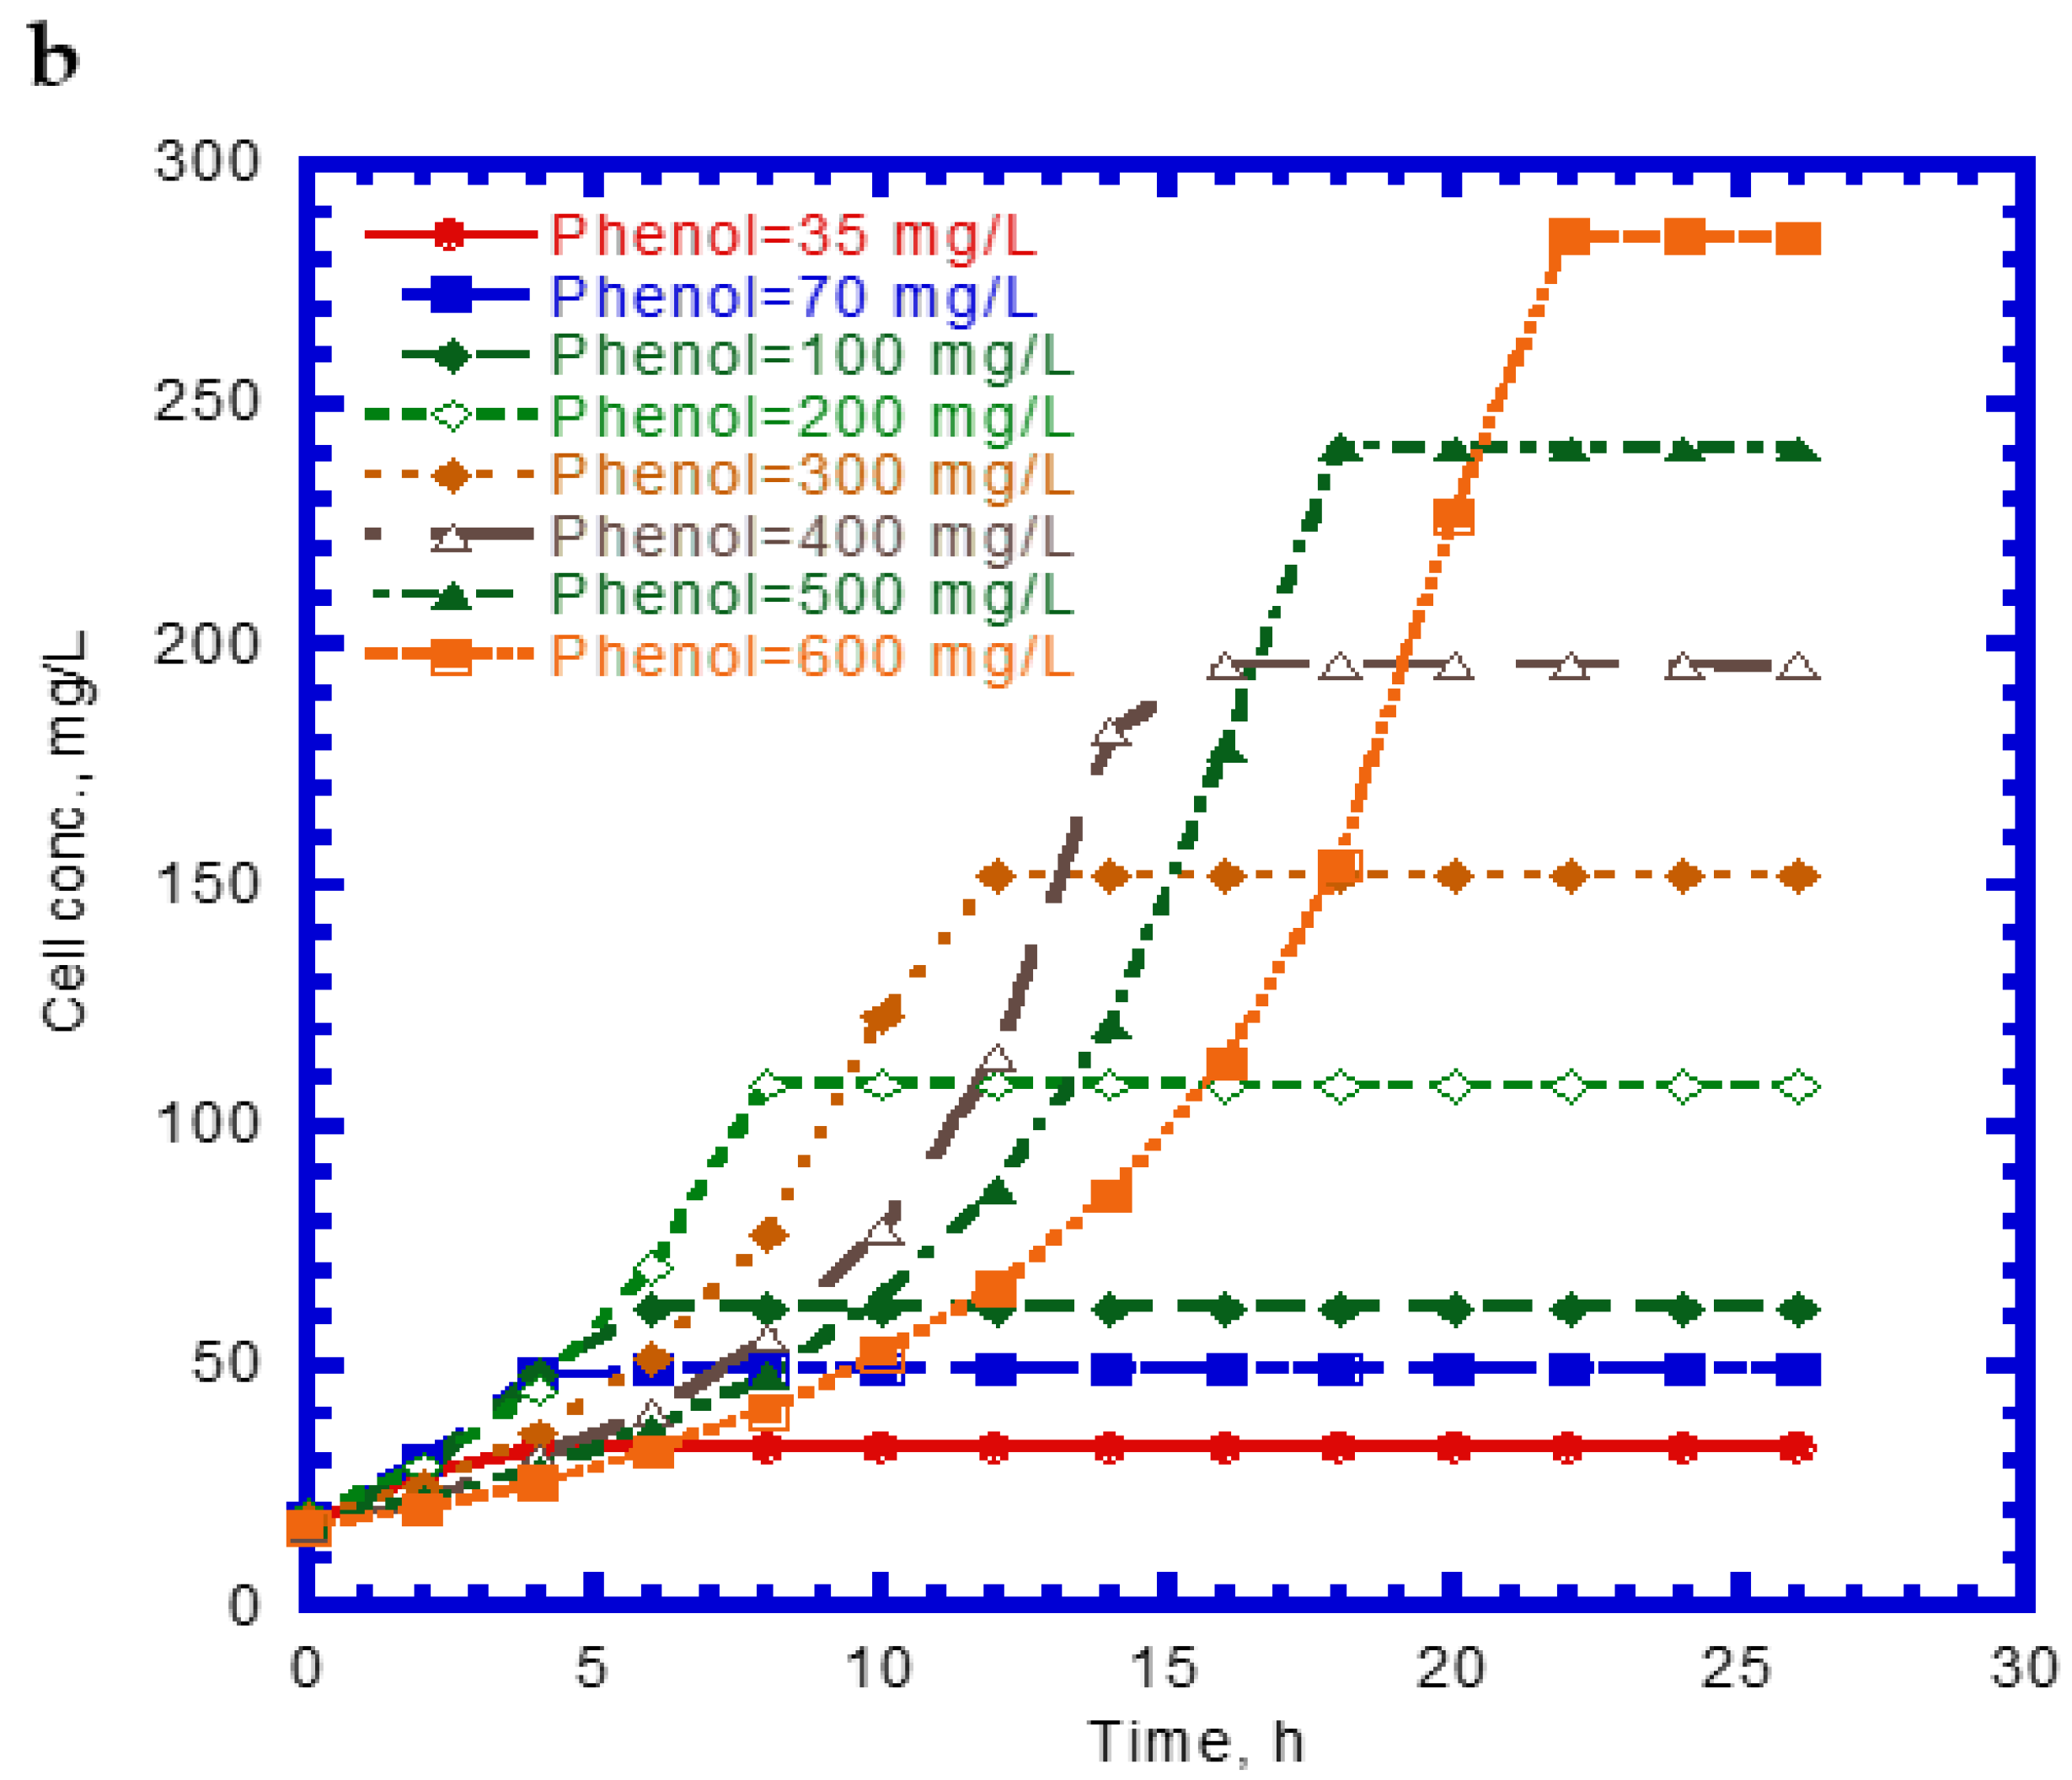
Figure 1 shows the single phenol biodegradation and cell growth as a function of time. No lag phase was found for the phenol biodegradation due to acclimation [33]. The phenol concentration steeply decreased with time at a lower initial nominal concentration in the batch experiments compared to those containing higher initial levels of phenol (Figure 1a). The elapsed time for the complete disappearance of phenol at various initial nominal concentrations of 35 to 600 mg/L ranged from 8 to 22 h. The phenol consumption rate at the onset of the batch experiments was longer with increasing initial nominal phenol concentrations. The variation of cell growth with time is shown in Figure 1b. The cell growth curves follow the log growth and stationary phases. The maximum value of the elapsed time for cell growth at the stationary phase under different initial nominal phenol concentrations ranged from 4 to 22 h. The endogenous phase in the cell growth curves was insignificant.
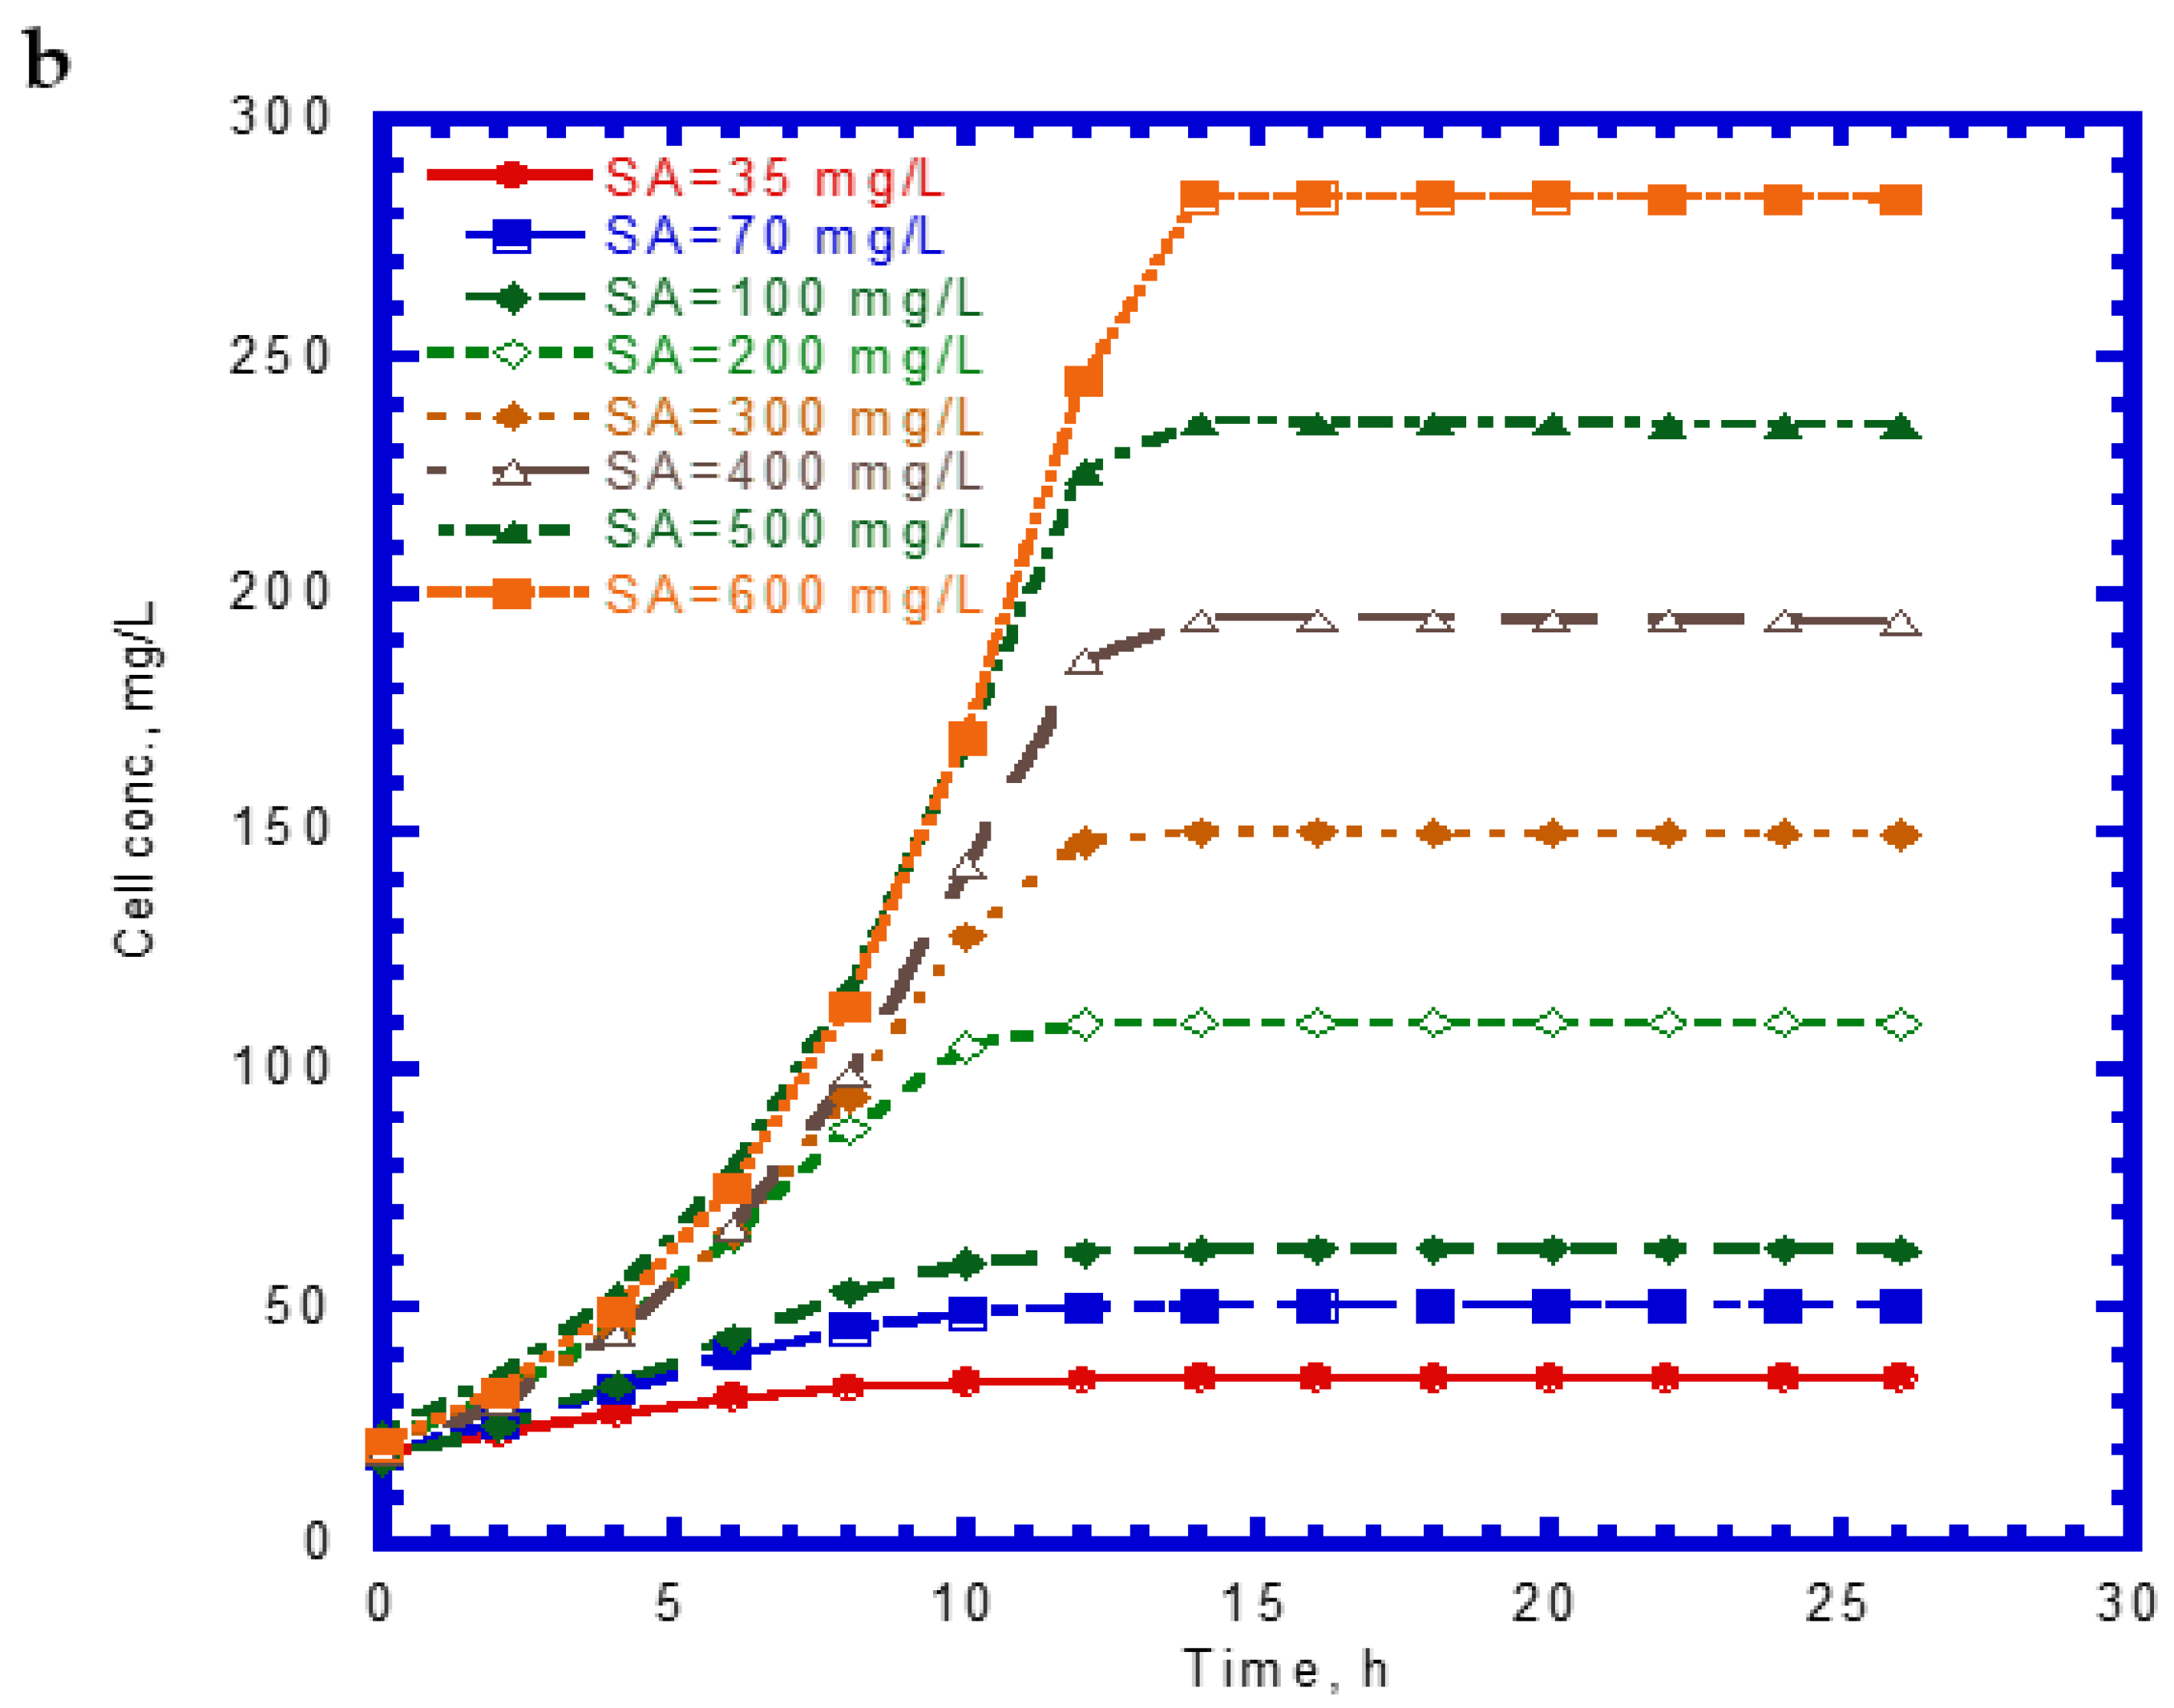
The time course of SA biodegradation and cell growth is shown in Figure 2. The biodegradation of SA started with no lag phase because of the cell acclimation [36]. We observed that the SA consumption rate at the beginning of the tests remained nearly the same. The elapsed time for the complete degradation of SA at different initial nominal SA concentrations (35–600 mg/L) was within 14 h (Figure 2a). The time required for the complete biodegradation of 1.25 mM of SA was below 13 h [24]. The cell growth during the biodegradation of SA also followed the log growth and stationary phases. The time required to achieve the maximum growth value was about 14 h at various initial nominal SA concentrations (Figure 2b). Comparing Figure 1a with Figure 2a, we found that the capacity for SA biodegradation was better than that for phenol biodegradation.

4.2. Cell Growth Kinetics on Single Phenol and SA

Figure 3 shows that the specific growth rates of the cells varied with different initial phenol and SA concentrations. The experimental results indicate that the cell growth would be inhibited above an initial phenol concentration of 120 mg/L (Figure 3a). However, no inhibition of cell growth occurred under different initial SA concentrations (Figure 3b). Notably, the cell growth on phenol was more inhibited than that on SA under the studied conditions (Figure 3a,b). The Haldane cell growth kinetics model was widely applied to evaluate the kinetic constants containing the maximum specific growth rate (μm), half-saturation constant of the substrate (KS), and self-inhibition constant of the substrate (KI). The experimental results of the specific growth rate were obtained from the log growth phase under initial nominal phenol and SA concentrations. The Haldane cell growth kinetic model was fitted to the experimental data using the “Solver” function in Microsoft Excel 2016 by minimizing the sum of square error (SSE). The Haldane cell growth kinetic model was expressed by the following equations for single phenol and SA, respectively:
μ P = 0.423 S P 48.1 + S P + S P 2 / 272.5
μ A = 0.247 S A 71.1 + S A + S A 2 / 3178.2
The μm,P value (0.423 h−1) for cell growth within the literature report ranging from 0.33 to 0.57 h−1 [37]. However, the present KS,P value (48.1 mg/L) was greater that the literature ranges of 1.03–18.5 mg/L owing to the different nutrient medium used in the batch tests [37]. The KI,P value (272.5 mg/L) falls within the literature ranges of 54.5–903.3 mg/L [37]. Notably, SA was degraded more rapidly than phenol by the P. putida cells because it has a much larger KI value than phenol, which make the cells less sensitive to substrate inhibition. This result is consistent with that reported by Wang and Loh [33] who evaluated the batch cultures of P. putida ATCC 49451 in a medium for the degradation of single phenol and sodium glutamate (SG). Their experimental data were fitted by Haldane kinetics to determine the kinetic constants (μm, KS, and KI). The KI values for phenol and SG were 284.3 and 14,560 mg/L, respectively. The KI value for phenol obtained here (272.5 mg/L) was comparable to that in their study.

4.3. Cell Growth on Binary Substrates of Phenol and SA

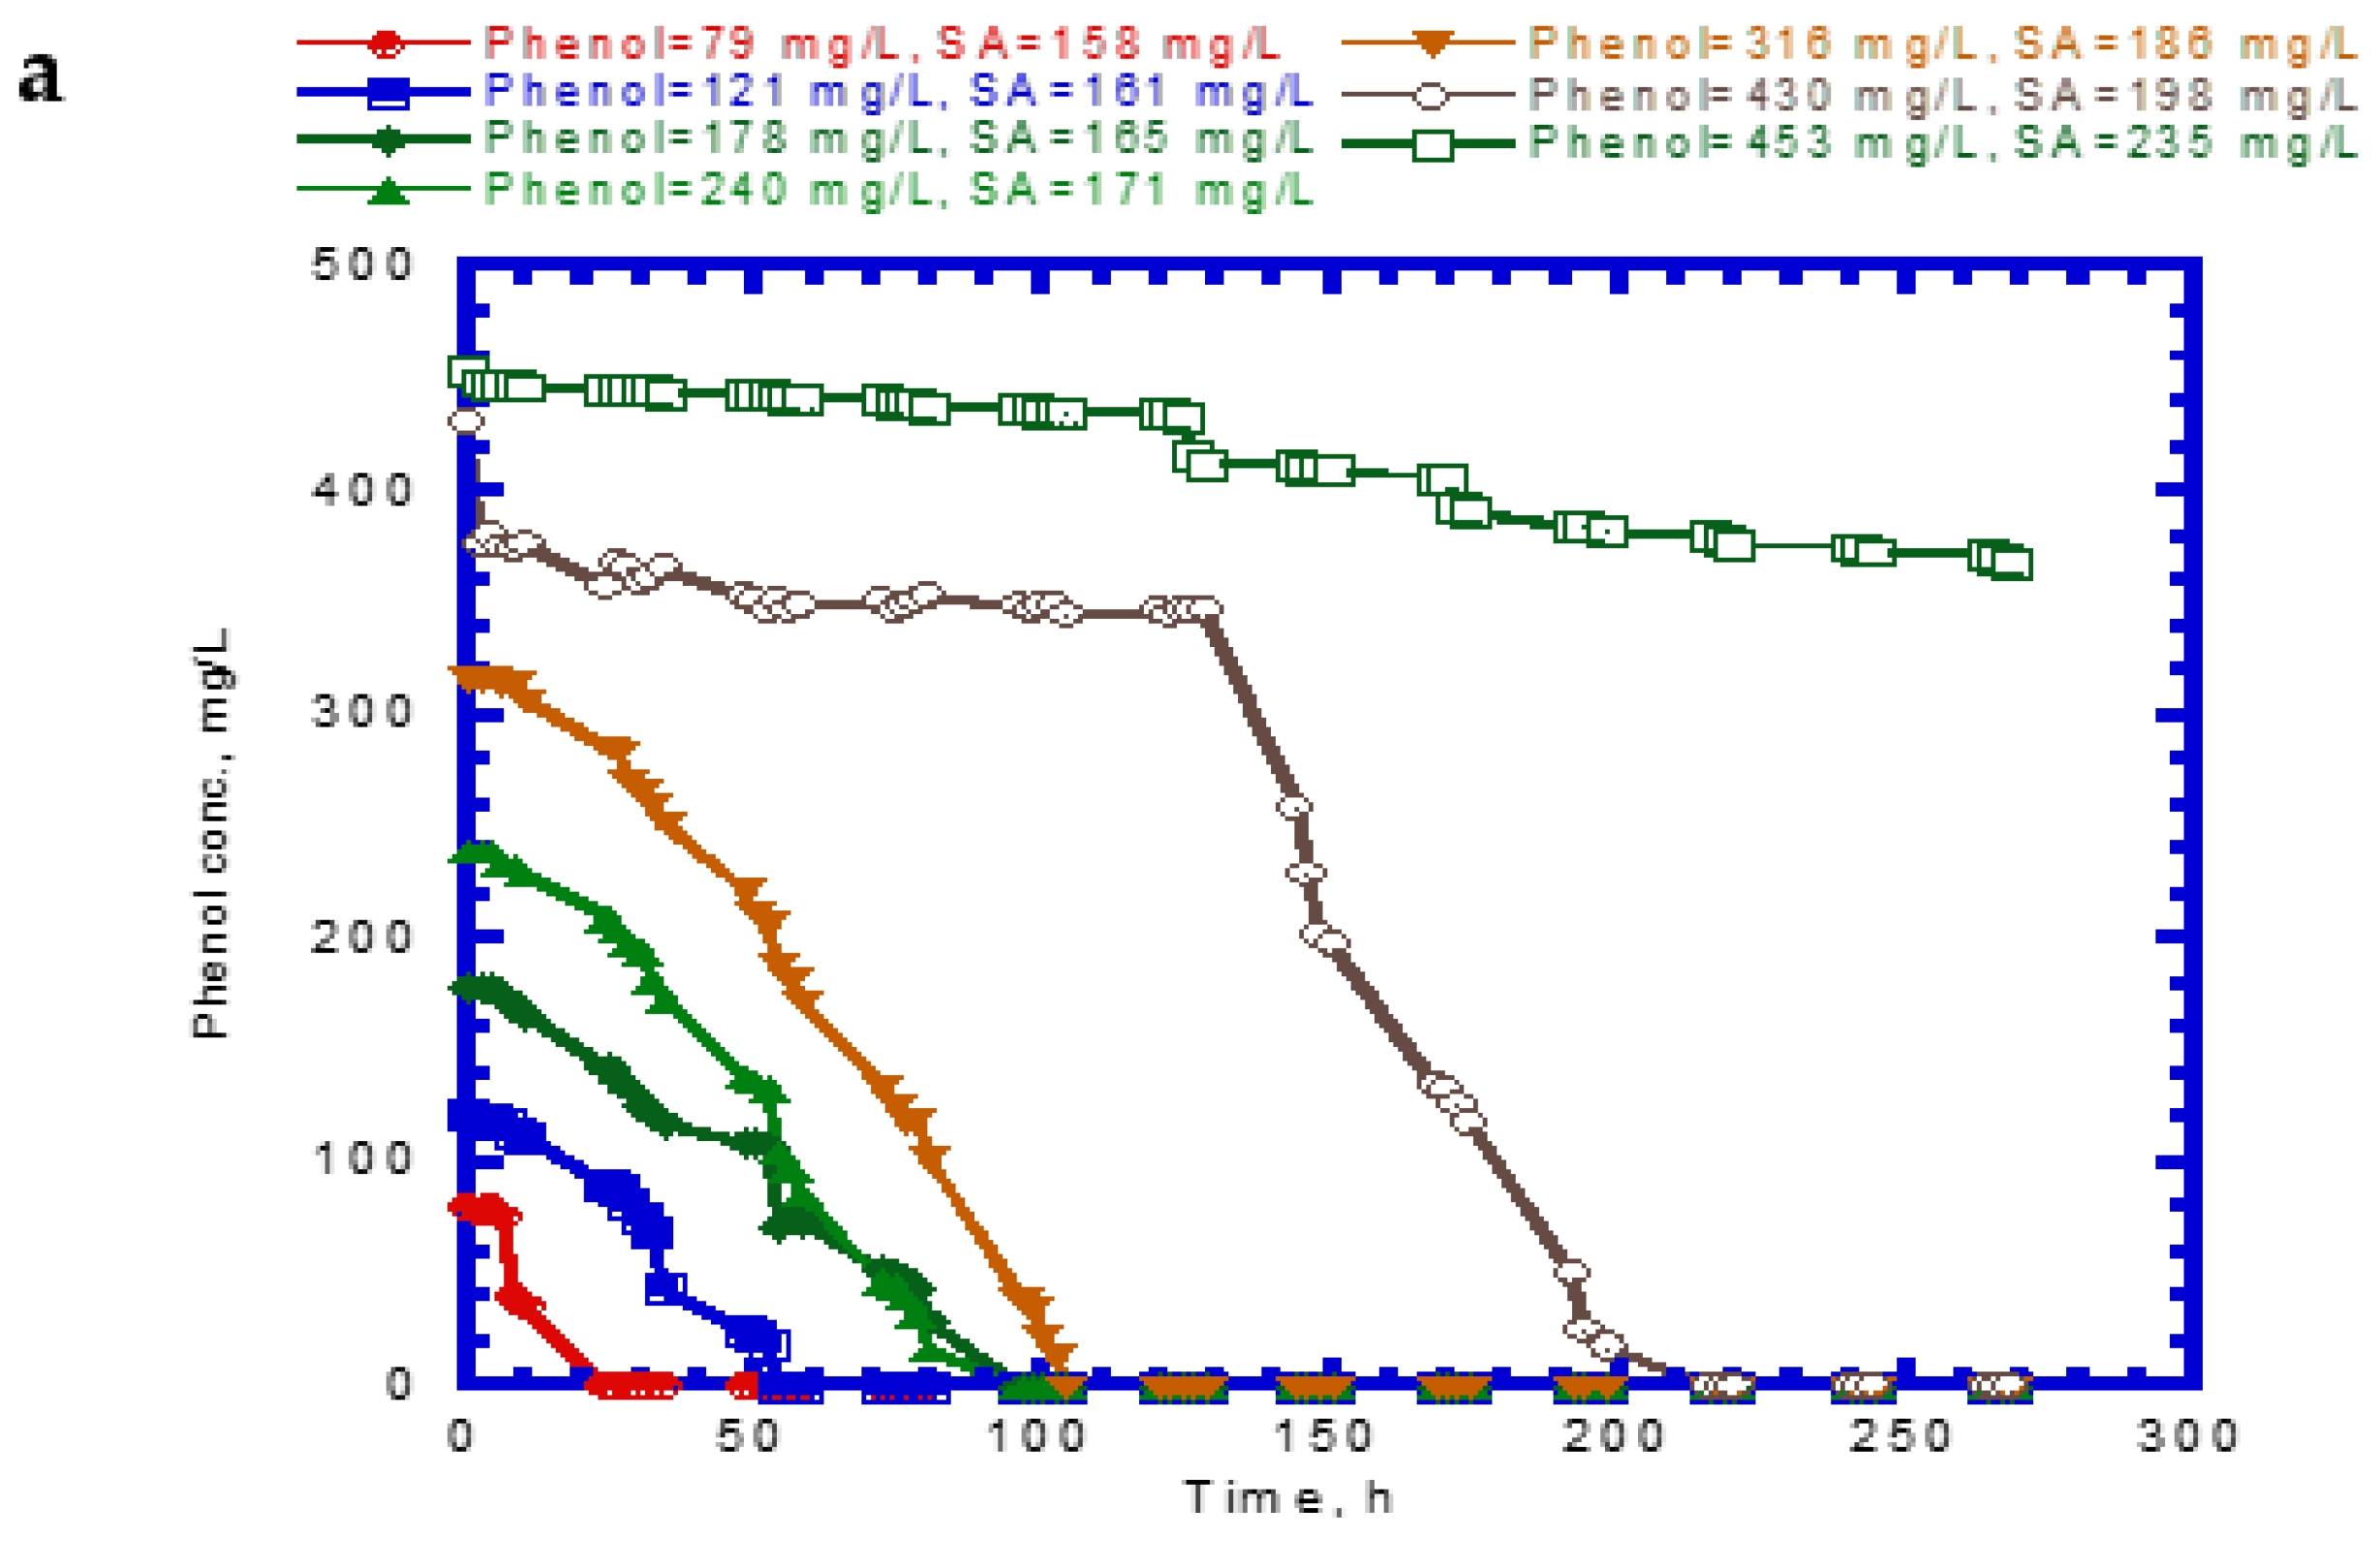
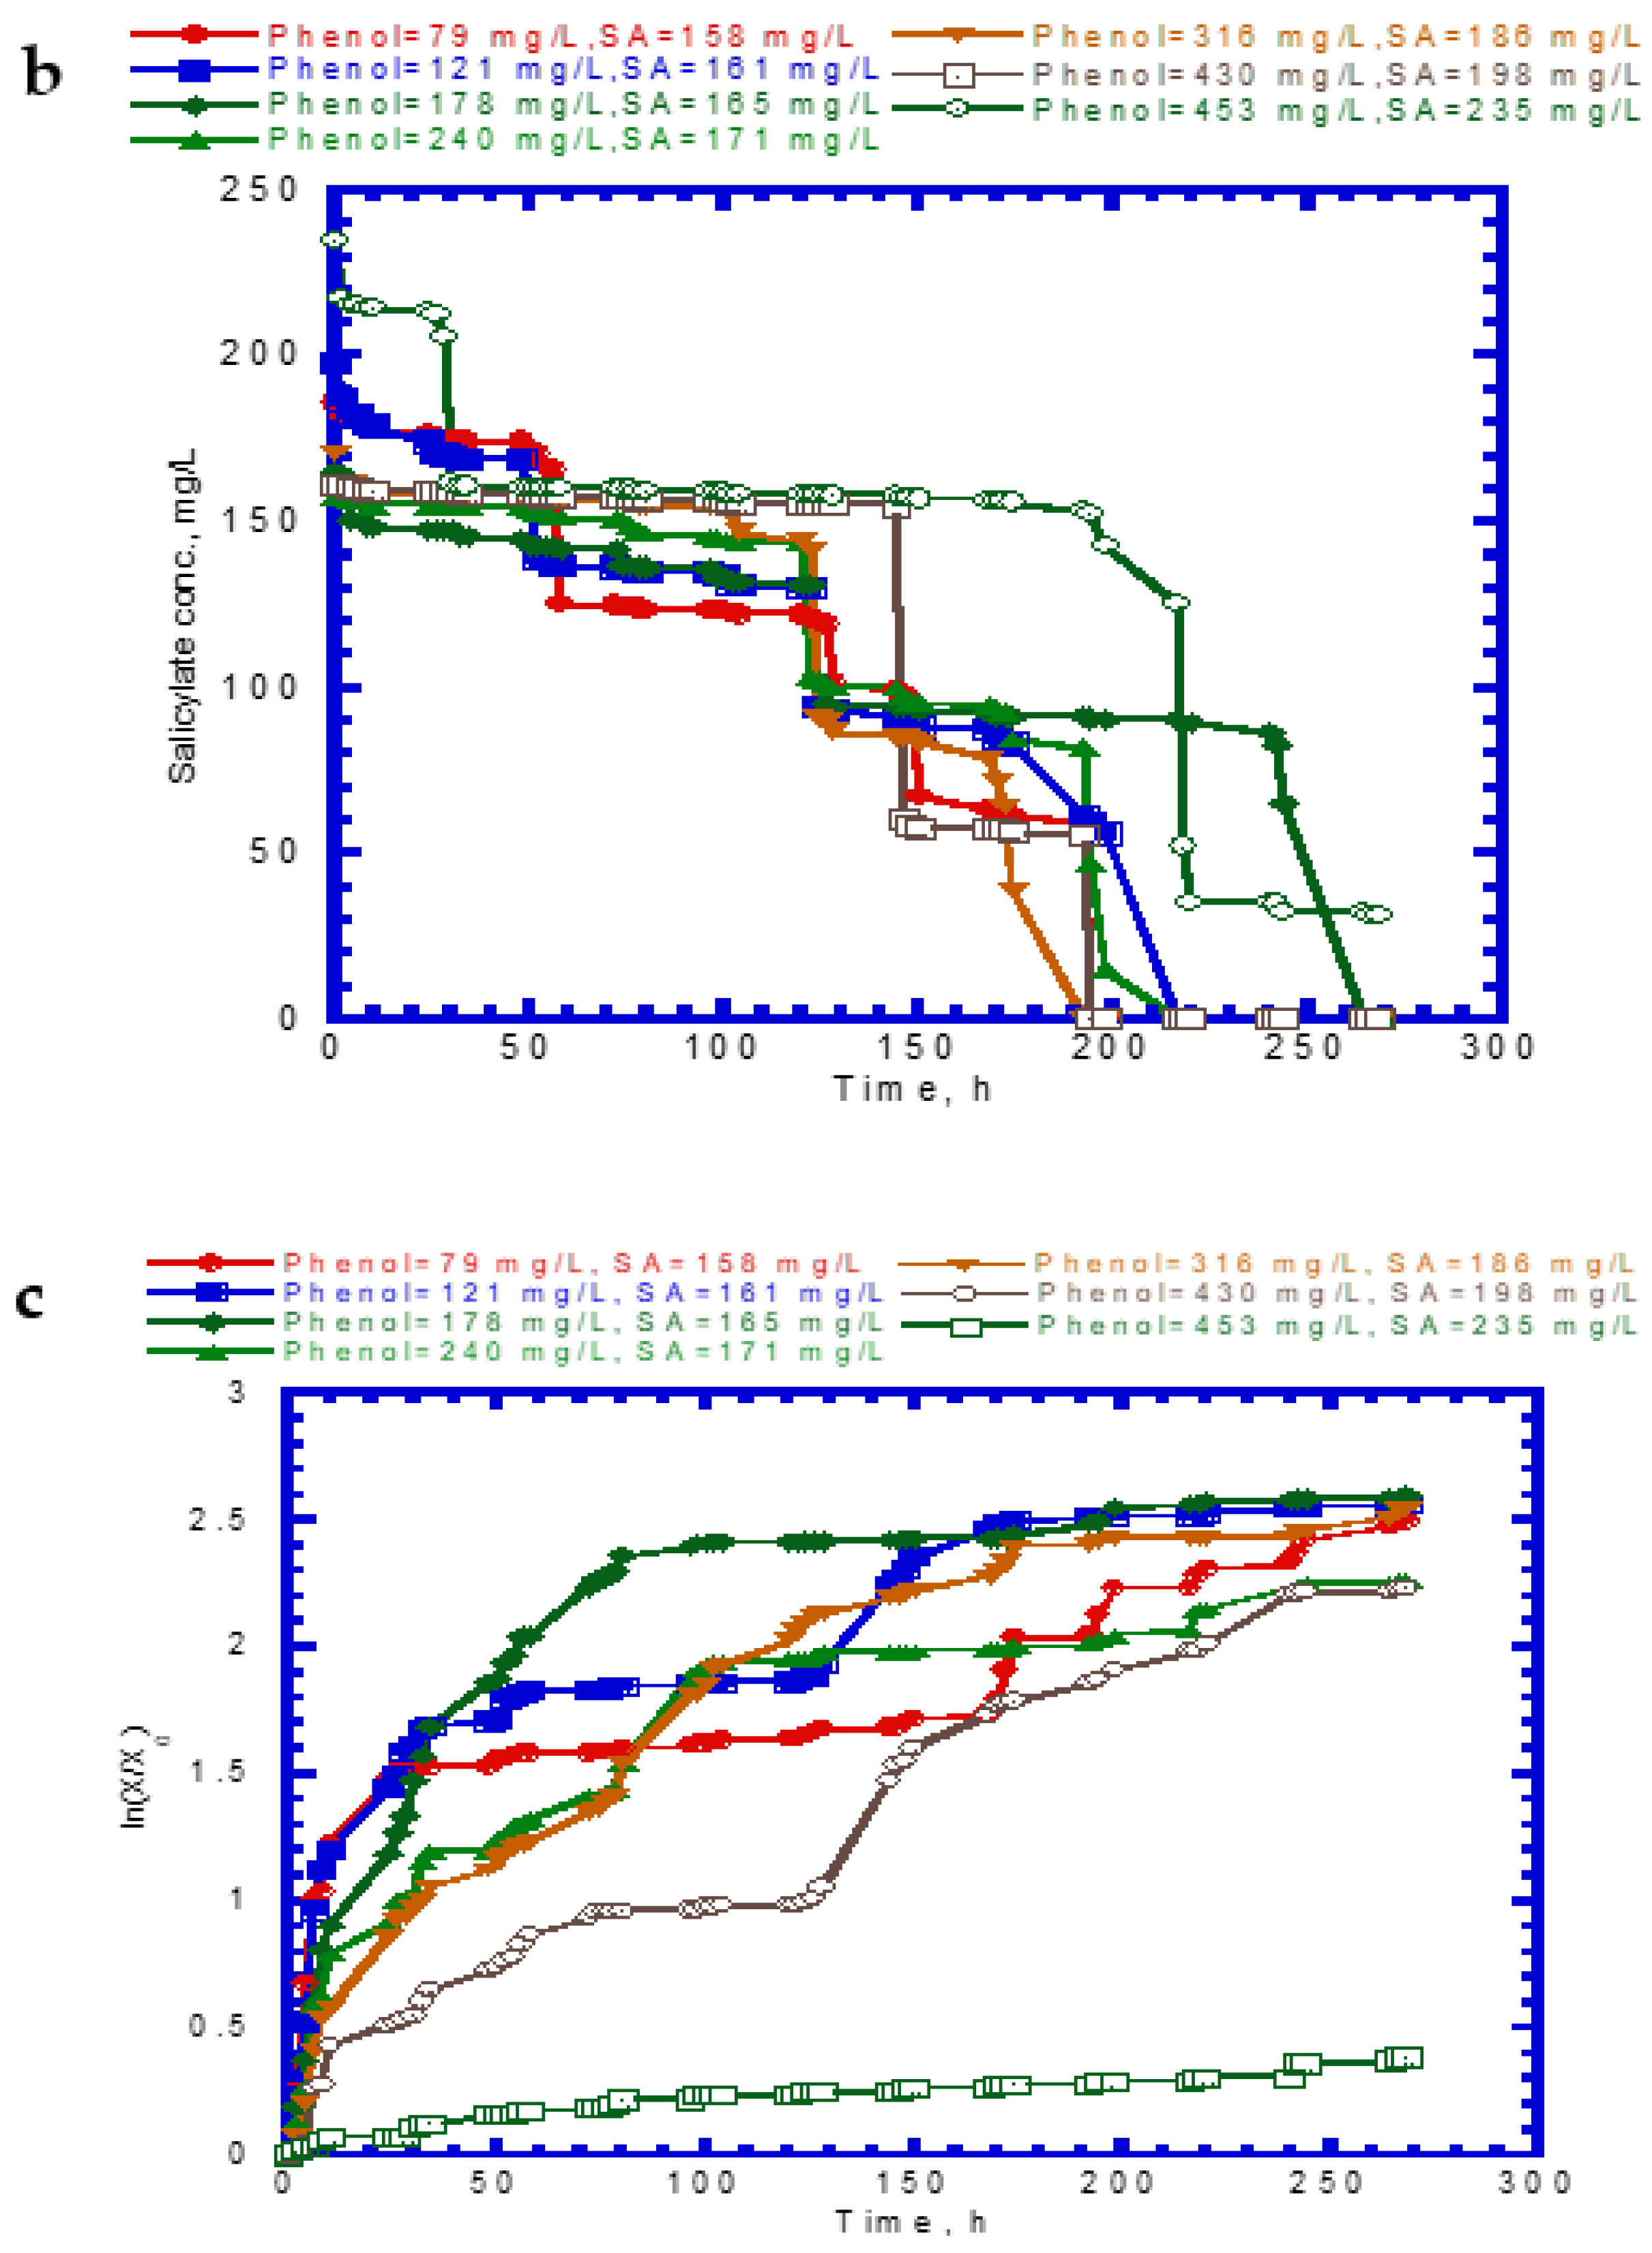
Figure 4 shows the results of phenol and SA biodegradation along with cell growth at different initial phenol and SA concentrations. Figure 4a indicates that phenol is completely removed after 216 h under initial phenol and SA concentrations of 79–430 and 158–198 mg/L, respectively. However, the phenol degradation rate was unsatisfactory, at only 18.7% after 268 h. The lag phase of phenol degradation was clearly observed at initial phenol and SA contents of >430 mg/L and >198 mg/L, respectively. Figure 4b plots the time course of SA degradation. Notably, several lag phases for the complete degradation of SA were observed during the overall operation time. The complete removal of SA was observed from 194 to 264 h at initial phenol and SA concentrations of 79–430 and 158–198 mg/L, respectively. A removal efficiency of only 86.6% was achieved at initial phenol and SA concentrations of 453 and 235 mg/L, respectively. The variation of cell growth with time is shown in Figure 4c. The cell growth was significantly inhibited by the high initial phenol and SA concentrations of 453 and 235 mg/L. We observed a biphasic growth pattern when the initial phenol and SA concentrations were maintained at 121–430 and 161–198 mg/L, respectively. Figure 5 shows the specific growth rate of cells on dual substrates of phenol and SA. A good agreement between the combined Haldane kinetic model and the experimental data was achieved with an SSR value of 2.916 × 10⁻³ (Figure 5). Based on the comparison of experimental results of the overall specific growth rate with the combined Haldane kinetics of phenol and SA, the kinetic constants (IA1, IA2, IB1, and IB2) were determined by minimizing the SSR using the “Solver” function in Microsoft Excel. The best fit kinetic model can be represented as
μ X = 0.423 S P 48.1 + S P + S P 2 / 272.5 + 0.32 S A + 1.51 S P S A + 0.427 S A 71.1 + S A + S A 2 / 3178.2 + 0.14 S P + 6.6 × 10 3 S A S P
Juang and Tsai [20] conducted batch experiments to determine the interaction parameters values of IA1, IB1, IA2, and IB2 in the binary substrates system of phenol and SA. The best-fit values of IA1, IB1, IA2, and IB2 obtained in their study were 0.277, 1.46, 0.126, and 0.509, respectively, which is close to those found in this study except for the IB2 value. In this study, the value of IB1 (1.51) is considerably larger than that of IB2 (6.6 × 10⁻³), implying that the inhibition of phenol biodegradation by SA was much higher than that of SA biodegradation by phenol. Moreover, the ratio of IA1 to IA2 is 2.3, indicating that SA has a higher uncompetitive inhibition on phenol biodegradation compared to that of phenol on SA biodegradation in the binary substrate system [20].

4.4. Biodegradation of Binary Substrates of SA and 4-CP

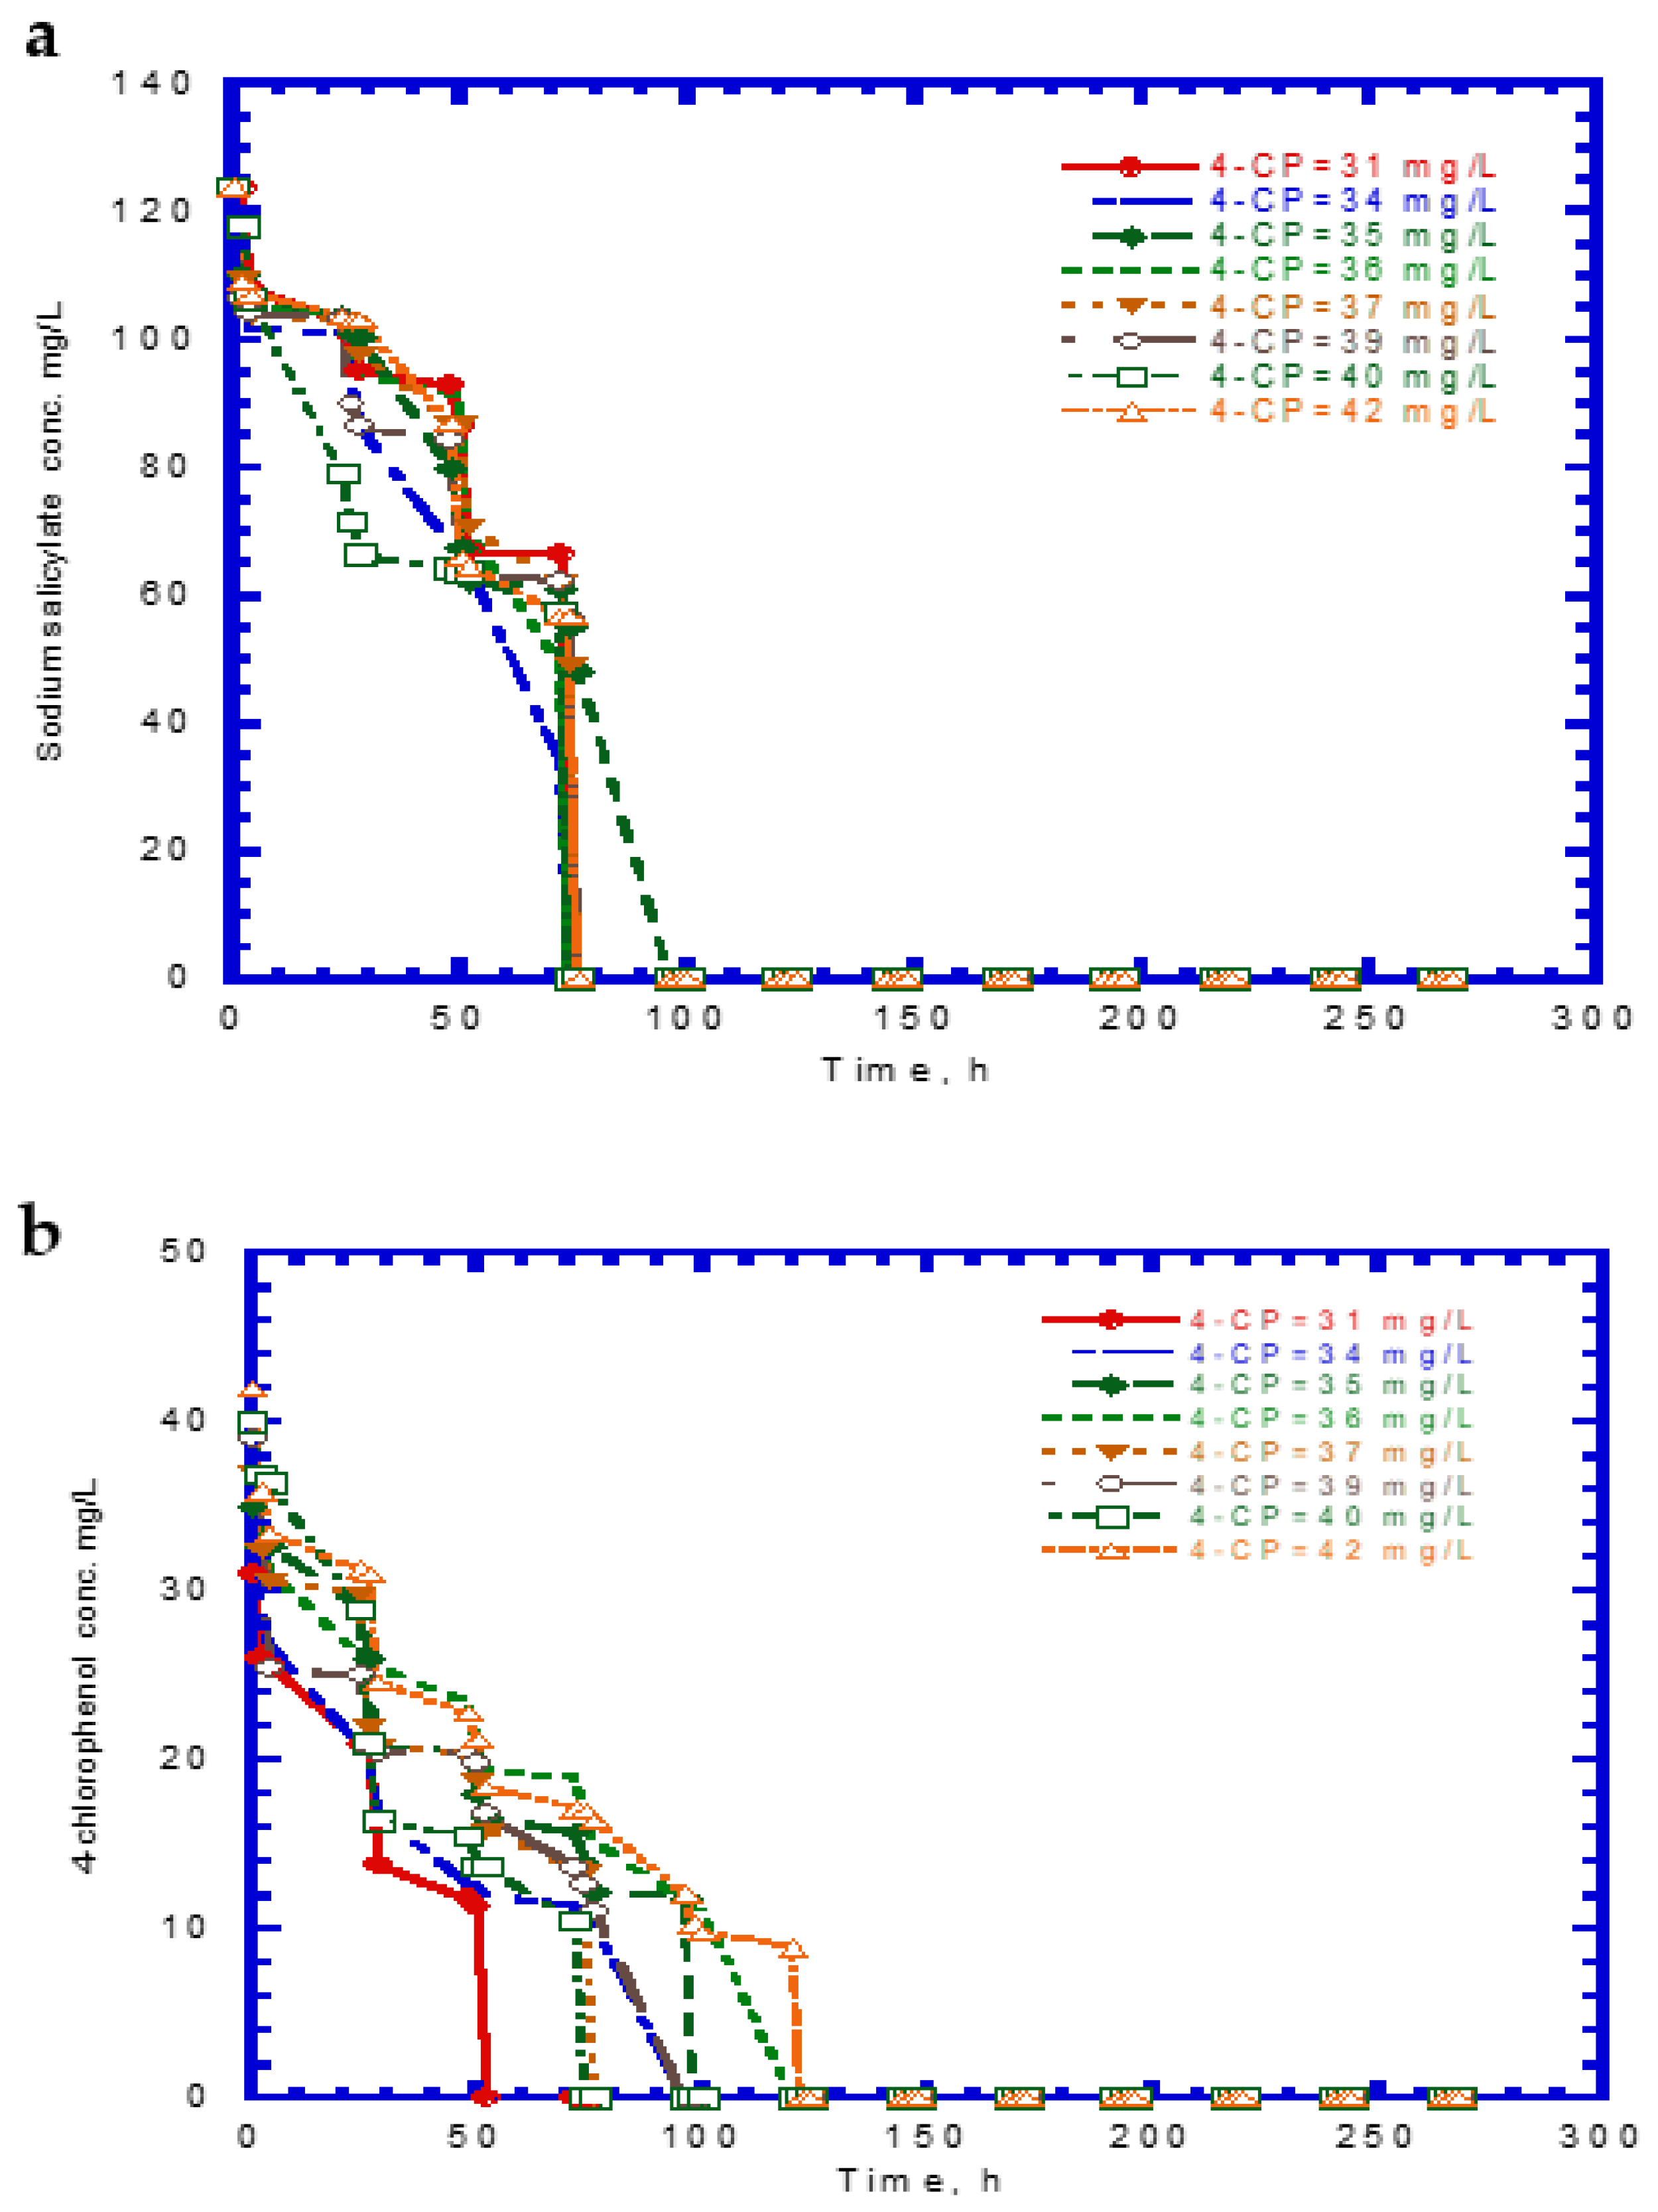
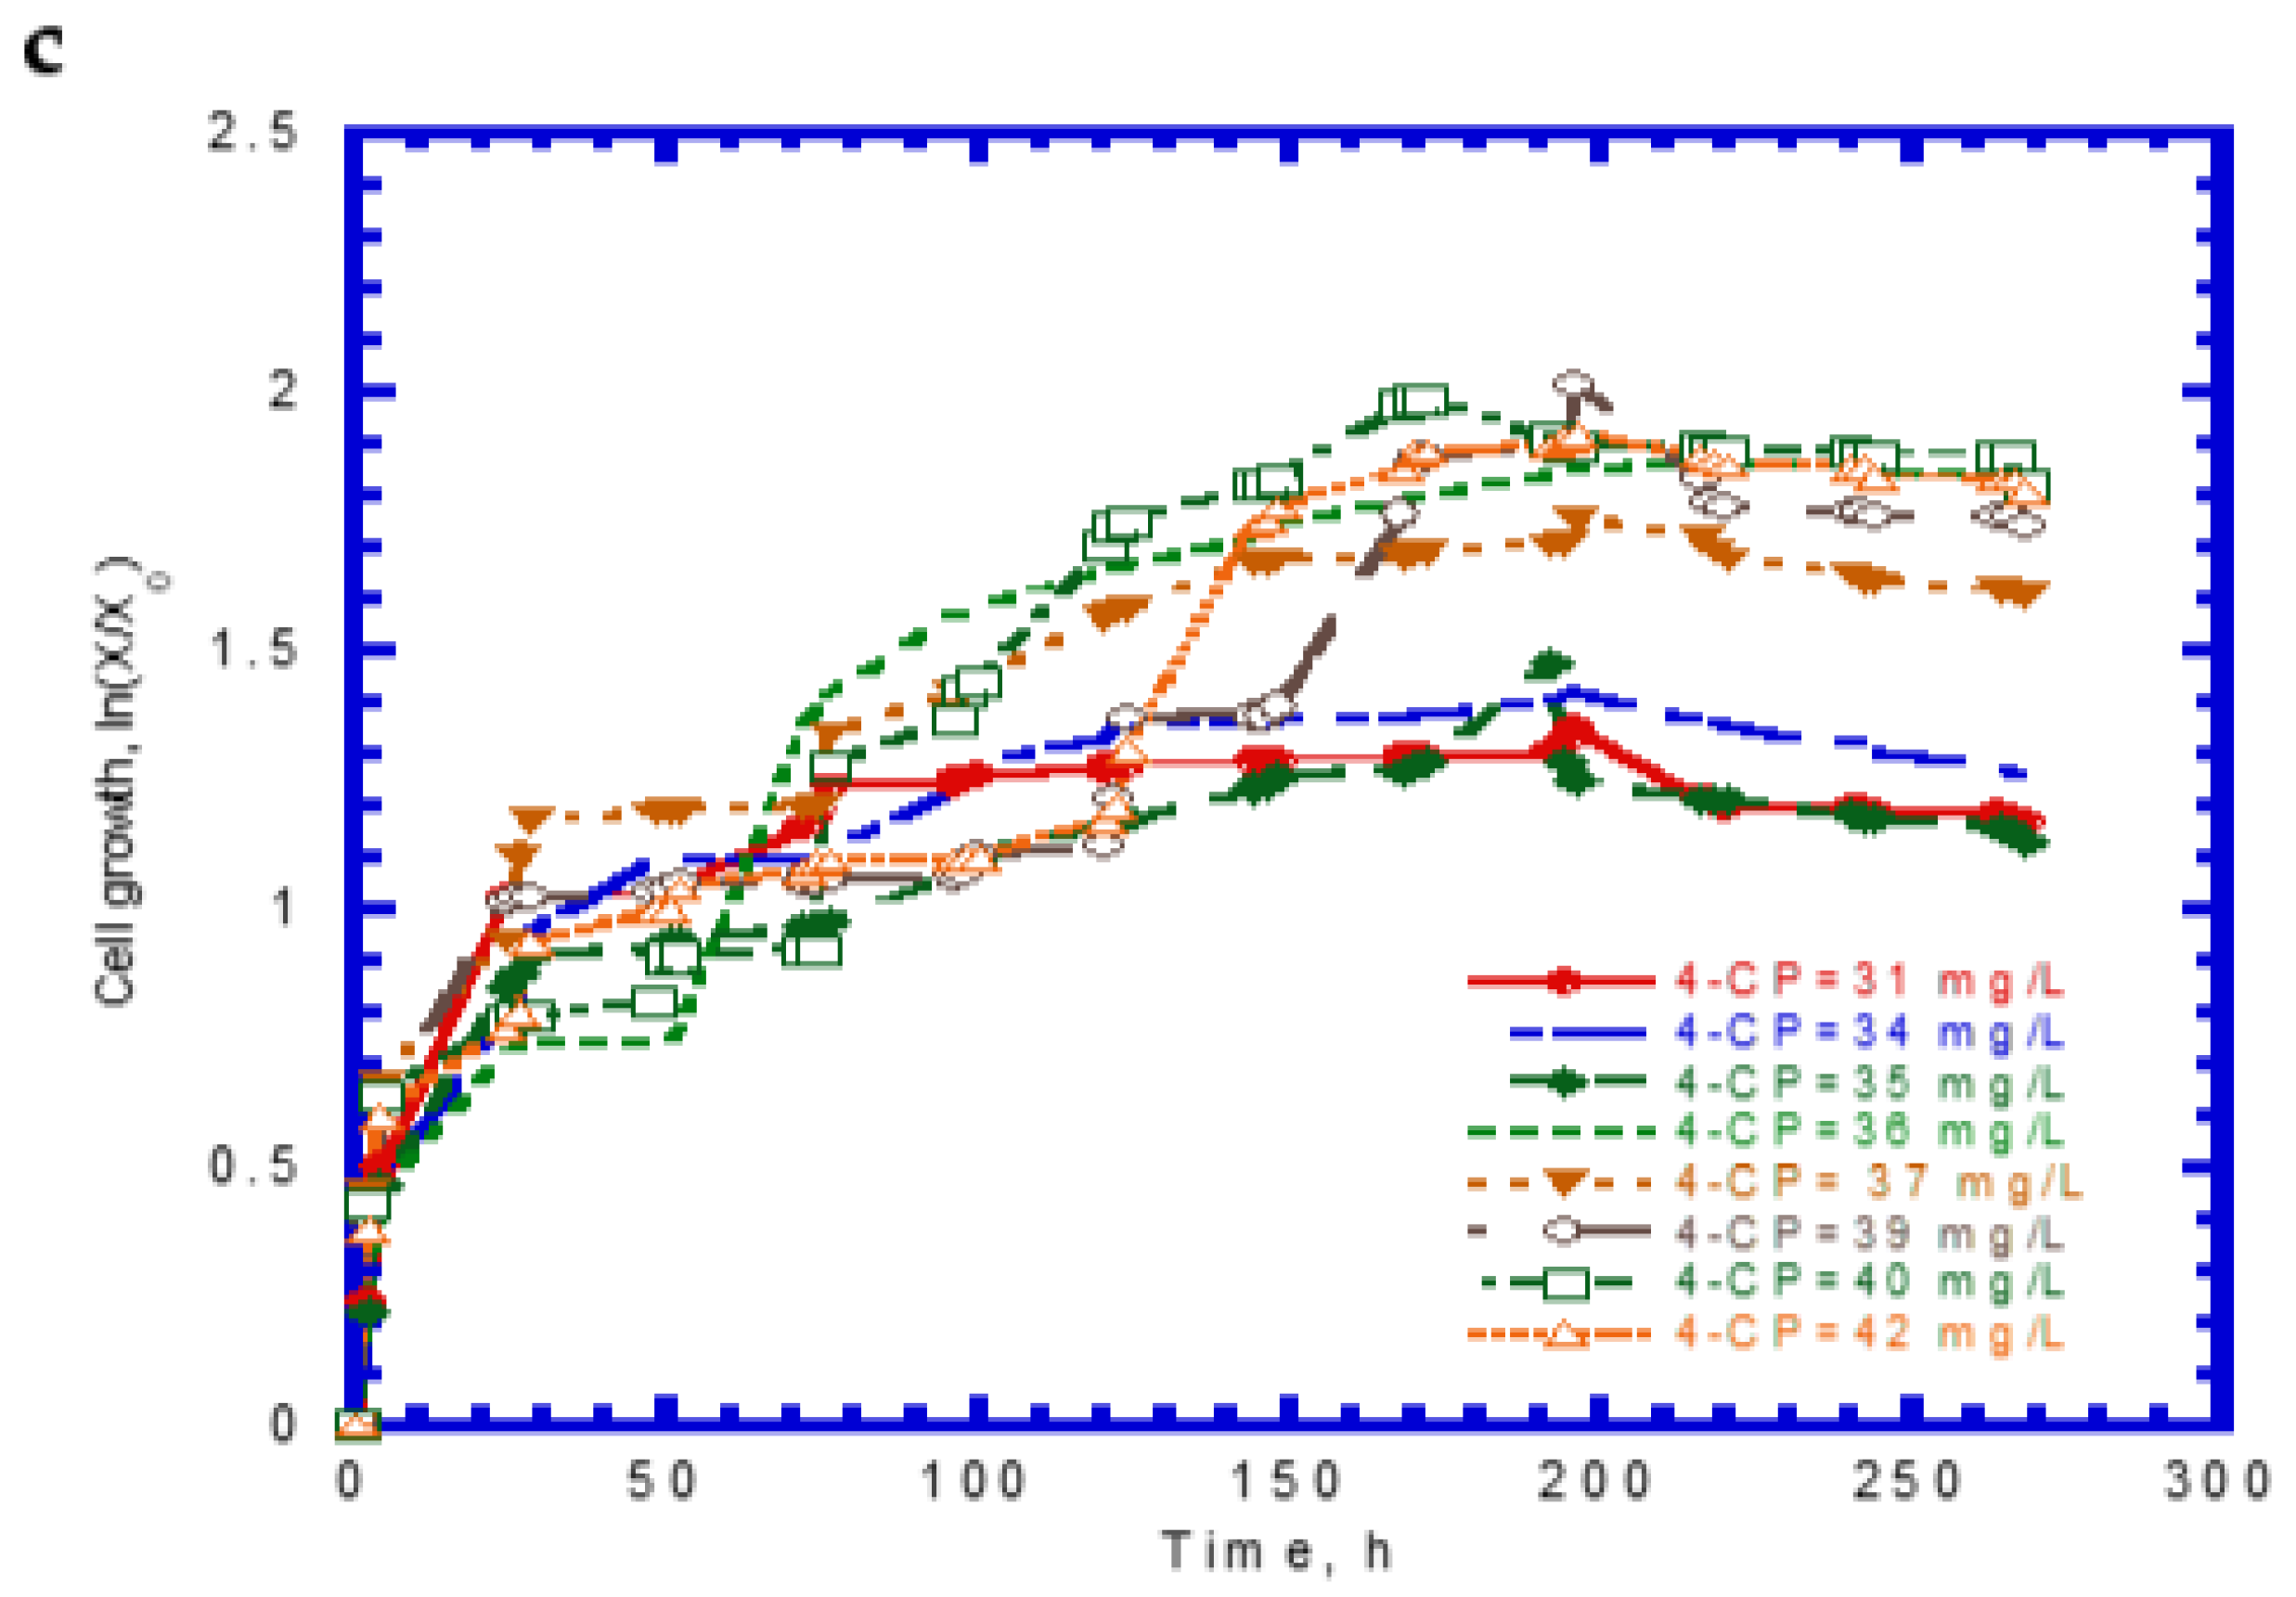
The experimental results of cell growth on SA alone were used to determine the kd,A value (Figure 2b). The kd,A value can be evaluated from the slope of a linearized plot of ln (X/X0) against time in the endogenous stage even though the decay rate value was considerably small. The kd,A value obtained from eight test runs was 1.64 × 10⁻⁴ ± 2.15 × 10⁻⁵. Eight batch experiments were conducted using initial 4-CP contents ranging from 31–42 mg/L, while the initial SA content was maintained at 124 mg/L. The variations of SA, 4-CP, and cell growth are shown in Figure 6. The degradation of SA and 4-CP presented several intermediate lag phases during the time course because the 4-CP toxicity caused the inhibition of cell growth. The complete removal of SA was achieved in the time range of 74–96 h (Figure 6a). The time required for the complete degradation of 4-CP was 52–122 h at various initial 4-CP contents (Figure 6b). The time course of cell growth followed the log growth, intermediate lag phase, log growth phase, stationary phase, and endogenous phase (Figure 6c). The intermediate lag phase for cell growth was long (about 30 h). The biphasic growth observed from the experimental results was consistent with that reported by Wang et al. [23], who used phenol and SA as the growth substrates to cometabolize 4-CP.
The cell growth kinetics of SA in the presence of 4-CP was expressed by Equation (9). Using previously evaluated kinetic constants (μm,A, KS,A, KI,A, and kd,A) from batch tests, the only undetermined kinetic constant, md,CP, obtained from the model fitted to the experimental results shown in the Figure 7 was 6.11 L/mg. Thus, Equation (9) can be written as:
μ A = 0.247 S A 71.1 + S A + S A 2 / 3178.2 1.64 × 10 4 ( 1 + 6.11 S C P )
Loh and Yu [24] investigated carbazole degradation by P. putida ATCC 17484 in the presence of SA. The decay constant (md), due to carbazole toxicity, was found to be 7.61 L/mg, which was close to that obtained in this study.
The specific degradation rate of SA described in Equation (12) was used to determine the value of ICP. The maximum specific degradation rate of SA (kA) was evaluated from the eight batch experiments on single SA. The kinetic constants (μm,A, and YA) obtained from each run were used to determine the kA using Equation (4). The average values for μm,A and YA are 0.247 h−1 and 0.438 ± 0.0058 mg cell/mg SA, respectively. The kA value is 0.564 mg SA/mg cell-h. Therefore, the average value for ICP is 0.355 ± 0.0779 mg/L.
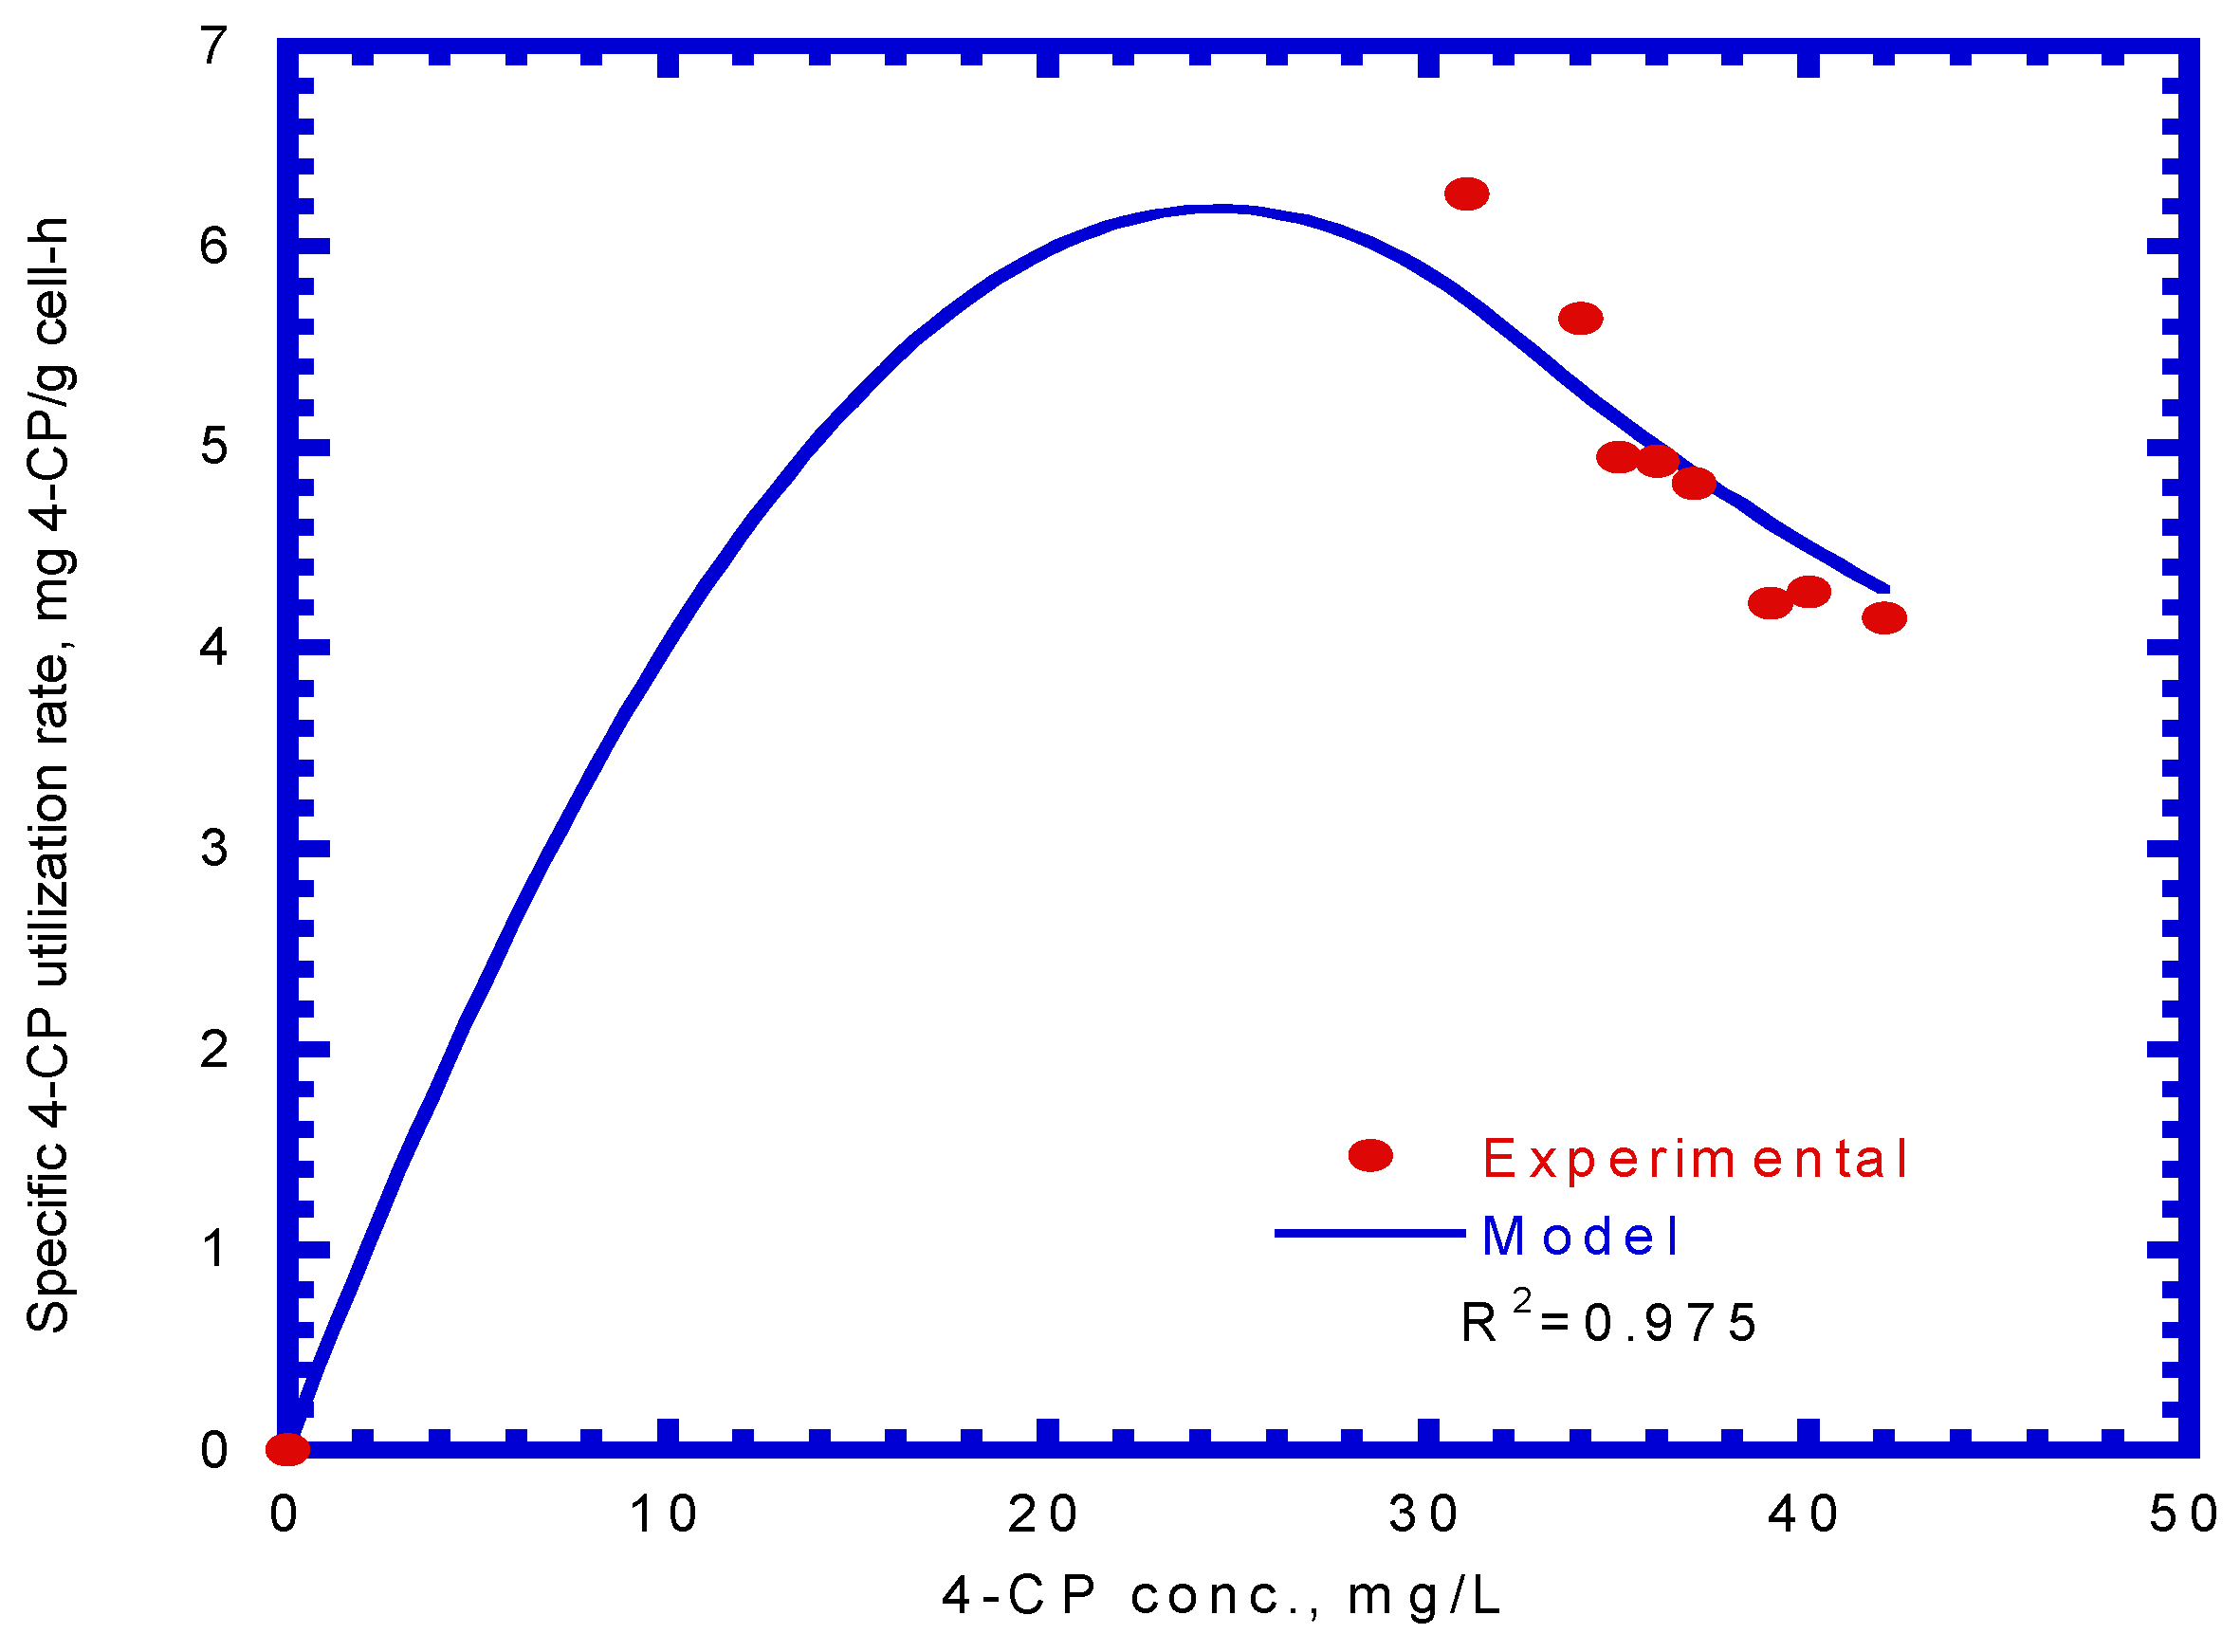
The specific degradation rate of 4-CP by P. putida cells was expressed by Equation (13). By comparing the experimental data with a kinetic model using a non-linear least square regression method from Figure 8, the kinetic constants, kCP, KS,CP, and KI,CP, were evaluated to be 0.189 mg 4-CP/mg cell-h, 1.106 mg/L, and 0.977 mg/L, respectively. Therefore, the resulting kinetic model is expressed as
q C P = d S C P X d t = 0.189 S C P 1.106 + S C P + S C P 2 / 0.977
The value of the correlation coefficient (R2) was 0.975. Hao et al. [38] used the Haldane kinetic model to describe the 4-CP inhibition on its transformation using the resting cells of the Acinetobacter species. The Haldane model was fitted to the experimental results to evaluate the values of kCP, KS,CP, and KI,CP (Equation (13)), which were 0.15 mg 4-CP/mg cell-h, 0.15 mg 4-CP/L, and 60 mg 4-CP/L, respectively, in their study. Only the kCP value was close to that obtained in this study because different cells species and nutrient media result in different kinetic values.

4.5. Biodegradation of Ternary Substrates of SA, Phenol, and 4-CP

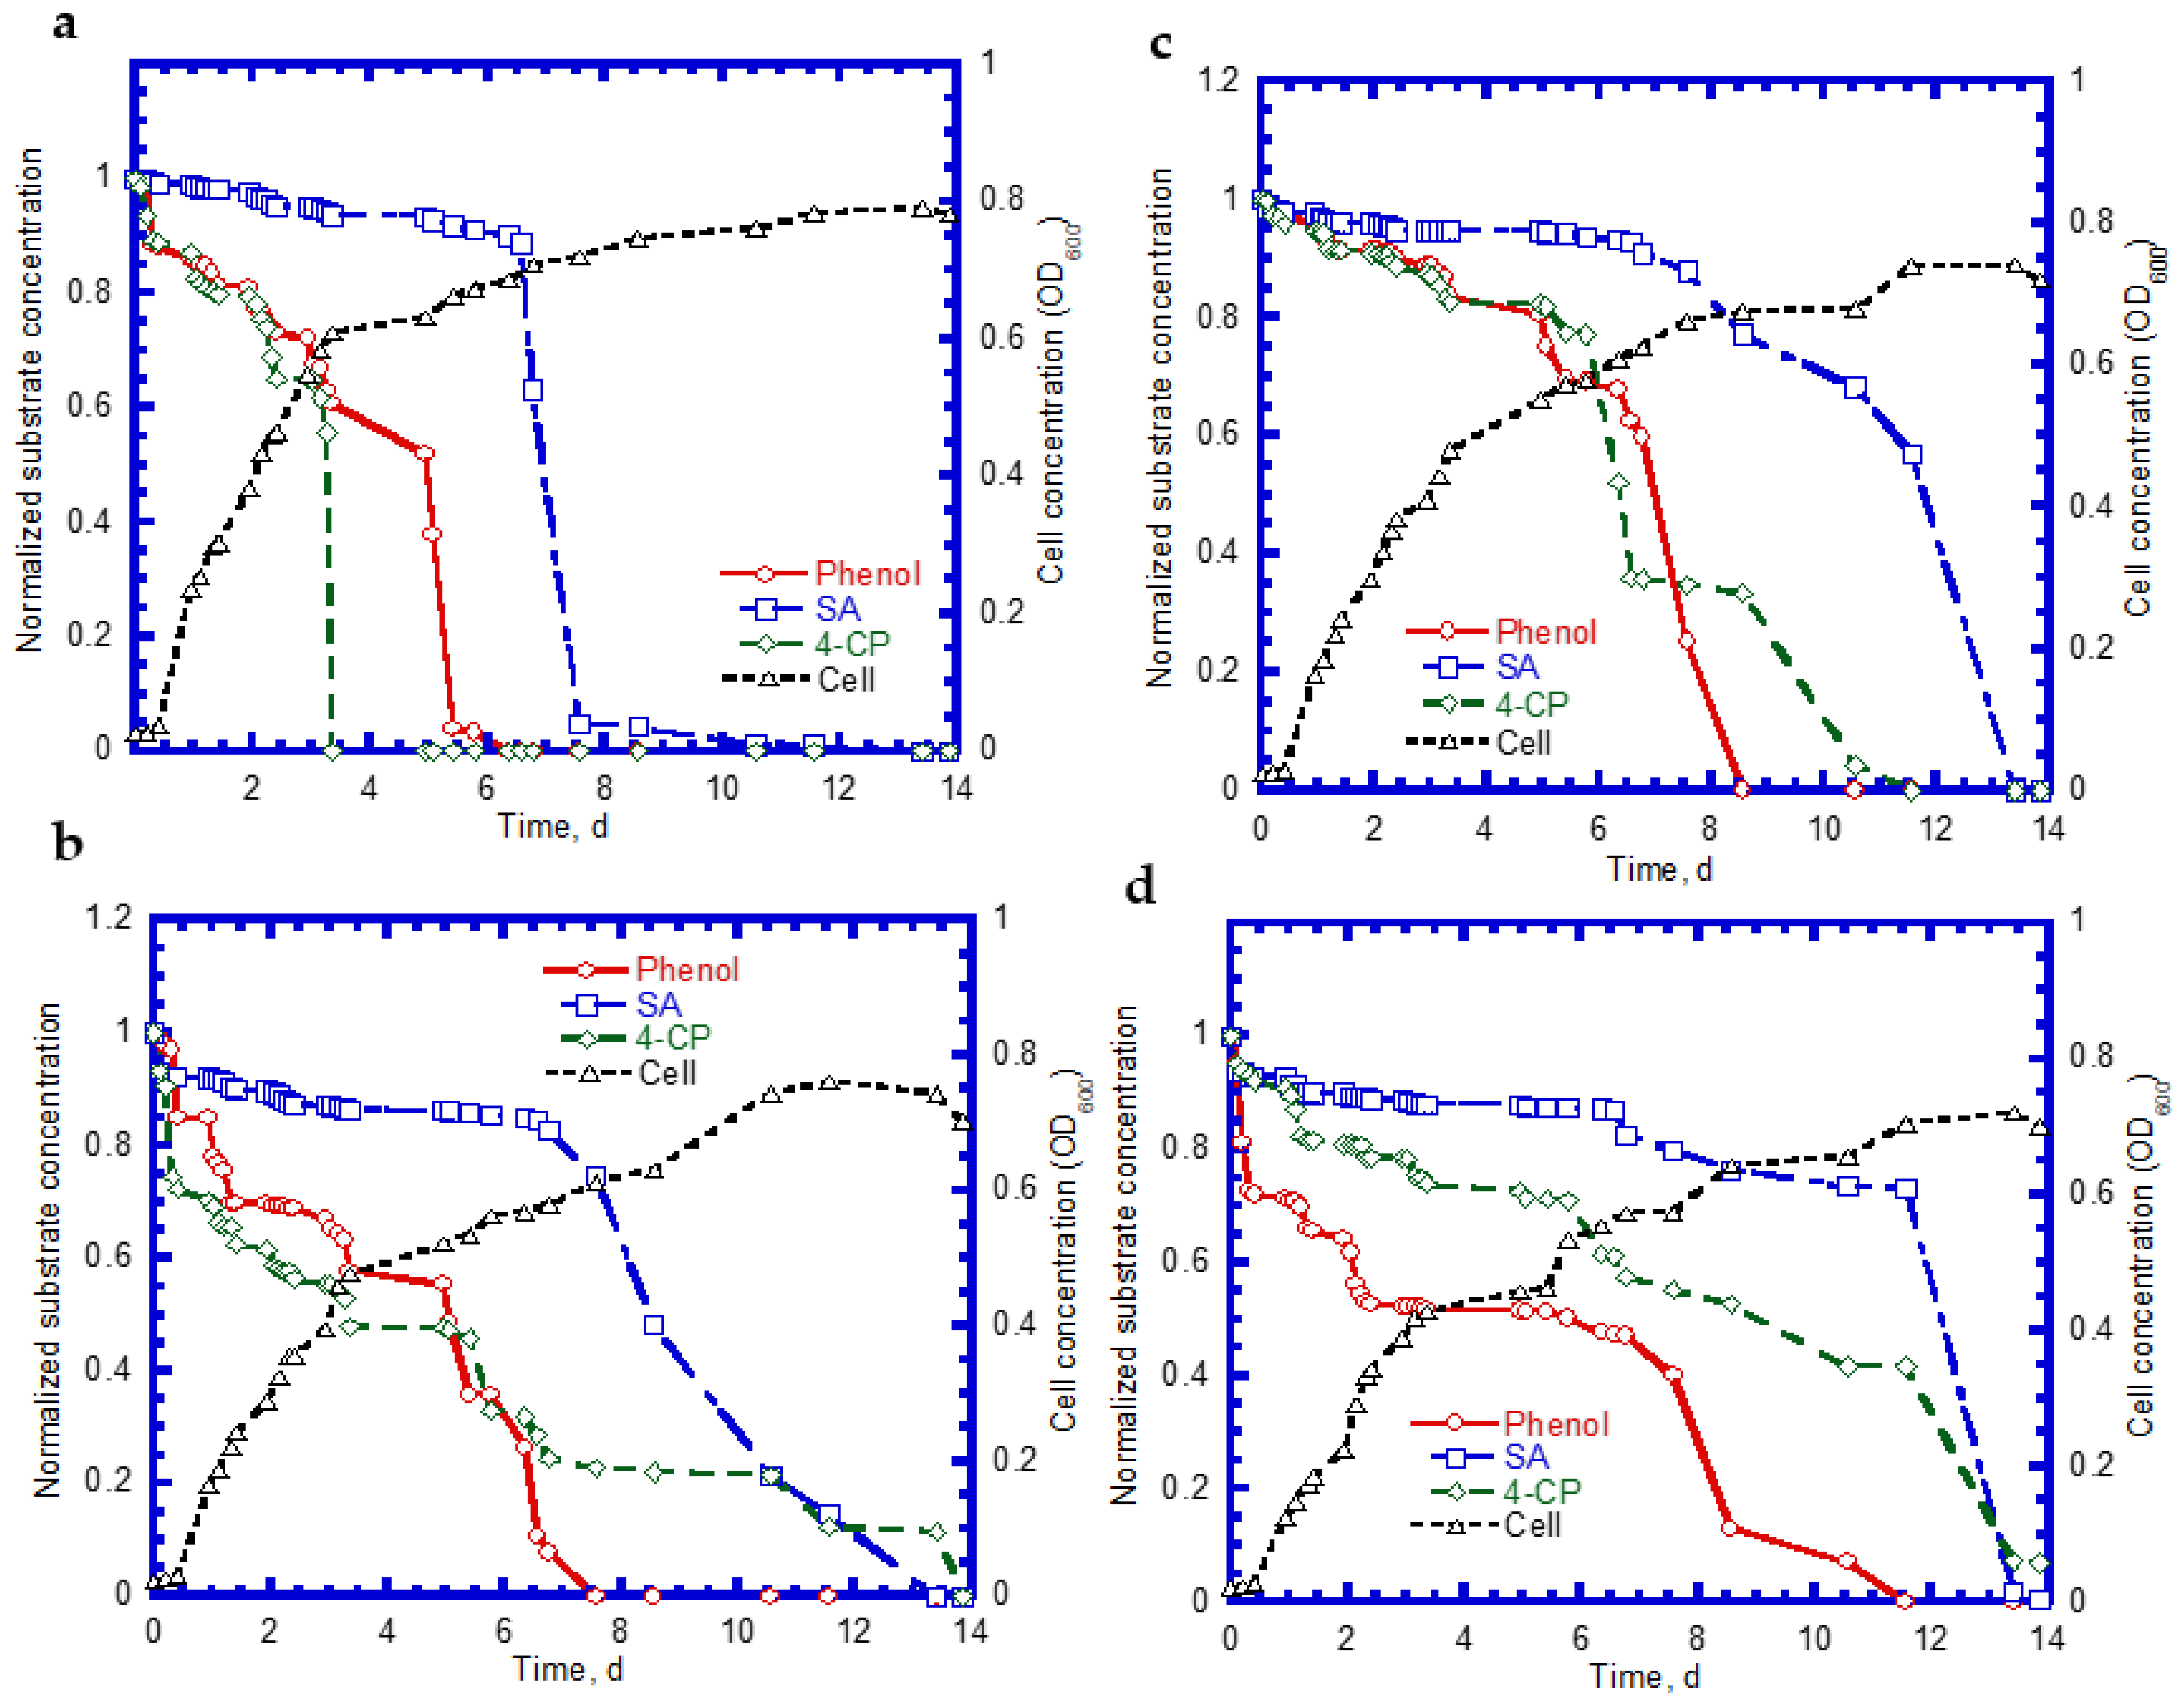
We further examined the biodegradation of SA, phenol, and 4-CP, as well as cell growth on ternary substrates. Typical time course profiles are shown in Figure 9. We observed that the complete degradation of SA, phenol, and 4-CP was achieved within 11 days at an initial 4-CP concentration of 14 mg/L (Figure 9a). The SA shows a 7.5-day lag phase for the biodegradation. However, no apparent lag phase was found for phenol and 4-CP biodegradation. The complete utilization times for phenol and 4-CP were 3.5 and 6 days, respectively. Additionally, when the 4-CP concentration increased to 50 mg/L, we observed that the intermediate lag phase times for the biodegradation of SA and 4-CP were about 6 and 2 days, respectively (Figure 9b). The time periods required for the complete removal for SA, phenol, and 4-CP were 13.5, 7.5, and 14.0 days, respectively. The cell growth patterns were still maintained at the log growth, linear growth, and stationary growth phases (Figure 9a,b). Figure 9c plots the time course profiles of SA, phenol, and 4-CP at an initial 4-CP concentration of 83 mg/L. Compared with those shown in Figure 9a,b, the degradation rates of phenol and 4-CP at the onset of the tests decreased, in contrast to the rate of SA. The complete removal times for SA, phenol, and 4-CP were 13.5, 8.5, and 11.5 days, respectively. The cell growth pattern shows an intermediate lag phase of 2 days during the period of 9–11 days. The variation of the profiles of SA, phenol, and 4-CP with time is shown in Figure 9d when the 4-CP concentration was increased to 138 mg/L. The time required for the complete degradation of SA and phenol was 14 and 11.5 days. A removal efficiency of approximately 90% was achieved for 4-CP during a period of 14 days. The intermediate lag phase of cell growth was 2.5 days during the time course of the test. Wang et al. [23] conducted the biodegradation of ternary substrates of SG, phenol, and 4-CP in batch experiments. Their results indicate that the biphasic cell growth pattern occurred as the ternary substrates (SG, phenol, and 4-CP) were present together. Wang and Loh [39] reported that biophasic cell growth pattern separated by an intermediate lag phase was observed from the 4-CP co-metabolic transformation of 4-CP in the presence of phenol and SG. Their experimental results reveal that P. putida cells degraded phenol in the first stage of cell growth while SG was utilized in the second stage of cell growth. This new cell growth pattern resulted from the disparity of 4-CP toxicity to activities of phenol-oxidizing and SG-oxidizing enzymes.

4.6. Biodegradation of Binary Substrates in the Chemostat System

Table 1 presents the kinetic constants of phenol and SA for the chemostat model input. In chemostat experiments, the dilution rate was controlled at 0.04 h−1, which yielded a hydraulic retention time of 25 h. The initial feed concentrations of phenol and SA were 192 and 286 mg/L, respectively. Time course profiles of phenol, SA, and cell growth are shown in Figure 10. The predicted values of the chemostat model exhibited a good agreement with the experimental results of phenol and SA utilization and cell growth. The phenol effluent concentration curve followed the lag phase, rapid degradation, and steady stages (Figure 10a). The time for the lag phase was 12 h prior to the onset of phenol degradation. The reason for the occurrence of the lag phase was because phenol has a much lower KI value than SA. The phenol effluent concentration decreased from 192 mg/L to approximately 6.6 mg/L during the transient period of 20 h. The phenol effluent concentration was about 6.6 mg/L at the steady state during the operation time of 32–70 h and achieved a removal efficiency of 96.6%. The SA effluent concentration curve had two stages that contained rapid degradation and steady-state removal (Figure 10b). No lag phase was observed before the start of SA degradation. The SA degraded abruptly from 286 to 8.5 mg/L during the transient period of 26 h. A high SA removal efficiency of 97% was observed at the steady stage. The variation of the cell growth curve over time is plotted in Figure 10c. No lag phase occurred for cell growth during the operation time. The cells grew rapidly during the period of 28–70 h and the cell concentration reached a constant level. The cell concentration at the steady-state concentration was 232.5 mg/L.
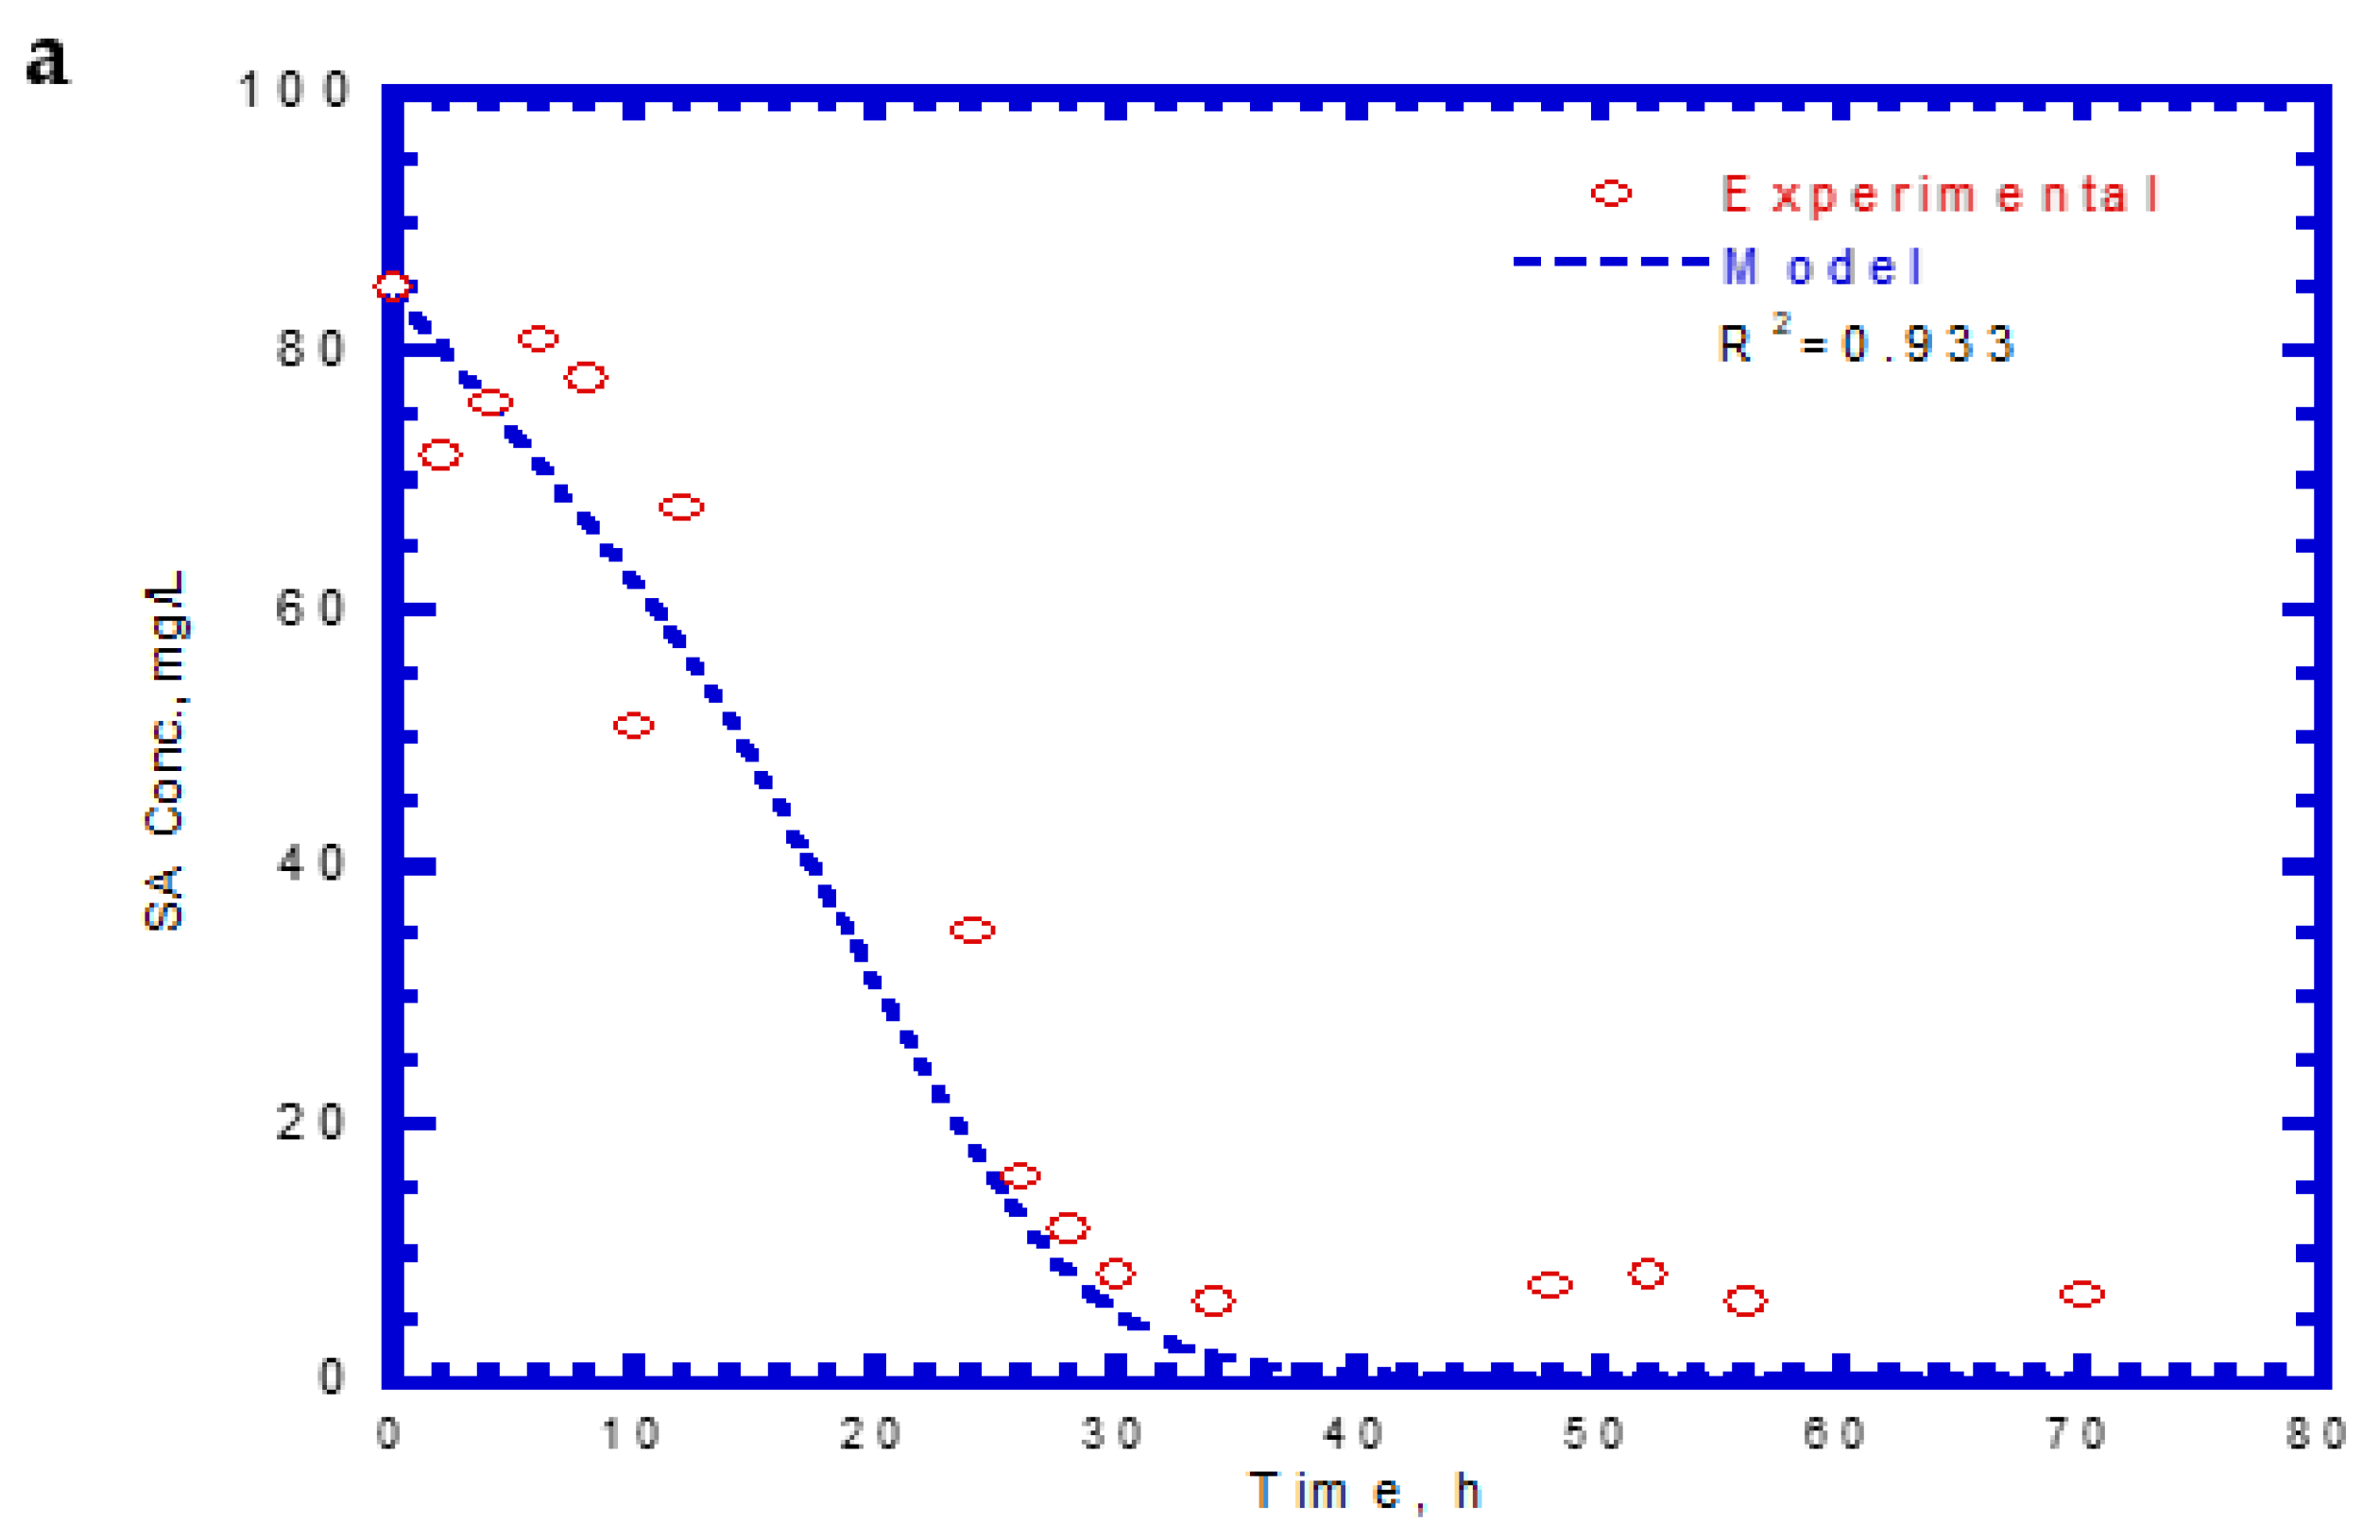
Table 2 lists the kinetic constants of SA and 4-CP as input values for the chemostat model. The effluent SA, 4-CP, and cell concentrations for the chemostat test are shown in Figure 11. The experimental results were similar to those obtained for phenol and SA in the chemostat system. However, no lag phases were found for the biodegradation of SA and 4-CP. The trend of effluent curves of SA and 4-CP was similar at the initial SA and 4-CP concentrations of 85 and 12 mg/L, respectively. At the start of the chemostat test, the effluent concentrations of SA decreased abruptly during the transient period of 40 h (Figure 11a). The effluent SA concentration reached a constant level at the steady state from 40 to 70 h. The removal efficiency of SA was about 91.4% at an average effluent concentration of 7.3 mg/L. The variation of effluent concentration of 4-CP with time is shown in Figure 11b. The effluent curve of 4-CP decreased rapidly within 30 h and subsequently reached a steady-state condition. The average effluent concentration of 4-CP at the steady-state was approximately 0.58 mg/L and yielded a high removal efficiency of 95.2%. The variation of cell growth with time is shown in Figure 11c. The cells grew actively during the transient period of 30 h. The cell growth then reached a steady-state condition with a constant level of 39.2 mg/L. The experimental data and model predictions are in good agreement with each other. Patel et al. [40] conducted the batch and continuous packed bed reactor by Bacillus subtilis to treat 4-CP. The batch experimental results show that this isolated strain had a high capacity in degrading 4-CP up to a 1000 mg/L initial concentration within 40 h. Moreover, they observed that the maximum biodegradation efficiency of 45.39% was achieved within 105 min at the fed initial concentration of 500 mg/L in the continuous-flow reactor packed with immobilized beads of a size of 2 mm.

5. Practical Implications

Several steps presented here were proposed for practical application in the full-scale design to treat the phenolic and chlorophenolic contaminants in industrial wastewater. Phenol and chlorophenol-containing wastewater is collected and filtered to remove suspended solids. The liquid samples are analyzed by HPLC-UV instruments to determine the initial phenol and chlorophenol concentrations (step 1). A suitable growth substrate is chosen, and an effective bacterial inoculum is obtained from the wastewater treatment plant for the target phenols and CPs (step 2). The biodegradations of phenols plus growth substrate, and chlorophenols plus growth substrate are both conducted in a batch bioreactor, in order to investigate the removal efficiencies of phenols and CPs (step 3). In this step, the suitable kinetic models are selected to fit the experimental data and determine the kinetic constants. The kinetic constants are used as input parameters to simulate the performance of in situ pilot-scale experiments. The data from pilot-scale tests and model simulations are compared and used for the design of a full-scale bioreactor to treat phenols and CPs in industrial wastewater.

6. Conclusions

Several batch kinetic experiments were conducted to estimate the kinetic constants of P. putida cells for both single phenol and SA biodegradation. The experimental results reveal that SA has a larger KI value than phenol, indicating that the P. putida cells are less sensitive to SA inhibition. In the binary substrates of phenol and SA, phenol and SA were completely removed within 216 and 264 h at initial phenol and SA concentrations of 79–430 and 158–198 mg/L, respectively. The obtained values of interaction constants show that the inhibition of phenol biodegradation by SA was much more than that of SA biodegradation by phenol. Furthermore, the ratio of inhibition of phenol degradation due to the presence of SA (IA1) to inhibition of SA degradation due to the presence of phenol (IA2) is 2.3, indicating that SA has a higher uncompetitive inhibition on phenol biodegradation compared to that of phenol on SA biodegradation in the binary substrate system. The experimental results for the batch tests of the SA and 4-CP mixture reveal that a complete removal of SA and 4-CP was achieved within 90 and 120 h, respectively. Experimental results also show that simultaneous biodegradation of SA, phenol, and 4-CP was observed at initial concentrations of 252, 175, and 138 mg/L, respectively. Complete removal of SA and phenol was achieved within 14 and 11.5 days, respectively, while maximum degradation efficiency of 4-CP was observed at 90% within 14 days. The removal efficiency of phenol and SA was approximately 97% in the chemostat system. Additionally, the efficiencies of the simultaneous removal of SA and 4-CP was approximately 91.4% and 95.2%, respectively. A good agreement was observed between the experimental data and the model prediction in effluent concentrations of phenol and SA as well as SA and 4-CP, respectively. The biodegradation kinetic studies confirmed that phenol and 4-CP can be effectively removed by P. putida cells, with a high biodegradation rate in the presence of SA. The approaches of experiments and models proposed in this study can be used to design the treatment process for the simultaneous biodegradation of phenol and chlorophenol in industrial wastewater.

Author Contributions

Y.-H.L. conceived and designed the batch experiments as well as developed and solved the chemostat kinetic model systems and analyzed the experimental results. B.-H.H. conducted the batch and chemostat reactors as well as collected the samples for measurements. All authors have read and agreed to the published version of the manuscript.

Funding

This study was supported by a funding from the Ministry of Science and Technology of Taiwan under Contract No. MOST 110-2221-E-166-003.

Institutional Review Board Statement

Not applicable.

Informed Consent Statement

Not applicable.

Data Availability Statement

Not applicable.

Conflicts of Interest

The authors declare no conflict of interest.

References

  1. Dey, A.; Sarkar, P.; Das, A. View of studies on biodegradation of 4-chlorophenol and 4-nitrophenol by isolated pure cultures. Eur. J. Sustain. Dev. 2019, 8, 281. [Google Scholar] [CrossRef]
  2. Hong, J.; Hao, X.; Liu, T.; Liu, W.; Xie, M.; Wang, M.; Xu, Q.; Yang, B. Rapid synergistic cloud point extraction (RS-CPE) with partial least squares (PLS) for the simultaneous determination of chlorophenols (CPs) in environmental water samples using a microplate Assay (MPA). Anal. Lett. 2020, 53, 1719–1733. [Google Scholar] [CrossRef]
  3. Azizi, E.; Abbasi, F.; Baghapour, M.A.; Shirdareh, M.R.; Shooshtarian, M.R. 4-chlorophenol removal by air lift packed bed bioreactor and its modeling by kinetics and numerical model (artificial neural network). Sci. Rep. 2021, 11, 670. [Google Scholar] [CrossRef]
  4. Movahedyan, H.; Assadi, A.; Amin, M. Effects of 4-chlorophenol loadings on acclimation of biomass with optimized fixed time sequencing batch reactor. J. Environ. Health Sci. Eng. 2008, 5, 225–234. [Google Scholar]
  5. Arora, P.K.; Bae, H. Bacterial degradation of chlorophenols and their derivatives. Microb. Cell Factories 2014, 13, 31. [Google Scholar] [CrossRef] [Green Version]
  6. Gupta, P.; Sreekrishnan, T.R.; Shaikh, Z.A. Evaluating the effects on performance and biomass of hybrid anaerobic reactor while treating effluents having glucose with increasing concentrations of 4-chlorophenols. J. Environ. Chem. Eng. 2018, 6, 2643–2650. [Google Scholar] [CrossRef]
  7. Tsai, S.Y.; Juang, R.S. Biodegradation of phenol and sodium salicylate mixtures by suspended Pseudomonas putida CCRC 14365. J. Hazard. Mater. 2006, 138, 125–132. [Google Scholar] [CrossRef] [PubMed]
  8. Sandhibigraha, S.; Chakraborty, S.; Bandyopadhyay, T.; Bhunia, B. A kinetic study of 4-chlorophenol biodegradation by the novel isolated Bacillus subtilis in batch shake flask. Environ. Eng. Res. 2020, 25, 62–70. [Google Scholar] [CrossRef] [Green Version]
  9. Dizicheh, A.A.; Bayat, M.; Alimohmmadi, M.; Hashemi, J. Survey bioremediation of 4-Chlorophenol by yeast and mold isolated from industrial and petroleum wastewaters (Imam Khomeini seaport, Mahshahr). Int. J. Mol. Clin. Microbiol. 2018, 8, 957–966. [Google Scholar]
  10. Kumar, S.; Arya, D.; Malhotra, A.; Kumar, S.; Kumar, B. Biodegradation of dual phenolic substrates in simulated wastewater by Gliomastix indicus MTCC 3869. J. Environ. Chem. Eng. 2013, 1, 865–874. [Google Scholar] [CrossRef]
  11. Dursun, G.; Çiçek, H.; Dursun, A.Y. Adsorption of phenol from aqueous solution by using carbonized beet pulp. J. Hazard. Mater. 2005, 125, 175–182. [Google Scholar] [CrossRef] [PubMed]
  12. Ra, J.S.; Oh, S.Y.; Lee, B.C.; Kim, S.D. The effect of suspended particles coated by humic acid on the toxicity of pharmaceuticals, estrogens, and phenolic compounds. Environ. Int. 2008, 34, 184–192. [Google Scholar] [CrossRef]
  13. Durruty, I.; Okada, E.; González, J.F.; Murialdo, S.E. Multisubstrate monod kinetics model for simultaneous degradation of chlorophenol mixtures. Biotechnol. Bioprocess. Eng. 2011, 16, 908–915. [Google Scholar] [CrossRef] [Green Version]
  14. Xie, S.; Li, M.; Liao, Y.; Qin, Q.; Sun, S.; Tan, Y. In-situ preparation of biochar-loaded particle electrode and its application in the electrochemical degradation of 4-chorophenol in wastewater. Chemosphere 2020, 273, 128506. [Google Scholar] [CrossRef]
  15. Sonwani, R.K.; Giri, B.S.; Das, T.; Singh, R.S.; Rai, B.N. Biodegradation of fluorine by neoteric LDPE immobilized Pseudomonas NRSS3 in a packed bed bioreactor and analysis of external mass transfer correlation. Process Biochem. 2019, 77, 106–112. [Google Scholar] [CrossRef]
  16. Sandhibigraha, S.; Mandal, S.; Awasthi, M.; Bandyopadhyay, T.K.; Bhunia, B. Optimization of various process parameters for biodegradation of 4-chlorophenol using taguchi methodology. Biocatal. Agric. Biotechnol. 2020, 24, 101568. [Google Scholar] [CrossRef]
  17. Basak, B.; Bhunia, B.; Dutta, S.; Chakraborty, S.; Dey, A. Kinetics of phenol biodegradation at high concentration by a metabolically versatile isolated yeast Candida tropicalis PHB5. Environ. Sci. Pollut. Control Ser. 2014, 21, 1444–1454. [Google Scholar] [CrossRef]
  18. Zhao, J.; Li, Y.; Chen, X.; Li, Y. Effects of carbon sources on sludge performance and microbial community for 4-chlorophenol wastewater treatment in sequencing batch reactor. Bioresour. Technol. 2018, 255, 22–28. [Google Scholar] [CrossRef] [PubMed]
  19. Jiang, Y.; Deng, T.; Shang, Y.; Yang, K.; Wang, H. Biodegradation of phenol by entrapped cell of Debaryomyces sp. with nano-Fe3O4 under hypersaline conditions. Int. Biodeterior. Biodegrad. 2017, 123, 37–45. [Google Scholar] [CrossRef]
  20. Juang, R.S.; Tsai, S.Y. Growth kinetics of Pseudomonas putida in the biodegradation of single and mixed phenol and sodium salicylate. Biochem. Eng. J. 2006, 31, 133–140. [Google Scholar] [CrossRef]
  21. Monteiro, A.A.M.G.; Biaventura, R.A.R.; Rodrigues, A.E. Phenol biodegradation by Pseudomonas putida DSM 548 in a batch reactor. Biochem. Eng. J. 2000, 6, 45–49. [Google Scholar] [CrossRef]
  22. Farrell, A.; Quilty, B. The enhancement of 2-chlorophenol degradation by a mixed microbial community when augmented with Pseudomonas putida CP1. Water Res. 2002, 36, 2443–2450. [Google Scholar] [CrossRef]
  23. Wang, S.J.; Loh, K.C.; Chua, S.S. Prediction of critical cell growth behavior of Pseudomonas putida to maximize the cometabolism of 4-chlorophenol with phenol and sodium glutamate as carbon sources. Enzym. Microb. Technol. 2003, 32, 422–430. [Google Scholar] [CrossRef]
  24. Loh, K.C.; Yu, Y.G. Kinetics of carbazole degradation by Pseudomonas putida in presence of sodium salicylate. Water Res. 2000, 34, 4131–4138. [Google Scholar] [CrossRef]
  25. Wang, Q.; Li, Y.; Li, J.; Wang, Y.; Wang, C.; Wang, P. Experimental and kinetic study on the cometabolic biodegradation of phenol and 4-chlorophenol by psychrotrophic Pseudomonas putida LY1. Environ. Sci. Pollut. Res. 2015, 22, 565–573. [Google Scholar] [CrossRef] [PubMed]
  26. Wang, J.; Sun, Z. Exploring the effects of carbon source level on the degradation of 2,4,6-trichlorophenol in the co-metabolism process. J. Hazard. Mater. 2020, 392, 122293. [Google Scholar] [CrossRef] [PubMed]
  27. Swain, G.; Sonwani, R.S.; Singh, R.S.; Jaiswal, R.P.; Rai, B.N. A comparative study of 4-chlorophenol biodegradation in a packed bed and moving bed bioreactor: Performance evaluation and toxicity analysis. Environ. Technol. Innov. 2021, 24, 101820. [Google Scholar] [CrossRef]
  28. Liu, J.; Jia, X.; Wen, J.; Zhou, Z. Substrate interactions and kinetics study of phenolic compounds biodegradation by Pseudomonas sp. cbp1-3. Biochem. Eng. J. 2012, 67, 156–166. [Google Scholar] [CrossRef]
  29. Gu, Y.; Korus, R.A. Effects of p-cresol and chlorophenols on pentachlorophenol biodegradation. Biotechnol. Bioeng. 1995, 47, 470–475. [Google Scholar] [CrossRef]
  30. Rittmann, B.E.; McCarty, P.L. Environmental Biotechnology: Principles and Application; McGraw-Hill: New York, NY, USA, 2001. [Google Scholar]
  31. Khan, H.; Bae, W. Optimized operational strategies based on maximum nitritation, stability, and nitrite accumulation potential in a continuous partial nitritation reactor. Process Biochem. 2016, 51, 1058–1068. [Google Scholar] [CrossRef]
  32. Keerio, H.A.; Bae, W.; Park, J.; Kim, M. Substrate uptake, loss, and reserve in ammonia-oxidizing bacteria (AOB) under different substrate availabilities. Process Biochem. 2020, 91, 303–310. [Google Scholar] [CrossRef]
  33. Wang, S.J.; Loh, K.C. Modeling the role of metabolic intermediates in kinetics of phenol biodegradation. Enzym. Microb. Technol. 1999, 25, 177–184. [Google Scholar] [CrossRef]
  34. Praveen, P.; Nguyen, D.T.T.; Loh, K.C. Biodegradation of phenol from saline wastewater using forward osmotic hollow fiber membrane bioreactor coupled chemostat. Biochem. Eng. J. 2015, 94, 125–133. [Google Scholar] [CrossRef]
  35. González, G.; Herrera, G.; García, M.T.; Peña, M. Biodegradation of phenolic industrial wastewater in a fluidized bed bioreactor with immobilized cells of Pseudomonas putida. Bioresour. Technol. 2001, 80, 137–142. [Google Scholar] [CrossRef]
  36. Sahinkaya, E.; Dilek, F.B. Effects of 2,4-chlorophenol on activated sludge. Appl. Microbiol. Biotechnol. 2002, 59, 36. [Google Scholar]
  37. Chung, T.P.; Tseng, H.Y.; Juang, R.S. Mass transfer effect and intermediate detection for phenol degradation in immobilized Pseudomonas putida systems. Process Biochem. 2003, 38, 1497–1507. [Google Scholar] [CrossRef]
  38. Hao, O.J.; Kim, M.H.; Seagren, E.A.; Kim, H. Kinetics of phenol and chlorophenol utilization by Acinetobacter species. Chemosphere 2002, 46, 797–807. [Google Scholar] [CrossRef]
  39. Wang, S.J.; Loh, K.C. New cell growth pattern on mixed substrates and substrate utilization in cometabolic transformation of 4-chlorophenol. Water Res. 2000, 34, 3786–3794. [Google Scholar] [CrossRef]
  40. Patel, N.; Shahane, S.; Bhunia, B.; Mishra, U.; Chaudhary, V.K.; Srivastav, A.L. Biodegradation of 4-chlorophenol in batch and continuous packed bed reactor by isolated Bacillus subtilis. J. Environ. Manag. 2022, 301, 113851. [Google Scholar] [CrossRef]
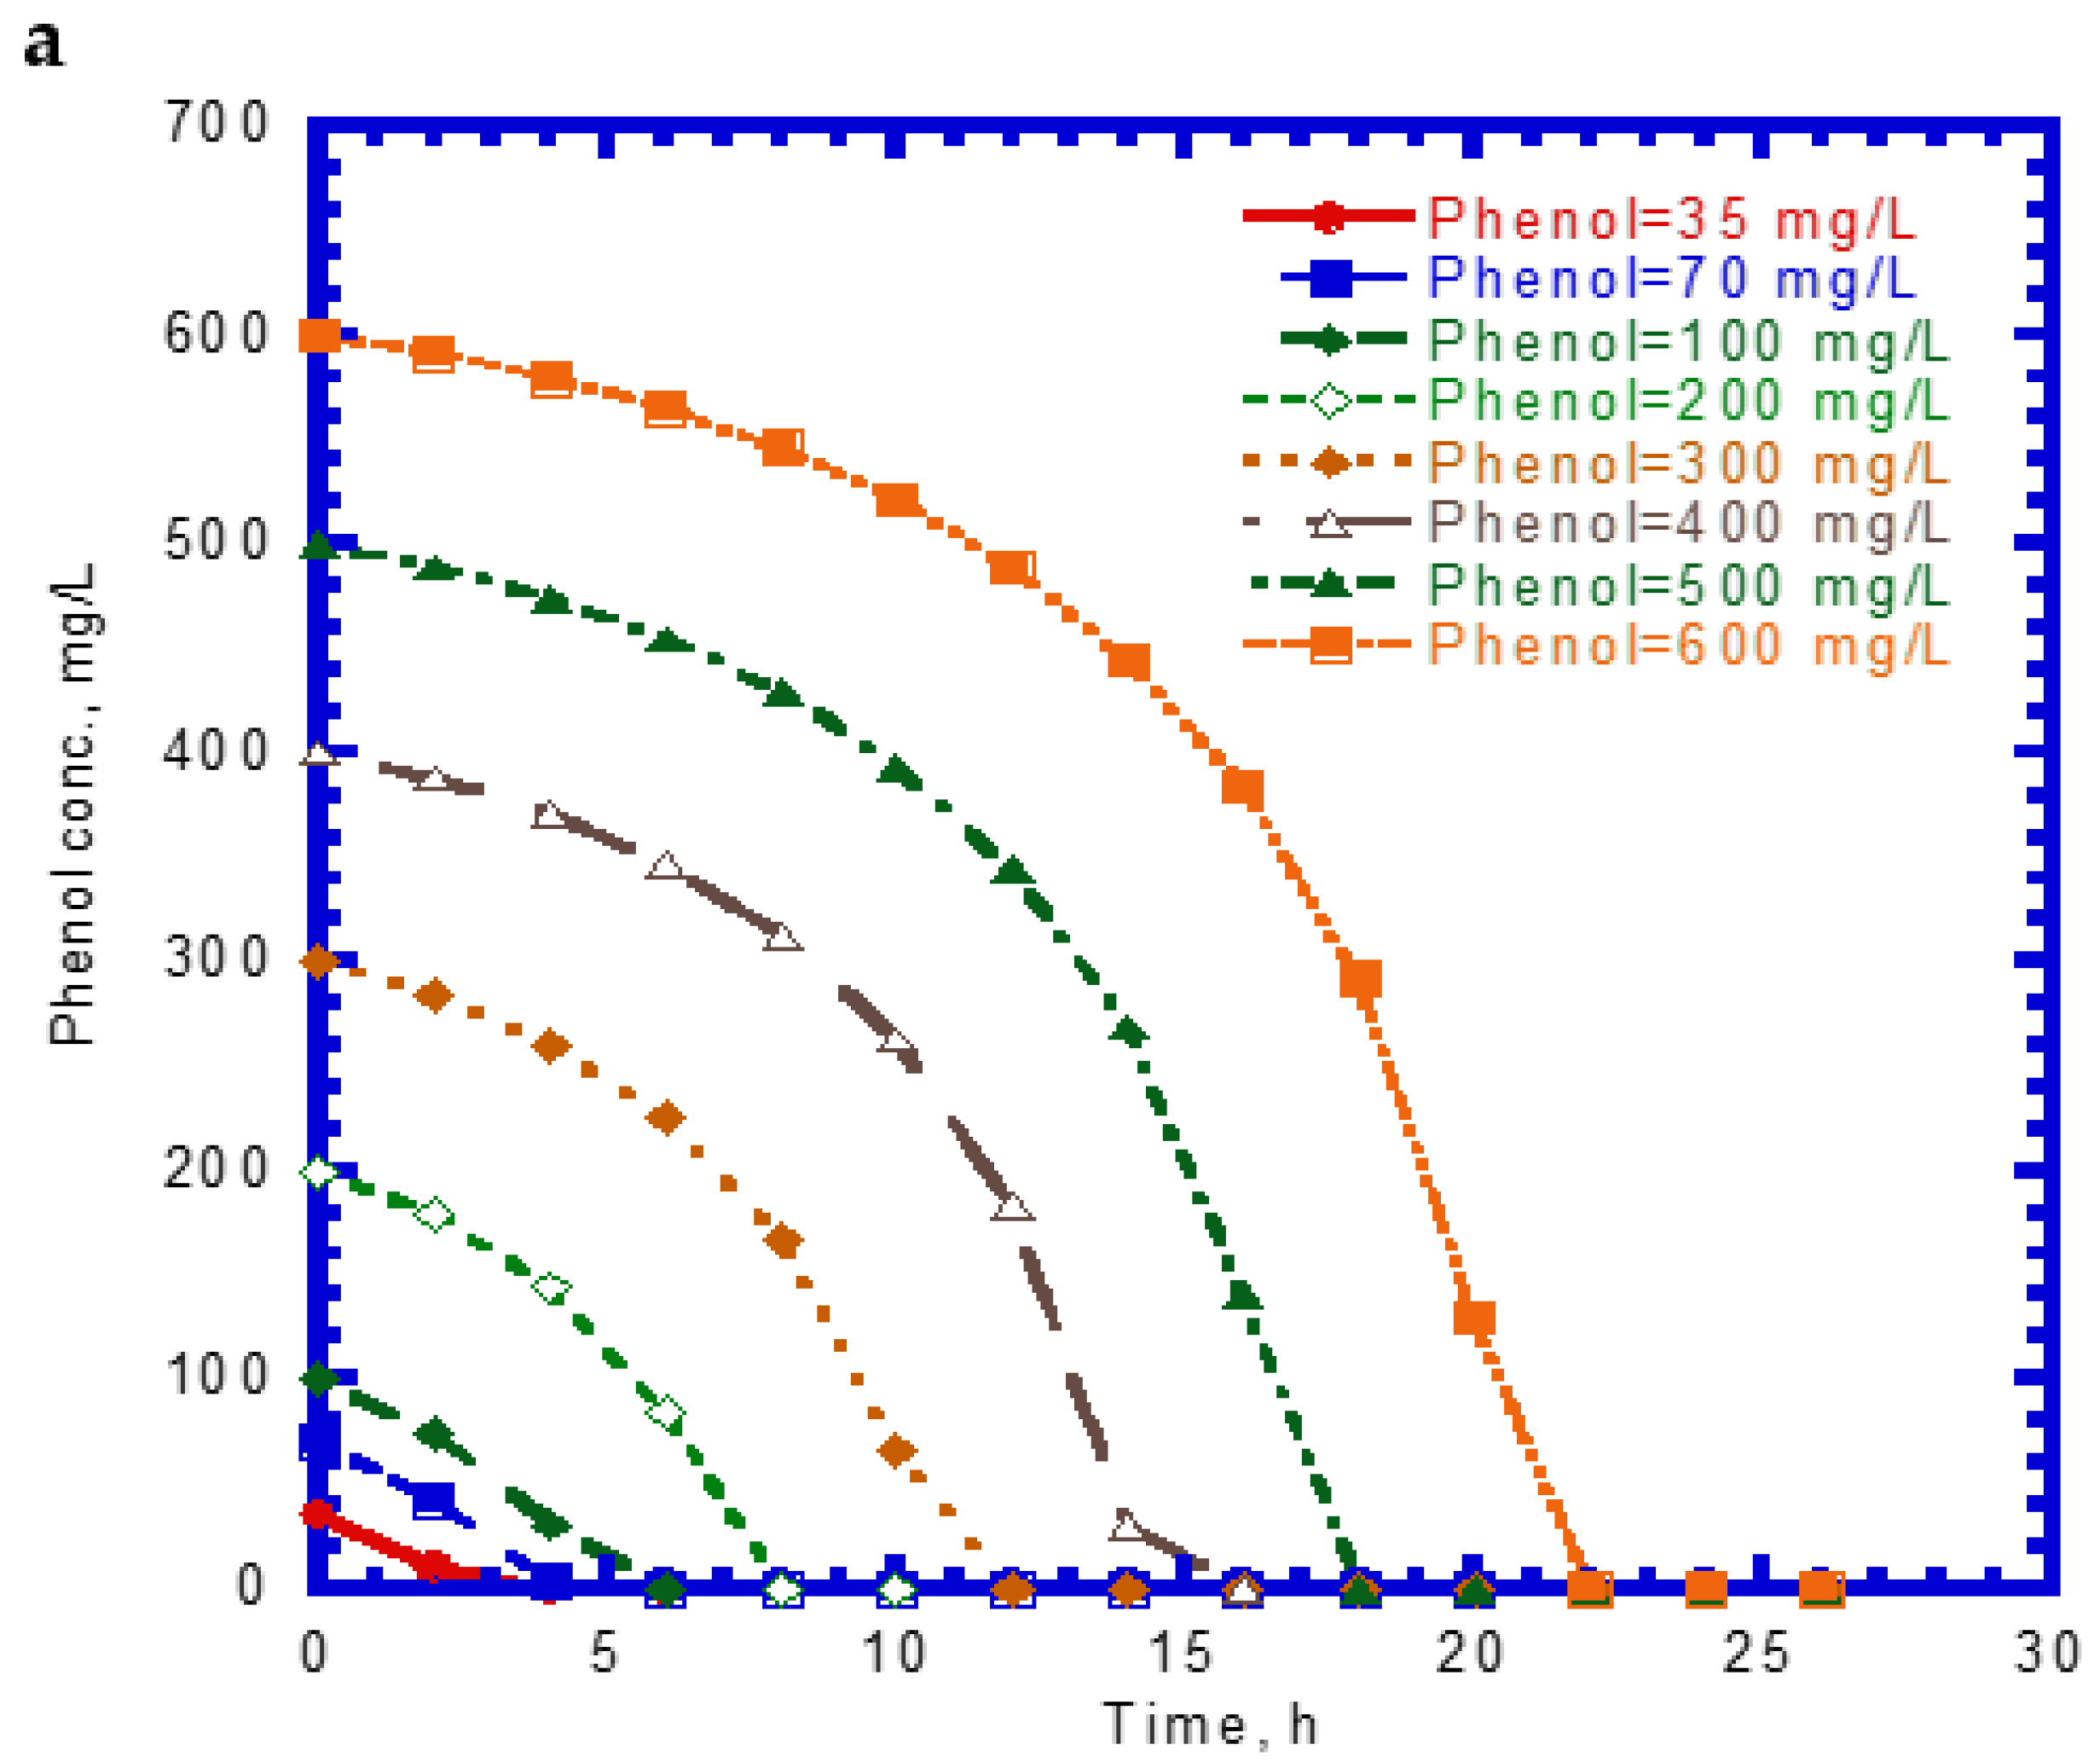
Figure 1. Single phenol biodegradation by P. putida at various initial phenol concentrations: (a) phenol biodegradation and (b) cell growth.
Processes 10 00694 g001aProcesses 10 00694 g001b
Figure 2. Single sodium salicylate (SA) biodegradation by P. putida at various initial phenol concentrations: (a) SA biodegradation and (b) cell growth.
Processes 10 00694 g002aProcesses 10 00694 g002b
Figure 3. The variation of the specific growth rate of P. putida cells at different initial concentrations of (a) phenol and (b) sodium salicylate.
Processes 10 00694 g003
Figure 4. Variation of binary substrates with time: (a) phenol biodegradation, (b) salicylate biodegradation, and (c) cell growth.
Processes 10 00694 g004aProcesses 10 00694 g004b
Figure 5. Kinetic fit of the cell growth of P. putida on binary substrates of phenol and sodium salicylate, SSR = 2.916 × 10⁻³.
Processes 10 00694 g005
Figure 6. Experimental results for the biodegradation of binary substrates of sodium salicylate and 4-CP in the presence of sodium salicylate with an initial concentration of 124 mg/L: (a) sodium salicylate, (b) 4-CP, and (c) P. putida cells.
Processes 10 00694 g006aProcesses 10 00694 g006b
Figure 7. Model-fitted specific growth rates on binary substrates of sodium salicylate and 4-CP compared with experimental data to determine the decay constant of P. putida cells due to 4-chlorophenol (md,CP).
Processes 10 00694 g007
Figure 8. Model-fitted specific 4-CP degradation rate on binary substrates of sodium salicylate and 4-CP to determine the kinetic parameters (kCP, KS,CP, and KI,CP).
Processes 10 00694 g008
Figure 9. Substrate degradation and cell growth: (a) initial [SA] = 238 mg/L, [phenol] = 124 mg/L, and [4-CP] = 14 mg/L; (b) initial [SA] = 251 mg/L, [phenol] = 128 mg/L, [4-CP] = 50 mg/L; (c) initial [SA] = 229 mg/L, [phenol] = 131 mg/L, and [4-CP] = 83 mg/L; and (d) the initial [SA] = 252 mg/L, [phenol] = 175 mg/L, and [4-CP] = 138 mg/L.
Processes 10 00694 g009
Figure 10. Effluent concentration of phenol plus SA in the chemostat system: (a) phenol, (b) SA, and (c) cell growth.
Processes 10 00694 g010
Figure 11. Effluent concentration of SA plus 4-CP in the chemostat system: (a) SA, (b) 4-CP, and (c) cell growth.
Processes 10 00694 g011aProcesses 10 00694 g011b
Table 1. Kinetic constants of phenol and SA for the chemostat model input.
SymbolKinetic ConstantValue
SP0Phenol concentration in the feed (mg/L)192
SA0SA concentration in the feed (mg/L)286
μm,PMaximum specific growth rate of cells on phenol (h−1)0.423
YPGrowth yield of cells on phenol (mg cell/mg phenol-h)0.447
KS,PHalf-saturation constant of phenol (mg/L)48.1
KI,PInhibition constant of Phenol (mg/L)272.5
IA1Inhibition of phenol degradation due to the presence of SA (dimensionless)0.32
IB1Inhibition of phenol degradation due to the presence of phenol and SA (dimensionless)1.51
μm,AMaximum specific growth rate of cells on SA (h−1)0.247
YAGrowth yield of cells on SA (mg cell/mg SA-h)0.438
KS,AHalf-saturation constant of SA (mg/L)71.7
KI,AInhibition constant of SA (mg/L)3178.2
IA2inhibition of SA degradation due to the presence of phenol (dimensionless)0.14
IB2Inhibition of SA degradation due to the presence of SA and phenol (dimensionless)6.6 × 10⁻³
DDilution rate (h−1)0.04
Table 2. Kinetic constants of SA and 4-CP for the chemostat model input.
SymbolKinetic ConstantValue
SA0SA concentration in the feed (mg/L)85
SCP04-CP concentration in the feed (mg/L)12
kAMaximum specific SA degradation rate by cells (mg SA/mg cell-h)0.564
KS,AHalf-saturation constant of SA (mg/L)71.7
KI,AInhibition constant of SA (mg/L)3178.2
ICPInhibition constant of 4-CP to SA (mg/L)0.355
kCPMaximum specific degradation rate of 4-CP by cells (mg 4-CP/mg cell-h)0.189
KS,CPHalf-saturation constant of 4-CP (mg/L)1.106
KI,CPInhibition constant of 4-CP (mg/L)0.977
μm,AMaximum specific growth rate of cells on SA (h−1)0.247
kd,ADecay coefficient of cells on SA (h−1)1.635 × 10⁻⁴
md,CPDecay constant due to 4-CP (L/mg)6.11
DDilution rate (h−1)0.04
Publisher’s Note: MDPI stays neutral with regard to jurisdictional claims in published maps and institutional affiliations.