Article

Numerical Simulation Study on Flow Heat Transfer and Stress Distribution of Shell-and-Tube Superheater in Molten Salt Solar Thermal Power Station

1
Powerchina Zhongnan Engineering Corporation Limited, Changsha 410014, China
2
Key Laboratory of Low-Grade Energy Utilization Technologies and Systems, Chongqing University, Ministry of Education, Chongqing 400044, China
3
School of Energy and Power Engineering, Chongqing University, Chongqing 400044, China
*
Authors to whom correspondence should be addressed.
Processes 2022, 10(5), 1003; https://doi.org/10.3390/pr10051003
Submission received: 28 April 2022 / Revised: 10 May 2022 / Accepted: 16 May 2022 / Published: 18 May 2022
(This article belongs to the Section Energy Systems)

Abstract

:
The flow heat transfer and stress distribution of the shell and tube superheater of the steam generation system in a 50 MW molten salt tank solar thermal power station are studied by numerical simulation, and the influence of the flow pattern of molten salt and water vapor in the shell-and-tube superheater on the heat transfer efficiency and stress distribution under the heat–fluid–solid coupling condition is deeply studied. When the water vapor is located on the tube side of the superheater, the molten salt is located on the shell side, and the counterflow is used in the superheater, the water vapor outlet meets the inlet temperature of the steam turbine, and the heat exchange efficiency of the superheater can reach 94.2%. The optimum inlet temperatures of molten salt and steam in the superheater are 563 and 345 °C, respectively, and the optimum flow rate of molten salt at the inlet of the superheater is 2.5 m/s. Compared with the stable condition, the heat exchange efficiency can be increased by 2.9%, the equivalent stress value is reduced from 335.63 to 312.60 MPa, and the deformation is reduced by 0.48 mm.

1. Introduction

At present, the utilization of solar energy is mainly in the form of solar thermal power generation and solar photovoltaic power generation. Among them, the molten salt in the trough molten salt solar thermal power station has stable chemical properties and thermal stability, large specific heat capacity, and good thermal conductivity. Compared with other working fluids, the biggest advantage is that the working temperature range is wide, ranging from 300 to 1000 °C, and the molten salt does not pollute the environment during the working process [1,2,3,4,5,6]. The thermal energy of solar thermal power generation as an energy carrier is easier to store. By storing heat, continuous and stable power generation and peak-shaving power generation can be achieved, which can develop harmoniously with the needs of the power system [7,8,9,10,11,12].
In this paper, the binary molten salt system (KNO3-NaNO3) is used. Antonio and Roberta [13] first studied the application of molten salt in trough solar thermal power generation systems and the physical properties of molten salt. The latent heat and specific heat of potassium, lithium, and sodium salts in nitrates were measured, and molten salts mixed with different melting points and specific heat capacities were obtained by mixing different types of nitrates. As representative equipment of the heat exchanger in the steam generation system of the trough molten salt solar thermal power station, the superheater has the advantages of solid structure, strong adaptability, and the ability to utilize and recover heat energy. Scholars have conducted a lot of research on its safety factors and thermal economy [14,15,16,17,18,19,20,21]. Liu et al. [22] reviewed the research of molten salt phase change materials suitable for medium- and high-temperature applications at 200 to 1000 °C and studied the heat transfer performance of the shell-and-tube phase change heat device containing molten salt and methods for enhancing the heat transfer performance of phase change materials and optimizing shell-and-tube heat exchange devices. Hendra et al. [23] explored the shell-and-tube phase change heat exchanger with multiple inner tubes by combining numerical calculation and experimental demonstration and took one-fourth of the tube unit as the simulation calculation area, ignoring the natural convection in the phase change area which is used to calculate and analyze the heat exchange efficiency of the heat exchanger and propose optimization measures. Based on the similarity modeling theory, Sun et al. [24] used the fluid–solid heat transfer method and established a coupling of the steam generator “unit tube” model and the four-leaf plum-shaped support plate based on the thermal phase transition model of the secondary vapor–liquid two-phase flow. Using the hydrodynamic prediction model of flow-induced vibration, the influence of the four-leaf plum-shaped support plate on the flow and heat transfer characteristics of the steam generator was studied. The simulation results show that the reduction of the flow cross-section of the support plate leads to a rapid change in the secondary fluid velocity in the support plate region, and the secondary-side fluid flows back on the upper part of the support plate, which aggravates the impurity deposition and stress corrosion in the support plate region. Nithyanandam et al. [25] simulated the heat transfer process of the shell-and-tube thermal storage device and established a thermal resistance mesh model. The effects of the unit design and operating parameters of the shell-and-tube heat exchanger on the exothermic process were determined by the numerical optimization method. In-Cheol et al. [26] used-air and-water two-phase fluids as experimental working fluids and 39 U-shaped tube bundles to model an actual steam generator and used a three-dimensional optical probe to analyze the flow-induced vibration distribution of the steam generator. The vibration frequency and displacement of the tube bundle in the bend region were revealed. Li et al. [27] took the steam generator of a nuclear power plant as the research object and used CFX to conduct a three-dimensional numerical simulation of the coupled-flow heat transfer between the primary- and secondary-side fluids, heat exchange tubes, and support plates. The results show that heat exchange tube stress depends on the fluid pressure difference between the primary and secondary sides.
Although some progress has been made in the research on the heat exchanger of the steam generation system of the molten salt trough CSP station, due to the influence of factors such as the day-and-night cycle, seasonal alternation, and climate uncertainty, the working conditions of the system change drastically. In this paper, the numerical simulation method is used to study the thermal stress distribution characteristics of the heat exchanger of a molten salt steam generation system under different working conditions and different layouts. On the premise of ensuring the safe operation of the steam generation system, the optimal parameters and heat exchange parameters are selected. Therefore, the heat exchange efficiency and thermal economy of the molten salt steam generation system are improved, and the theoretical basis and guidance for the actual operation process of the molten salt trough solar thermal power station are provided.

2. Physical Model and Calculation Method
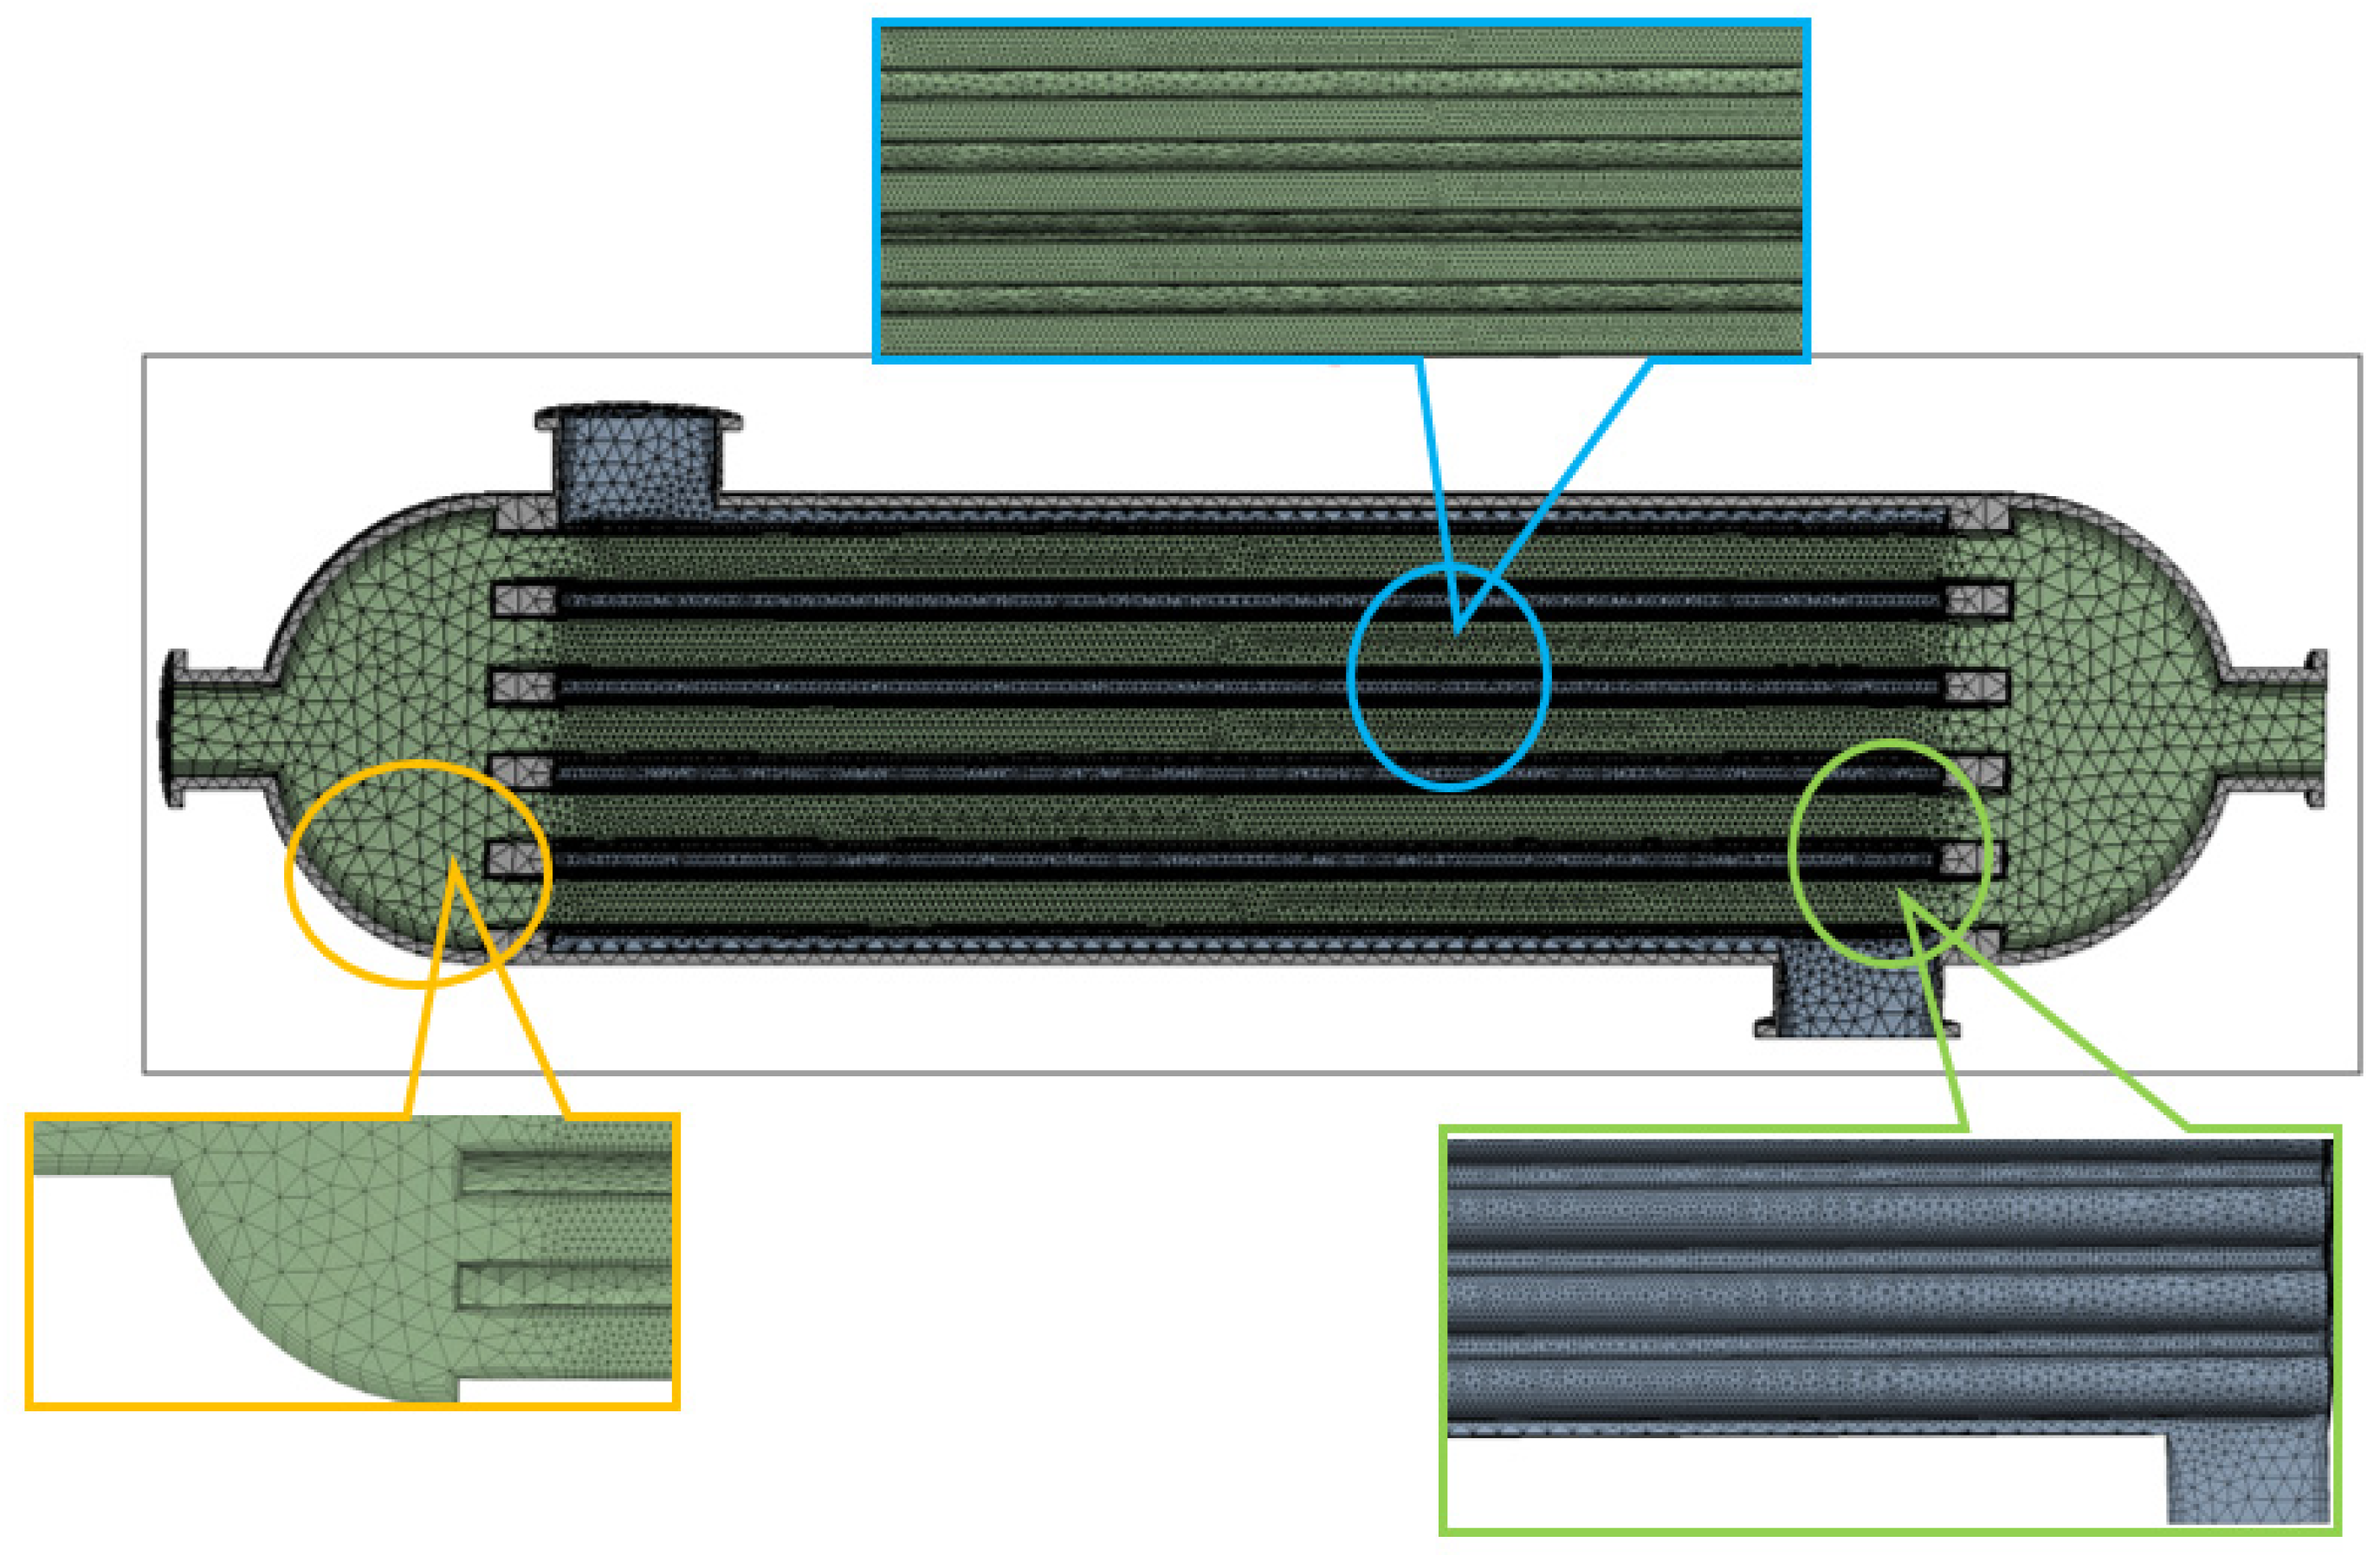
2.1. Physical Model

This paper takes the superheater in a 50 MW trough molten salt steam generation system as the research object. The type is a shell-and-tube heat exchanger. The main structure is composed of tube sheet, tube shell, tube bundle, and flange. There is no expansion joint structure. The heat exchanger has structural symmetry. In order to save computing resources, half of its symmetry plane is taken as the research object, and its internal section is shown in Figure 1. The geometric dimensions of the superheater are shown in Table 1.
The heat exchanger shell material is Q235A, the tube sheet material is S32168 (0Cr18Ni10Ti), and the tube bundle material is S30408 (0Cr18Ni9). The physical properties of each part of the heat exchanger material vary with temperature, see the Practical Metal Materials Selection Manual. The allowable stress of the material of the main components of the heat exchanger varies with temperature, please refer to the relevant standards. The molten salt used in this paper is a binary molten salt, and its basic physical parameters change with temperature, as shown in Table 2.

2.2. Calculation Method

In this paper, the flow of molten salt and water vapor are both turbulent flows. To solve the process of molten salt and water vapor flowing and exchanging heat inside the heat exchanger, it can be regarded as a fluid system with convection and heat conduction. The control equation is as follows:
(1) Continuity equation:
ρ t + ( ρ u ) x + ( ρ v ) y + ( ρ w ) z = 0
In the formula, t is the time (s) and u, v, and w are the velocity components of the control body in the three directions of x, y, and z, respectively (m/s).
(2) Momentum equation:
t ( ρ u i ) + x j ( ρ u i u j ) = p x i + τ i j x j + ρ g i + F i
In the formula, p is the pressure on the control body (Pa), τ is the viscous stress acting on the surface of the control body (Pa), and F is the external force acting on the control body (N).
(3) Energy equation:
( ρ T ) t + d i v ( ρ u T ) = d i v ( k c p g r a d T ) + s T
In the formula, cp is the specific heat capacity of the fluid (J/(kg·°C)), T is the temperature (°C), and k is the heat transfer coefficient (W/(m·K)). ST is the part that converts the mechanical energy of the fluid into thermal energy due to the viscous effect and the internal heat source of the fluid.
The heat–fluid–structure coupling is the interaction between the temperature field, the flow field, and the solid deformation field, but the fields do not actually overlap, so the data transfer needs to be carried out by means of a coupling interface. The most common method of heat–fluid–structure coupling is to analyze the flow field. The obtained results are transferred to the solid structural part through the coupling interface for analysis. The governing equation of heat–fluid–structure coupling is as follows:
The solid governing equations are derived from Newton’s second law:
ρsds = ▽·σs + fs
where ρs is the solid density (kg/m3), σs is the Cauchy stress tensor, fs is the body force vector, and ds is the local solid acceleration vector.
The heat–fluid–solid coupling equation follows the most basic conservation principle, which is to satisfy the equality or conservation of variables (stress, displacement, heat flow, temperature, etc.) between the fluid and the solid.
τf × nf = τs × ns
df = ds
qf = qs
Tf = Ts
Among them, the subscript f represents the fluid and the subscript s represents the solid.

2.3. Discretization Method

The physical model in this paper is divided into one solid domain and two fluid domains, all of which are divided by unstructured meshes. The maximum size of the global mesh is 10, and the maximum size of the tube bundle mesh setting is set to 8. The surface of the shell is refined and the maximum size is set to 5, and the bundle and shell are set to 5. The maximum size of the local refinement at the junction is set to 4, and the boundary layer is inserted near the walls of the two fluid domain mesh regions. The insertion method is total thickness and the growth rate is set to 1.1. Figure 2 shows the finite element meshing and local view of the superheater solid and fluid domains.
According to the size of the model structure, three different numbers of grids are selected for sensitivity calculation by adjusting the maximum size of the grid, and the number of grids is divided into 2.5, 2.96, and 3.5 million. The grid independence verification and sensitivity analysis are carried out, and the results are shown in Figure 3. The calculation results of the three quantitative grid models show that the relative deviation range of the average surface heat transfer coefficient is reasonable. The simulation calculation is carried out to determine that the number of grids is 2.96 million. The mesh model of the model has reached the requirement of mesh independence, of which the number of solid domain meshes is about 480,000, the number of pipe-side fluid domain meshes is about 1.09 million, and the number of shell-side fluid domain meshes is about 1.39 million.

2.4. Setting of Boundary Conditions

The contact surface between the fluid domain and the heat exchanger on the tube side and the shell side is set as the fluid–solid coupling interface, the molten salt is the liquid phase and the no-slip boundary condition is set, the water vapor is the vapor phase with slip, and the inlet boundary of the fluid domain is calculated. It is set as a continuous velocity inlet, the outlet is a pressure outlet, and the wall adopts a standard wall function. After the continuous phase is stabilized, the molten salt and water vapor flow and exchange heat. The fluid on the tube side of the heat exchanger flows horizontally from right to left. The fluid on the shell side of the heat exchanger moves from top to bottom, and the standard k-ε turbulence model is selected as the turbulence model. In static structures, the contact surface between the heat exchanger and the fluid domain is set as the coupling surface, the pressure load and temperature load are imported, the fixed constraints at the flange are added, and the remaining surfaces are free surfaces. The inlet and outlet parameters of the superheater are shown in Table 3.

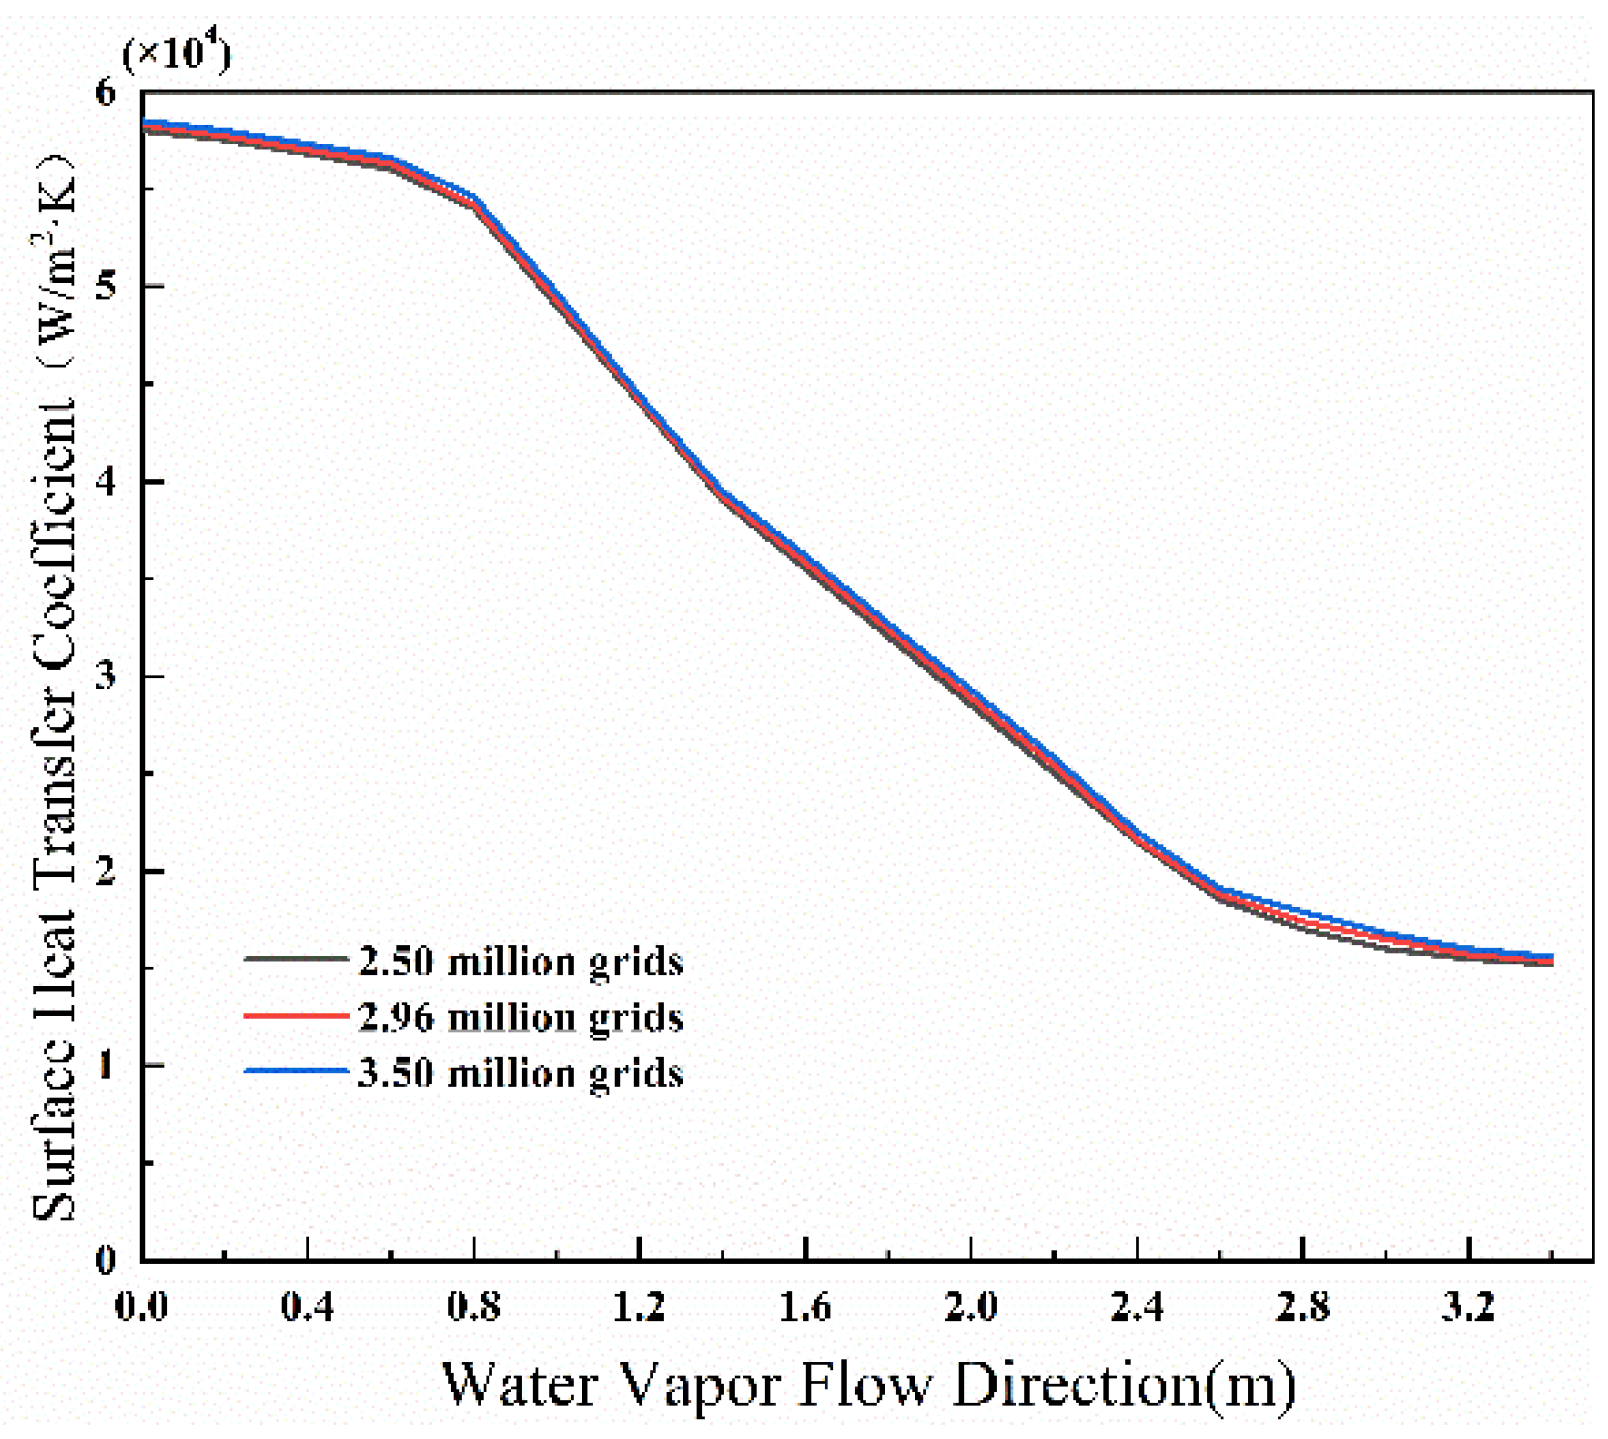
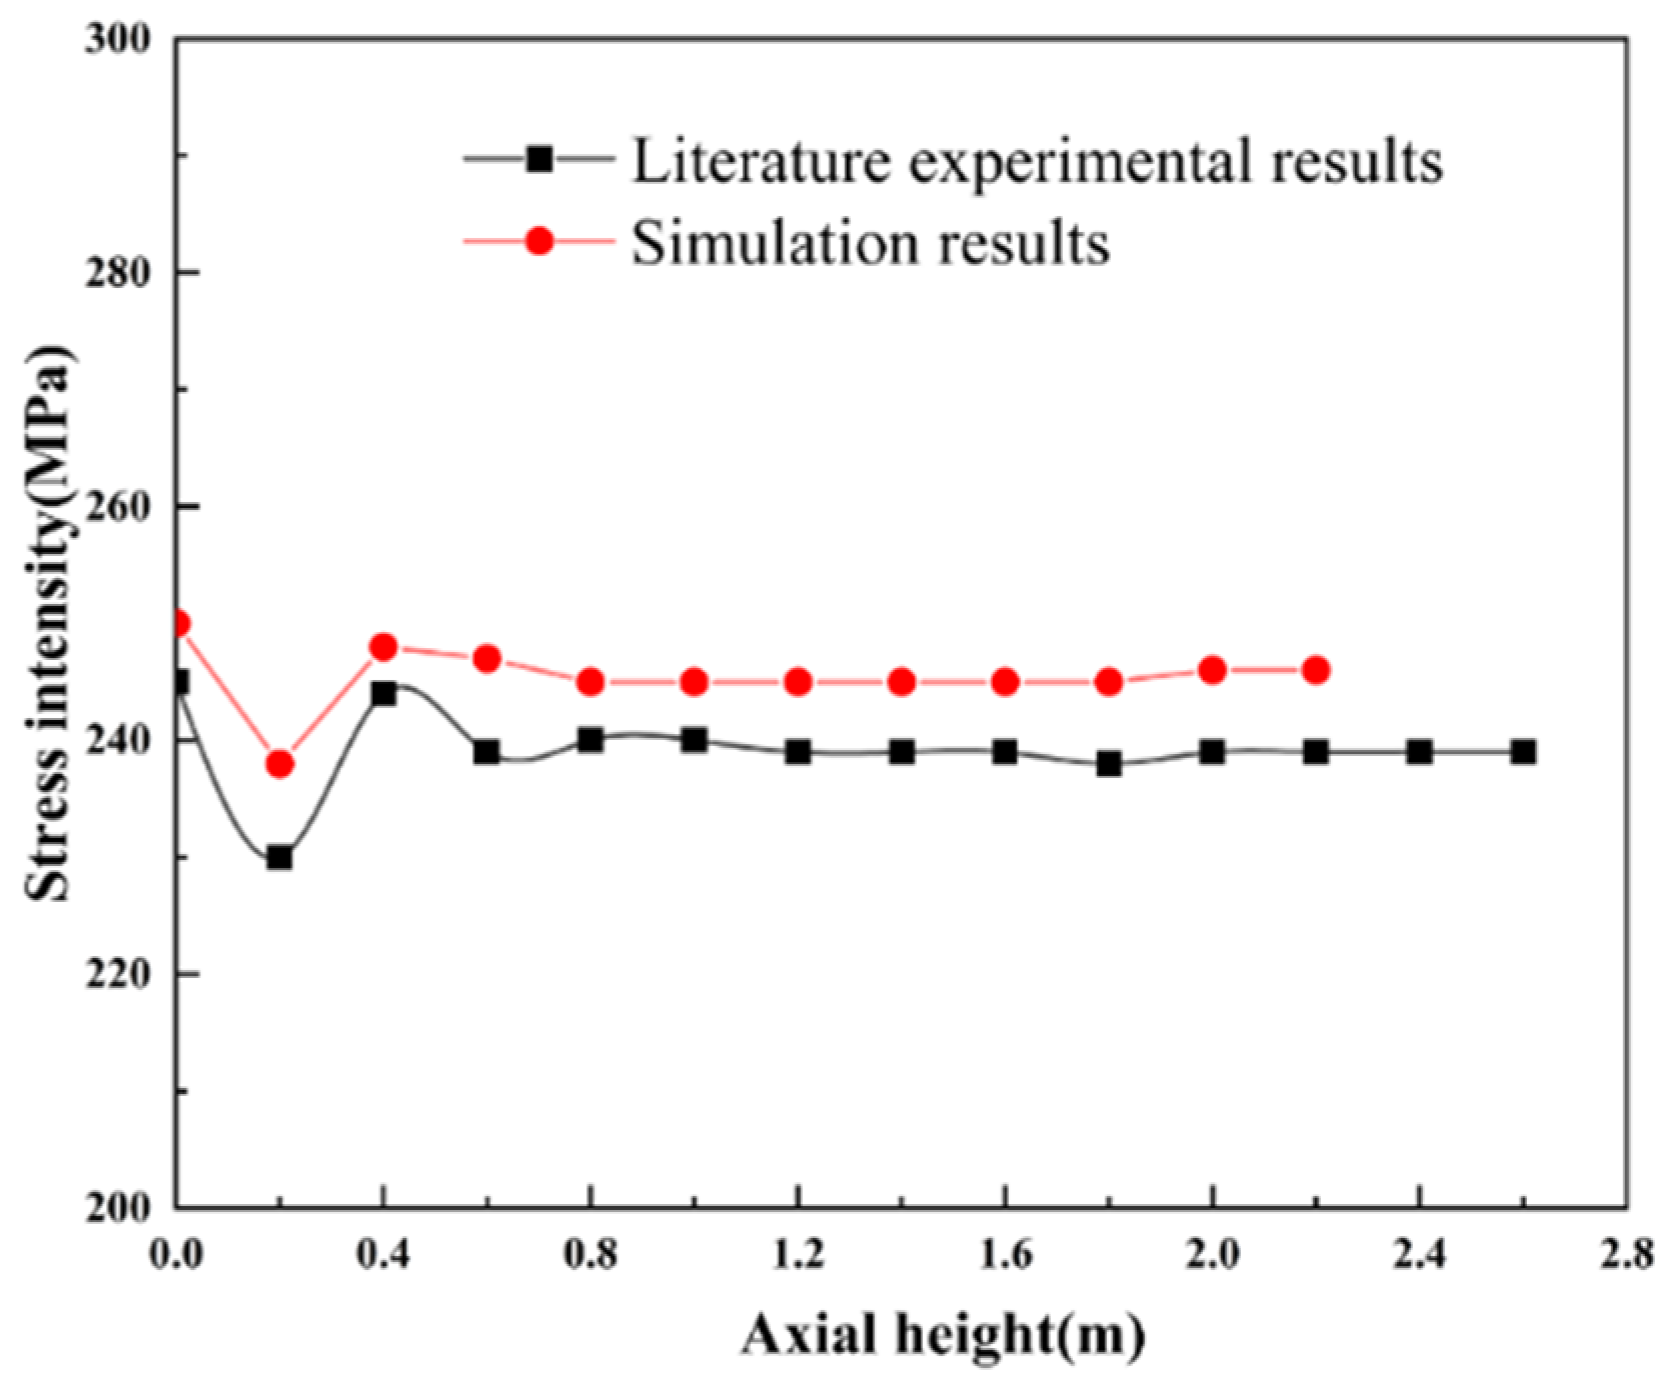
2.5. Accuracy Verification of the Model

The temperature accuracy of the model is verified. Simulation verification is carried out according to the existing 50 MW molten salt trough CSP plant steam generation system parameters (the molten salt inlet temperature of the superheater is 550 °C, the water vapor inlet temperature is 360 °C, the reheater melting temperature is 360 °C, the salt inlet temperature is 550 °C, and the water vapor inlet temperature is 310 °C). For calculating the superheater and reheater under stable operating conditions, the simulation results are shown in Figure 4. Compared with the water vapor temperature and molten salt temperature at the outlet of the superheater of the 50 MW molten salt trough CSP station, the error is less than 3%. The temperature meets the requirements.
In order to verify the correctness of the numerical model and the stress intensity of the numerical method, this paper simulates the process of heat exchange between the flue gas and the air flow in the fixed tube sheet heat exchanger in the literature. As shown in Figure 5, the trend relationship of the stress intensity along the tube bundle axial height change, the simulation results are consistent with the literature results. The maximum deviation between the superheater model and the simulation results is 4.5%, and the deviation range is less than 5%, indicating that the numerical simulation method in this paper is feasible.

3. Results and Discussion

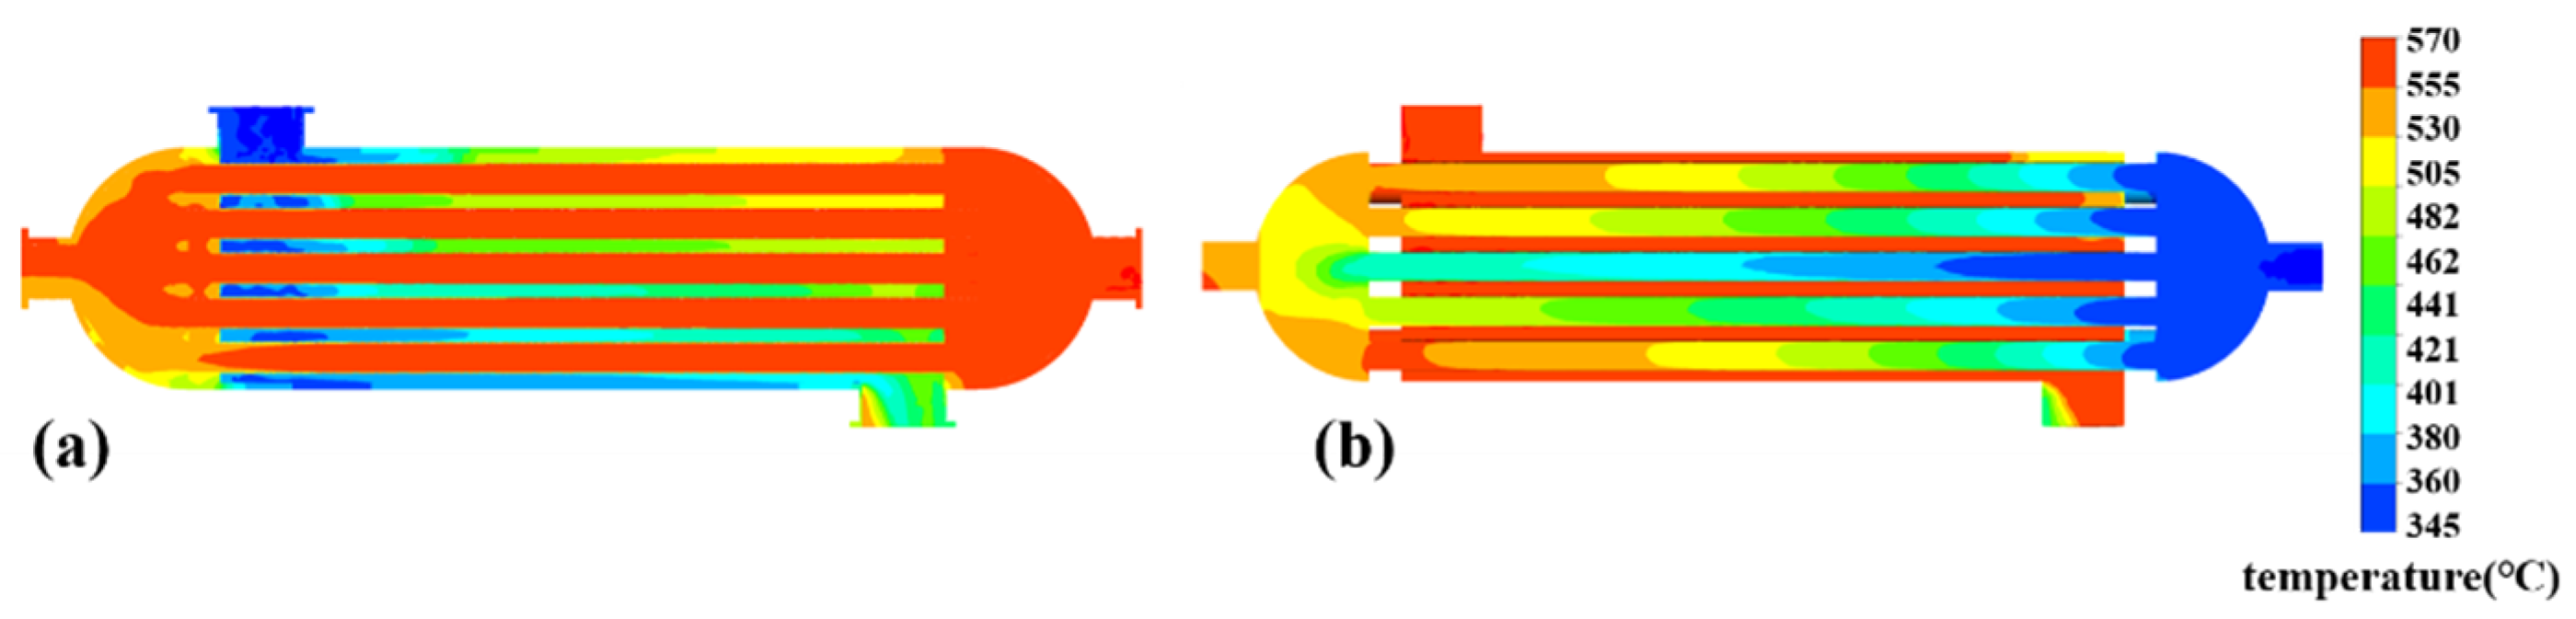
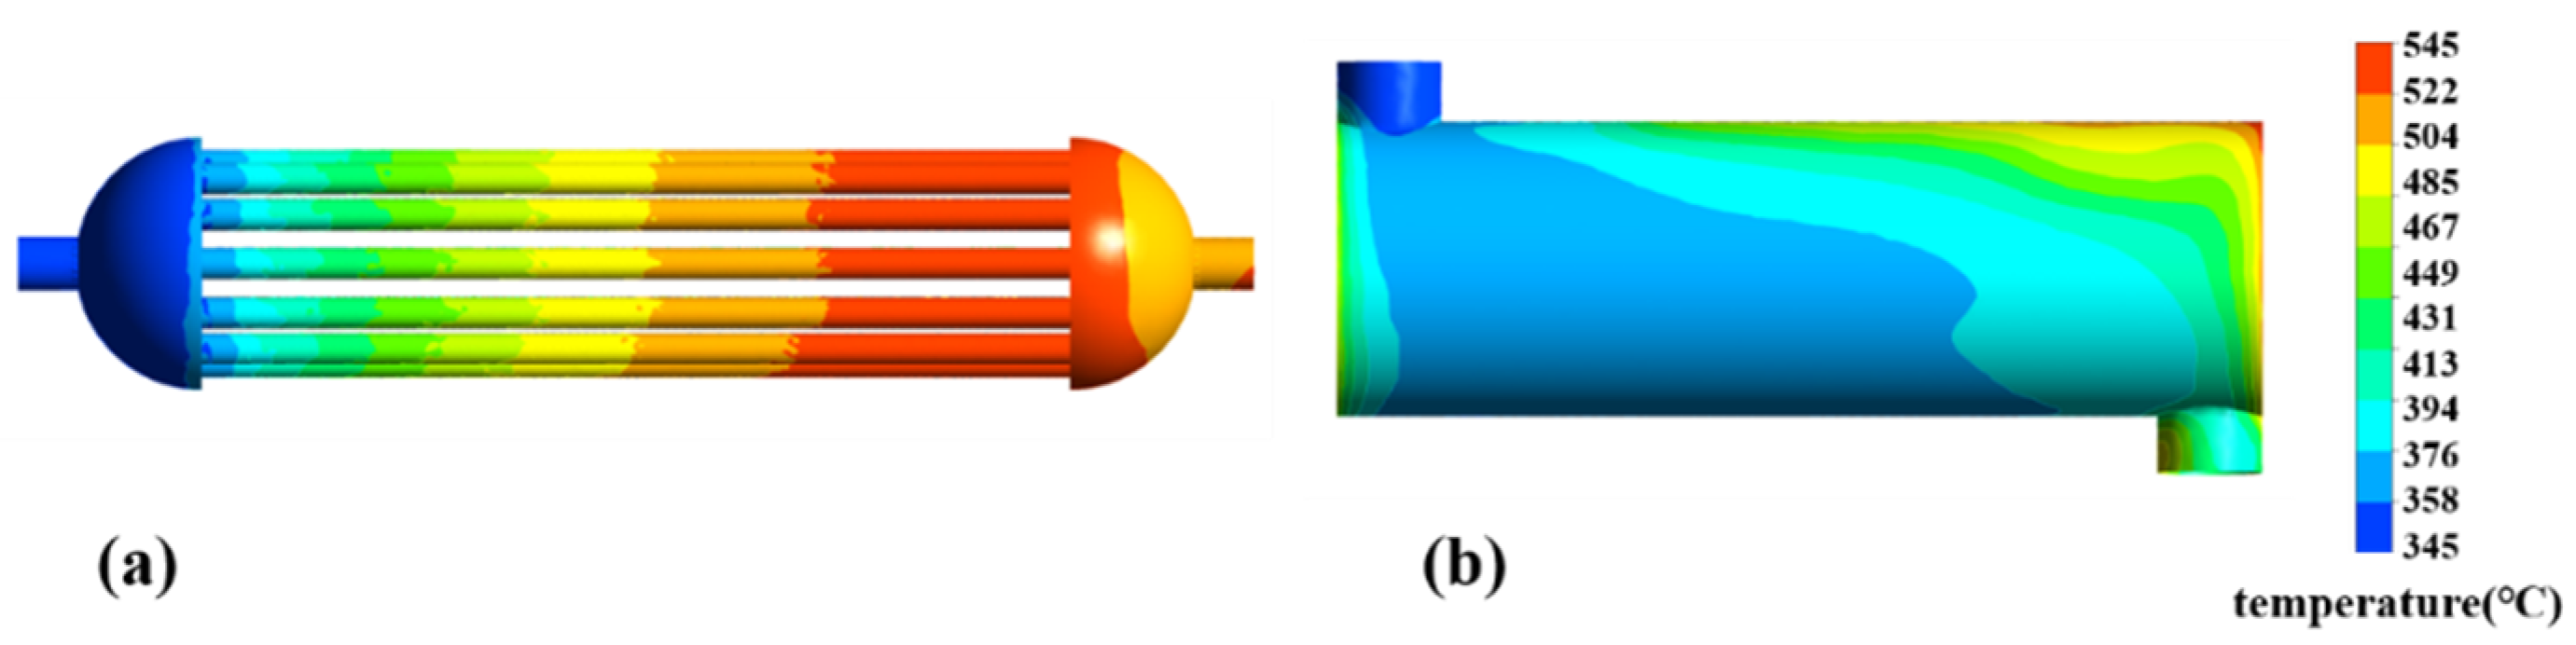
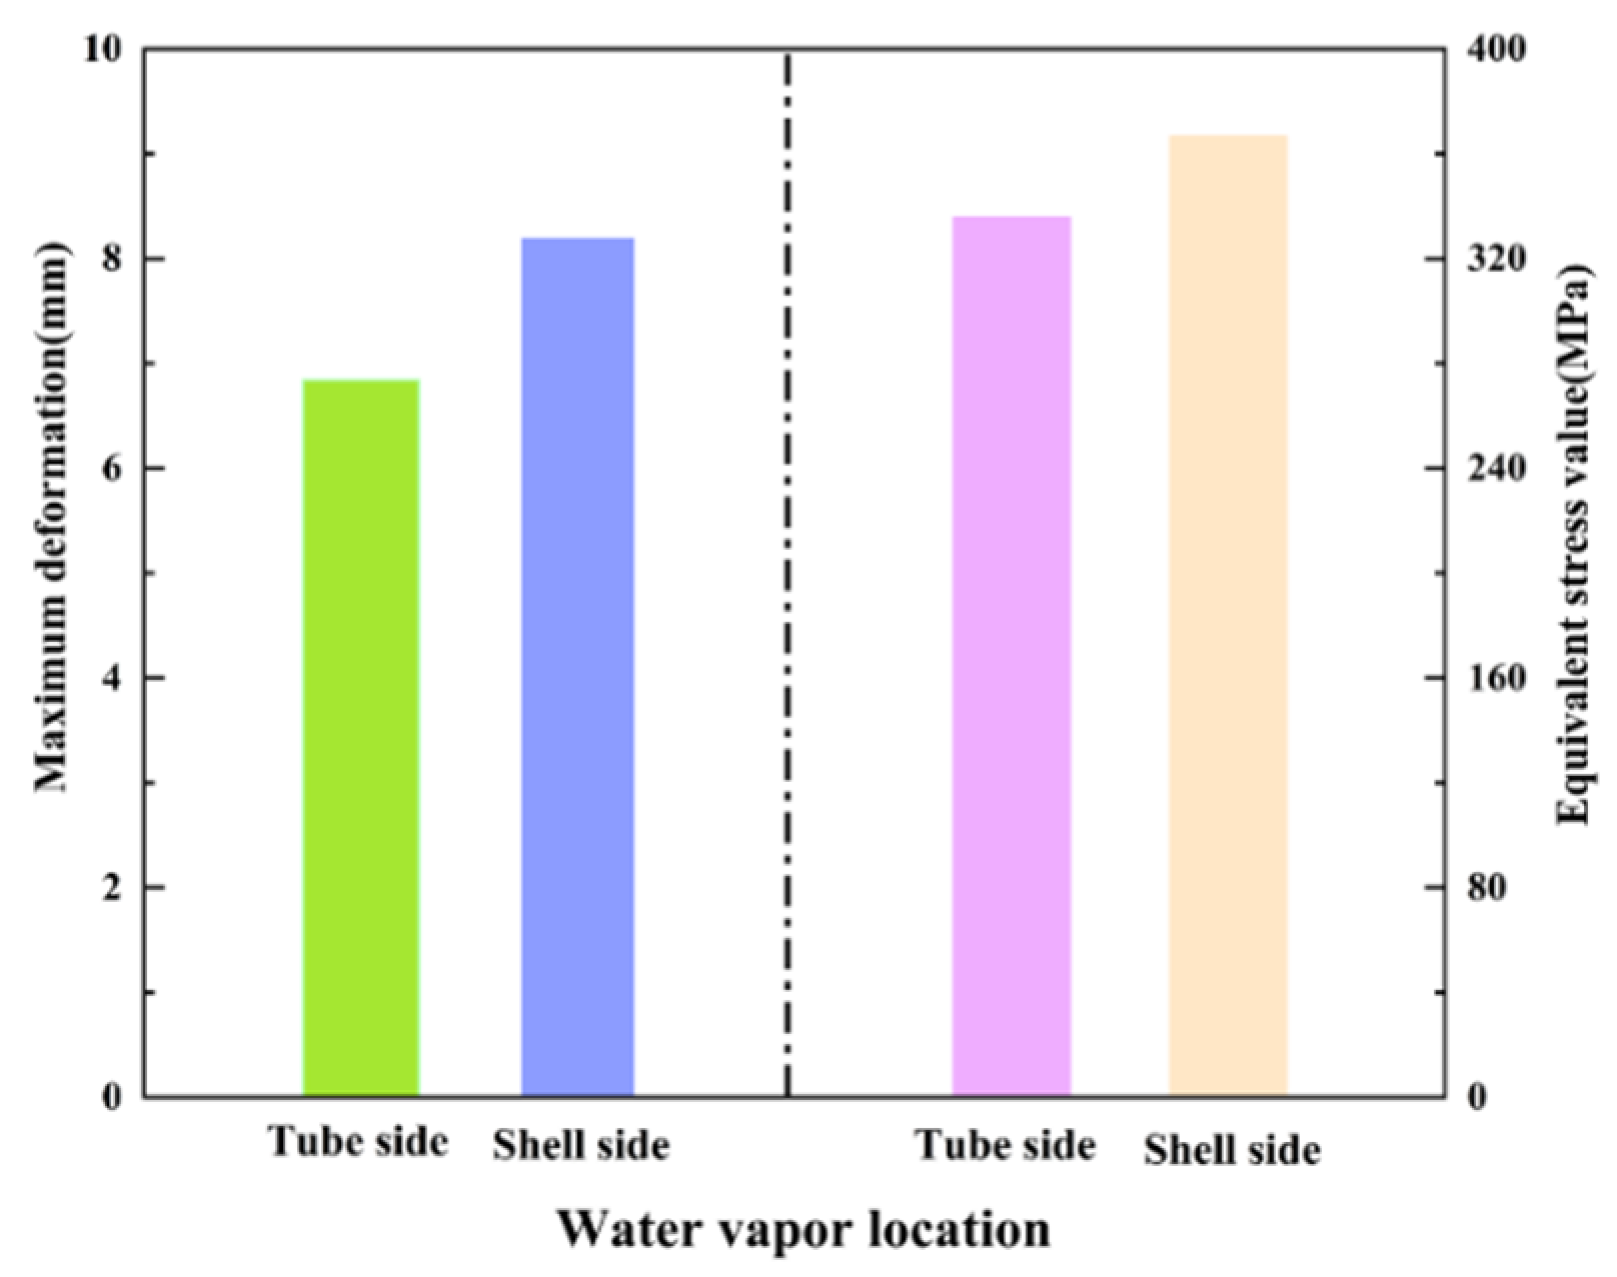
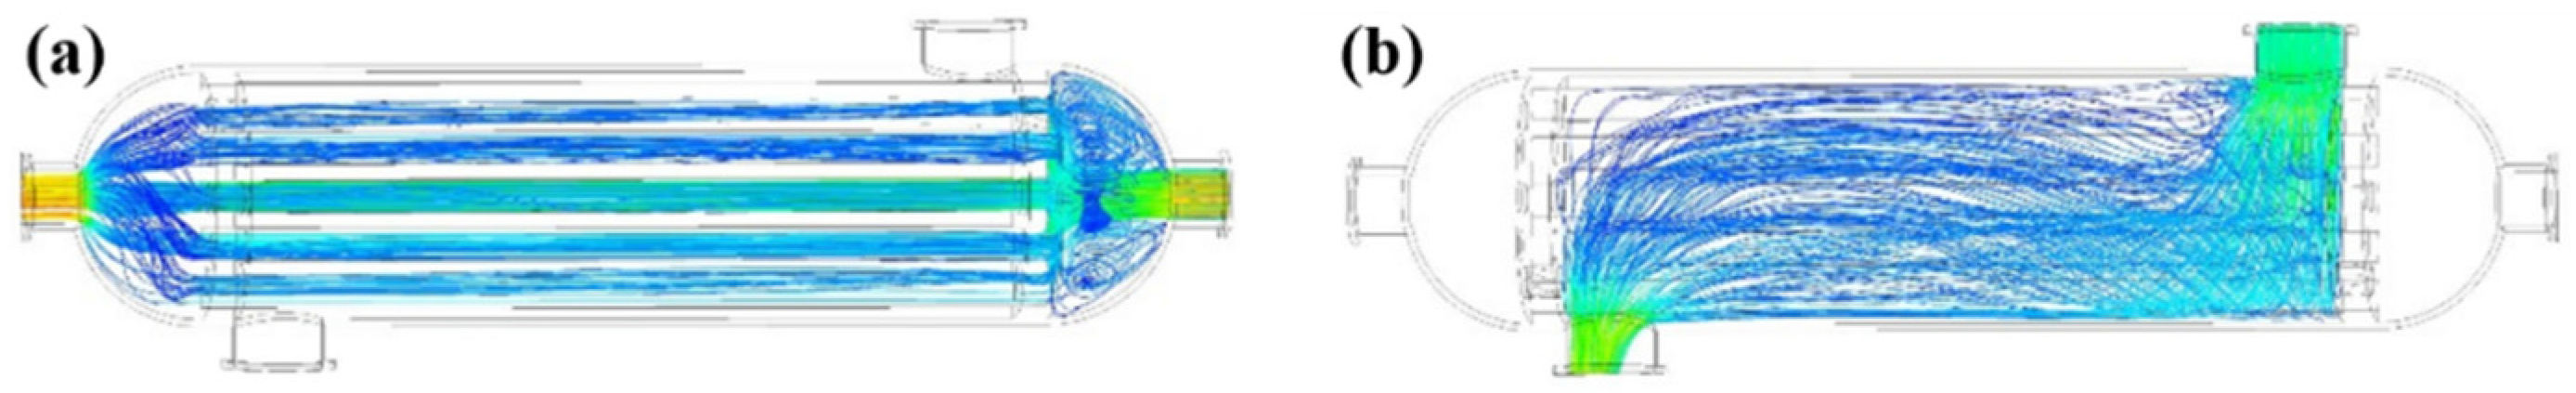
3.1. Influence of Working Fluid Flow Position on Heat Exchange Efficiency and Stress Distribution Characteristics of Heat Exchanger

The locations of molten salt and water vapor inside the superheater directly affect the heat exchange efficiency of the heat exchanger. Due to the large difference in specific heat capacity between water vapor and molten salt, the heat transfer coefficients of their surfaces and the heat exchanger shell are different. Therefore, if the water vapor is located on the tube side or the shell side, it affects the heat exchange effect of the heat exchanger. The flow and heat transfer efficiency of the working fluid (water vapor and molten salt) in the reactor and the heat exchange efficiency and the influence of the thermal field are studied. The temperature distributions of molten salt and water vapor at different positions inside the heat exchanger are shown in Figure 6.
The cloud map of the deformation distribution of the superheater shown in Figure 7 is when the molten salt is located on the tube side under the stable operation conditions of the superheater.
Under stable operating conditions, when the molten salt and water vapor in the superheater are located at different positions, the inlet and outlet parameters of the heat transfer medium on the tube side and the shell side are summarized in Table 4.
From Table 4 and Figure 8, it can be known that, taking the superheater as an example, when the inlet temperature of the working fluid on the molten salt side and the water vapor side is the same as the inlet flow rate and the water vapor is located on the superheater tube side, the outlet temperature of the molten salt (superheater: 477 °C) is higher than the outlet temperature of the molten salt when the water vapor is on the shell side (superheater: 446 °C), while the outlet temperature of the water vapor is just the opposite. However, the temperature decreases, which cannot meet the requirements of the steam turbine for water. Inlet temperature standard for steam is 540 °C. Through theoretical calculation, the physical parameters of molten salt and water vapor are substituted, and it can be directly seen that the heat exchange efficiency (86.7%) of the superheater when the water vapor is located on the shell side compared with that when the water vapor is located on the tube side (94.2%) decreases.
The heat exchange efficiency drop of the heat exchanger is analyzed when the molten salt is on the tube side and the water vapor is on the shell side. The temperature distribution cloud diagram of the water vapor working medium is shown in Figure 9.
It can be clearly seen from Figure 9 that when the water vapor is on the tube side, it can exchange heat with the molten salt faster and achieve a better thermal insulation effect in the later stage of the superheater so that the outlet temperature of the water vapor can reach the inlet temperature of the steam turbine. It can be seen from Figure 9 that when the water vapor is located on the side of the superheater tube bundle, the temperature gradient distribution of the water vapor is relatively uniform and the outlet temperature can meet the inlet temperature requirements of the steam turbine. When the water vapor is on the shell side, the temperature gradient from the inlet to the outlet of the superheater shell side is large, and the heat transfer effect is low. Therefore, in order to improve the heat exchange efficiency of the heat exchanger and the thermal economy of the entire steam generation system, reduce the cost of the external heat preservation measures of the superheater, and make the steam outlet temperature meet the inlet temperature requirements of the steam turbine, it is necessary to have molten salt on the shell side and water vapor on the tube side.
As shown in Figure 10, under the same operating conditions and working conditions, when the molten salt is located on the shell side, the average equivalent stress on the heat exchanger is reduced (366.33 → 338.81 MPa) compared with that of the molten salt located on the tube side. The maximum deformation of the heat exchanger is reduced. Although the positions of the molten salt and the water vapor make the stress distribution of the heat exchanger different, the maximum stress value and the maximum deformation amount occur at the tube bundle position and flange connection. In terms of the heat exchange efficiency of the heat exchanger and the safety of the whole unit, it is the best choice that the molten salt is located on the shell side of the heat exchanger and the water vapor is located on the tube side of the heat exchanger in the superheater.

3.2. Influence of Inlet Temperature on Heat Exchange Efficiency and Stress Distribution Characteristics of Heat Exchanger

When studying the effect of the inlet temperature of the steam working medium on the temperature field of the heat exchanger and the heat exchange efficiency of the heat exchanger, the working fluid on the tube side is steam and the working fluid on the shell side is molten salt. The research obtained parameters such as the inlet and outlet temperatures of the tube side and the shell side of the heat exchanger and the heat exchange efficiency of the heat exchanger under different inlet temperatures of the steam working medium, as shown in Table 5.
It can be seen in Table 5 that when the inlet temperature of the molten salt side is fixed at 563 °C, changing the inlet temperature of water vapor can obtain different outlet temperatures of molten salt and water vapor working fluid. As can be seen from Figure 11, with the increase in the inlet temperature of water vapor, the temperature difference of heat exchange between water vapor and molten salt continues to decrease, so that the outlet temperature of molten salt also increases and the outlet temperature of water vapor also increases accordingly. However, when the outlet temperature of water vapor reaches the inlet temperature requirement of the steam turbine and the inlet temperature of water vapor is increased again, the outlet temperature of water vapor does not change much, but the outlet temperature of molten salt increases significantly. It can be seen from Figure 11 that the heat exchange efficiency decreases with the increase in the inlet temperature of water vapor, especially when the water vapor outlet temperature of the superheater exceeds 540 °C, where the heat exchange efficiency of the superheater decreases significantly.
Therefore, appropriately reducing the inlet temperature of water vapor can improve the heat exchange efficiency of the superheater, but the outlet temperature of water vapor and the inlet temperature requirements of the steam turbine should be considered comprehensively. The steam inlet temperature of the superheater is 340–350 °C.
Since the molten salt working fluid belongs to the heating side of the heat exchanger, the temperature of the working fluid is higher than the temperature of water vapor, which has a greater impact on the thermal stress inside the heat exchanger. The effect of stress distribution characteristics and the distribution cloud map of the heat exchanger deformation amount under different molten salt inlet temperature are shown in Figure 12. A summary of the average equivalent stress inside the heat exchanger with different molten salt inlet temperatures and the maximum deformation of the heat exchanger is shown in Figure 13.
It can be clearly seen from Figure 12 that the position where the superheater deforms the most is at the inlet shell of the superheater, where the temperature difference is the largest and the stress value is the largest. The location where the maximum deformation occurs remains unchanged. Due to the large thermal expansion coefficient of the heat exchanger tube bundle, the tube shell and tube sheet material, and the uneven wall temperature, the inlet temperature of the molten salt has a greater impact on the stress distribution characteristics of each part of the heat exchanger. It can be seen from Figure 13 that within a certain range, the average equivalent stress value of the heat exchanger increases with the increase in the molten salt inlet temperature so that the maximum deformation amount that occurs increases with the increase in the molten salt inlet temperature.

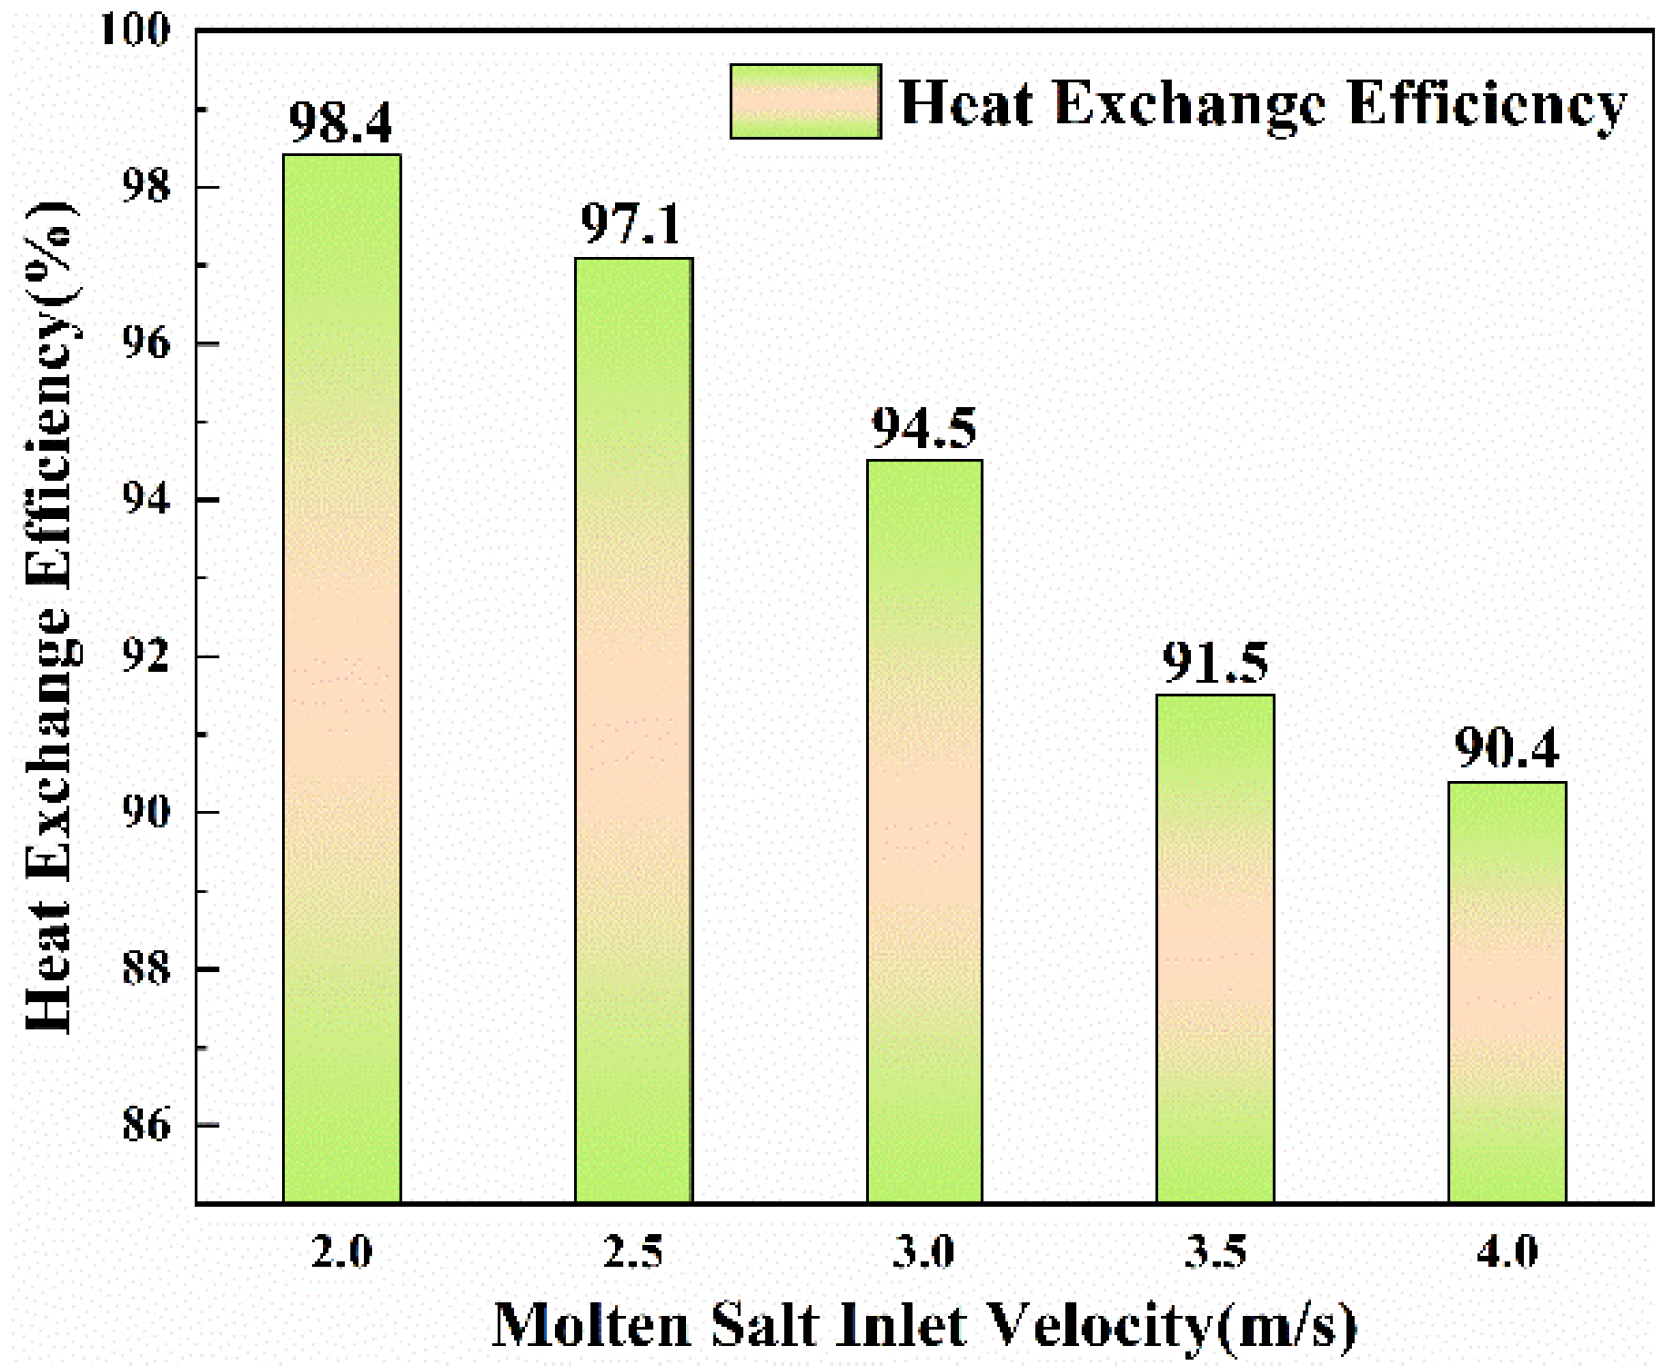
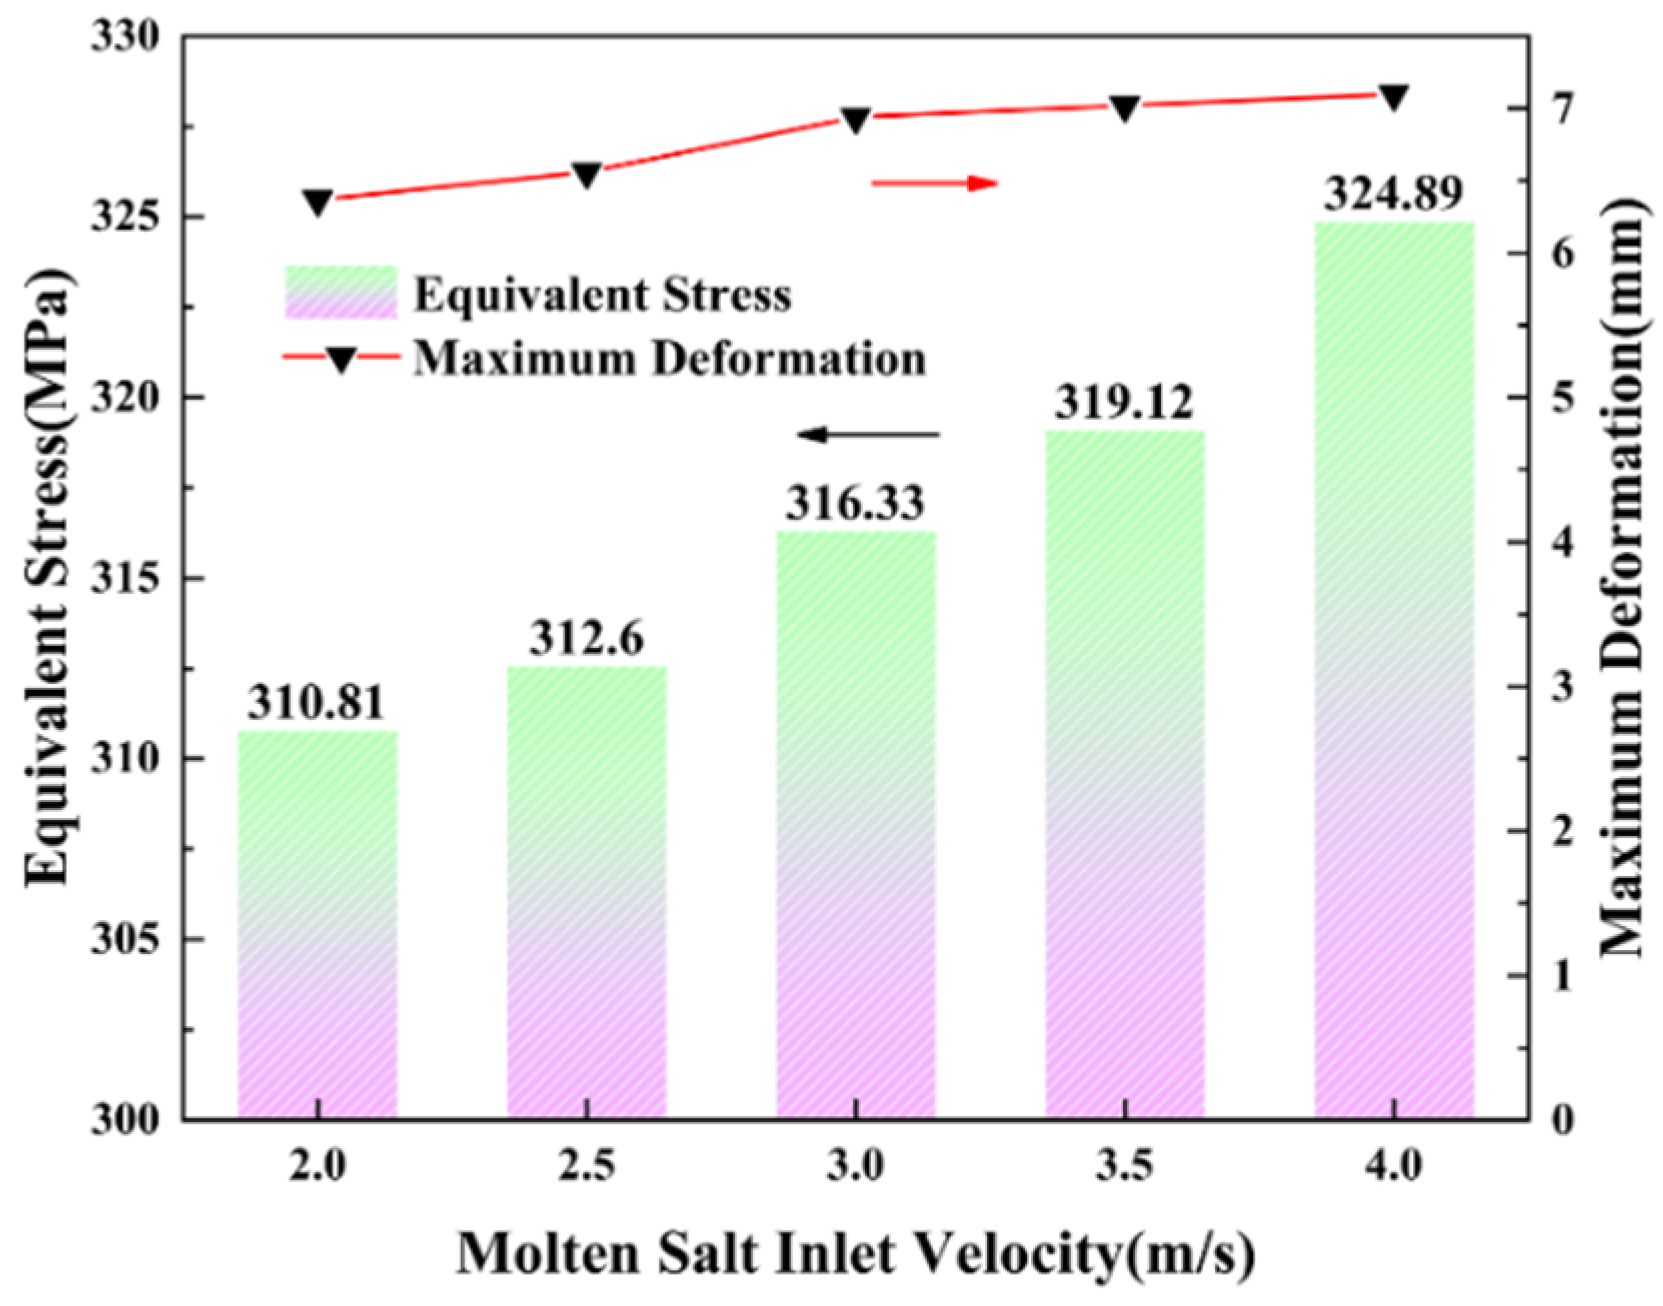
3.3. Influence of Inlet Flow Rate on Heat Exchange Efficiency and Stress Distribution Characteristics of Superheater

Due to the limitations of the physical properties of the molten salt itself, the inlet velocity cannot be too low; otherwise, molten salt deposition occurs, which causes the molten salt side of the heat exchanger and the interior of the molten salt connecting pipeline to block. The molten salt flow rate in the molten salt pipeline is generally not required to be too low, but due to the gravity factor and the existence of the variable cross-section pipeline, the flow rate of the molten salt can be slightly reduced at the entrance of the heat exchanger and the molten salt can be realized inside the heat exchanger. The acceleration of the working medium and the outlet speed of the molten salt side of the heat exchanger can meet the requirements.
Figure 14 is a diagram of the internal streamline distribution of the superheater when the inlet flow rate of the molten salt working medium is 2.5 m/s and the inlet flow rate of water vapor is 25.5 m/s.
When the positions of molten salt and water vapor remain unchanged and the inlet temperature of the working medium is the same, different inlet flow rates of the working medium have different effects on the flow field inside the superheater, different flow rates make the flow rate of the working medium different, and the temperature at the outlet of the superheater and the heat exchange temperature difference change accordingly, which affects the heat exchange efficiency. The summary of the inlet and outlet parameters of the heat exchanger under different inlet flow rates of the molten salt working medium is Table 6.
As can be seen from Figure 15, on the premise that the molten salt flow rate requirements are met, with the increase in the molten salt flow rate, the outlet temperature of the molten salt increases, and the change with the flow rate is close to a linear relationship. With the increase in the flow rate, the outlet temperature of the water vapor also increases, but when the outlet temperature of the water vapor reaches 545 °C, the change in the flow rate at the inlet of the molten salt has little effect on the change in the outlet temperature of the water vapor. It can be seen from Figure 15 that the increase in the molten salt flow rate reduces the heat exchange efficiency, but when the molten salt flow rate is less than 2.5 m/s, the change in the molten salt flow rate has little effect on the heat exchange efficiency and a relatively sufficient exchange rate can be obtained. However, when the molten salt flow rate exceeds 3.0 m/s, due to the limitation of the molten salt working temperature range and the fixed molten salt inlet temperature, the outlet temperature of the water vapor does not change much, resulting in a rapid decrease in the heat exchange efficiency. Therefore, the inlet velocity of molten salt can be set to 2.5–3.0 m/s.
It can be seen from Figure 16 that within a certain range, with the increase in the molten salt inlet flow, the maximum stress value of the heat exchanger gradually increases. The average equivalent stress value at the molten salt inlet also increases, but the maximum deformation of the heat exchanger does not change significantly. Since the inlet temperature and outlet temperature of molten salt and water vapor do not change much, the inlet temperature difference and outlet temperature difference between the tube side and the shell side do not change significantly, so the temperature difference gradient between the tube side and the shell side does not change significantly. The inlet pressure difference on the shell side remains unchanged, and the outlet pressure difference does not change significantly. Therefore, with the increase in the inlet flow rate of molten salt, the average equivalent stress value and the maximum deformation amount experienced by the heat exchanger do not increase significantly. That is, the stress distribution characteristic of the heat exchanger is less affected by the flow rate of the molten salt inlet than the inlet temperature of the working medium.

4. Conclusions

The method of numerical calculation is used to conduct numerical simulation research on the fluid domain and solid domain in a heat exchanger based on heat–fluid–solid coupling. The thermal stress distribution of the heat exchanger under different working conditions is studied, and the optimal inlet and outlet parameters of the superheater are obtained, which improves the efficiency of the heat exchanger, the safety of the steam generation system, and the thermal economy. A theoretical basis and guidance for the design and optimization of the steam generation system are provided. The main conclusions are as follows:
(1) The positions and flow modes of the molten salt working medium and the water vapor working medium inside the heat exchanger affect the heat exchange efficiency and stress distribution characteristics of the heat exchanger. The flow position of the molten salt working medium should be the shell side, and the flow position of the water vapor working medium should be the tube side. When the molten salt is on the shell side of the superheater, the heat exchanger efficiency (94.2%) is higher than that when the molten salt is on the tube side (86.7%), and the maximum deformation is increased from 6.84 to 8.12 mm.
(2) The change in the molten salt inlet temperature has an impact on the heat exchange efficiency and stress distribution characteristics of the heat exchanger. The variables increase accordingly, especially when the water vapor outlet temperature exceeds 545 °C, and the heat exchange efficiency decreases significantly. Under stable working conditions, the outlet temperature meets the intake air requirements of the steam turbine and the heat exchange efficiency is improved from 94.2% to 95.8%, which is 1.6% higher than that under the stable working condition.
(3) The inlet flow rates of molten salt and water vapor affect the heat exchange efficiency of the heat exchanger. The increase in the molten salt flow rate reduces the heat exchange efficiency of the heat exchanger. However, the impact on the equivalent stress characteristics and deformation variable distribution of the superheater is small and the stress distribution characteristics of the superheater are less affected by the flow rate of the molten salt inlet than the inlet temperature of the working medium. When the molten salt inlet temperature is 563 °C, the water vapor inlet temperature is 340 °C, and the molten salt inlet velocity of the superheater should be 2.5 m/s. The heat exchange efficiency can be improved by 2.9% compared to the superheater and the referenced stable condition, and the equivalent stress value is reduced from 335.63 to 312.60 MPa.

Author Contributions

Conceptualization and writing—original draft preparation, Y.Z.; methodology and software, G.C.; validation, W.W.; formal analysis, C.X.; investigation, J.H. and J.W.; supervision and project administration, Z.Y. All authors have read and agreed to the published version of the manuscript.

Funding

This research received no external funding.

Institutional Review Board Statement

This article does not involve animal experiments and does not need to be reviewed.

Informed Consent Statement

Not applicable.

Data Availability Statement

Not applicable.

Conflicts of Interest

The authors declare no conflict of interest.

References

  1. Ouali, H.A.L.; Moussaoui, M.A.; Mezrhab, A.; Naji, H. Comparative Study Between Direct Steam Generation and Molten Salt Solar Tower Plants in the Climatic Conditions of the Eastern Moroccan Region. Int. J. Renew. Energy Dev. 2020, 9, 287–294. [Google Scholar] [CrossRef]
  2. Dong, X.; Bi, Q.; Yao, F. Experimental investigation on the heat transfer performance of molten salt flowing in an annular tube. Exp. Therm. Fluid Sci. 2019, 102, 113–122. [Google Scholar] [CrossRef]
  3. He, C.; Lu, J.; Ding, J.; Wang, W.; Yuan, Y. Heat transfer and thermal performance of two-stage molten salt steam generation system. Appl. Energy 2017, 204, 1231–1239. [Google Scholar] [CrossRef]
  4. Yuan, Y.; He, C.; Lu, J.; Ding, J. Thermal performances of molten salt steam generator. Appl. Therm. Eng. 2016, 105, 163–169. [Google Scholar] [CrossRef]
  5. Al-Kouz, W.; Almuhtady, A.; Abu-Libdeh, N.; Nayfeh, J.; Boretti, A. A 140 MW Solar Thermal Plant in Jordan. Processes 2020, 8, 668. [Google Scholar] [CrossRef]
  6. Rajeh, T.; Al-Kbodi, B.H.; Zhang, H.L. Thermal Stress and Deformation of Hollow Paddle-Shaft Components with Internal High Temperature Molten Salt Flow. Processes 2020, 8, 1557. [Google Scholar] [CrossRef]
  7. Fukuda, K.; Yu, K.; Someya, T. The Future of Flexible Organic Solar Cells. Adv. Energy Mater. 2020, 10, 2000765. [Google Scholar] [CrossRef]
  8. Augspurger, M.; Becker, J.; Buchholz, J.; Udaykumar, H.S. Three-dimensional numerical and experimental investigation of the behavior of solar salts within thermal storage devices during phase change. Appl. Therm. Eng. 2018, 143, 791–811. [Google Scholar] [CrossRef]
  9. Li, H.R.; Long, E.S.; Zhang, Y.; Yang, H.Y. Operation strategy of cross-season solar heat storage heating system in an alpine high-altitude area. Indoor Built Environ. 2020, 29, 1249–1259. [Google Scholar] [CrossRef]
  10. Jiaqiang, E.; Han, D.D.; Deng, Y.W.; Zuo, W.; Qian, C.; Wu, G.; Peng, Q.G.; Zhang, Z.Q. Performance enhancement of a baffle-cut heat exchanger of exhaust gas recirculation. Appl. Therm. Eng. 2018, 134, 86–94. [Google Scholar] [CrossRef]
  11. He, Z.Q.; Yan, Y.F.; Zhao, T.; Feng, S.; Li, X.Q.; Zhang, L.; Zhang, Z.E. Heat transfer enhancement and exergy efficiency improvement of a micro combustor with internal spiral fins for thermophotovoltaic systems. Appl. Therm. Eng. 2021, 189, 116723. [Google Scholar] [CrossRef]
  12. Jiaqiang, E.; Luo, B.; Han, D.D.; Chen, J.W.; Liao, G.L.; Zhang, F.; Ding, J.J. A comprehensive review on performance improvement of micro energy mechanical system: Heat transfer, micro combustion and energy conversion. Energy 2022, 239, 1225509. [Google Scholar] [CrossRef]
  13. Ferri, R.; Cammi, A.; Mazzei, D. Molten salt mixture properties in RELAP5 code for thermodynamic solar applications. Int. J. Therm. Sci. 2008, 47, 1676–1687. [Google Scholar] [CrossRef]
  14. Huang, Z.; Zou, Y.; Ding, J.; Lu, J. Experimental investigation of heat transfer in coiled tube type molten salt steam generator. Appl. Therm. Eng. 2019, 148, 1131–1138. [Google Scholar] [CrossRef]
  15. Sun, Z.; Zhu, J.; Zhou, W.; Cheng, X.; Zhu, J. Numerical Simulation on Heat Transfer Enhancement of Phase Change Thermal Storage Devices for Low-middle Temperature. J. Wuhan Univ. Technol. Mater. Sci. Ed. 2016, 31, 799–804. [Google Scholar] [CrossRef]
  16. Saijal, K.K.; Danish, T. Design optimization of a shell and tube heat exchanger with staggered baffles using neural network and genetic algorithm. Proc. Inst. Mech. Eng. Part C J. Mech. Eng. Sci. 2021, 235, 5931–5946. [Google Scholar] [CrossRef]
  17. Sameer, S.; Prakash, S.B.; Swamy, G.N. Effectiveness study in shell and tube heat exchanger at various concentrations of CuO nanofluid for parallel flow. Proc. Inst. Mech. Eng. Part C J. Mech. Eng. Sci. 2021, 235, 7951–7962. [Google Scholar] [CrossRef]
  18. Qian, X.J.; Lee, S.W.; Yang, Y.L. Heat Transfer Coefficient Estimation and Performance Evaluation of Shell and Tube Heat Exchanger Using Flue Gas. Processes 2021, 9, 939. [Google Scholar] [CrossRef]
  19. Fanelli, E. CFD Hydrodynamics Investigations for Optimum Biomass Gasifier Design. Processes 2020, 8, 1323. [Google Scholar] [CrossRef]
  20. He, Z.Q.; Yan, Y.F.; Li, X.Q.; Shen, K.M.; Li, J.N.; Zhang, Z.E. Comparative investigation of combustion and thermal characteristics of a conventional micro combustor and micro combustor with internal straight/spiral fins for thermophotovoltaic system. Int. J. Hydrogen Energy 2021, 46, 22165–22179. [Google Scholar] [CrossRef]
  21. You, Y.H.; Fan, A.W.; Luo, X.J.; Jin, S.P.; Liu, W.; Huang, S.Y. An investigation in the effects of recycles on laminar heat transfer enhancement of parallel-flow heat exchangers. Chem. Eng. Process. Process Intensif. 2013, 70, 27–36. [Google Scholar] [CrossRef]
  22. Liu, Q.; Cheng, S. Heat transfer and thermal deformation analyses of a copper stave used in the belly and lower shaft area of a blast furnace. Int. J. Therm. Sci. 2016, 100, 202–212. [Google Scholar] [CrossRef]
  23. Hendra, R.; Mahlia, T.M.I.; Masjuki, H.H. Thermal and melting heat transfer characteristics in a latent heat storage system using Mikro. Appl. Therm. Eng. 2005, 25, 1503–1515. [Google Scholar] [CrossRef]
  24. Sun, B.Z.; Yang, Y.L. Numerically investigating the influence of tube support plates on thermal-hydraulic characteristics in a steam generator. Appl. Therm. Eng. 2013, 51, 611–622. [Google Scholar] [CrossRef]
  25. Nithyanandam, K.; Pitchumani, R. Analysis and optimization of a latent thermal energy storage system with embedded heat pipes. Int. J. Heat Mass Transf. 2011, 54, 4596–4610. [Google Scholar] [CrossRef]
  26. Chu, I.C.; Chung, H.J.; Lee, S. Flow-induced vibration of nuclear steam generator U-tubes in two-phase flow. Nucl. Eng. Des. 2011, 241, 1508–1515. [Google Scholar] [CrossRef]
  27. Li, Y.J.; Yang, Y.L.; Sun, B.Z. Numerical investigation of thermal-hydraulic characteristics in a steam generator using a coupled primary and secondary side heat transfer model. Ann. Nucl. Energy 2013, 55, 258–264. [Google Scholar] [CrossRef]
Figure 1. Schematic diagram of the internal structure of the superheater of the steam generation system of the 50 MW trough molten salt CSP station.
Processes 10 01003 g001
Figure 2. Section and partial drawing of finite element meshing of heat exchanger.
Processes 10 01003 g002
Figure 3. Grid independence verification diagram.
Processes 10 01003 g003
Figure 4. The verification diagram of model.
Processes 10 01003 g004
Figure 5. Model verification of stress intensity distribution along the axial height.
Processes 10 01003 g005
Figure 6. The temperature distribution cloud diagram when the heat transfer working medium in the superheater is located at different positions. (a) Water vapor is on the shell side. (b) Water vapor is on the tube side.
Processes 10 01003 g006
Figure 7. Distribution cloud map of superheater deformation variable when water vapor is located at different positions. (a) The water vapor on the shell side. (b) The water vapor on the tube side.
Processes 10 01003 g007
Figure 8. Outlet temperature and heat exchange efficiency when the heat transfer working medium in the superheater is located at different positions.
Processes 10 01003 g008
Figure 9. Water vapor temperature distribution diagram when the heat transfer working medium in the superheater is located at different positions. (a) Water vapor is on the tube side. (b) Water vapor is on the shell side.
Processes 10 01003 g009
Figure 10. The average equivalent stress value and maximum deformation when the heat transfer working medium in the heat exchanger is located at different positions.
Processes 10 01003 g010
Figure 11. Heat exchanger efficiency change with steam inlet temperature.
Processes 10 01003 g011
Figure 12. Cloud diagram of superheater deformation distribution at different molten salt inlet temperatures. (a) 550 °C. (b) 560 °C. (c) 563 °C. (d) 570 °C. (e) 580 °C.
Processes 10 01003 g012
Figure 13. Maximum deformation and average equivalent stress values of heat exchangers with different molten salt inlet temperatures.
Processes 10 01003 g013
Figure 14. Streamline distribution diagram inside the superheater. (a) Steam flow line on the tube side. (b) Molten salt flow line on the shell side.
Processes 10 01003 g014
Figure 15. Changes in heat exchange efficiency of molten salt and steam at different flow rates.
Processes 10 01003 g015
Figure 16. Stress characteristics of heat exchangers with different molten salt inlet flow rates.
Processes 10 01003 g016
Table 1. Structural parameters of superheater in steam generation system of 50 MW trough molten salt solar thermal power station.
Heat Exchanger StructureQuantityLength (mm)Inside Diameter (mm)Outer Diameter (mm)Thickness (mm)Width (mm)
Shell1303072076020\
Tube bundle21227090984\
Tube sheet2\720\20\
header2\72076020\
Pipe-side connection214016219416\
Shell-side connection21402562738\
Flange4\\\1040
Table 2. Molten salt basic physical property parameters.
Molten Salt Physical Parameter (T/°C)Empirical Formula
Density ρ (kg/m3)ρ = 2085.4 − 0.6256T
Constant-Pressure Specific Heat Capacity cp (J/(kg·°C))cp = 1442.3 + 0.1736T
Thermal Conductivity k (W/(m·K))k = 0.443 + 0.00019T
Dynamic Viscosity μ (Pa·s)μ = 0.2241 − 1.2 × 10⁻⁴T + 2.166 × 10⁻⁷T2 − 1.376 × 10⁻¹⁰T3
Table 3. Superheater inlet parameters.
Import ParametersWater VaporMolten Salt
Inlet pressure (MPa)15.311.0
Inlet temperature (°C)360550
Inlet velocity (m/s)25.53.5
Table 4. Summary of inlet and outlet and stress distribution field parameters on the tube side and shell side of the heat exchanger.
ParameterSuperheater
Water Vapor LocationTube SideShell Side
Molten salt inlet temperature (°C)570
Molten salt outlet temperature (°C)446477
Water vapor inlet temperature (°C)345
Water vapor outlet temperature (°C)545527
Heat exchange efficiency (%)94.286.7
Equivalent stress (MPa)335.63366.33
Maximum deformation (mm)6.848.12
Note: heat exchange efficiency of heat exchanger = heat absorption of water vapor/heat release of molten salt.
Table 5. Summary of inlet and outlet temperatures on the tube side and shell side of the heat exchanger and the heat exchange efficiency of the heat exchanger.
Water Vapor Inlet Temperature (°C)Water Vapor Outlet Temperature (°C)Molten Salt Inlet Temperature (°C)Molten Salt Outlet Temperature (°C)Heat Transfer Efficiency (%)
30052356343098.3
31052656343397.6
32053256343597.1
33053556343896.1
34054156344095.8
35054556344193.7
36055256344291.6
Table 6. Heat exchanger inlet and outlet parameters and stress distribution characteristics under different molten salt flow rates.
Molten Salt Inlet Velocity (m/s)Water Vapor Inlet Temperature (°C)Heat Transfer Efficiency (%)Equivalent Stress (MPa)Maximum Deformation (mm)
2.041598.4310.816.37
2.544097.1312.686.46
3.045594.5316.336.94
3.546591.5319.127.02
4.047590.4324.897.10
Publisher’s Note: MDPI stays neutral with regard to jurisdictional claims in published maps and institutional affiliations.

