Abstract
Awareness of granulated soils’ internal instability is an important parameter when designing granulated filters, and the ability of a granulated soil’s internal stability can be verified using the soil PSD (Particle Size Distribution) curves’ secant slopes. The current work presents a new method to calculate the soil PSD curves’ secant slopes automatically, and a synthetic diagram is presented for the potential examination of the granulated soils’ internal stability. To verify the feasibility and accuracy of this synthetic diagram, 80 specimens of soil were investigated in this work and categorized into two groups: 50 sand–gravel soils and 30 (clay)–silt–sand–gravel soils. The obtained conclusions indicate that the internal stability and instability potentials of sand–gravel soils can be distinguished successfully with a synthetic chart and the Kenney and Lau criterion but cannot be assessed with the Kezdi and Sherard criteria. None of the criteria studied here can be used for the internal stability assessment of silt–sand–gravel and clay–silt–sand–gravel soils.
1. Introduction
Awareness of granulated soils’ internal instability is an important parameter when designing granulated filters [1,2,3,4]. Internal instability occurs in various forms and is expressed using various terms, namely suffusion and suffosion. The process by which the fine particles of internally unstable soils fall within the voids of coarse particles is called suffusion [5,6]. The deterioration or failure of some embankment dams is associated with suffusion [7,8]. The difference between suffusion and suffosion is described by Fannin and Slangen [9] and Zhou et al. [2]. Geometrical methods for evaluating potential internal instability based on particle size and constriction size distribution have been proposed.
The granulated soils’ internal stability is primarily monitored through its particle size distribution (PSD) [6,10] and is assessed with the soil PSD curves’ secant slopes. Three semi-empirical criteria have been predominantly employed for assessing the granulated soils’ internal stability: the Kezdi, Sherard, and Kenney and Lau criteria. The International Commission recognizes the first two criteria for large dams [11], and the Canadian Dam Association recognizes the third criterion [12]. The Kezdi, Sherard, and Kenney and Lau criteria are as follows:
(1) Kezdi [13] reported an experimental index ratio of for internal instability evaluation based on the classical retention criterion for granular filters. A threshold value to stability at was advocated. The granulated soil was assumed to be internally unstable if
In Equation (1), and denote the size of the particle, corresponding to 15% and 85% by weight of the coarse and fine fraction, respectively.
(2) Sherard [14] divided the particle size distribution into coarser and finer components, and a method analogous to the Kezdi criterion for widely graded and skip-graded materials was reported. The following internal instability index was reported:
where should be less than 5 for the internally stable soils. Otherwise, the soil is considered internally instable.
(3) Kenney and Lau [15] established an alternative index ratio , which can be applied to continuous (upward concave) and bimodal soil particle distribution curves. A granulated material can be assumed to be internally unstable if
In Equation (3), refers to the mass fraction of particles with a size less than , while refers to the incremental mass fraction acquired among particle sizes and .
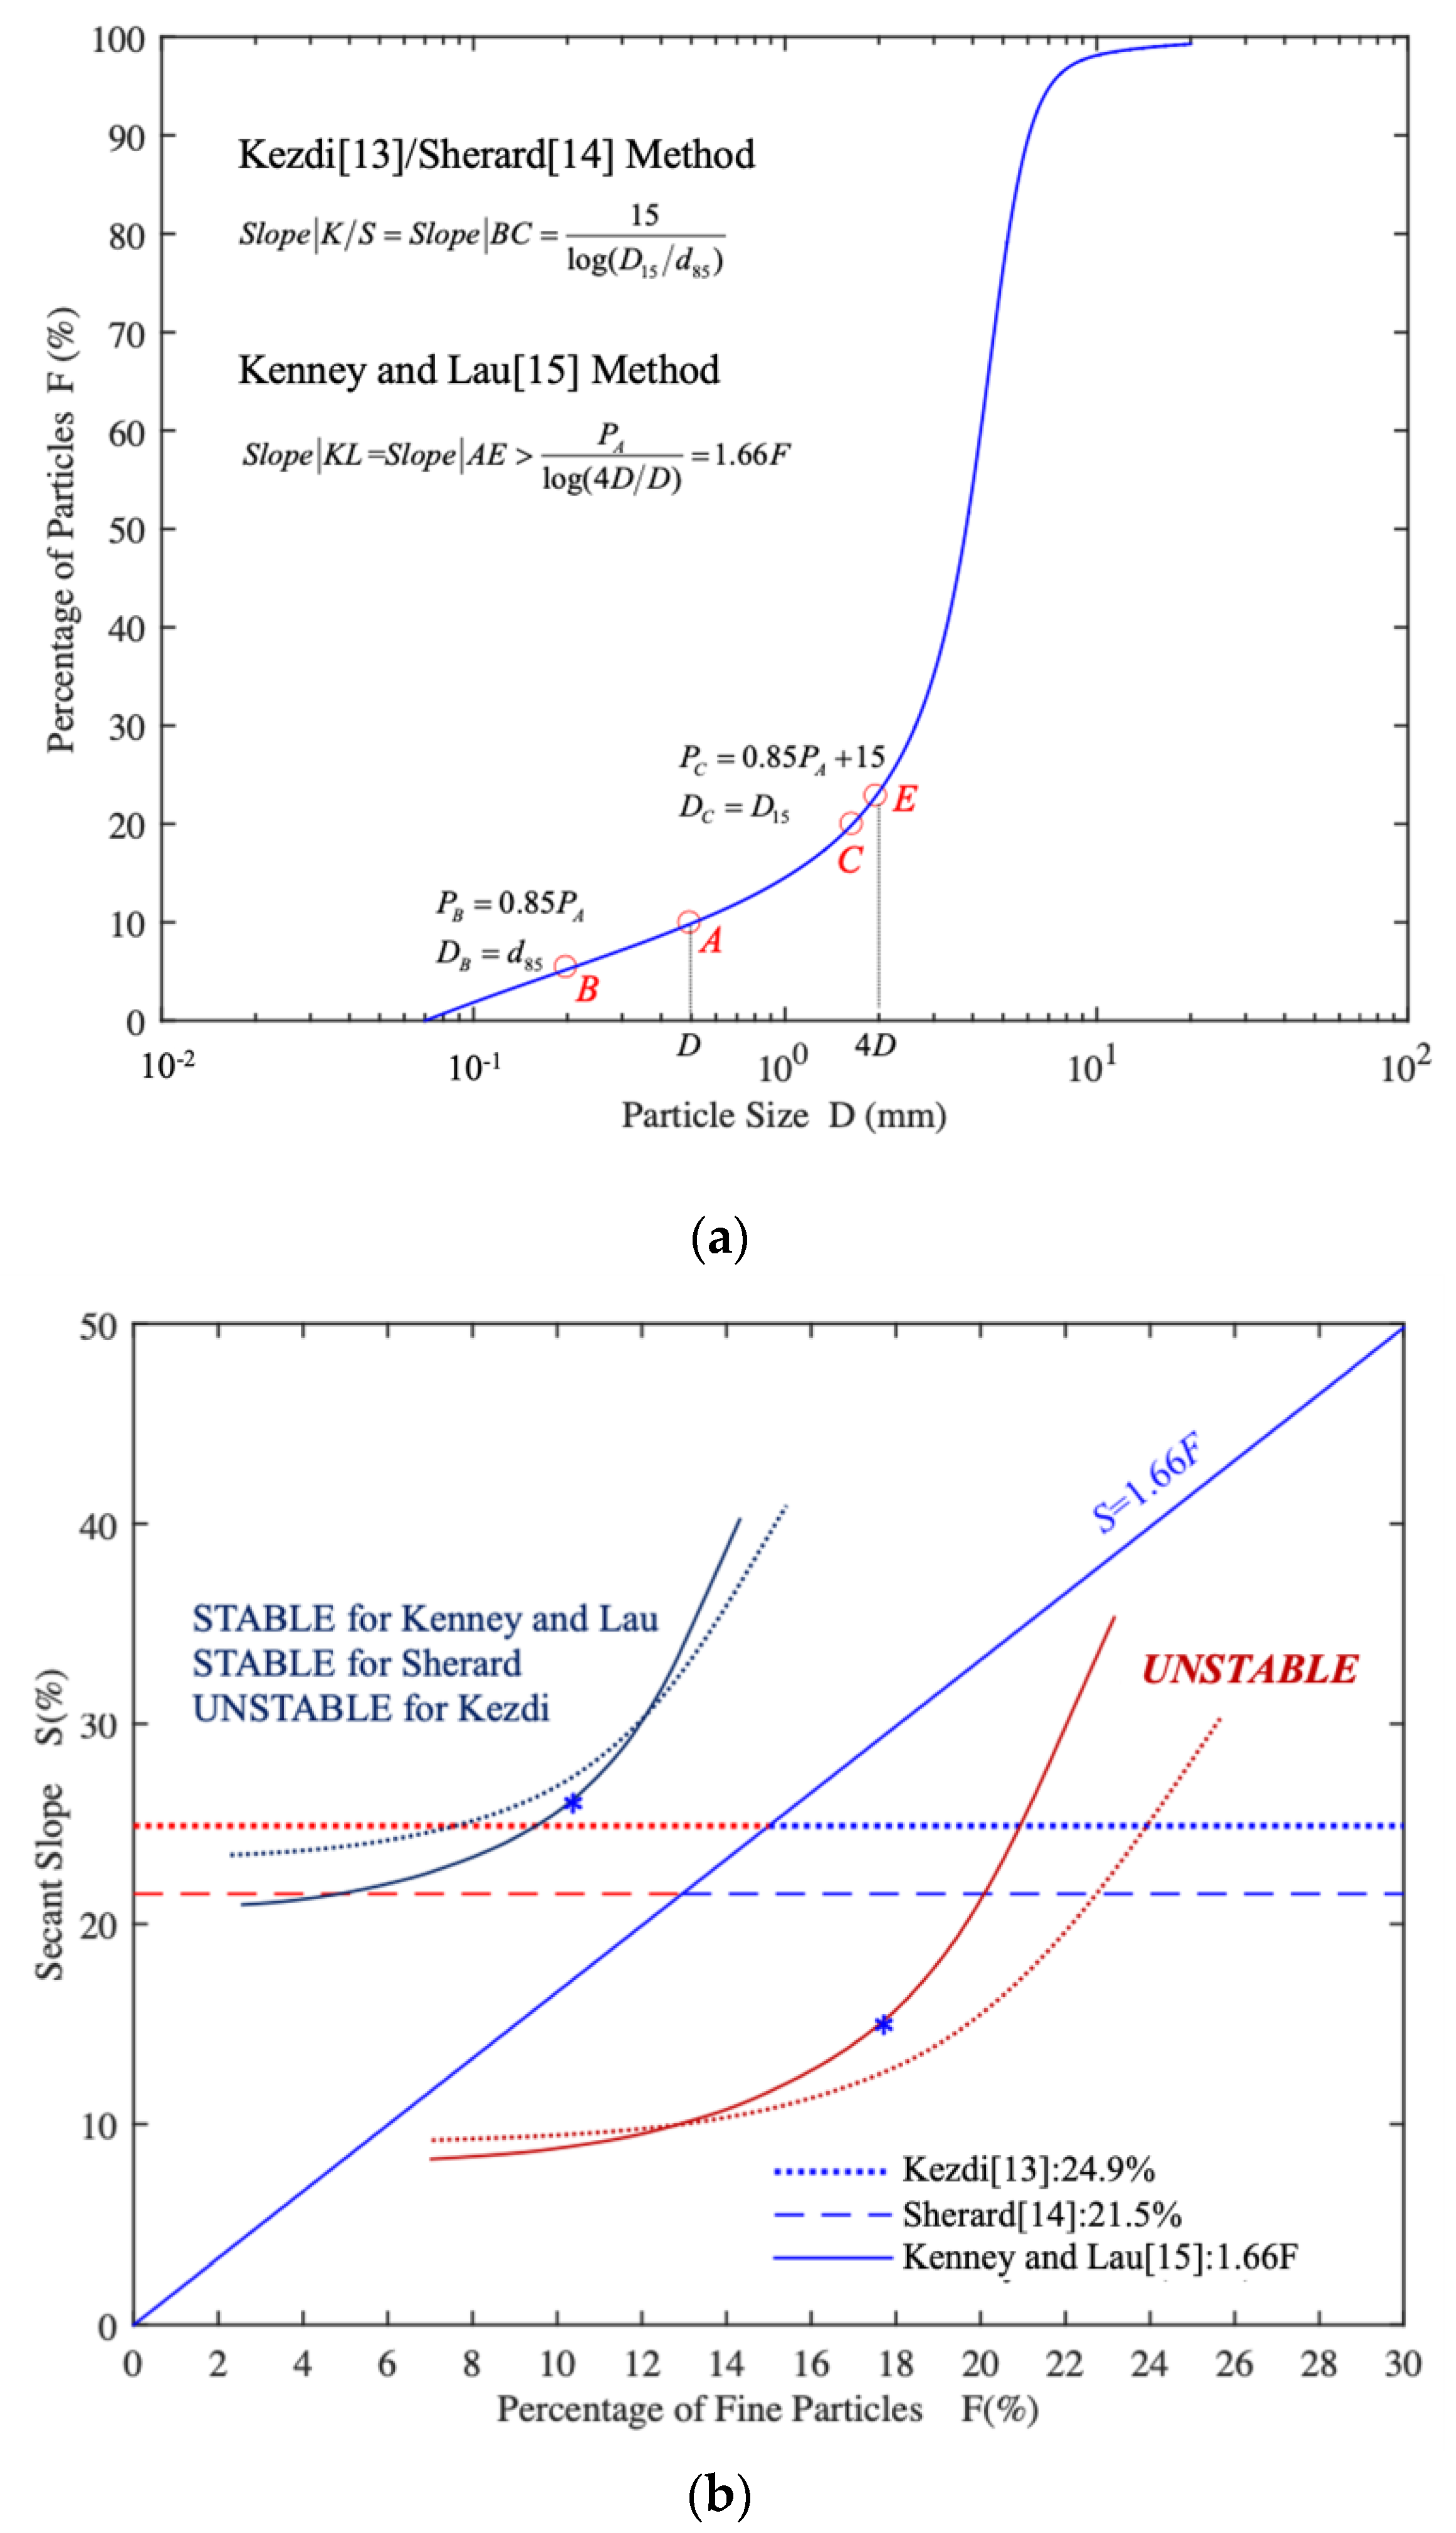
For these three criteria, Chapuis [16] demonstrated that criteria for internal stability can be modified into more simplified slope criteria for soil PSD curves, as shown in Figure 1a. In Figure 1a, A is the division point among the fine and coarse parts. represents the secant slopes derived from the Kezdi and the Sherard criteria, and represents the secant slopes derived from the Kenney and Lau criterion, calculated in the following forms:
where (i = A, B, C, E) is the percentage by mass of particles greater than .
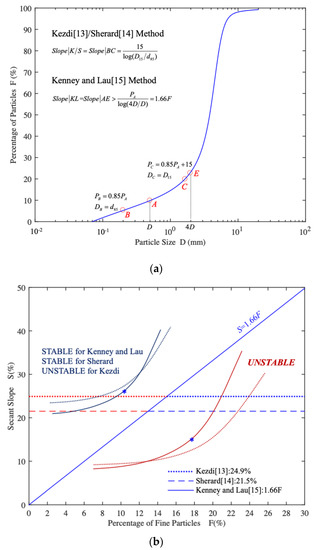
Figure 1.
Illustration and comparison of the three criteria. (a) Three most commonly used semi-empirical criteria. (b) Slope criteria of soil PSD curves.
The curves of and are merged in Figure 1b, in which the solid line means and the dotted line means . The point marked with an asterisk represents the minimum value of , which is also the point where takes place.
Based on the research ideas of Chapuis, many scholars try to combine the Kezdi, Sherard, and Kenney and Lau criteria to the assessment of soil instability. Li and Fannin [17] obtained a plot of the Kezdi and the Kenney and Lau boundaries in the F: H space. In addition, Moraci et al. [10,18] developed a butterfly wing chart that was successfully used to distinguish stable and unstable soil particle distributions despite two issues that exist for the coordinate variables, which may not be the most reasonable [2,19]. However, there are certain issues that have to be sorted out in order to determine the soil PSD curves’ secant slopes: (1) PSD information on many soils is derived, (2) some specific PSD data are difficult to obtain using sieve analysis, and (3) the secant slopes of soil PSD curves can only be computed manually [2,20].
In this paper, a new method to calculate the soil PSD curves’ secant slopes automatically is proposed, and a synthetic diagram is presented for the potential examination of the internal stability of granulated soils. The applicability and the scope of application were verified by analyzing different soil specimens. The method overcame the limitations of the current criteria and can evaluate the internal instability of granulated soils better.
2. A New Method and Synthetic Chart for the Soils’ Internal Stability Evaluation
To derive the soil PSD curves’ secant slopes automatically, a novel method was proposed by Zhou et al. [2,20,21] and can be carried out as follows:
(i) First, optimal parametric PSD models are employed to denote the soils’ PSD curves. According to the study of Zhou et al. [20,21], the FBP model proposed by Fredlund et al. [22] is suggested because it performs better than other PSD models and was utilized to denote well-graded and gap-graded soil PSD curves. The FBP model was given as follows:
where P(d) refers to the percentage of particles reaching a certain size by mass (in weight); d refers to the diameter of each particle size; and dmin stands for the minimum particle diameter of the soil. In other words, it is the lower bound of the diameter for which the model can be applied. α, β, γ, δ, φ, χ, ψ, and w are the model parameters that need to be determined:
- α refers to a parameter relating the initial break of the curve, namely, the inflection point along with the curve, which indicates the largest size of the particle.
- β refers to a parameter relating the uniformity of the particle-size distribution curve, namely, the steepest slope on the curve. The point of the maximum slope along with the PSD curve indicates the dominant size of particles in the soil.
- γ refers to a parameter relating to the curve shape as it proceeds towards the fine area, which affects the break onto the finer size of the particle of the specimen.
- δ refers to a parameter relating to the number of fines in the soil, which influences the shape along with the curve’s finer particle size part.
- φ refers to a parameter relating to the second breaking point along the curve.
- χ refers to a parameter relating to the second steep slope along the curve.
- ψ refers to a parameter related to the second shape along the curve.
- w refers to a weighting factor for the sub-curves, subject to 0 < w < 1.
(ii) Obtaining the secant slopes of soil PSD curves automatically based on the FBP mathematical expression of soil PSD. The soil PSD curves’ secant slopes are obtained as
where is the FBP mathematical expression representing the PSD curves of granular soils, while stands for the inverse function of . and are the secant slopes at point for the Kezdi and the Sherard criteria and the Kenney and Lau criterion, respectively.
(iii) The internal stability of granulated soils is evaluated with the three most commonly utilized semi-experimental criteria using the soil PSD curves’ secant slopes in Figure 1b. A synthetic diagram of the three most commonly used criteria is also reported for the internal stability assessment of soils, as presented in Figure 2.
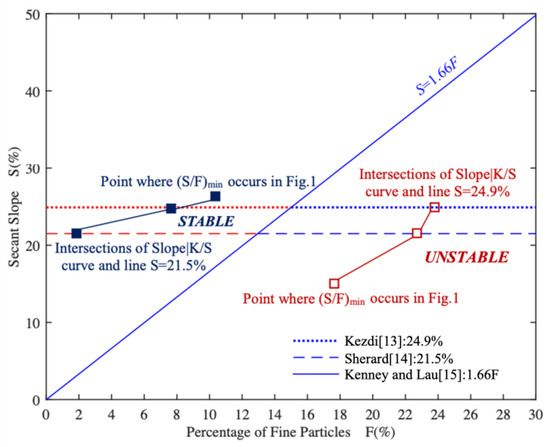
Figure 2.
Synthetic chart for internal stability assessment of soils.
In Figure 2, the intersections of the curve in Figure 1b and the Kezdi and Sherard limit slope lines and as well as the point where happens (the point marked with an asterisk in Figure 1b) are shown in the S–F space. The soil would be considered internally stable when the connection line of the intersections and the point where happens are located above . Otherwise, the soil would be considered internally instable.
3. Internal Stability Analysis of Soils
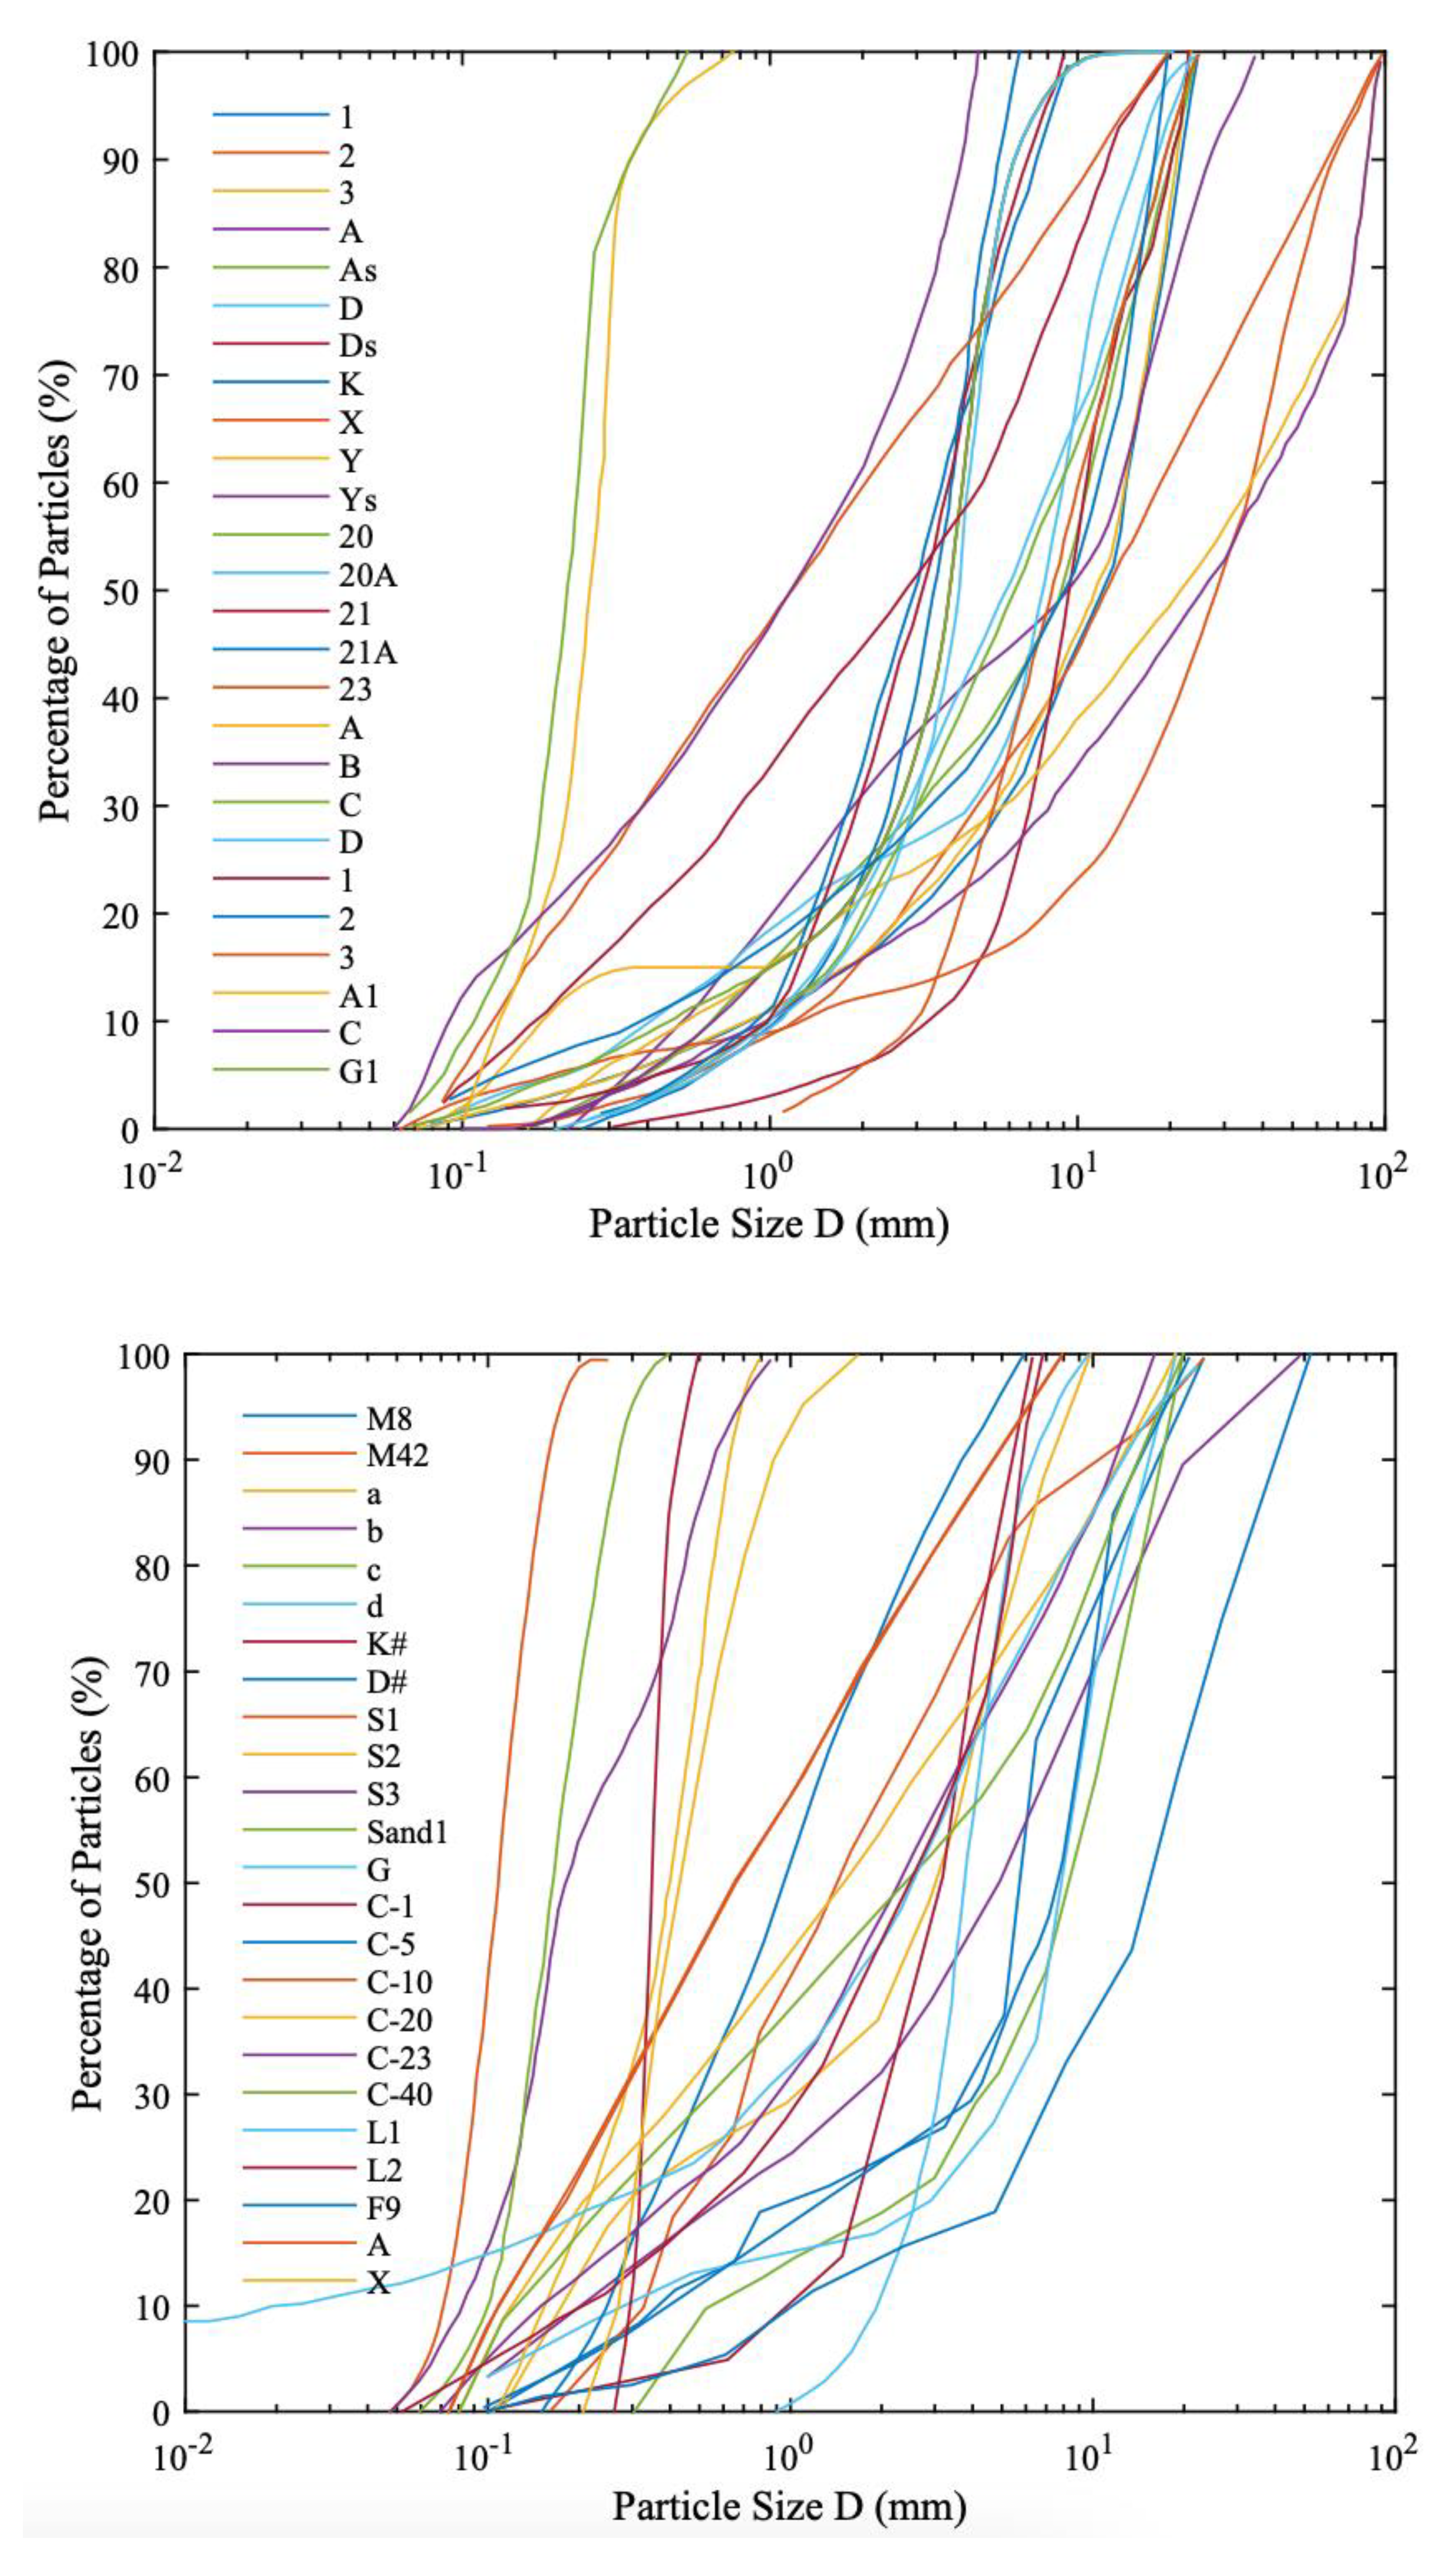
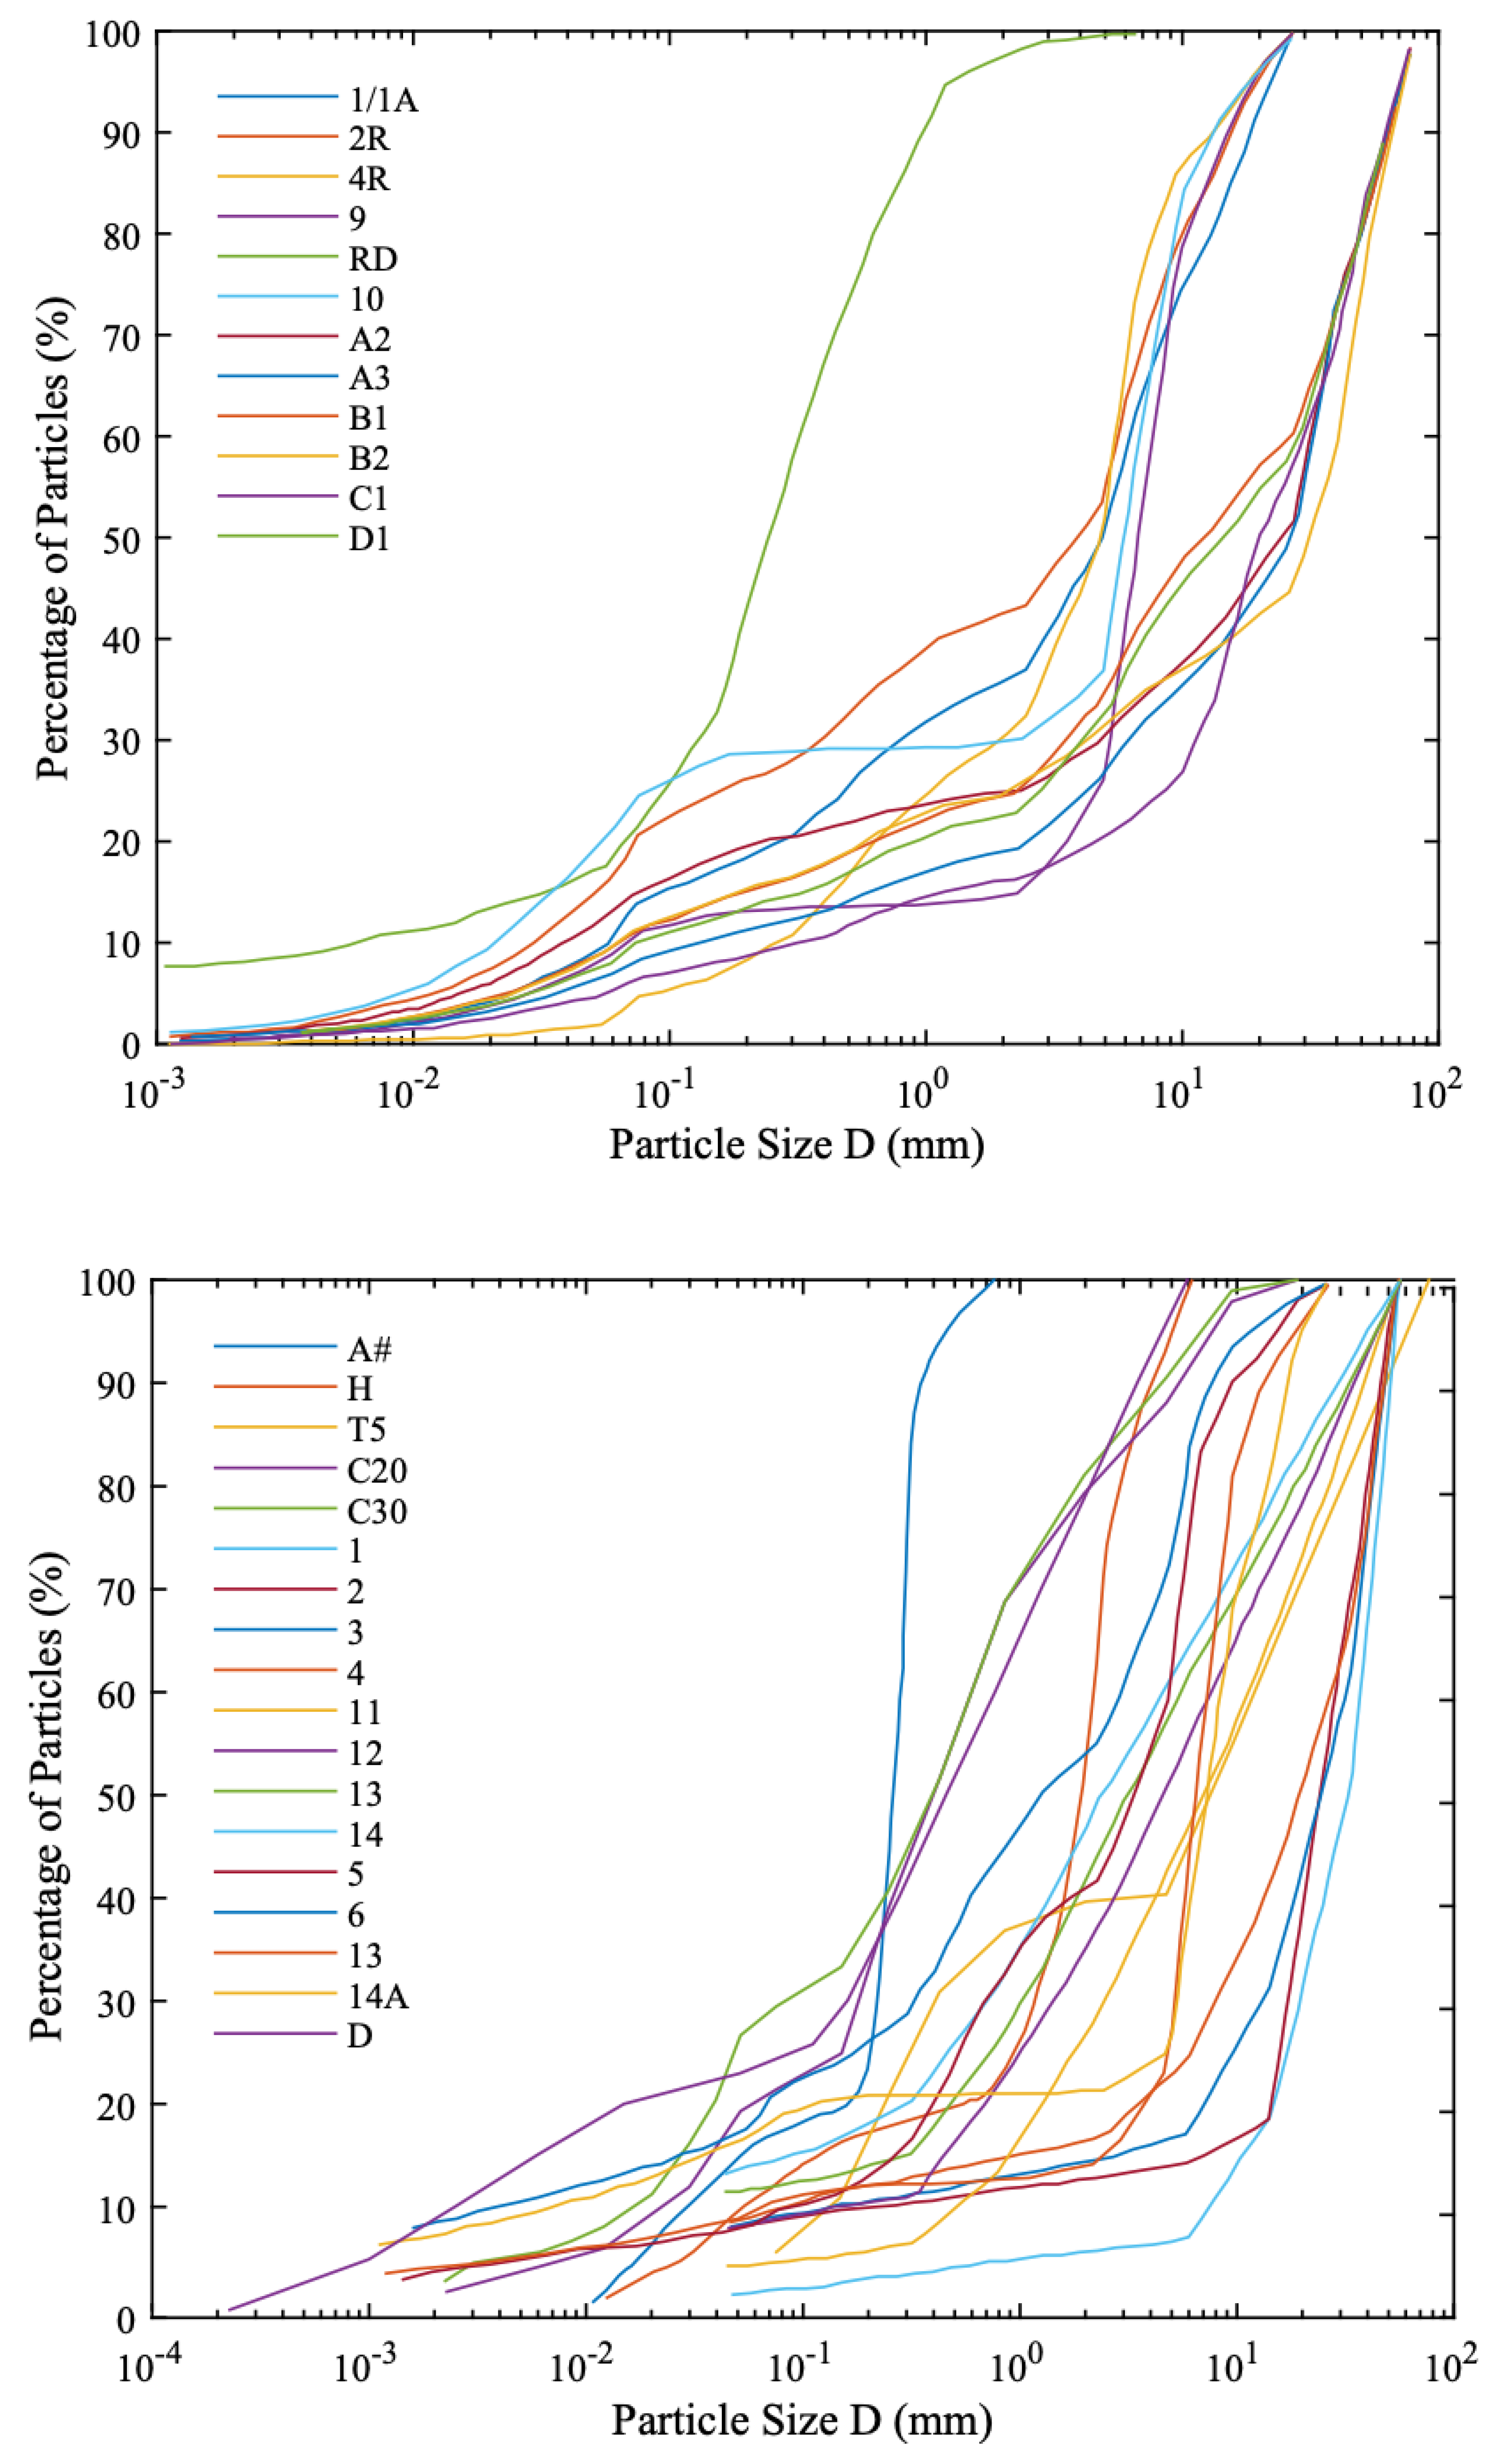
Eighty samples of the soil were evaluated experimentally by Kenney and Lau [14], Lafleur et al. [23], Burenkova [24], Skempton and Brogan [25], Mlynarek et al. [26], Chapuis [27], Lafleur [28], Locke et al. [29], Mao [30], Moffat [31], Fannin and Moffat [32], Wan and Fell [33], Indraratna et al. [34,35], and Israr and Indraratna [36,37]; these were studied first to verify the applicability of the proposed method and the scope of application.
Soil specimen M6 experimental tested by Lafleur et al. [23], specimens B and E experimental tested by Lafleur [28], specimen T0 experimental tested by Moffat [31], and specimens 3R, 7, 11, and 15 experimental tested by Wan and Fell [33] are not included in this study because these soils possess a fine fraction higher than 35%. The PSD curves of the 80 studied soil specimens are supplied as Appendix A (Figure A1).
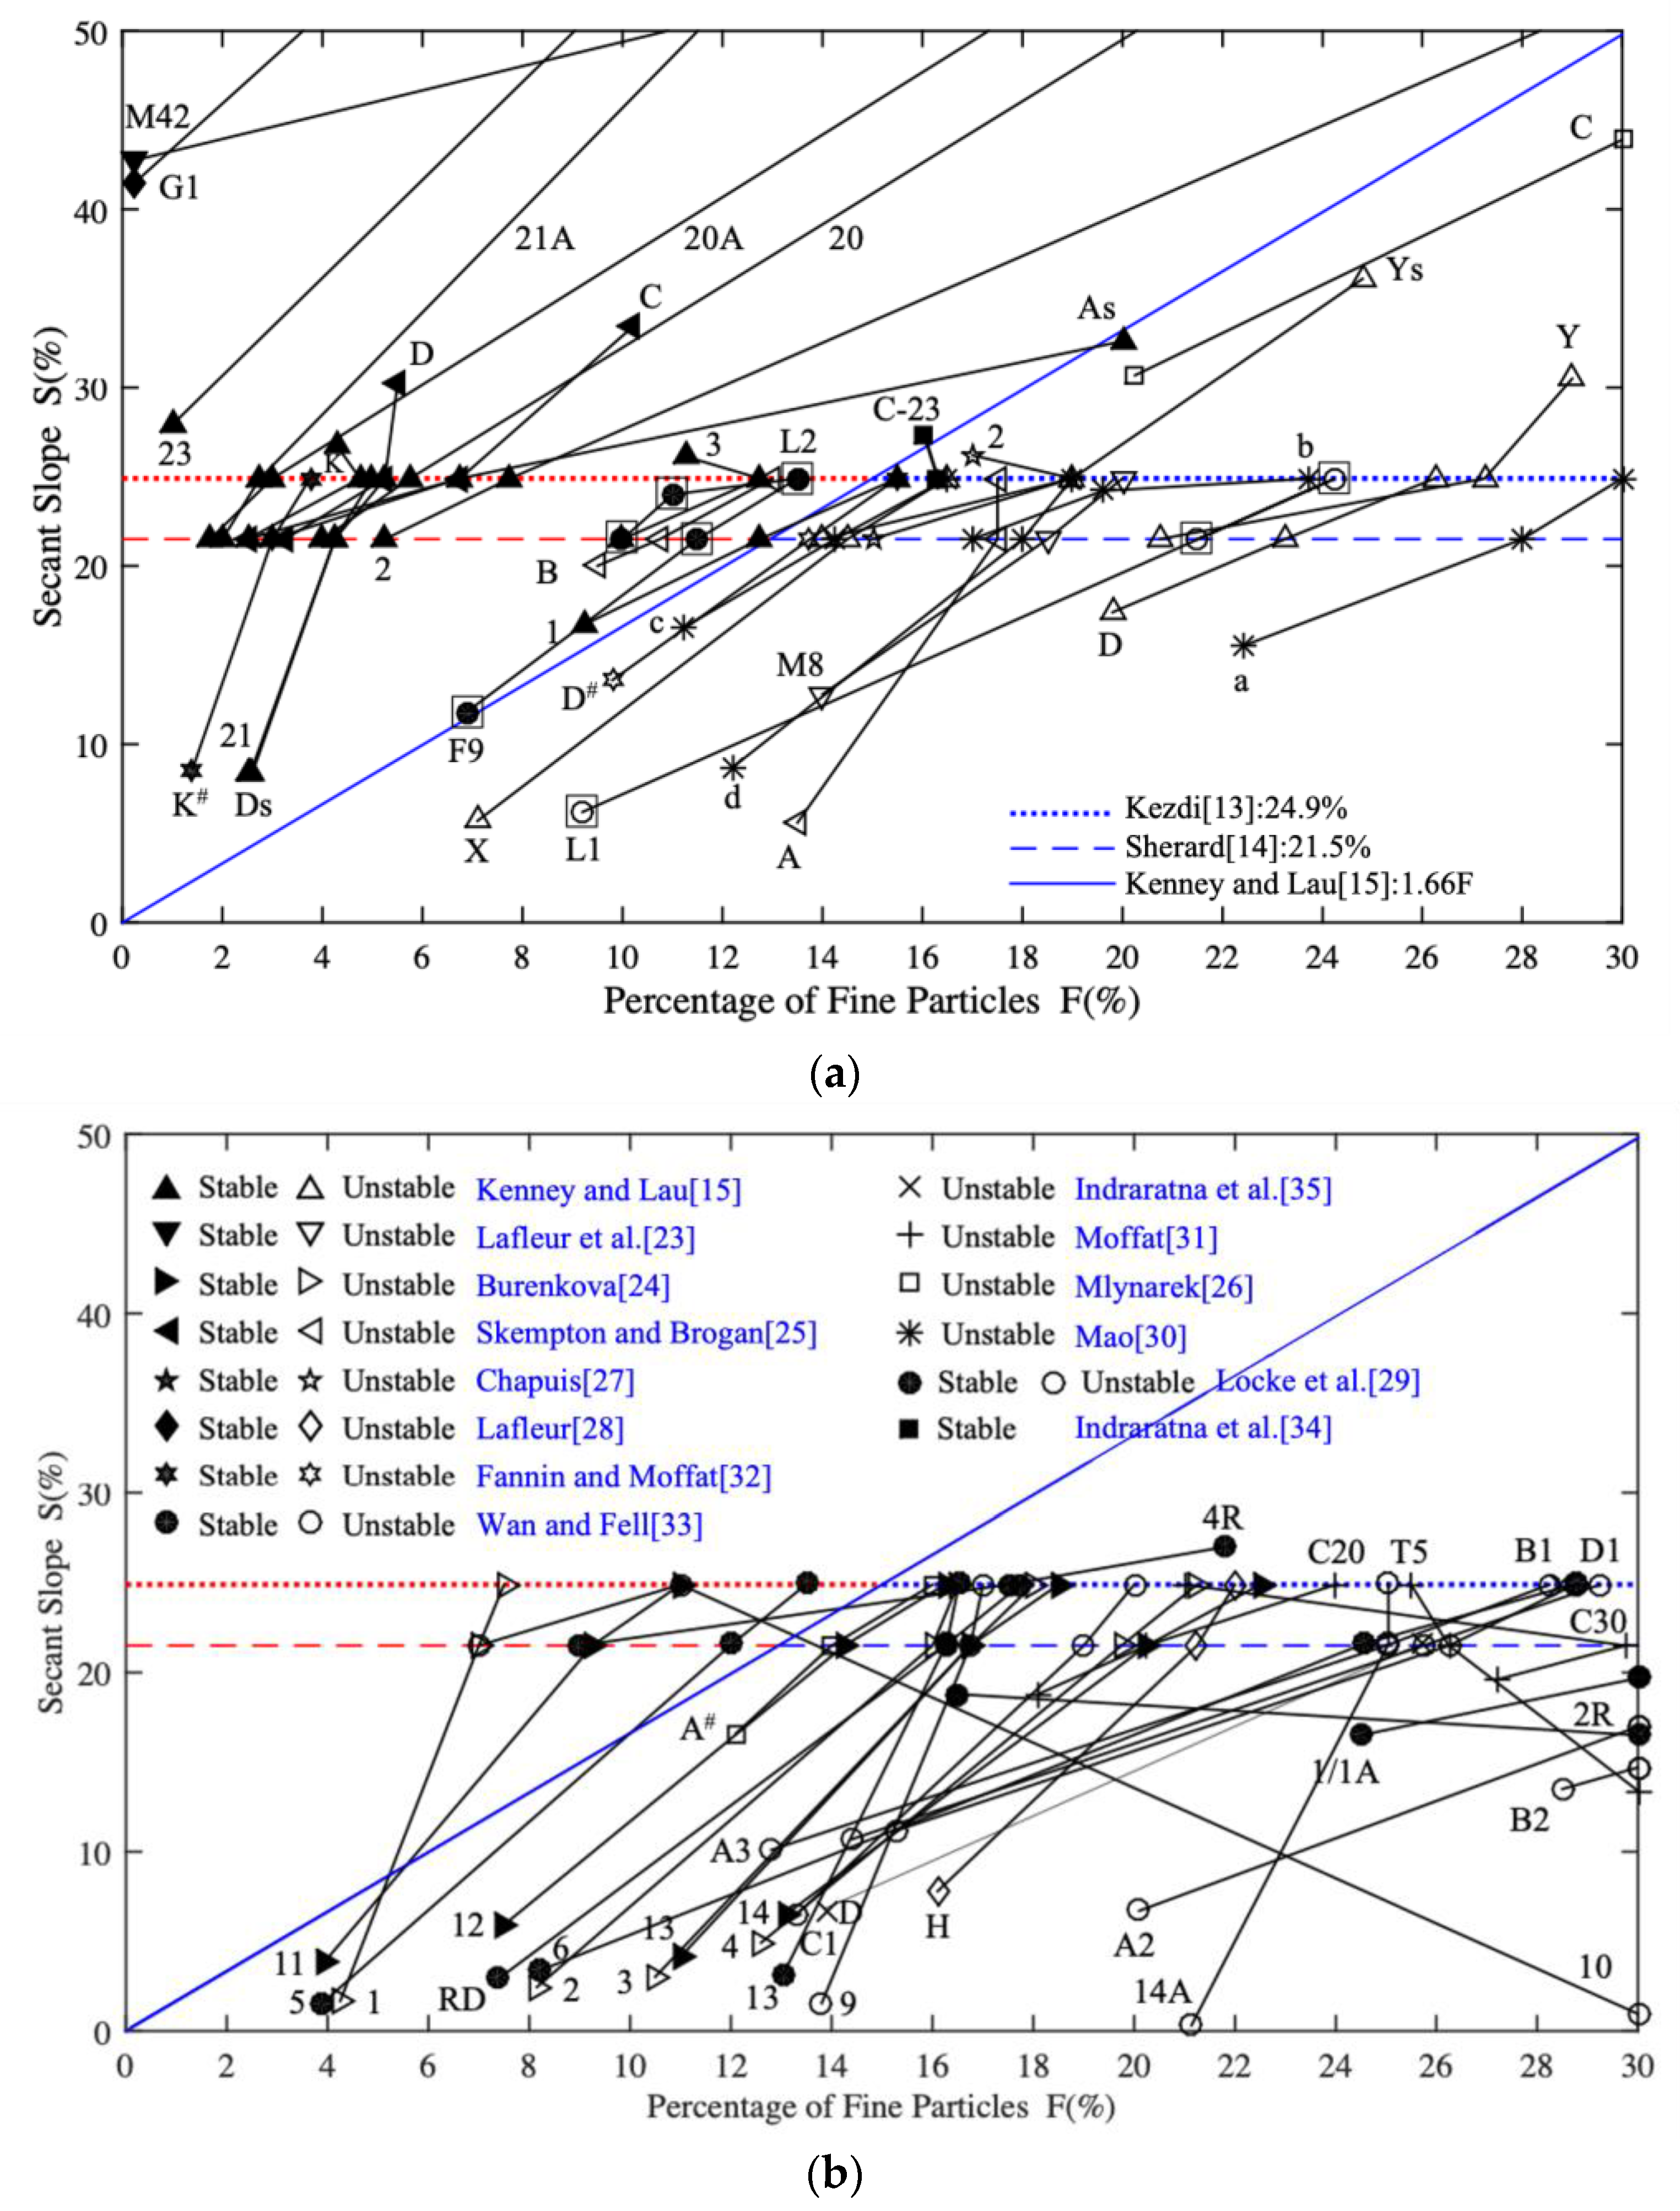
The 80 gradations were categorized into 50 sand–gravel soils and 30 silt–sand–gravel and clay–silt–sand–gravel soils (see Table 1 and Table 2). First, using the FBP model to obtain the mathematical expressions for denoting the PSD curves of the 80 studied soil samples (some of the obtained PSD curves using the FBP model have been shown in Zhou et al. [19,20], which will not be given again in this study), the point where (S/F)min happens and the intersections of the curve and lines S = 21.5% and S = 24.9% were obtained, and their connection lines are shown in Figure 3. The connection lines of 16 soil samples (A tested by Kenney and Lau [14]; S1, S2, S3, G and Sand 1 tested by Skempton and Brogan [25]; A1 tested by Mlynarek et al. [26]; 1 and 3 tested by Chapuis [27]; C-1, C-5, C-10, C-20, and C-40 tested by Indraratna et al. [34]; and A and X tested by Indraratna et al. [35]) are not plotted in Figure 3 as their Slope|K/S curve is above S = 24.9% and has no intersections with limit lines. Finally, the granulated soils’ internal stability was analyzed using the three most commonly used criteria and a synthetic diagram (refer to Table 1 and Table 2). The term “Marginal” means that it was observed to be located on the boundary between internal stability and instability. Further experimental and analytical analysis was required to identify whether it is internally stable or unstable.

Table 1.
Internal stability evaluation of sand–gravel soils.
Table 2.
Internal stability assessment of (clay)–silt–sand–gravel soils.
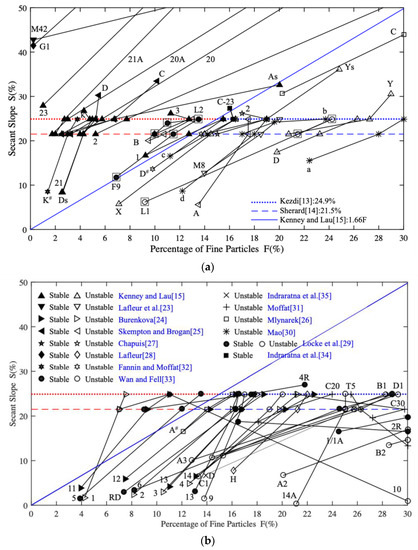
Figure 3.
Connection lines of the studied soil specimens. (a) Connection lines of sand–gravel soil specimens. (b) Connection lines of (clay)–silt–sand–gravel soil specimens.
3.1. Sand–Gravel Soils’ Internal Stability Analysis
Determination of the soil samples’ potential internal stabilities using the Kezdi and Sherard criteria failed, as shown in Table 1, because the Kezdi and the Sherard criteria can be rarely applied if the fine fraction is smaller than a certain threshold: 15% and 12.95%, respectively [2]. Sixteen soils were deemed to be internally stable experimentally, but they were then deemed to be internally unstable using these two criteria. In addition, three soil samples (A, tested by Kenney and Lau [14], C, tested by Mlynark et al. [26], and C-40, tested by Indraratna et al. [34]) were considered to be internally stable but were then found to be internally unstable. Therefore, only the potential internal stability of about 60% of the soil samples can be distinguished successfully using the Kezdi and the Sherard criteria.
For the 50 sand–gravel soils, with the exception of 3 soil samples (B, examined by Skempton and Brogan [24], and 1 and 3, tested by Chapuis [27]), the internal stability and instability of 47 soils were successfully distinguished using the Kenney and Lau criterion. Soil sample B is located on the boundary between internal stability and instability, as Zhou et al. [2] discussed. Soil specimens 1 and 3, tested by Chapuis [27], were deemed to be internally unstable with the Kenney and Lau criterion but found to be internally stable by experiment.
Meanwhile, six soils (A, tested by Kenney and Lau [14], C, tested by Mlynark et al. [26], 1 and 3, tested by Chapuis [27], and C-20 and C-40, tested by Indraratna et al. [34]) were considered to be internally unstable, but are considered to be internally stable using the Kezdi and the Sherard criteria, which means that the secant slope curve has no intersections with the Kezdi and Sherard limit slope lines, resulting in the inapplicability of the synthetic chart for these three soil specimens. With the exception of these six soils and soil specimen B, tested by Skempton and Brogan [25], the potential of all the soil specimens’ internal stabilities was distinguished successfully with the new synthetic chart.
3.2. Internal Stability Analysis of (Clay)–Silt–Sand–Gravel Soils
All 30 (clay)–silt–sand–gravel soils were deemed internally unstable using all of the criteria, as shown in Table 2. However, 12 soil specimens were found to be internally stable, which is inconsistent with the evaluation results. In other words, all of the (clay)–silt–sand–gravel soils that were found to be internally stable were subsequently deemed to be internally unstable. Therefore, all of the criteria failed to assess the potential internal stability of these (clay)–silt–sand–gravel soils.
4. Conclusions
A new method and synthetic chart is proposed in the present study for automatically obtaining the secant slopes of soil PSD curves and internal stability analysis of granulated soils, which is carried out in three steps: (i) first, using optimal parametric PSD models (FBP model is suggested) to denote the PSD curves of granulated soils; then (ii) obtaining the secant slopes of the soil PSD curves, automatically based on PSD mathematical expressions; and finally, (iii) assessing the granulated soils’ internal stability with the soil PSD curves’ secant slopes.
The sand–gravel soils’ internal stability and instability can be distinguished successfully with the synthetic chart and the Kenney and Lau criterion, but they cannot be assessed with the Kezdi and the Sherard criteria because most of the soils that were experimentally found to be internally stable were then found to be internally unstable using the aforementioned two criteria.
None of the criteria can be used to assess the internal stability of silt–sand–gravel soils, clay–silt–sand–gravel soils, and soils that have a fine fraction greater than 35%.
Author Contributions
Methodology, Y.L., Z.Z. and W.C.; software, W.C.; validation, S.B., J.H. and Q.W.; formal analysis, X.L. and L.Y.; investigation, X.L. and Z.R.; resources, Q.W. and Z.R.; data curation, S.B.; writing-original draft, S.B. and Z.Z.; writing-review & editing, Y.L.; supervision, Y.L.; funding acquisition, J.H. and Z.Z. All authors have read and agreed to the published version of the manuscript.
Funding
This research was funded by National Natural Science Foundation of China grant number 51991391, National Natural Science Foundation of China grant number U1806226, National Natural Science Foundation of China grant number 52021005 and Tang Scholar Program of Shandong University. The APC was funded by National Natural Science Foundation of China grant number 51991391.
Institutional Review Board Statement
Not applicable.
Informed Consent Statement
Not applicable.
Data Availability Statement
The original data of the article is available from the corresponding author.
Conflicts of Interest
The authors declare no conflict of interest.
Nomenclature
| The size of the particle corresponding to 15% by weight of the coarse fraction | |
| The size of the particle corresponding to 85% by weight of the fine fraction. | |
| The mass fraction of particles less than a particle with size | |
| The incremental mass fraction acquired among particle sizes and | |
| The percentage by mass of particles greater than . | |
| The FBP mathematical expression representing the PSD curves of soils | |
| The inverse function of . |
Appendix A
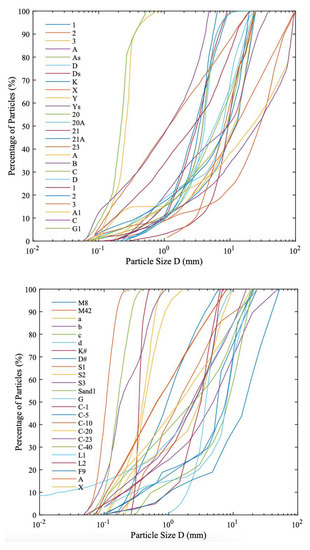
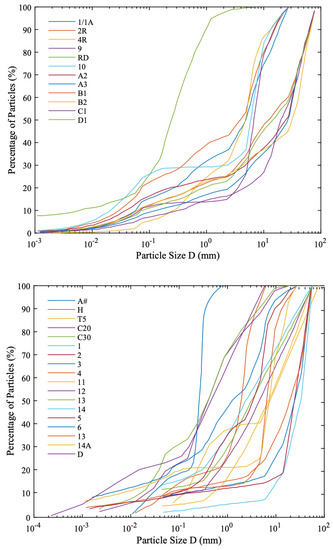
Figure A1.
PSD curves of the 80 studied soil specimens.
Figure A1.
PSD curves of the 80 studied soil specimens.
References
- Moraci, N.; Mandaglio, M.C.; Ielo, D. A New Theoretical Method to Evaluate the Internal Stability of Granular Soils. Can. Geotech. J. 2012, 49, 45–58. [Google Scholar] [CrossRef]
- Zhou, Z.; Ranjith, P.G.; Li, S. Criteria for Assessment of Internal Stability of Granular Soil. Proc. Inst. Civ. Eng. Geotech. Eng. 2017, 170, 73–83. [Google Scholar] [CrossRef]
- Zhou, Z.Q.; Ranjith, P.G.; Li, S.C. An Experimental Testing Apparatus for Study of Suffusion of Granular Soils in Geological Structures. Tunn. Undergr. Space Technol. 2018, 78, 222–230. [Google Scholar] [CrossRef]
- Zhou, Z.Q.; Ranjith, P.G.; Yang, W.M.; Shi, S.S.; Wei, C.C.; Li, Z.H. A New Set of Scaling Relationships for DEM-CFD Simulations of Fluid–Solid Coupling Problems in Saturated and Cohesiveless Granular Soils. Comp. Part. Mech. 2019, 6, 657–669. [Google Scholar] [CrossRef]
- Richards, K.S.; Reddy, K.R. Critical Appraisal of Piping Phenomena in Earth Dams. Bull. Eng. Geol. Environ. 2007, 66, 381–402. [Google Scholar] [CrossRef]
- Wan, C.F.; Fell, R. Assessing the Potential of Internal Instability and Suffusion in Embankment Dams and Their Foundations. J. Geotech. Geoenviron. Eng. 2008, 134, 401–407. [Google Scholar] [CrossRef]
- Suits, L.D.; Sheahan, T.C.; Chang, D.S.; Zhang, L.M. A Stress-Controlled Erosion Apparatus for Studying Internal Erosion in Soils. Geotech. Test. J. 2011, 34, 103889. [Google Scholar] [CrossRef]
- Chang, D.S.; Zhang, L.M. Critical Hydraulic Gradients of Internal Erosion under Complex Stress States. J. Geotech. Geoenviron. Eng. 2013, 139, 1454–1467. [Google Scholar] [CrossRef]
- Fannin, R.J.; Slangen, P. On the Distinct Phenomena of Suffusion and Suffosion. Geotech. Lett. 2014, 4, 289–294. [Google Scholar] [CrossRef]
- Moraci, N.; Mandaglio, M.C.; Ielo, D. Analysis of the Internal Stability of Granular Soils Using Different Methods. Can. Geotech. J. 2014, 51, 1063–1072. [Google Scholar] [CrossRef]
- ICOLD. Geotextiles as Filters and Transitions in Fill Dams; International Commission on Large Dams: Paris, France, 1986. [Google Scholar]
- Canadian Dam Association. Geotechnical Considerations for Dam Safety; Canadian Dam Association: Moose Jaw, SK, Canada, 2007. [Google Scholar]
- Kezdi, A. Physical Properties of Soils. Soil Mech. Found. Eng. 1968, 5, 367–368. [Google Scholar] [CrossRef]
- Sherard, J.L. Sinkholes in dams of coarse, broadly graded soils. In Proceedings of the 13th International Congress on Large Dams, New Delhi, India, 29 October–2 November 1979; Volume 2, pp. 25–35. [Google Scholar]
- Kenney, T.; Lau, D. Internal Stability of Granular Filters. Can. Geotech. J. 1985, 22, 215–225. [Google Scholar] [CrossRef]
- Chapuis, R. Similarity of Internal Stability-Criteria for Granular Soils. Can. Geotech. J. 1992, 29, 711–713. [Google Scholar] [CrossRef]
- Li, M.; Fannin, R.J. Comparison of Two Criteria for Internal Stability of Granular Soil. Can. Geotech. J. 2008, 45, 1303–1309. [Google Scholar] [CrossRef]
- Moraci, N.; Mandaglio, M.C.; Ielo, D. Reply to the Discussion by Ni et al. on “Analysis of the Internal Stability of Granular Soils Using Different Methods”. Can. Geotech. J. 2015, 52, 385–391. [Google Scholar] [CrossRef]
- Ni, X.; Wang, Y.; Dallo, Y.A.H. Discussion of “Analysis of the Internal Stability of Granular Soils Using Different Methods. ” Can. Geotech. J. 2015, 52, 382–384. [Google Scholar] [CrossRef] [Green Version]
- Zhou, Z.; Ranjith, P.G.; Li, S. Optimal Model for Particle Size Distribution of Granular Soil. Proc. Inst. Civ. Eng. Geotech. Eng. 2016, 169, 73–82. [Google Scholar] [CrossRef]
- Zhou, Z.Q. Evolutionary Mechanism of Water Inrush through Filling Strcutures in Tunnels and Engineering Applications. Ph.D. Thesis, Shandong University, Jinan, China, 2016. [Google Scholar]
- Fredlund, M.D.; Fredlund, D.G.; Wilson, G.W. An Equation to Represent Grain-Size Distribution. Can. Geotech. J. 2000, 37, 817–827. [Google Scholar] [CrossRef]
- Lafleur, J.; Mlynarek, J.; Rollin, A. Filtration of Broadly Graded Cohesionless Soils. J. Geotech. Eng. ASCE 1989, 115, 1747–1768. [Google Scholar] [CrossRef]
- Burenkova, V.V. Assessment of suffusion in non-cohesive and graded soils. In Proceedings of the 1st International Conference “Geo-Filters”, Balkema, Rotterdam, The Netherlands, 20–22 October 1993; pp. 357–360. [Google Scholar]
- Skempton, A.; Brogan, J. Experiments on Piping in Sandy Gravels. Geotechnique 1994, 44, 449–460. [Google Scholar] [CrossRef]
- Mlynarek, J.; Vermeeresch, O.G.; Deberardino, S. Evaluation of Filtration Design Criterion for Nonwoven Heat-Bonded Geotextiles. Proc. Geosynth. 1995, 95, 189–202. [Google Scholar]
- Chapuis, R.P.; Contant, A.; Baass, K.A. Migration of Fines in 0–20 Mm Crushed Base during Placement, Compaction, and Seepage under Laboratory Conditions. Can. Geotech. J. 1996, 33, 168–176. [Google Scholar] [CrossRef]
- Lafleur, J. Selection of Geotextiles to Filter Broadly Graded Cohesionless Soils. Geotext. Geomembr. 1999, 17, 299–312. [Google Scholar] [CrossRef]
- Locke, M.; Indraratna, B.; Adikari, G. Time-Dependent Particle Transport through Granular Filters. J. Geotech. Geoenviron. Eng. 2001, 127, 521–529. [Google Scholar] [CrossRef] [Green Version]
- Mao, C.X. Study on piping and filters: Part I of Piping. J. Rock Soil Mech. 2005, 26, 209–215. [Google Scholar]
- Moffat, R. Experiments on the Internal Stability of Widely Graded Cohesionless Soils; University of British Columbia: Vancouver, BC, Canada, 2005. [Google Scholar]
- Fannin, R.J.; Moffat, R. Observations on Internal Stability of Cohesionless Soils. Geotechnique 2006, 56, 497–500. [Google Scholar] [CrossRef]
- Wan, C.F.; Fell, R. Experimental Investigation of Internal Instability of Soils in Embankment Dams and Their Foundations; School of Civil and Environmental Engineering, The University of New South Wales: Sydney, Australia, 2004. [Google Scholar]
- Indraratna, B.; Israr, J.; Rujikiatkamjorn, C. Geometrical Method for Evaluating the Internal Instability of Granular Filters Based on Constriction Size Distribution. J. Geotech. Geoenviron. Eng. 2015, 141, 04015045. [Google Scholar] [CrossRef] [Green Version]
- Indraratna, B.; Israr, J.; Li, M. Inception of Geohydraulic Failures in Granular Soils—An Experimental and Theoretical Treatment. Geotechnique 2018, 68, 233–248. [Google Scholar] [CrossRef] [Green Version]
- Israr, J.; Indraratna, B. Internal Stability of Granular Filters under Static and Cyclic Loading. J. Geotech. Geoenviron. Eng. 2017, 143, 04017012. [Google Scholar] [CrossRef]
- Israr, J.; Indraratna, B. Study of Critical Hydraulic Gradients for Seepage-Induced Failures in Granular Soils. J. Geotech. Geoenviron. Eng. 2019, 145, 04019025. [Google Scholar] [CrossRef]

Publisher’s Note: MDPI stays neutral with regard to jurisdictional claims in published maps and institutional affiliations. |
© 2022 by the authors. Licensee MDPI, Basel, Switzerland. This article is an open access article distributed under the terms and conditions of the Creative Commons Attribution (CC BY) license (https://creativecommons.org/licenses/by/4.0/).