Article

Design and Economic Evaluation of a Hybrid Membrane Separation Process from Multiple Refinery Gases Using a Graphic Synthesis Method

1
State Key Laboratory of Fine Chemicals, Engineering Laboratory for Petrochemical Energy-Efficient Separation Technology of Liaoning Province, School of Chemical Engineering, Dalian University of Technology, Dalian 116024, China
2
Dongyue R & D Center of Dongyue Group Ltd., State Key Laboratory of Fluorinated Functional Membrane Materials, Shandong Huaxia Shenzhou New Material Co., Ltd., Zibo 256401, China
*
Author to whom correspondence should be addressed.
Processes 2022, 10(5), 820; https://doi.org/10.3390/pr10050820
Submission received: 23 March 2022 / Revised: 16 April 2022 / Accepted: 18 April 2022 / Published: 21 April 2022
(This article belongs to the Section Chemical Processes and Systems)

Abstract

:
Petrochemical tail gases have various components and many separation methods, thus there are many possible design schemes, making it difficult to determine the optimal scheme. In this work, a graphic synthesis method was used to design a hybrid multi-input refinery gas separation process consisting of membranes, pressure swing adsorption (PSA), shallow condensation (SC), and distillation units for the production of valuable products which include H2, C2, LPG, and C5+. Ten refinery gases with different compositions were visualized and represented with vector couples in a triangular coordinate system. Firstly, according to the characteristics of the refinery gases, the feeds located in the same region of the triangular coordinate system were merged to simplify the number of input streams, then ten original input streams were combined into two mixed streams. Secondly, the optimal separation sequence was determined by using the unit selection rules of a graphic synthesis method. Thirdly, the process was simulated in UniSim Design and the process parameters were determined by sensitivity analysis. Finally, economic assessments were carried out, which led to an annual gross product profit of USD 38.62 × 10⁶ and a payback period of less than 4 months.

1. Introduction

Refinery gas is a mixture of gases generated during refinery processes which are performed to process crude oil into various petroleum products, which can then be traded or sold. They contain profitable components such as hydrogen and light hydrocarbons [1] that are normally burned, together with combustible gases and residual gases in furnaces. It is obvious that these profitable components can be used more reasonably after effective separation rather than direct combustion [2,3,4,5]. The composition of refinery gas varies depending on the composition of the crude oil it originates from and the processes to which it has been subjected. Common components include hydrogen, C1–C4 alkanes, C2–C4 olefins, a small amount of C5 paraffins, and impurities such as hydrogen sulfide and carbon dioxide. Commonly, C2–C4 olefins can be used as raw materials to produce other petrochemical products, while C2–C4 alkanes can be used as feedstock for the production of ethylene by a steam cracking process [6].
Hydrogen is an essential resource used in many processes, such as hydrotreating and hydrocracking. A variety of factors, including increasingly stringent environmental regulations, have increased the demand for higher-quality fuels, and the use of high-sulfur crude oil and heavier oil have forced refineries to process crude oil more thoroughly, causing hydrogen consumption to skyrocket [7,8,9,10]. Although steam methane reforming (SMR) is the dominant industrial process for hydrogen production, environmental concerns related to CO2 emissions, along with process intensification and energy optimization, are areas that still require improvement [11]. Depending on the H2 feed composition, product flowrate, reliability, required output purity, and costs, the selection of the most advantageous technique is done [12]. Membrane-based separation processes, a cryogenic process, and pressure swing adsorption (PSA) have been suggested as alternative technologies to reduce the cost and energy requirements of H2 production as compared to steam methane reforming [13,14,15,16,17].
Light hydrocarbons (LHCs), namely C1-C9 hydrocarbons, which mainly originate from natural or petrochemical gas processing, are essential energy resources and raw materials for the production of some industrially important chemicals [18]. The separation of LHCs into a pure species is a very critical and challenging industrial process and has always highly concerned scientists. Typically, distillation, the use of rubbery organic vapor membranes, and absorption are the three main conventional methods for LHCs purification in the process of industrial production [19]. Refineries may recover LHCs from off-gases, and thus make more profit on these products instead of simply using them as fuel gas [20,21,22,23,24].
In the recovery process of profitable compositions in refinery tail gas, due to the large number of streams, complex components, and various separation methods, it is very difficult to determine the optimal separation sequence. Many heuristic methods [25] based on engineering experience, in addition to evolutionary methods [26] by way of enhancing preliminary processes, have been proposed to determine separation sequence for the process. For example, Bausa et al. [27] presented a shortcut design method for hybrid membrane-distillation applicable to multi-component, non-ideal mixtures, and Kao et al. [28] obtained the optimal separation sequence according to modified cost measures, in contrast to an easy-to-use, matrix-based method for the systematic synthesis of distillation configurations as described by Shenvi et al. [29]. However, heuristic methods can only obtain the near-optimal sequence without checking all possible sequences, and they make it difficult to obtain the global optimal solution. Mathematical programming methods and intelligent algorithms for separation sequence synthesis, such as the mixed integer nonlinear programming (MINLP) model and genetic algorithm (GA), are too complex and difficult to calculate the optimal sequence because professional mathematics skills are required. Thus, a graphic synthesis method presents an opportunity to save equipment investment and operation costs by sharing equipment and facilities, along with saving time and effort in synthesis, thereby ensuring better separation sequences [30].
The information required to generate configurations in a multi-input separation process includes the number of components in feed and their compositions, as well as the number of distinct compositions in the final product stream. Separation unit operations are the basic elements used to construct the separation process. In this context, a typical multi-input component separation process consists of fractionating the feedstock into desirable multi-product at minimum operation costs.
Integrated processes for executing refinery gas separation tasks could be regarded as the typical multi-input and multi-component problem. Together with the development of novel membrane materials with improved separation performances, process design becomes a key issue in the economics of a membrane-based separation process [31,32]. In this context, optimization of both the membrane module and the whole membrane-based process is the main concern for improving the performance of this separation technology. Certainly, they can easily be used for testing and providing valuable information about the sizes of the process units, as well as the operating conditions of the entire process flowsheet in a short time [33,34,35]. In conjunction with material science and the process system engineering field, this study widens an important research area towards the improvement of a membrane-based separation processes.
In this study, a graphic synthesis method was used to design a novel appended process of H2/LHCs production based on the dominant regions of the common technologies for treating refinery gases. The method, which is a shortcut based on the representation of operations by vectors in the composition of space, was proposed in this research to give a rapid response to a multi-input feed system. Moreover, attention was particularly paid to the influence of key parameters such as membrane area, stage cut, and permeate pressure of the process design. A further economic assessment stipulates that the novel process’s total investment and yearly total cost of production brings in an annual product profit of USD 38.62 × 10⁶, and thus is more economically feasible.

2. Process Design

2.1. Problem Description

A hybrid process of membranes and PSA, coupled with shallow condensation (SC), was designed to recover hydrogen and LHCs from 10 streams of refinery gases (from a SINOPEC Petrochemical Company in Luoyang, China), as shown in Table 1. The designed process uses H2 selective membranes (GPM) and PSA to recover and purify hydrogen, respectively, by appending rubbery organic vapor membranes (RPM) and shallow condensation to the design for LHCs recovery.
Due to the combinative nature of process design, the difficulty in synthesizing an optimum, multi-input production process is inadequately exasperated, along with the increase in the available separation methods and number of components. In the case of using M methods to separate a stream of N- component mixture to yield N streams of pure products, the number of candidate production sequences can be given by [25,30]:
2 N 1 ! N ! N 1 ! M N 1
Therefore, for the synthesis of a separation sequence for 10 streams and 4 separation methods, the number of candidate schemes is 1.27 × 10⁹. Although most schemes can be removed according to empirical rules, this sequence synthesis is still a complex combinatorial arrangement problem.

2.2. Process Design Based on a Graphic Synthesis Method

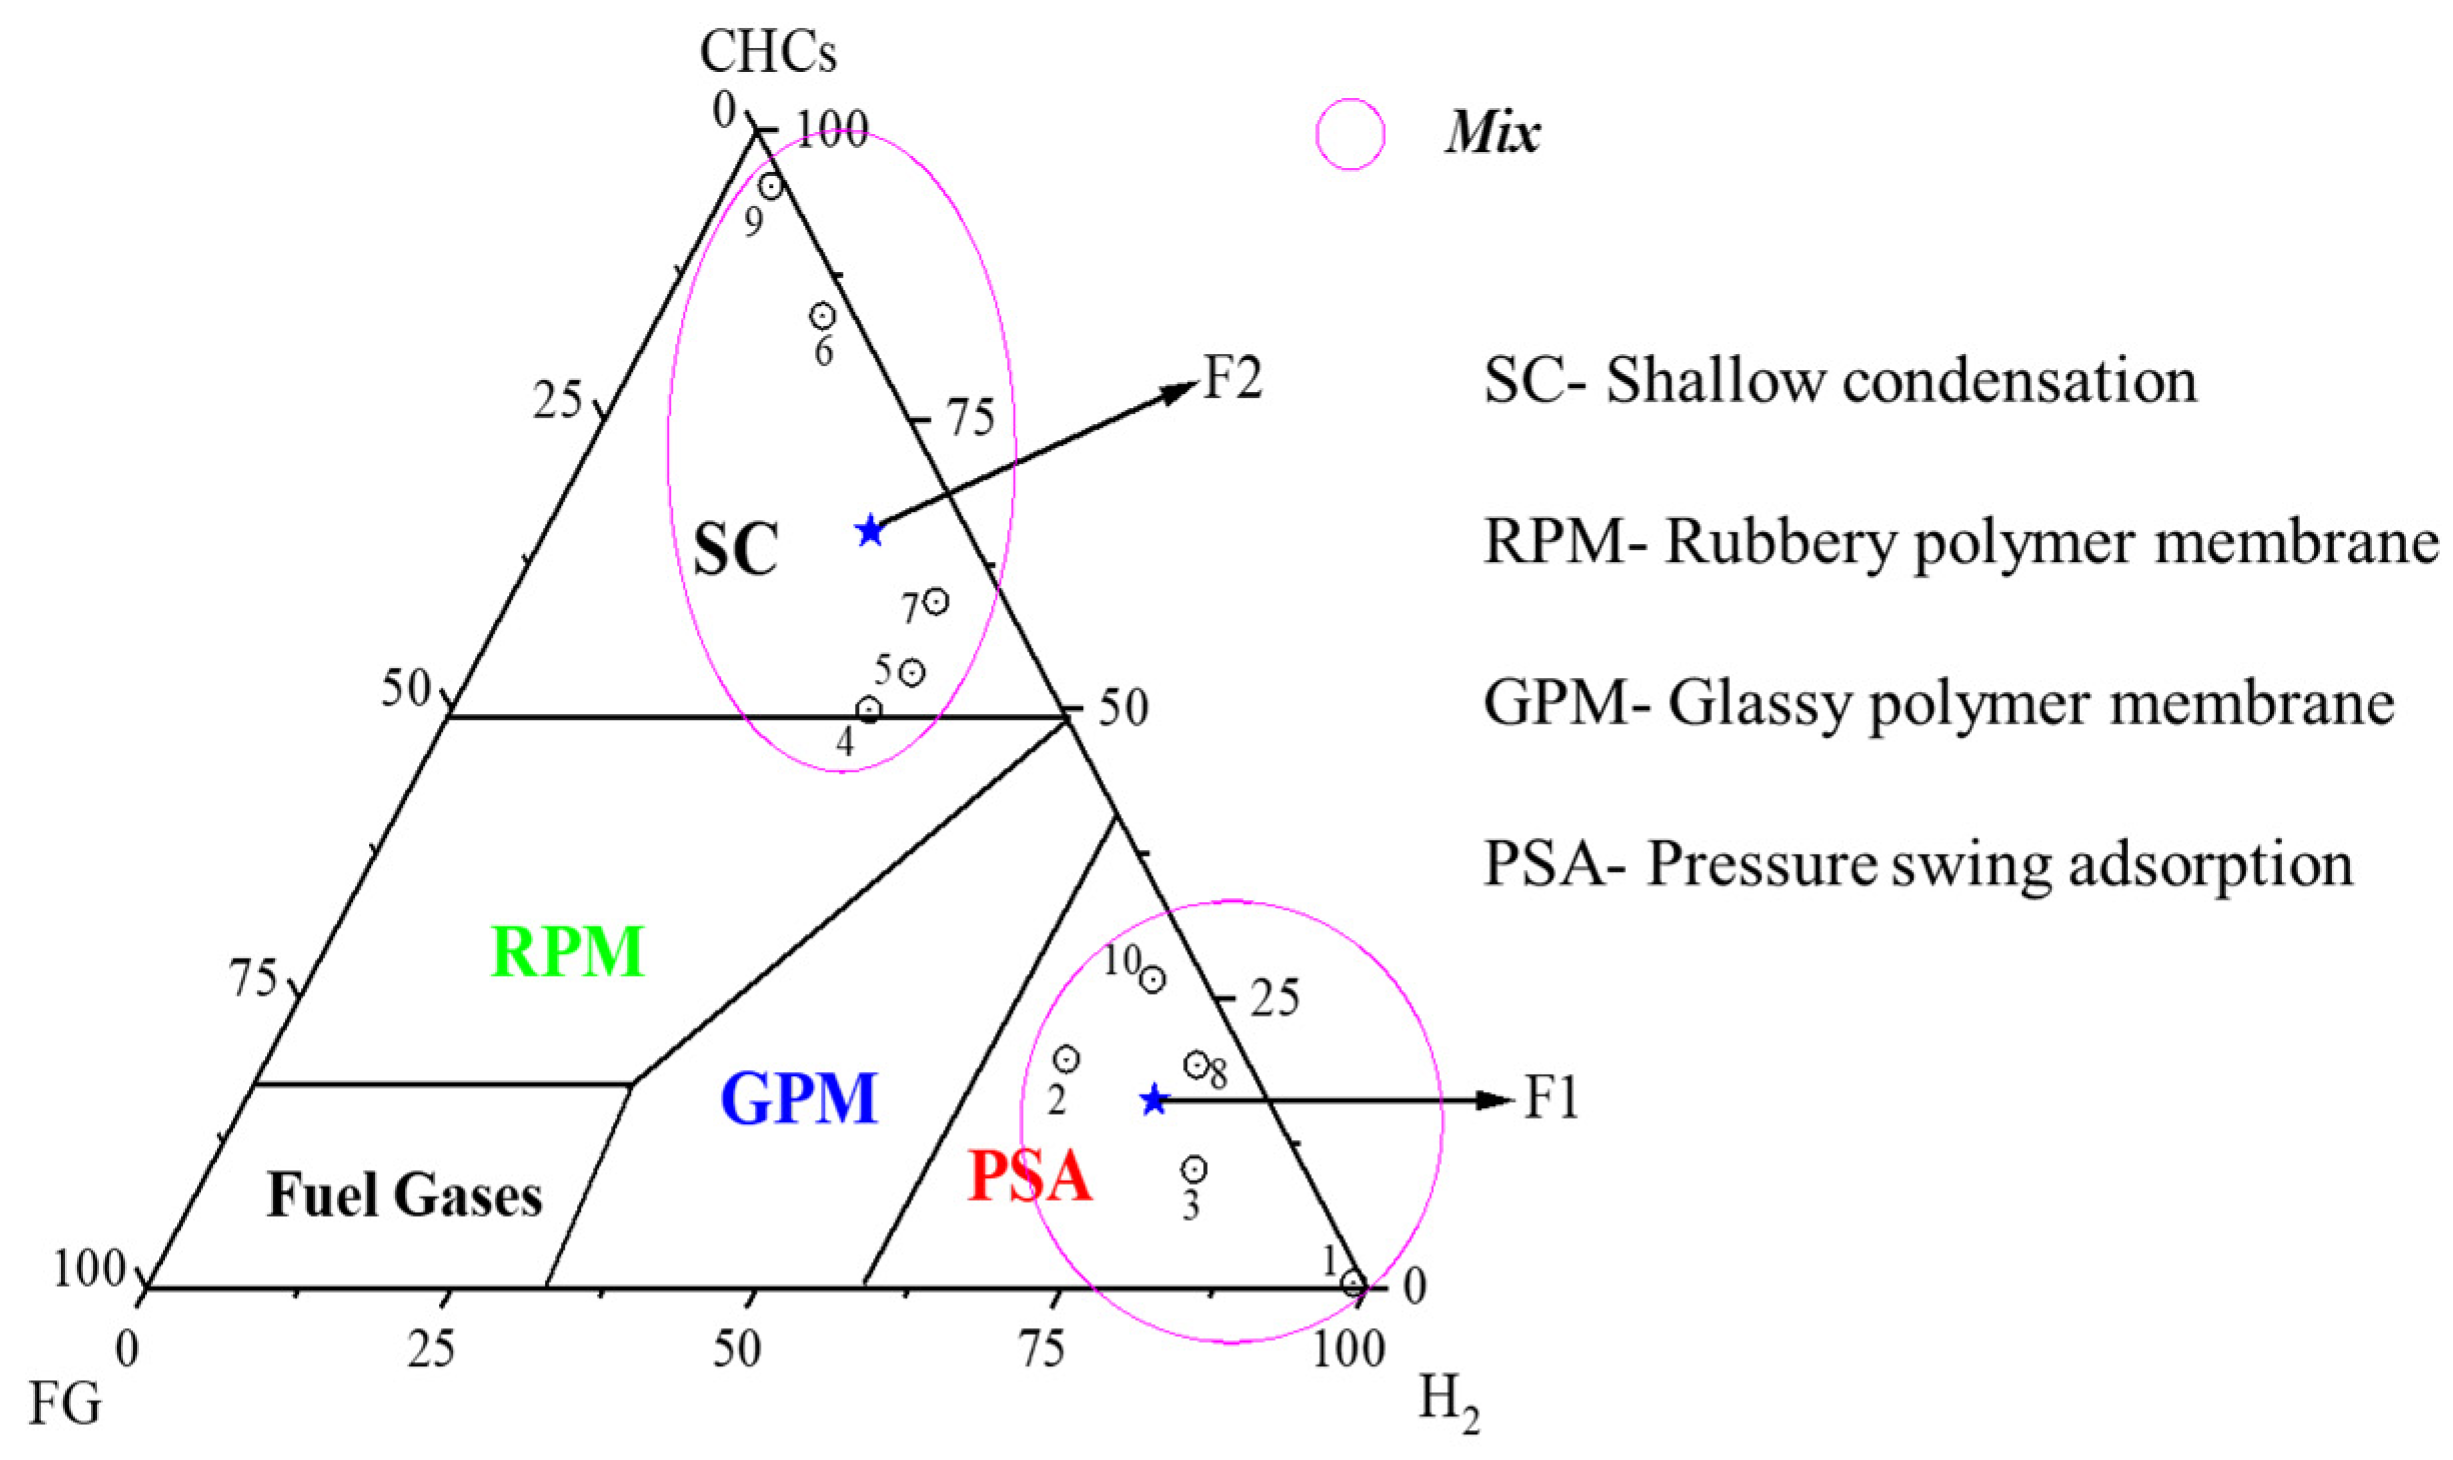
2.2.1. Representation and Merging of Feed Gas Streams Based on a Triangular Coordinate System

A steady, complex selection that combines similar refinery gases into various input streams is proposed to reduce the stream number involved in the design. Before blending the feed streams, a satisfactory standard is demanded to grade refinery gas. The dominant ranges of separation techniques can be used as the ready-made criterion demonstrated by Ruan et al. [30]. According to the concept for dividing these ranges, refinery gases stationed in the same dominant range can be treated proficiently by the correlating technique, and therefore they can be graded together as a cluster. The refinery gas territory for incorporating the multi-input process and the 10 gas streams, each located in the region of separation, can be seen in Figure 1. The designed process converts the 10 streams into 2 streams, where streams 1, 2, 3, 8, and 10, in line with the component composition of each stream, combine to form the mixed stream F1, and streams 4, 5, 6, 7, and 9 form the mixed stream F2. This is because streams 1, 2, 3, 8, and 10 are in the separation advantage area of PSA, whereas streams 4, 5, 6, 7, and 9 are in the SC separation advantage area. Therefore, the complex problem of 10 input streams is simplified to 2 mixed streams, which greatly reduces the difficulty of the process. Suitable separation unit operations are selected, then converted into a reasonable process sequence, and with these procedures, the complicated work to select the optimum sequence from numerous candidates can be greatly reduced.

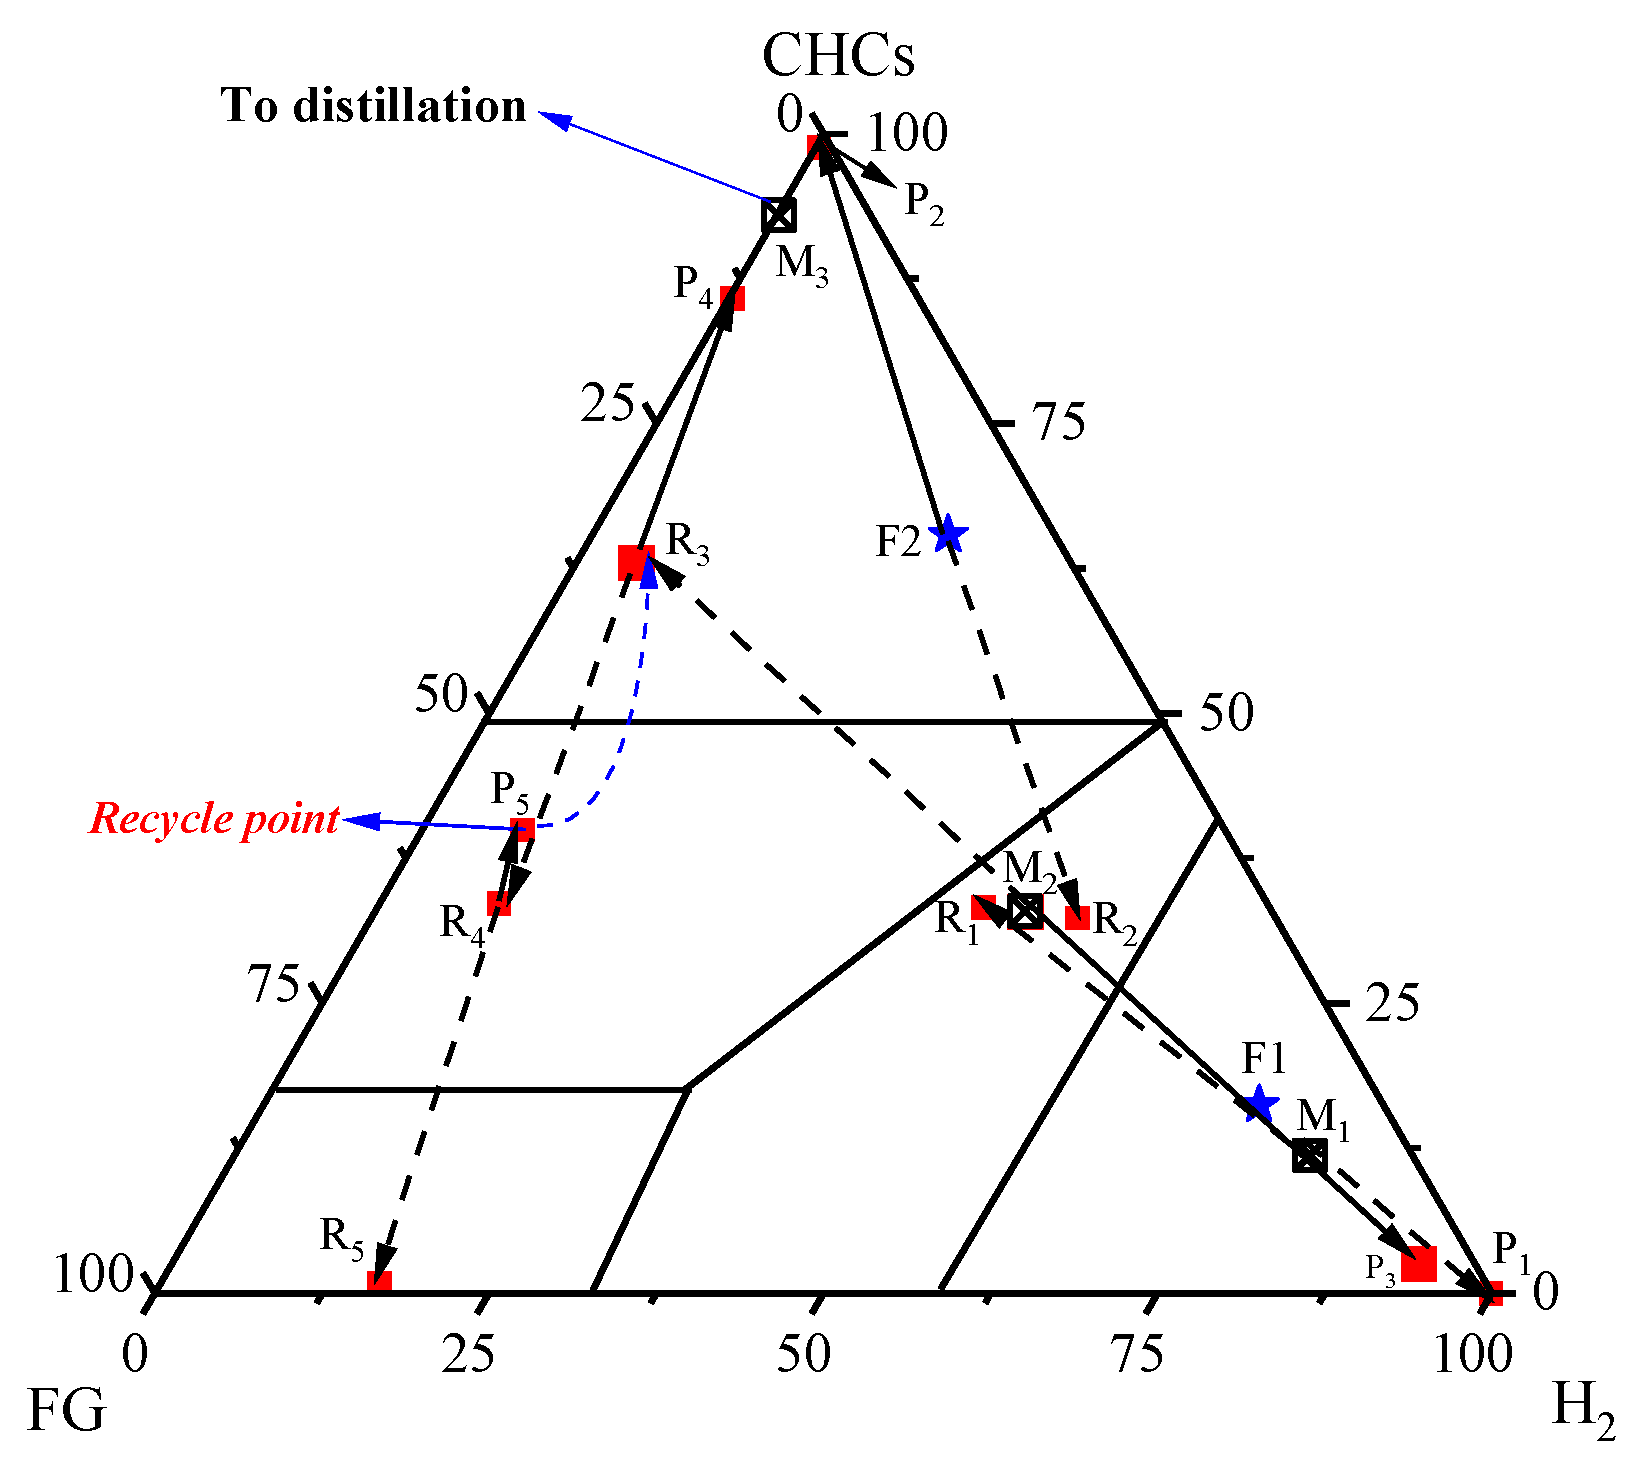
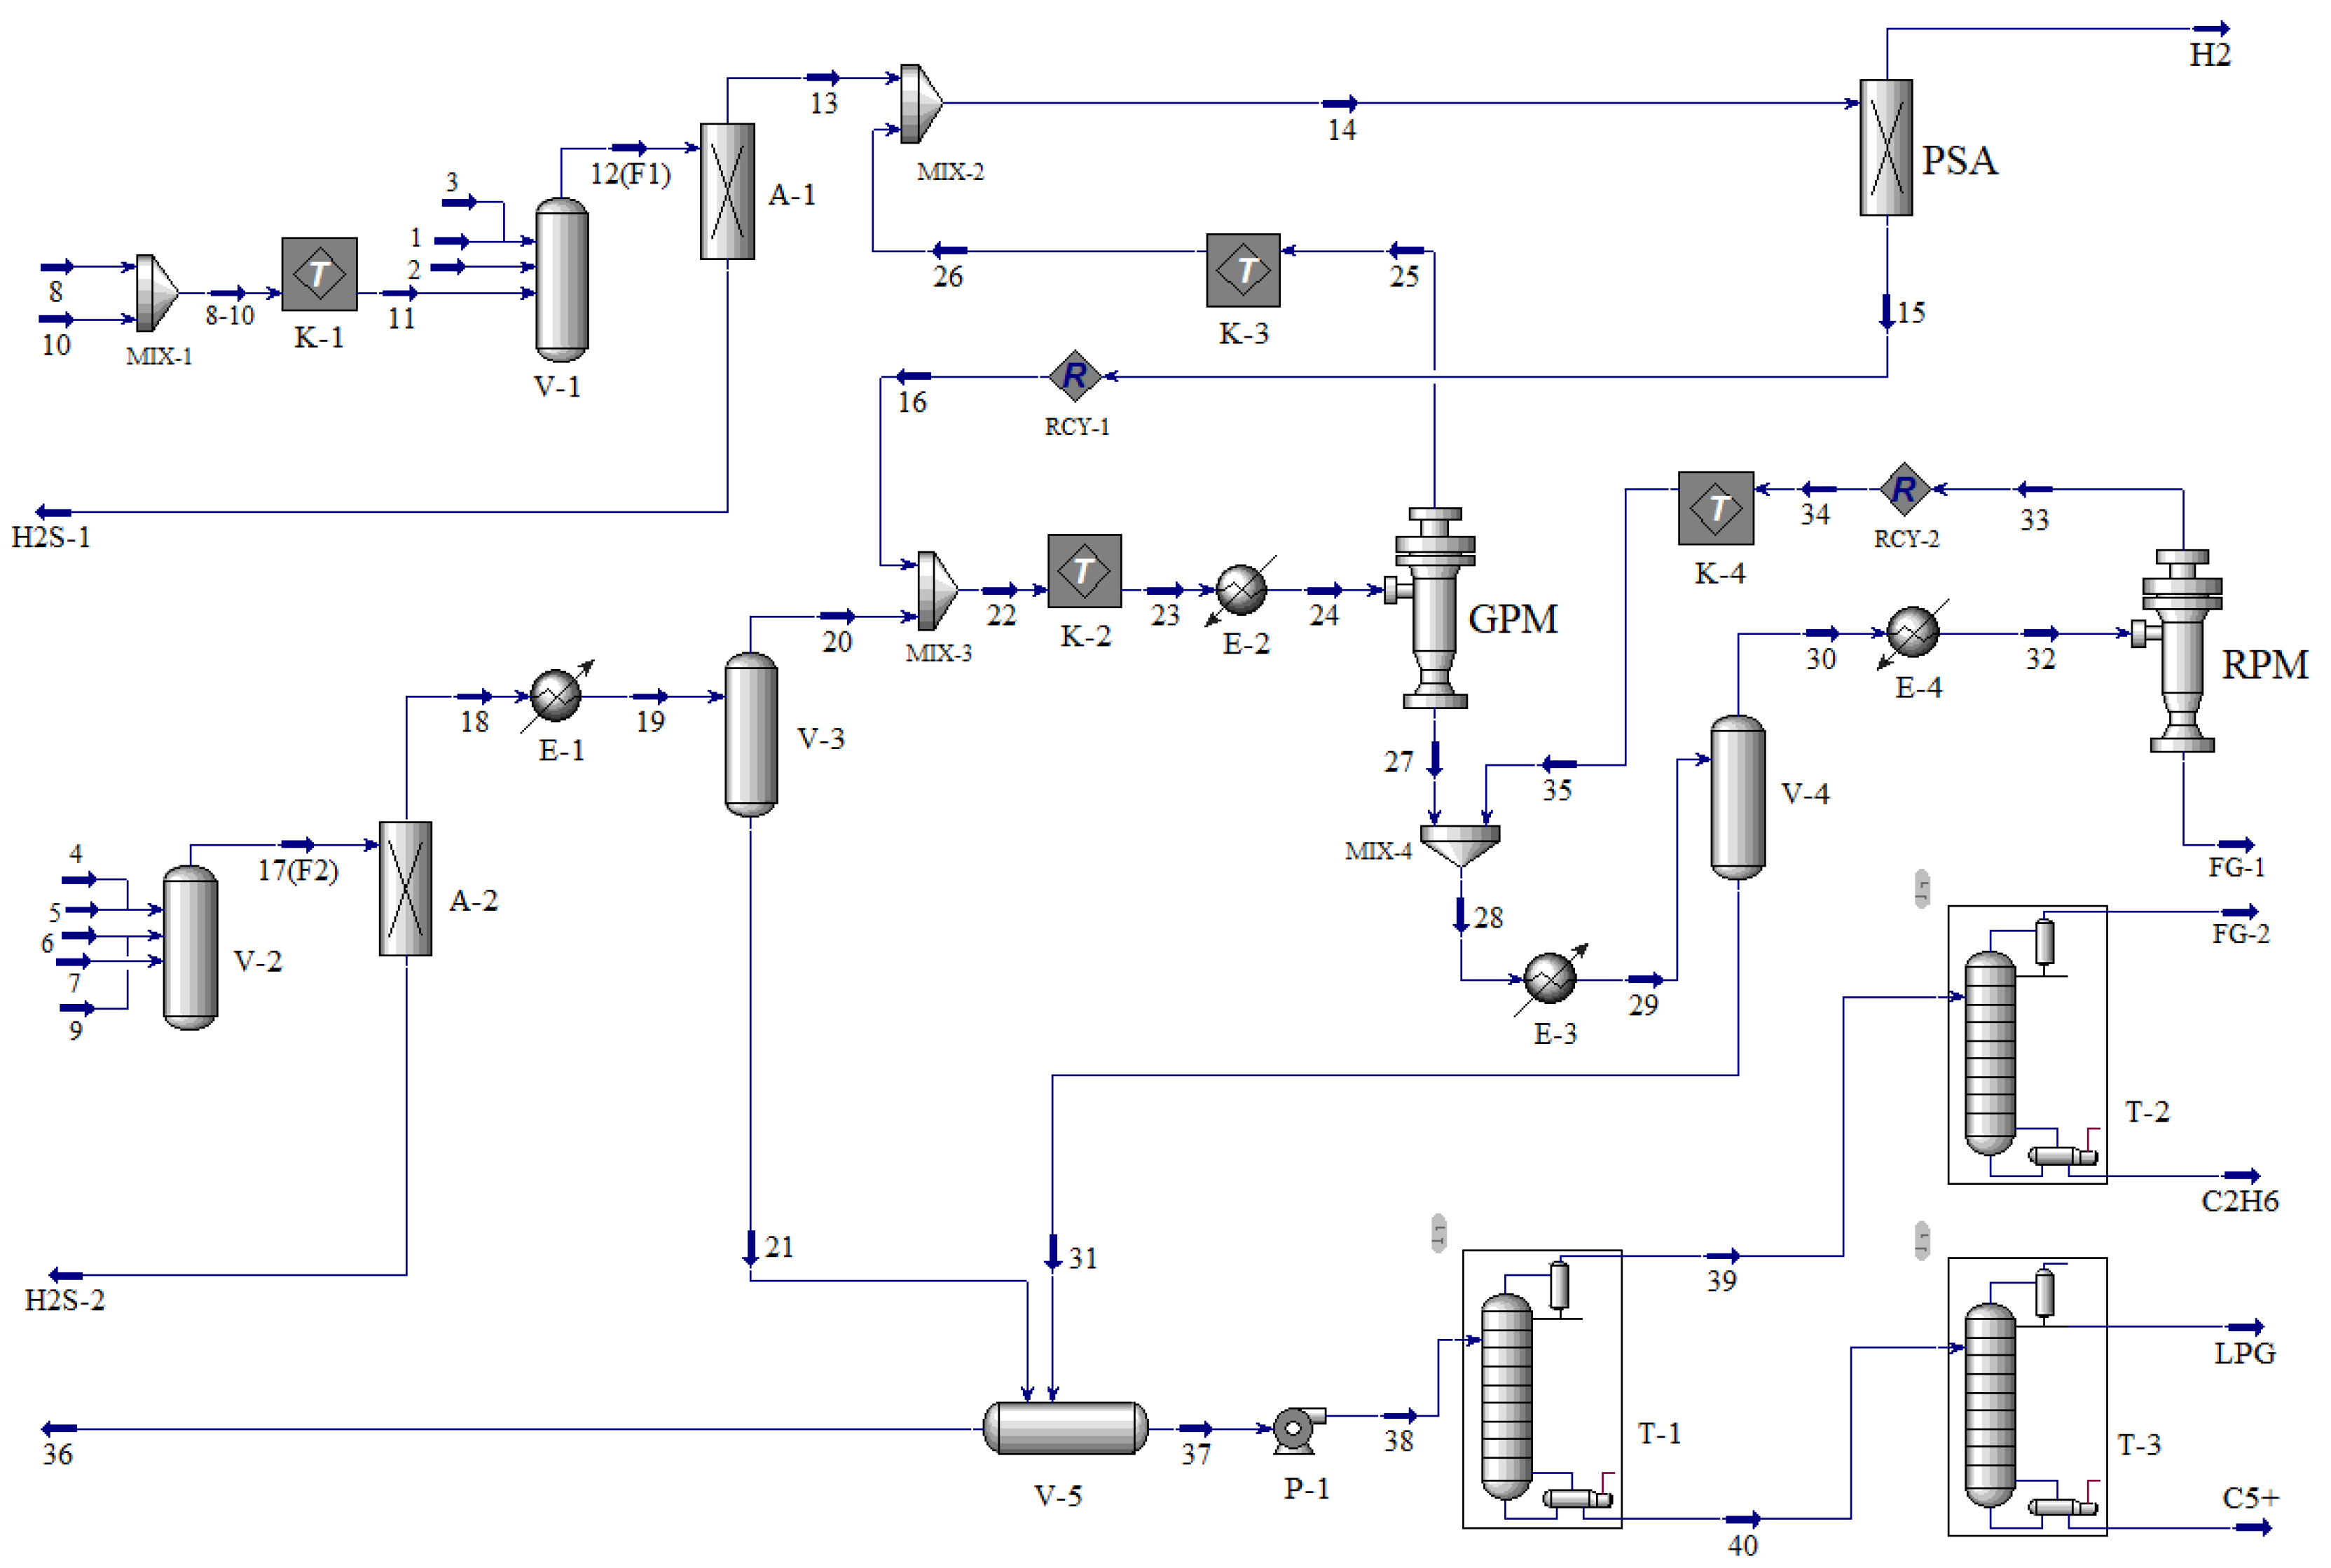
2.2.2. Separation Sequence Determination and Process Design

The synthesis starts by placing these input streams in the coordinate system, as shown in Figure 2, in which P and R relate to the product and the residue, respectively. The two inputs (F1 and F2) are located in the ranges of two different separation techniques (PSA and SC), and then primary operations for separations are determined: PSA separates H2 in F1, and SC separates LHCs in F2. These primary operations are represented by the vector couples in Figure 2, and the compositions of their residual streams are appraised by the approximate technique suggested in Figure 1. In the majority of cases, the valuable species in the residual gases are still substantial and further recoveries are required (or attainable). The desorbed gas from PSA, denoted as R1 and located in the territory of the glassy polymer membranes (GPM), is mixed with R2 from the input stream F2, and the new mixed point, denoted M2, is sent to a GPM, which in this case is polyimide. GPM is efficient in treating refinery gases with a lower H2 input content in the range of 30 mol% to 60 mol%. The H2 produced from GPM containing 96 mol%, denoted P3 and located in the PSA territory, is mixed with F1, forming a new mixed point denoted M1. The residue rich in LHCs, denoted R3, with the aid of a SC system, produces R4, located in the RPM territory, which is sent to the rubbery polymer membrane (RPM). A further separation takes place in this membrane, and the permeate denoted as P5 is recycled while the retentate denoted R5 produces fuel gas, as depicted in Figure 3. The membrane description, along with permeance and in addition to the main separation technologies, can be found in Appendix D. The permeate P2, rich in in LHCs, with a content higher than 95 mol% according to the position in coordinate system, together with P4 of the second condensation system, form the mixed stream M3. The point M3 is then sent to the distillation columns. Finally, the separation flowsheet designed can be seen in Figure 3.
Basic modules, such as compressors, heat exchangers, distillation columns, etc., were included in the simulation process in this work, which was done in UniSim Design. In the case of the membrane module, our former groupmate programmed the precompiled dynamic link library (DLL) file, which included the algorithms and external definition file (EDF) defining the portable document format (PDF) icon and user interface in UniSim Design, allowing for the easy and quick simulation of gas membrane separation [36]. The simulation model was constructed in UniSim Design and was based on the design criteria, as well as the basic parameters, and the Peng–Robinson equation was chosen as the state equation. This equation was chosen as there is no other simple Van der Waals equation of state that has demonstrated such broad and consistent applicability to the calculation of vapor–liquid equilibria (VLE) for systems containing light hydrocarbons, permanent gases, carbon dioxide, and hydrogen sulfide [22,30]. The simulation process flow diagram of the illustrative multi-input separation process in UniSim Design is illustrated in Figure 4.
In Figure 4, streams 8 and 10, with pressures of 1.15 and 0.7 MPag, are initially mixed together, then pressurized to 2.4 MPag by compressor K-1 and cooled to 40 °C, as there will be a significant pressure loss if mixed immediately with streams 1, 2, and 3. The compressors run with an isentropic efficiency equal to 75% in simulation. The newly formed stream 11 is mixed with streams 1, 2, and 3 utilizing V-1 flash separator to produce the first mixed stream F1, whereas streams 4, 5, 6, 7, and 9, with similar pressures of 0.75, 0.65, 0.86, 1.30, and 0.58 MPag, respectively, are mixed using a flash separator V-2 to produce the second mixed stream F2. The mixed streams F1 and F2 are first introduced to the adsorption towers (A-1 and A-2, respectively) with the aim of removing H2S impurities. Secondly, the F1 and F2 H2S free streams (13 and 18, respectively) are sent to their primary unit operations, as designed. F1 is conveyed to the PSA (PSA data can be found in Table A2) to procure high purity H2 (99.9 mol%), while F2 enters the condensation system, with the temperature of E-1 being −40 °C for H2 and LHCs production. The gaseous phase stream 20 from the condensation with approximately 50 mol% H2 mixes with the residual stream 16 of the PSA containing 40 mol% H2. The newly formed stream 22 is pressured by K-2, then introduced into the GPM. Approximately 96 mol% of H2 is recovered from the permeate stream of the GPM, re-pressurized by K-3, cooled, and then mixed with stream 13, which enters the PSA for further H2 purification. The residual stream of GPM containing 63.53 mol% LHCs is fed to the second condensation system, E-3, at a temperature of −30 °C, and the vapor stream after passing through flash V-4 is heated by E-4 to 40 °C before being introduced into the second membrane unit, RPM. In this membrane, the LHCs produced via the permeate stream 33 are first pressurized to about 2.4 MPag by compressor K-4 and then cooled and recycled, whereas the residue is collected as fuel gas. Finally, the liquid phases (the bottom streams 21 and 31 from V-1 and V-2) of the first and second condensation systems are mixed together and then conveyed to the distillation systems.

3. Sensitivity Analysis

3.1. Hydrogen and Light Hydrocarbon Production

The graphic synthesis design consists of establishing the optimal unit operations and their interconnections. The work done here was able to produce ≥ 99.91 mol% H2 and 99.8 mol% of LHCs, as shown in Table 2. Importantly, the ethane produced is meant for ethylene production through a steam cracking process.

3.2. Membrane Area

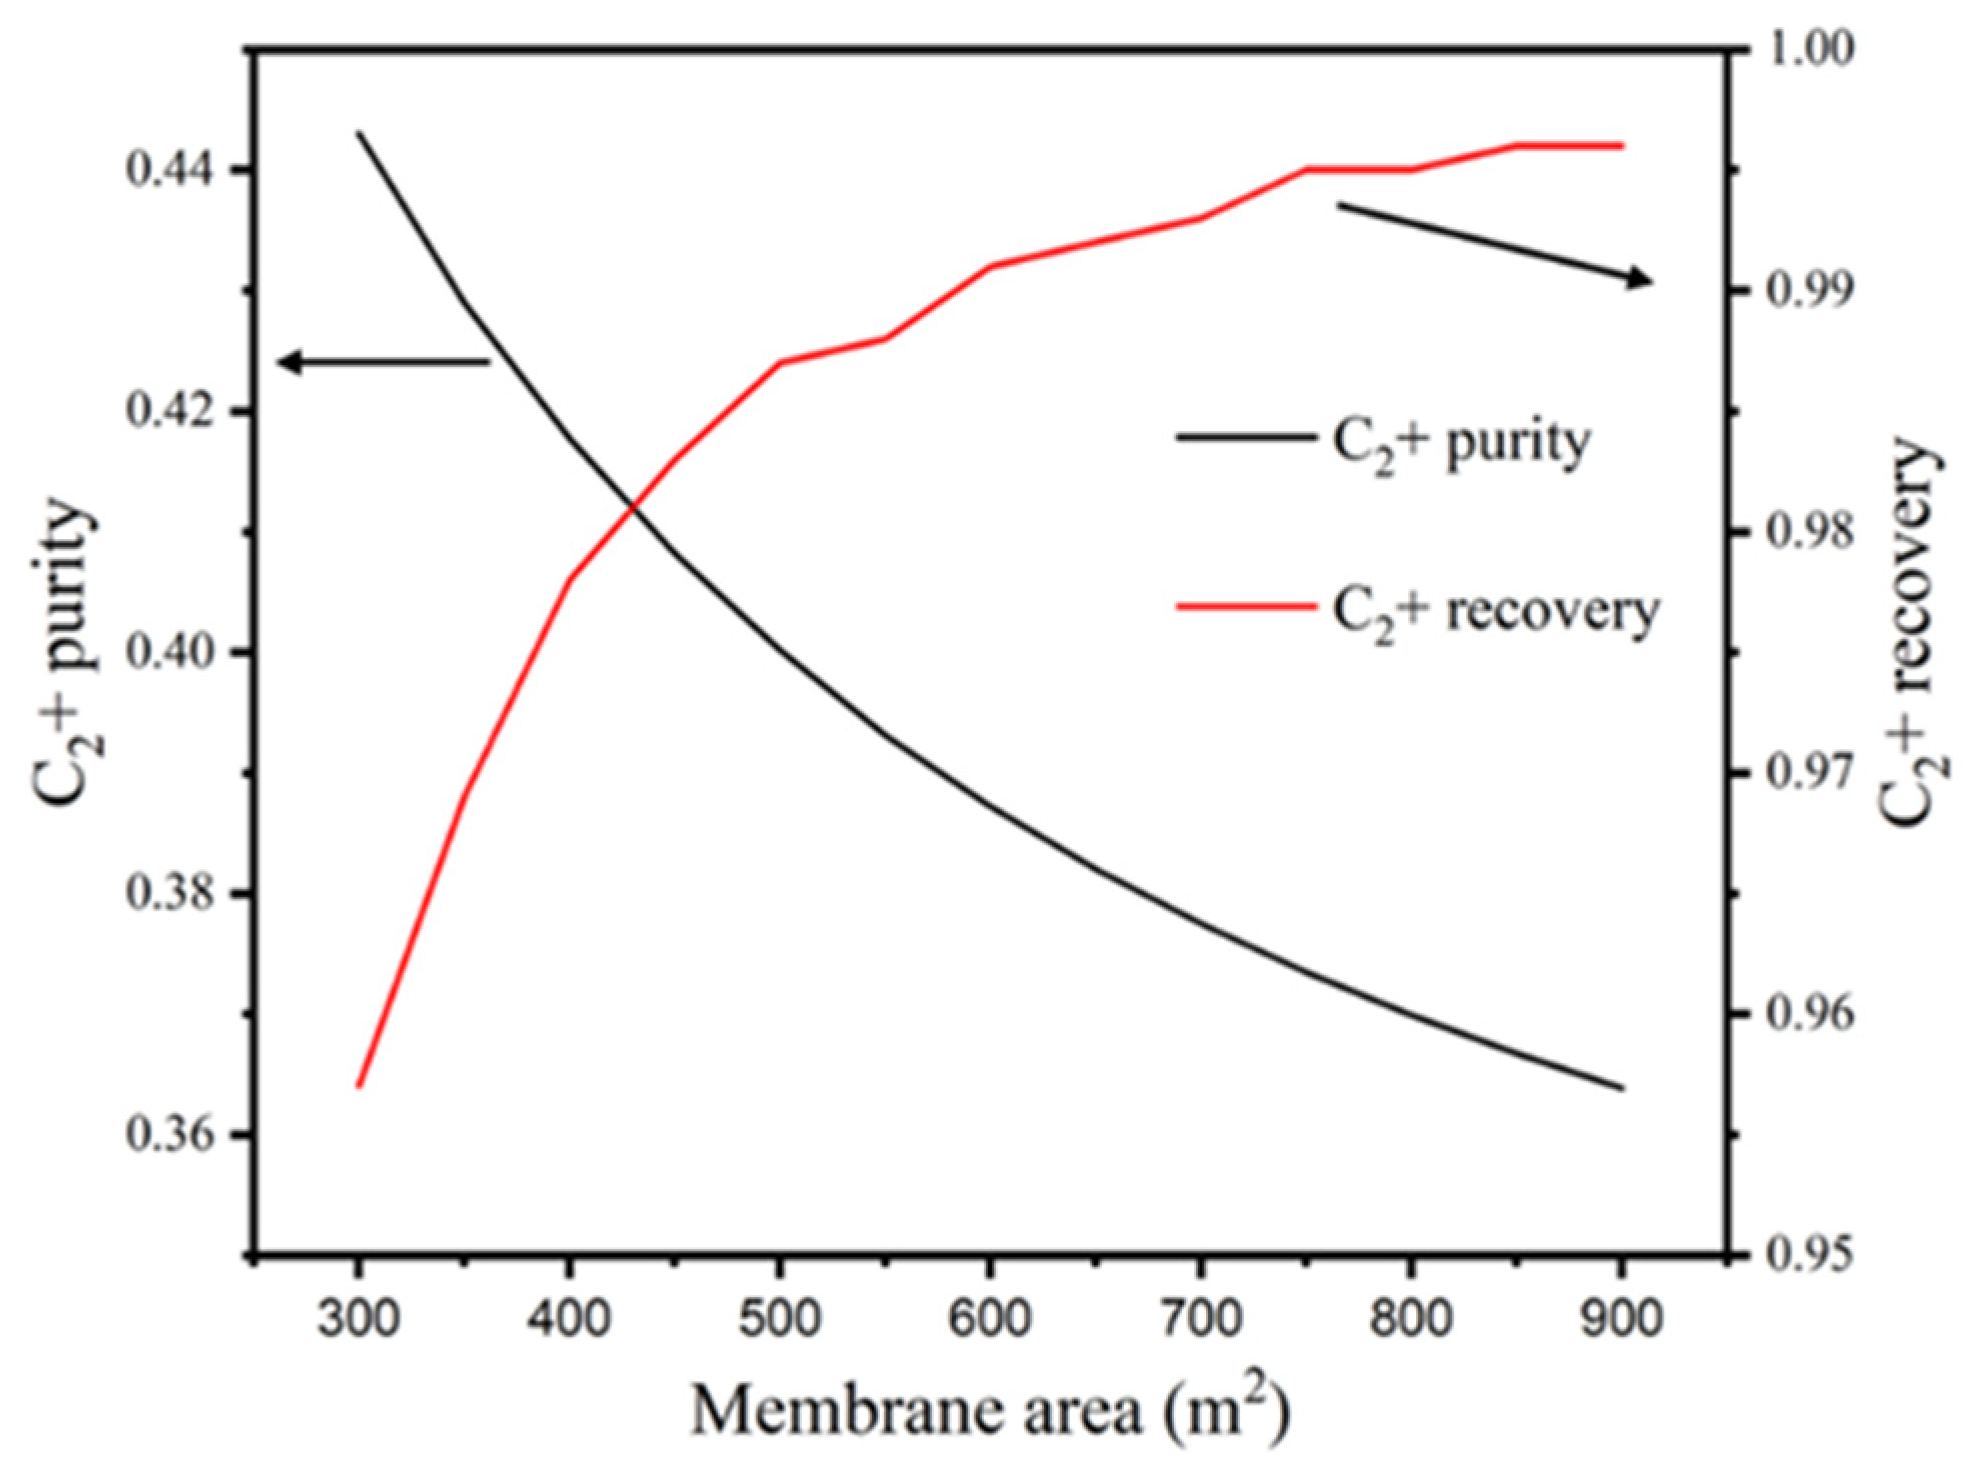
3.2.1. Impacts of RPM Area on the Purity and Recovery of C2+

Figure 5 shows the effect of the RPM membrane area on the purity and recovery of C2+. When the RPM membrane area is more than 600 m2, the C2+ recovery is almost at a constant value (99.5 mol%), while at the same time, the C2+ purity decreases slowly. LHC/H2 permeation across the RPM membrane was found to be notably affected by the sorption behavior of the permeant, and thus characterized as a sorption-selective process. In addition, the RPM membrane has a very high selectivity with regard to LHC due to diluting the H2 component, with LHC component selectively absorbed in the membrane, thereby blocking permeation. The area with the best performance was then decided to be 600 m2.

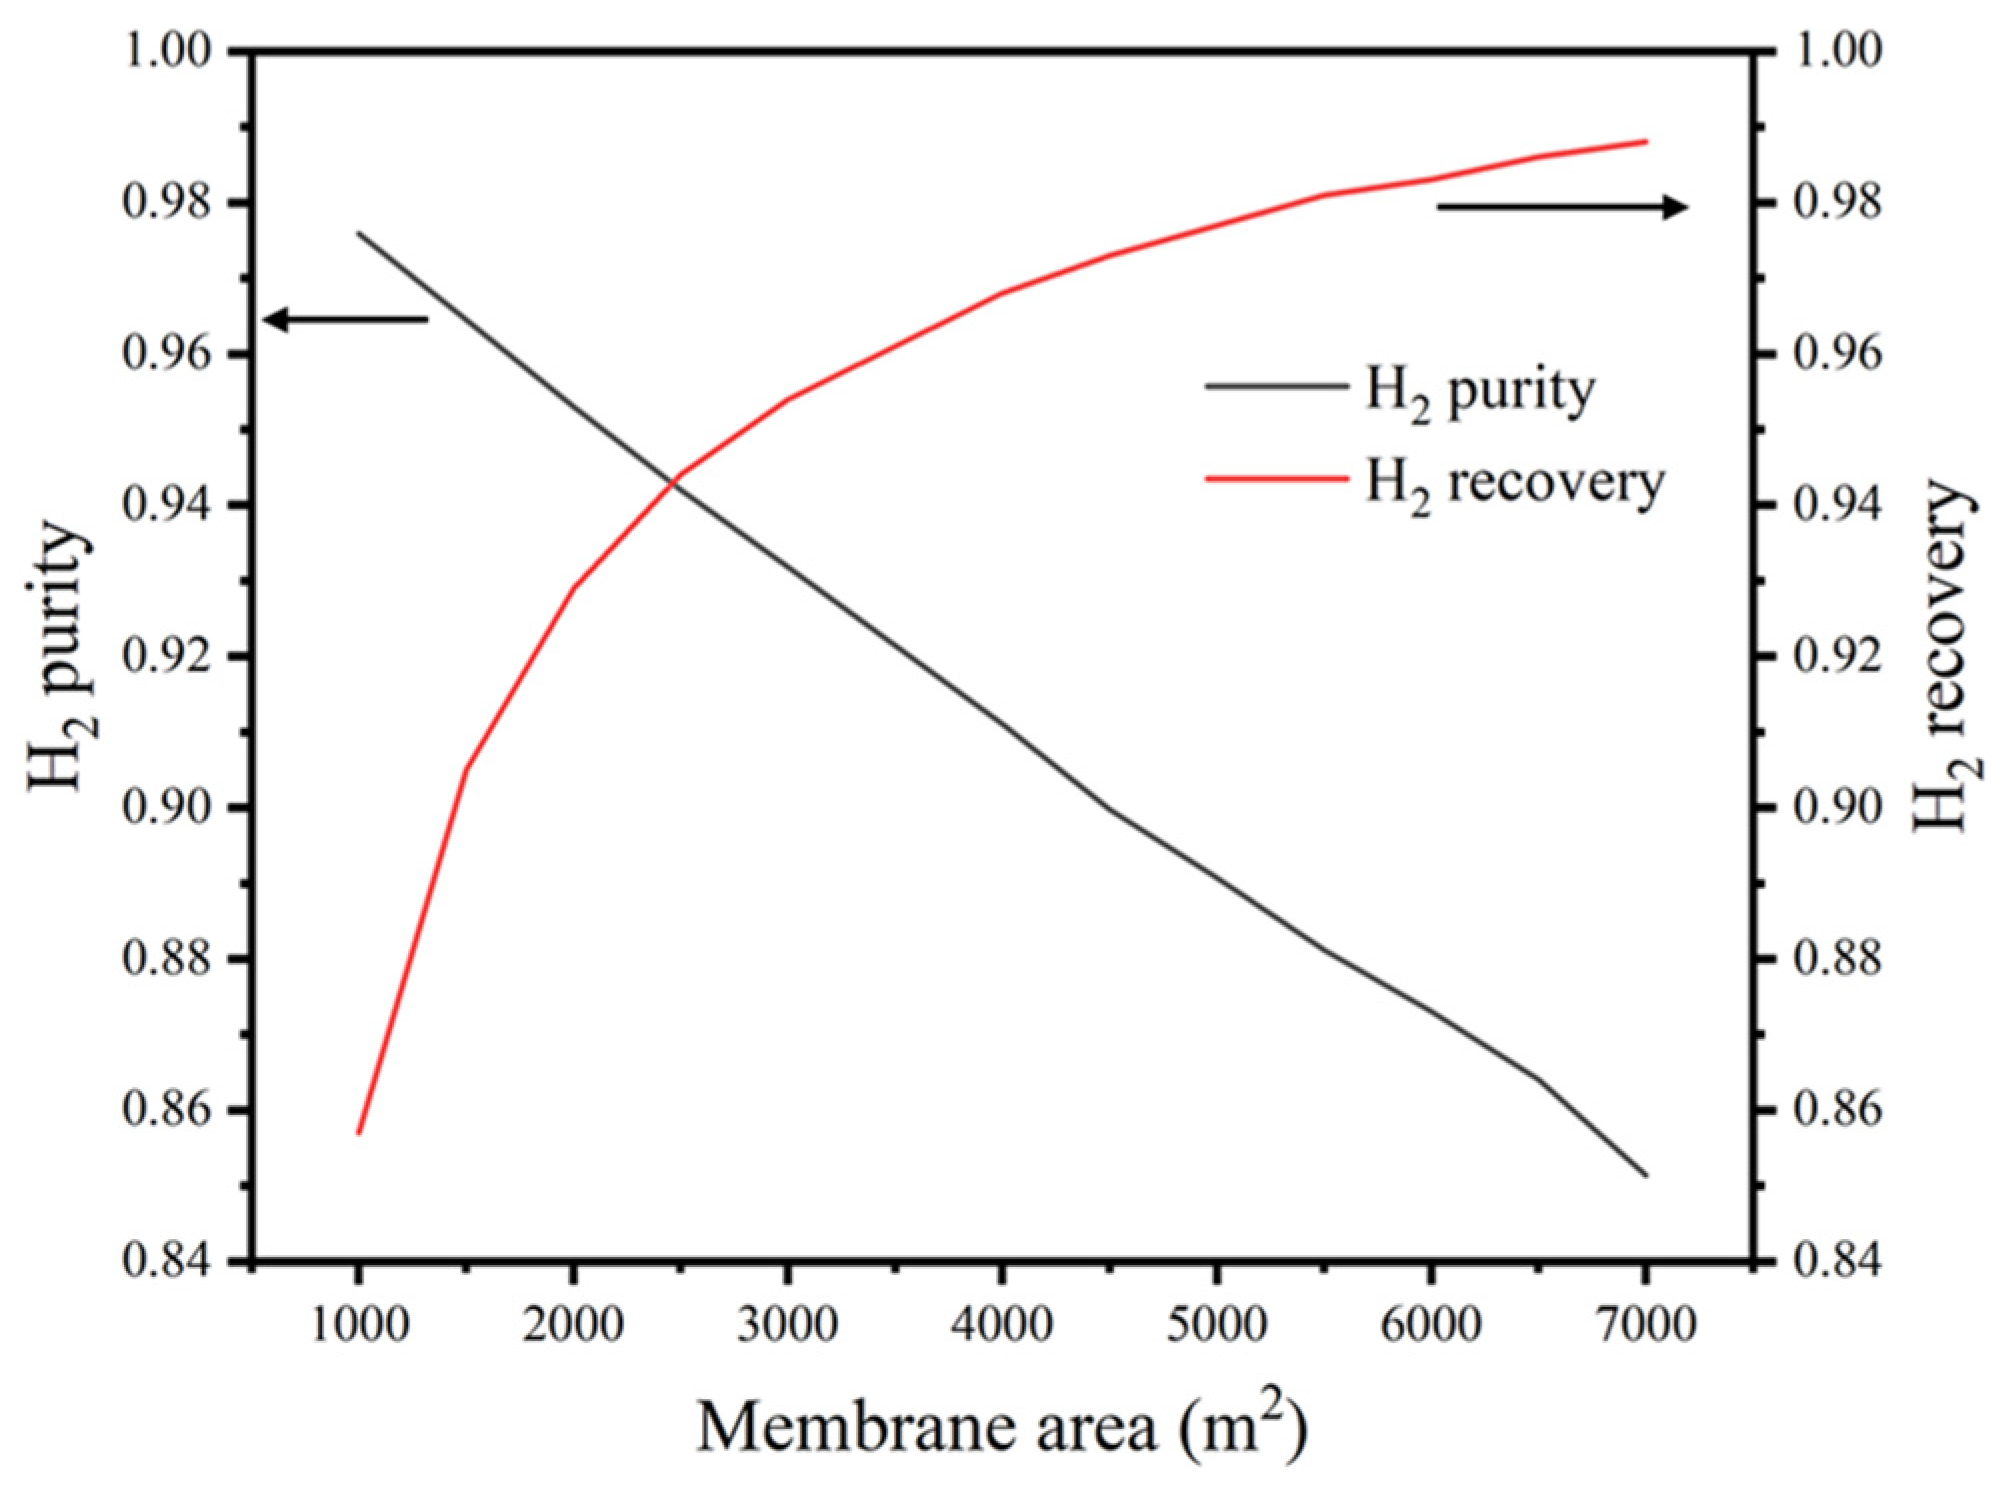
3.2.2. Impacts of GPM Area on the Purity and Recovery of Hydrogen

The area of the membrane dictates the total investment for the membrane module and the product standard; therefore, we studied the effect of the hydrogen membrane (GPM) area on H2 purity and recovery to ascertain the appropriate GPM area. The results are shown in Figure 6. As seen in the graph, an increase in membrane area was followed by a decrease in hydrogen purity accompanied by an increase in hydrogen recovery. The decrease in H2 purity and increase in its recovery stems from the fact that increasing the membrane area of GPM increases the permeation amount of the fast gas component, which would also lead to an increase in the permeation amount of the slow gas component. Further, when the area is large enough, the recovery will no longer vary with the membrane area. On the basis of Figure 6 and the separation necessity, the GPM optimized area was determined to be 3500 m2 in order to keep the purity of hydrogen entering the PSA unit greater than 90 mol%.

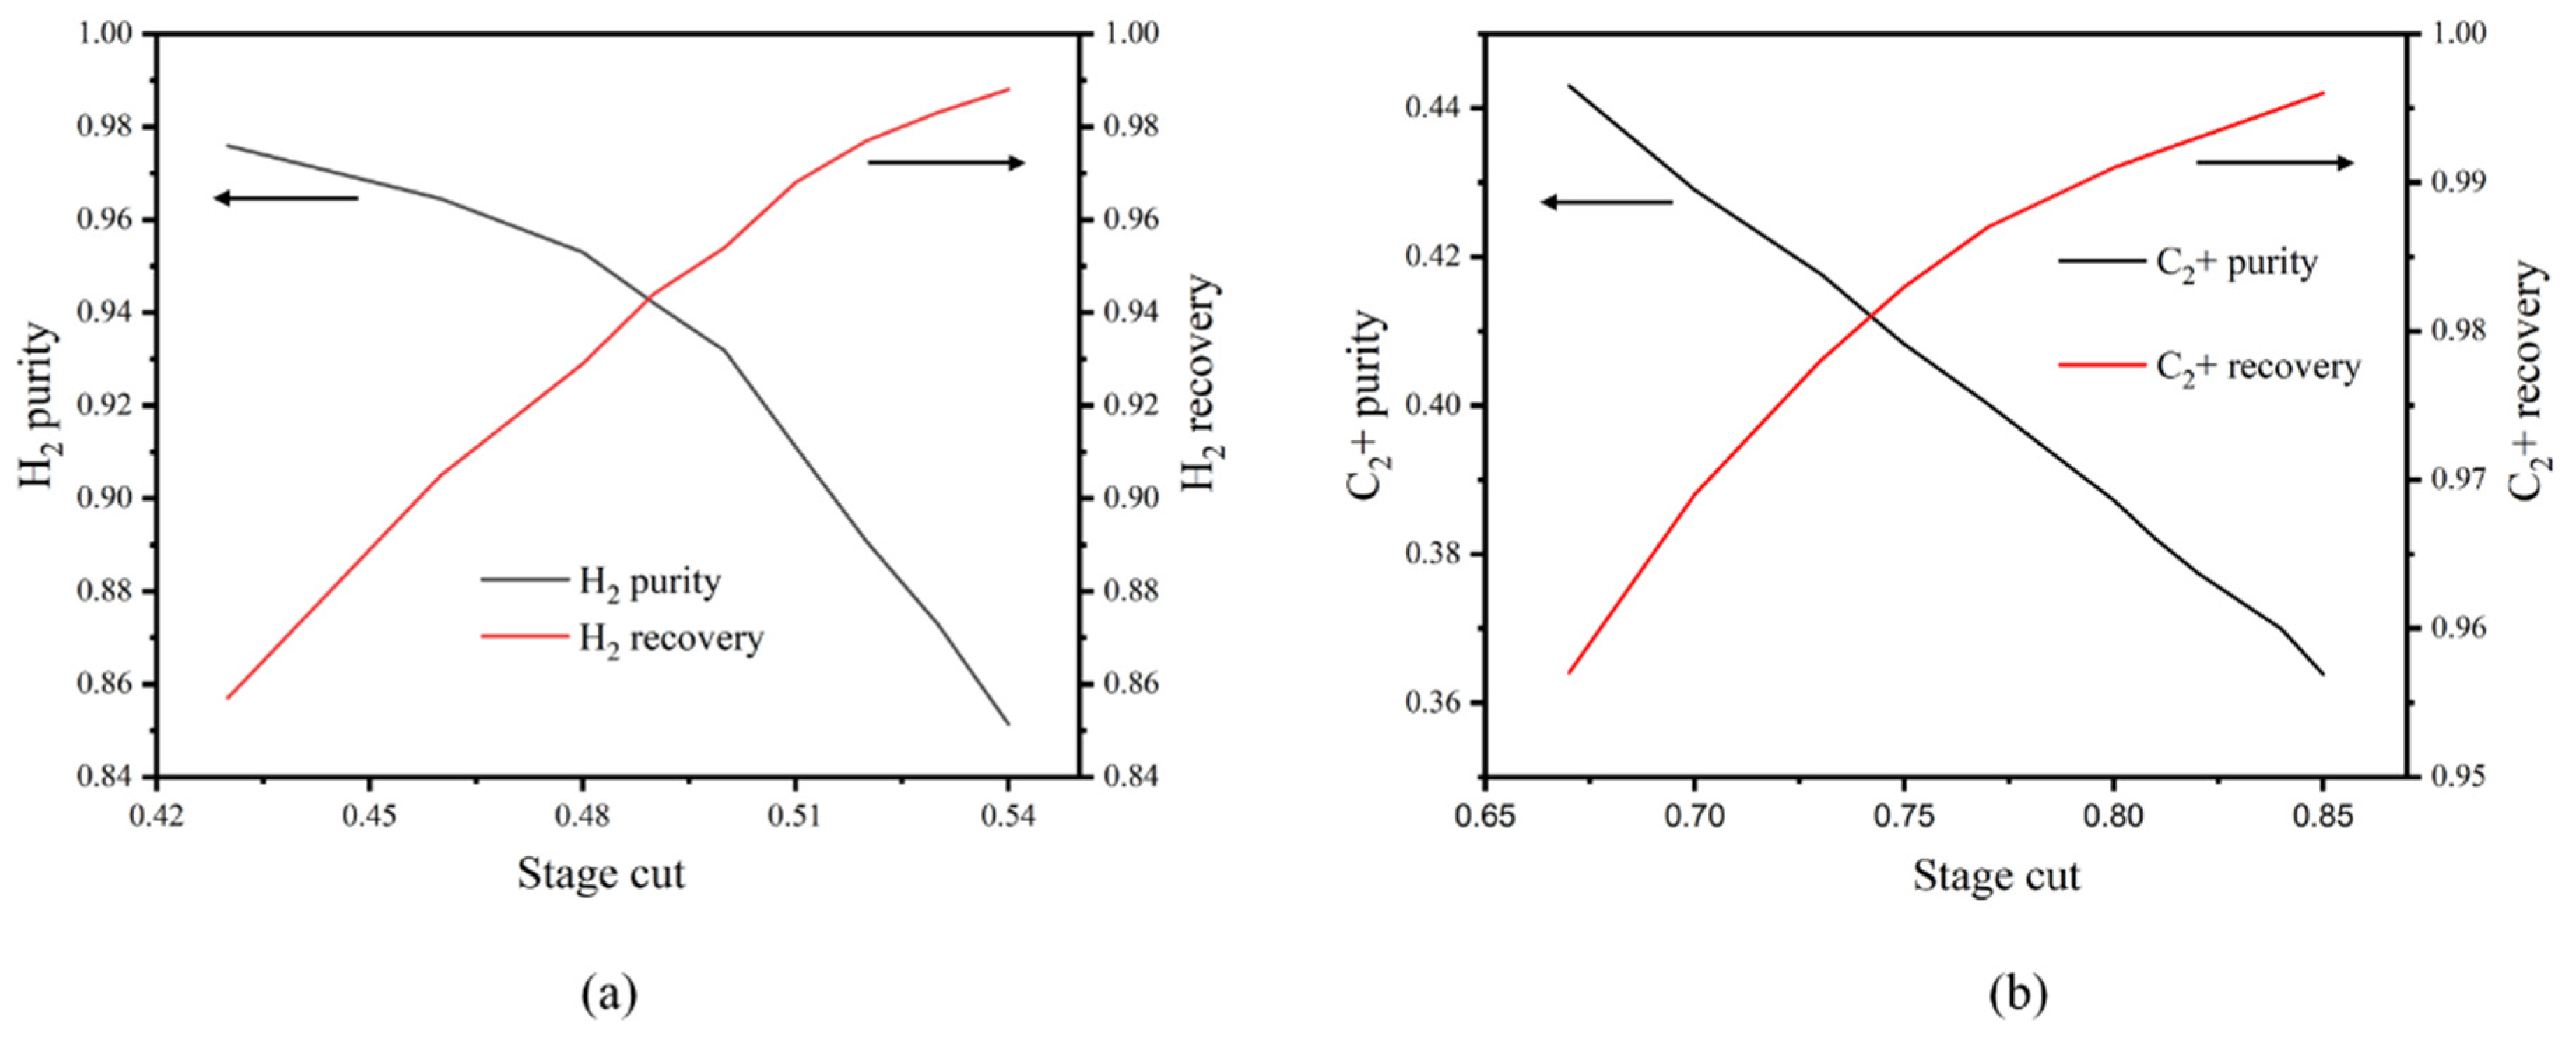
3.3. Impacts of Stage Cut on the Purity and Recovery of C2+ and H2

Figure 7a,b shows the influence of stage cuts on the traditional GPM and RPM modules on the purity and recovery of C2+ and H2 at a pressure of 2400 kPa and operating temperature of 40 °C. It could be observed that both the H2 and C2+ purity decrease with increase of stage cuts in the GPM and RPM membranes. At a high stage cut, most of the feed permeated the membranes, which indicates the high purity of H2 and C2+. However, low stage-cuts are needed to acquire high recoveries of H2 and C2+. Therefore, the driving forces of H2 and C2+ permeation was reduced and H2 and C2+ purity decreased. The selected stage cuts for GPM and RPM are 0.51 and 0.8, respectively. Alongside the change in concentration and recovery, it is important to mention that a smaller stage-cut reduces the size of further gas-cleaning utilities.

3.4. Impacts of Permeate Pressure on the Purity and Recovery of C2+ and H2

The feed and permeate pressures attainable in most gas separations are restricted by economics. In industrial gas separation processes, adjustment of the pressure ratio, which is the ratio of feed to the permeate, comes at a significant price in terms of compressor capital cost and power usage. However, in this case, the permeate pressure is an important process variable since the efficacy of the H2 and C2+ produced by the membrane process depends, in part, on the pressure at which H2/C2+ is produced. We should note that increased pressure has one important effect: it is a higher driving force for permeation. Consequently, increasing the pressure has a positive effect in decreasing the total cost. In Figure 8 below, we observe that an increase in permeate pressure leads to a sharp decrease in H2 and C2+ recovery, while maintaining a stable but modest increase of H2 and C2+ purity. This leads to permeate pressures of 250 and 200 kPa for GPM and RPM, respectively, which is a good compromise.

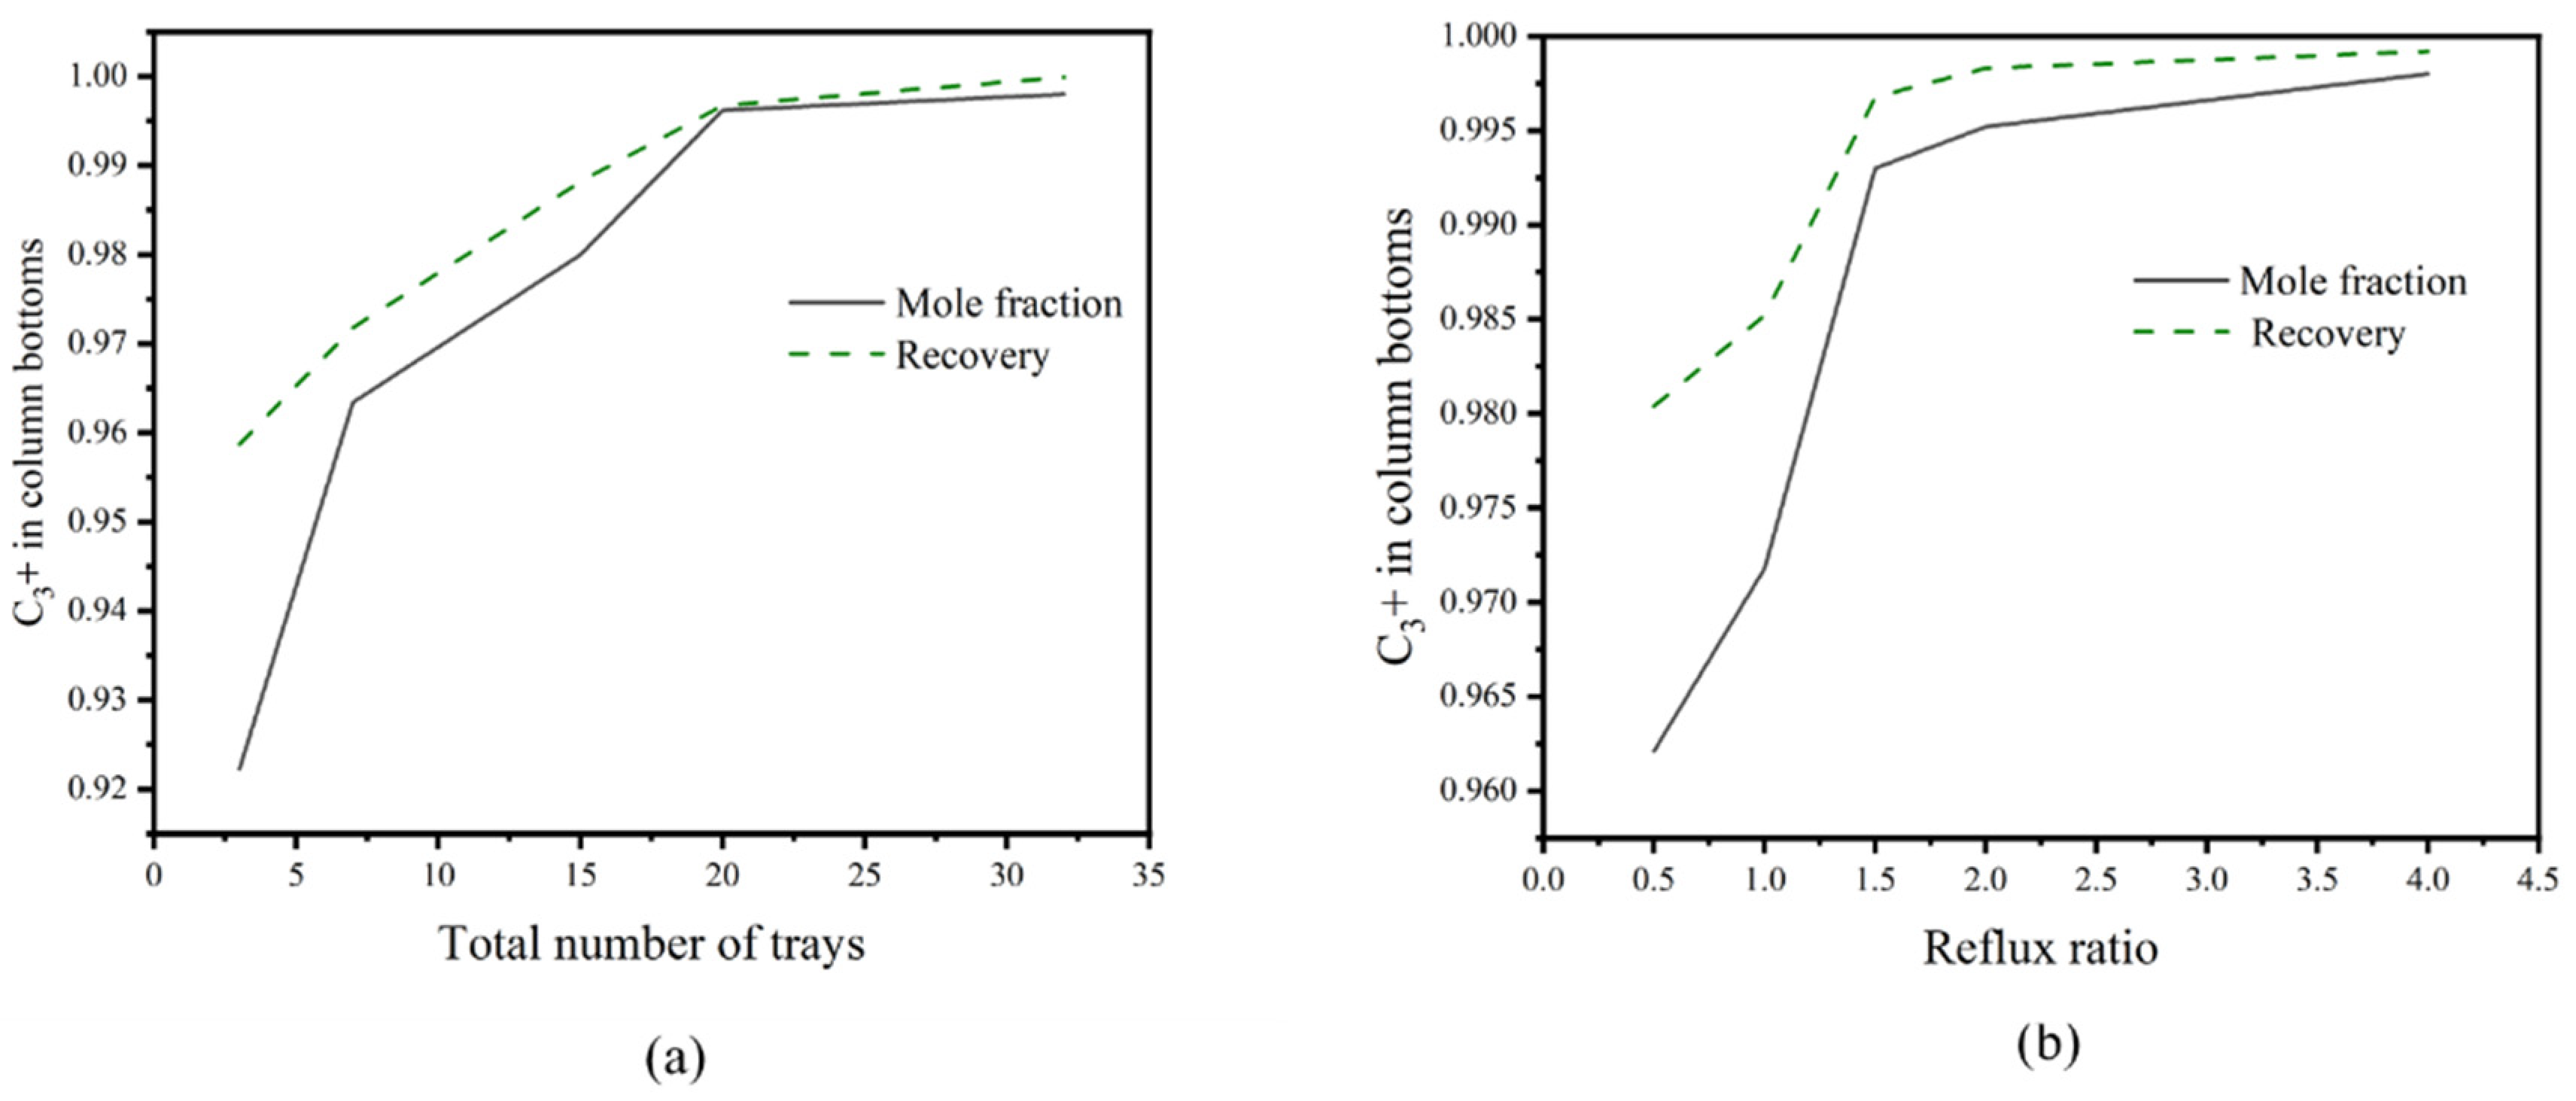
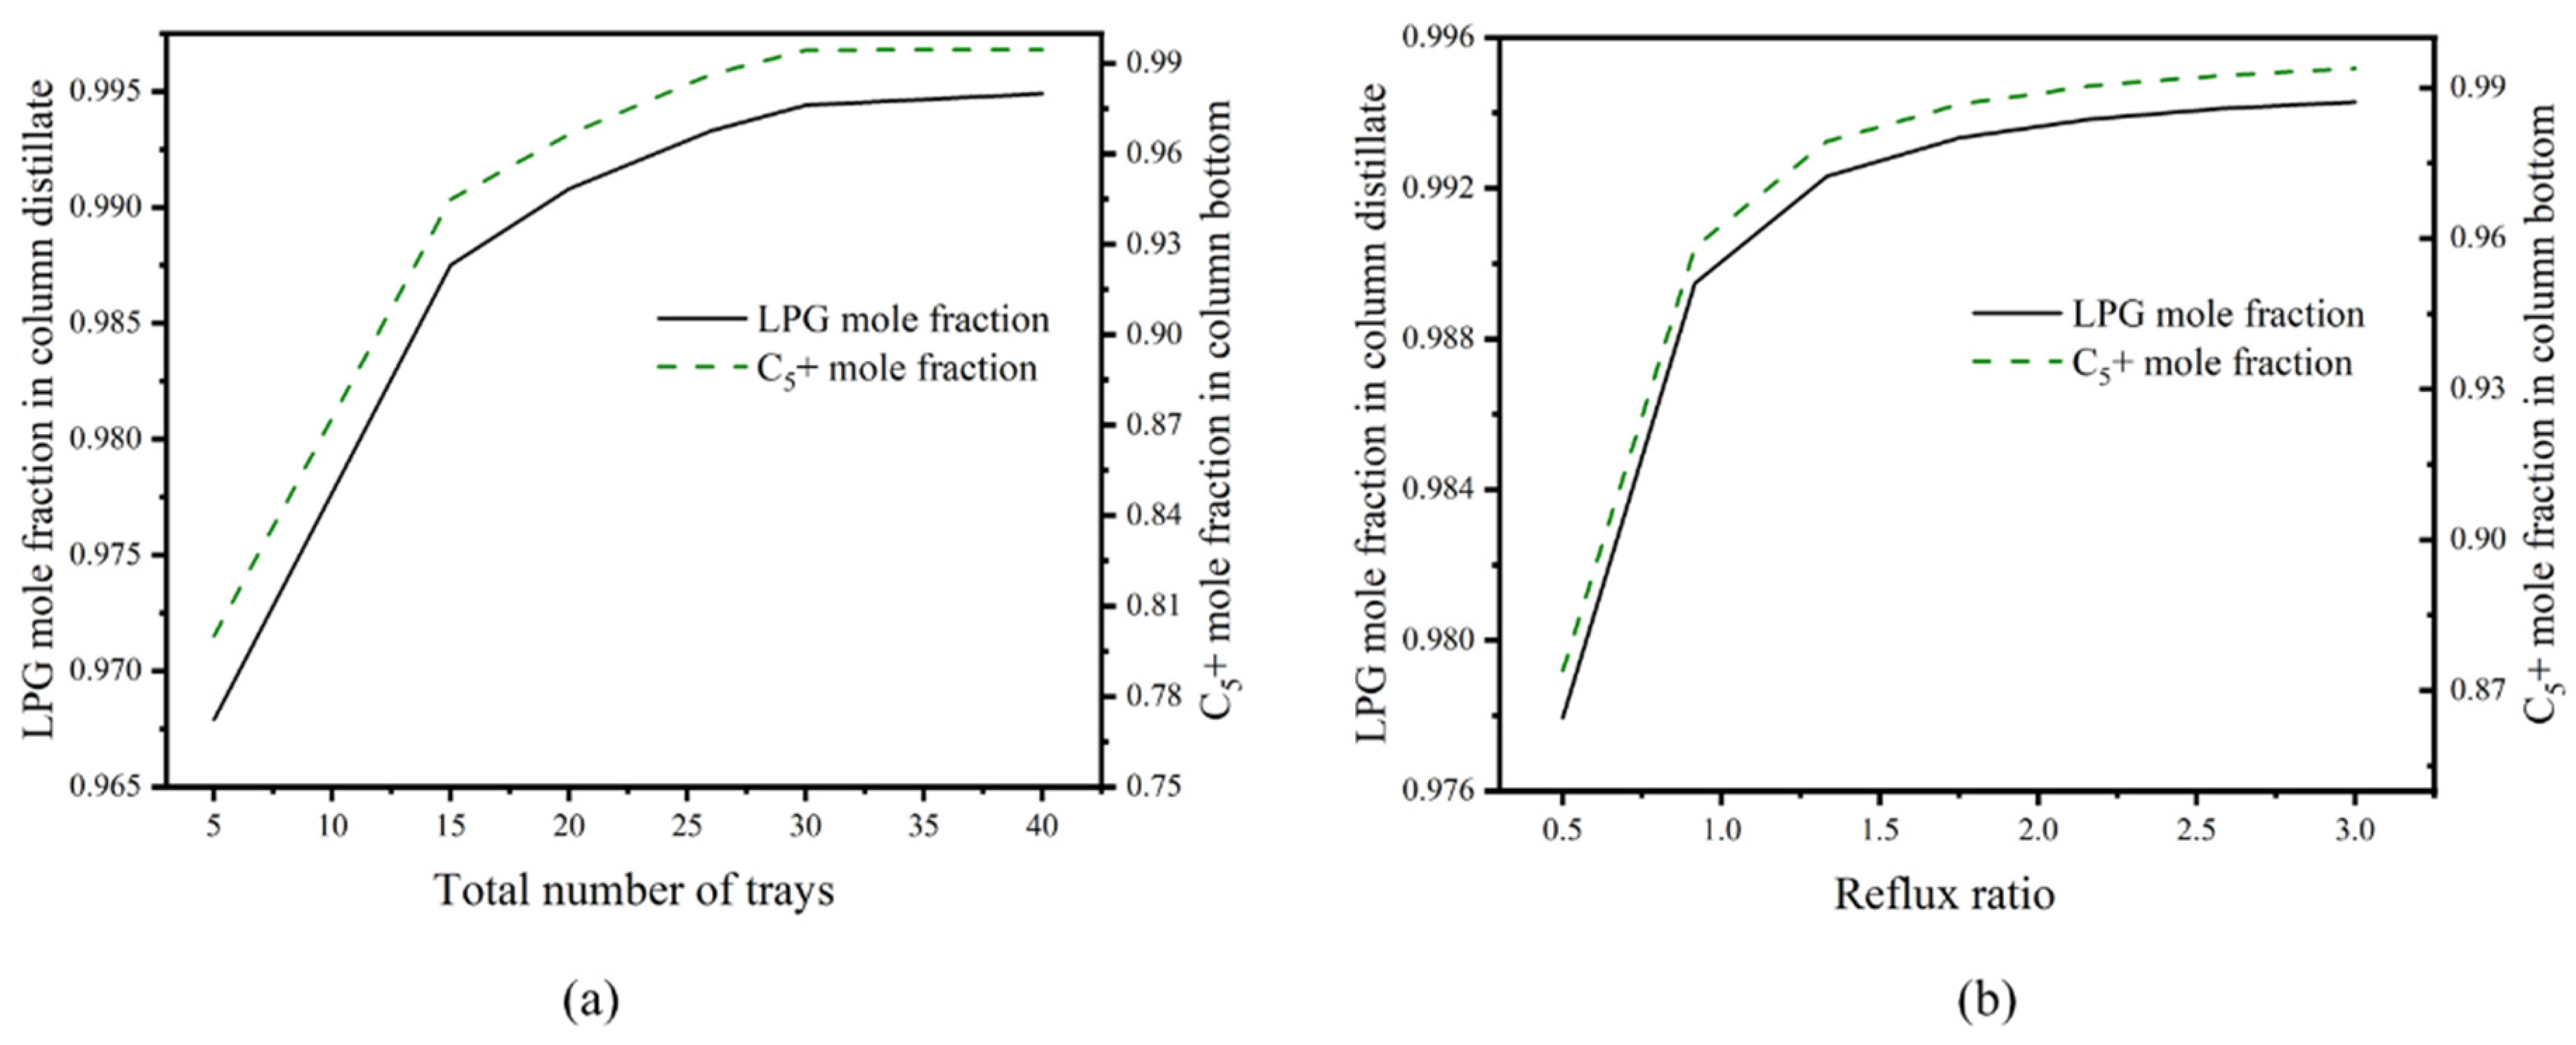
3.5. Design and Optimization of Distillation Columns

Condensable hydrocarbons obtained by shallow condensation still contain valuable components, including methane, ethane, propane, butane, and pentane. In order to further enhance the added value of refinery gas and improve the economic benefits of the refinery, a distillation method was used in the process of condensable hydrocarbon separation.
According to the differences in the content of different hydrocarbon components in condensable hydrocarbons, the sequential three-tower separation process was adopted in the separation sequence design of condensable hydrocarbon. The feed stream (stream 38) is shown in Figure 4. With a temperature of −34.7 °C and a molar flowrate of 257 kgmole/h, it first enters the de-ethane column T-1 to remove the light components (CH4, C2H6) at the top, which then enters the de-methane column T-2 for further separation. As the tower pressure rises, so does the condenser temperature, allowing us to use less-expensive refrigerants (such as cooling water or air). However, if the pressure is too high, the equipment requirements will rise as well (i.e., a thicker tower wall steel plate will be required). Furthermore, increasing the pressure reduces the relative volatility between components, requiring a higher reflux ratio and higher energy consumption to meet product separation requirements, which is unquestionably uneconomical. We must, therefore, weigh their relationship while choosing the appropriate operating pressure. Fuel gas and ethane products are obtained from the top and bottom of T-2, respectively. The T-1 bottom stream enters the de-pentane column T-3 for further refining to obtain LPG (C3H8, C4H10) and pentane products. It must be noted that the design and initial simulation of the columns in this work follow similar procedures in the literature [37,38], and the economic specifications have been described in Appendix A.
We carried out parameter sensitivity analysis to examine the effects of the significant process parameters on the distillation columns for the high product design. All tower tray efficiencies are 0.8. The results of the sensitivity analysis for the T-1 column are presented in Figure 9. For the chosen parameters (reflux ratio, number of trays), before analyzing T-1, a condenser pressure close to the feed pressure is assumed. The sensitivity analysis showed that the C3+ mole fraction in the column bottoms of T-1 increase considerably along with the increase in the total number of trays and reflux ratios. When the number of trays and reflux ratio are greater than 20 and 3, respectively, the purity and recovery of C3+ at the bottom of the tower change very little, and the optimal number of trays and reflux ratios could be chosen as 20 and 3, respectively, where the mole percent of C3+ in column bottoms is 99.62%.
In the case of the T-2 column, as in shown in Figure 10, the trend in C2H6 mole fraction in the column bottom increases as both the total number of trays and reflux ratios increases. However, there is a sharp increase in C2H6 mole fraction when the total number of trays exceeds 20. Therefore, the reflux ratio was 6 while total number of trays was 20, and the mole percent of C2H6 in the gas distillate is 98.28%.
In the T-3 column, however, as in shown in Figure 11, the mole fraction of LPG in column distillates and the mole fraction of C5+ in the column bottoms are monotonously increasing along with the increase of total number of trays and reflux ratios. Moreover, when the total number of trays and reflux ratios exceeds 20 and 1.5, respectively, the mole fractions of LPG and C5+ steadily increase. The total number of trays was then chosen to be 20, while the reflux ratio was 1.5. The detailed column operation parameters can be found in Table 3.

4. Economic Assessment

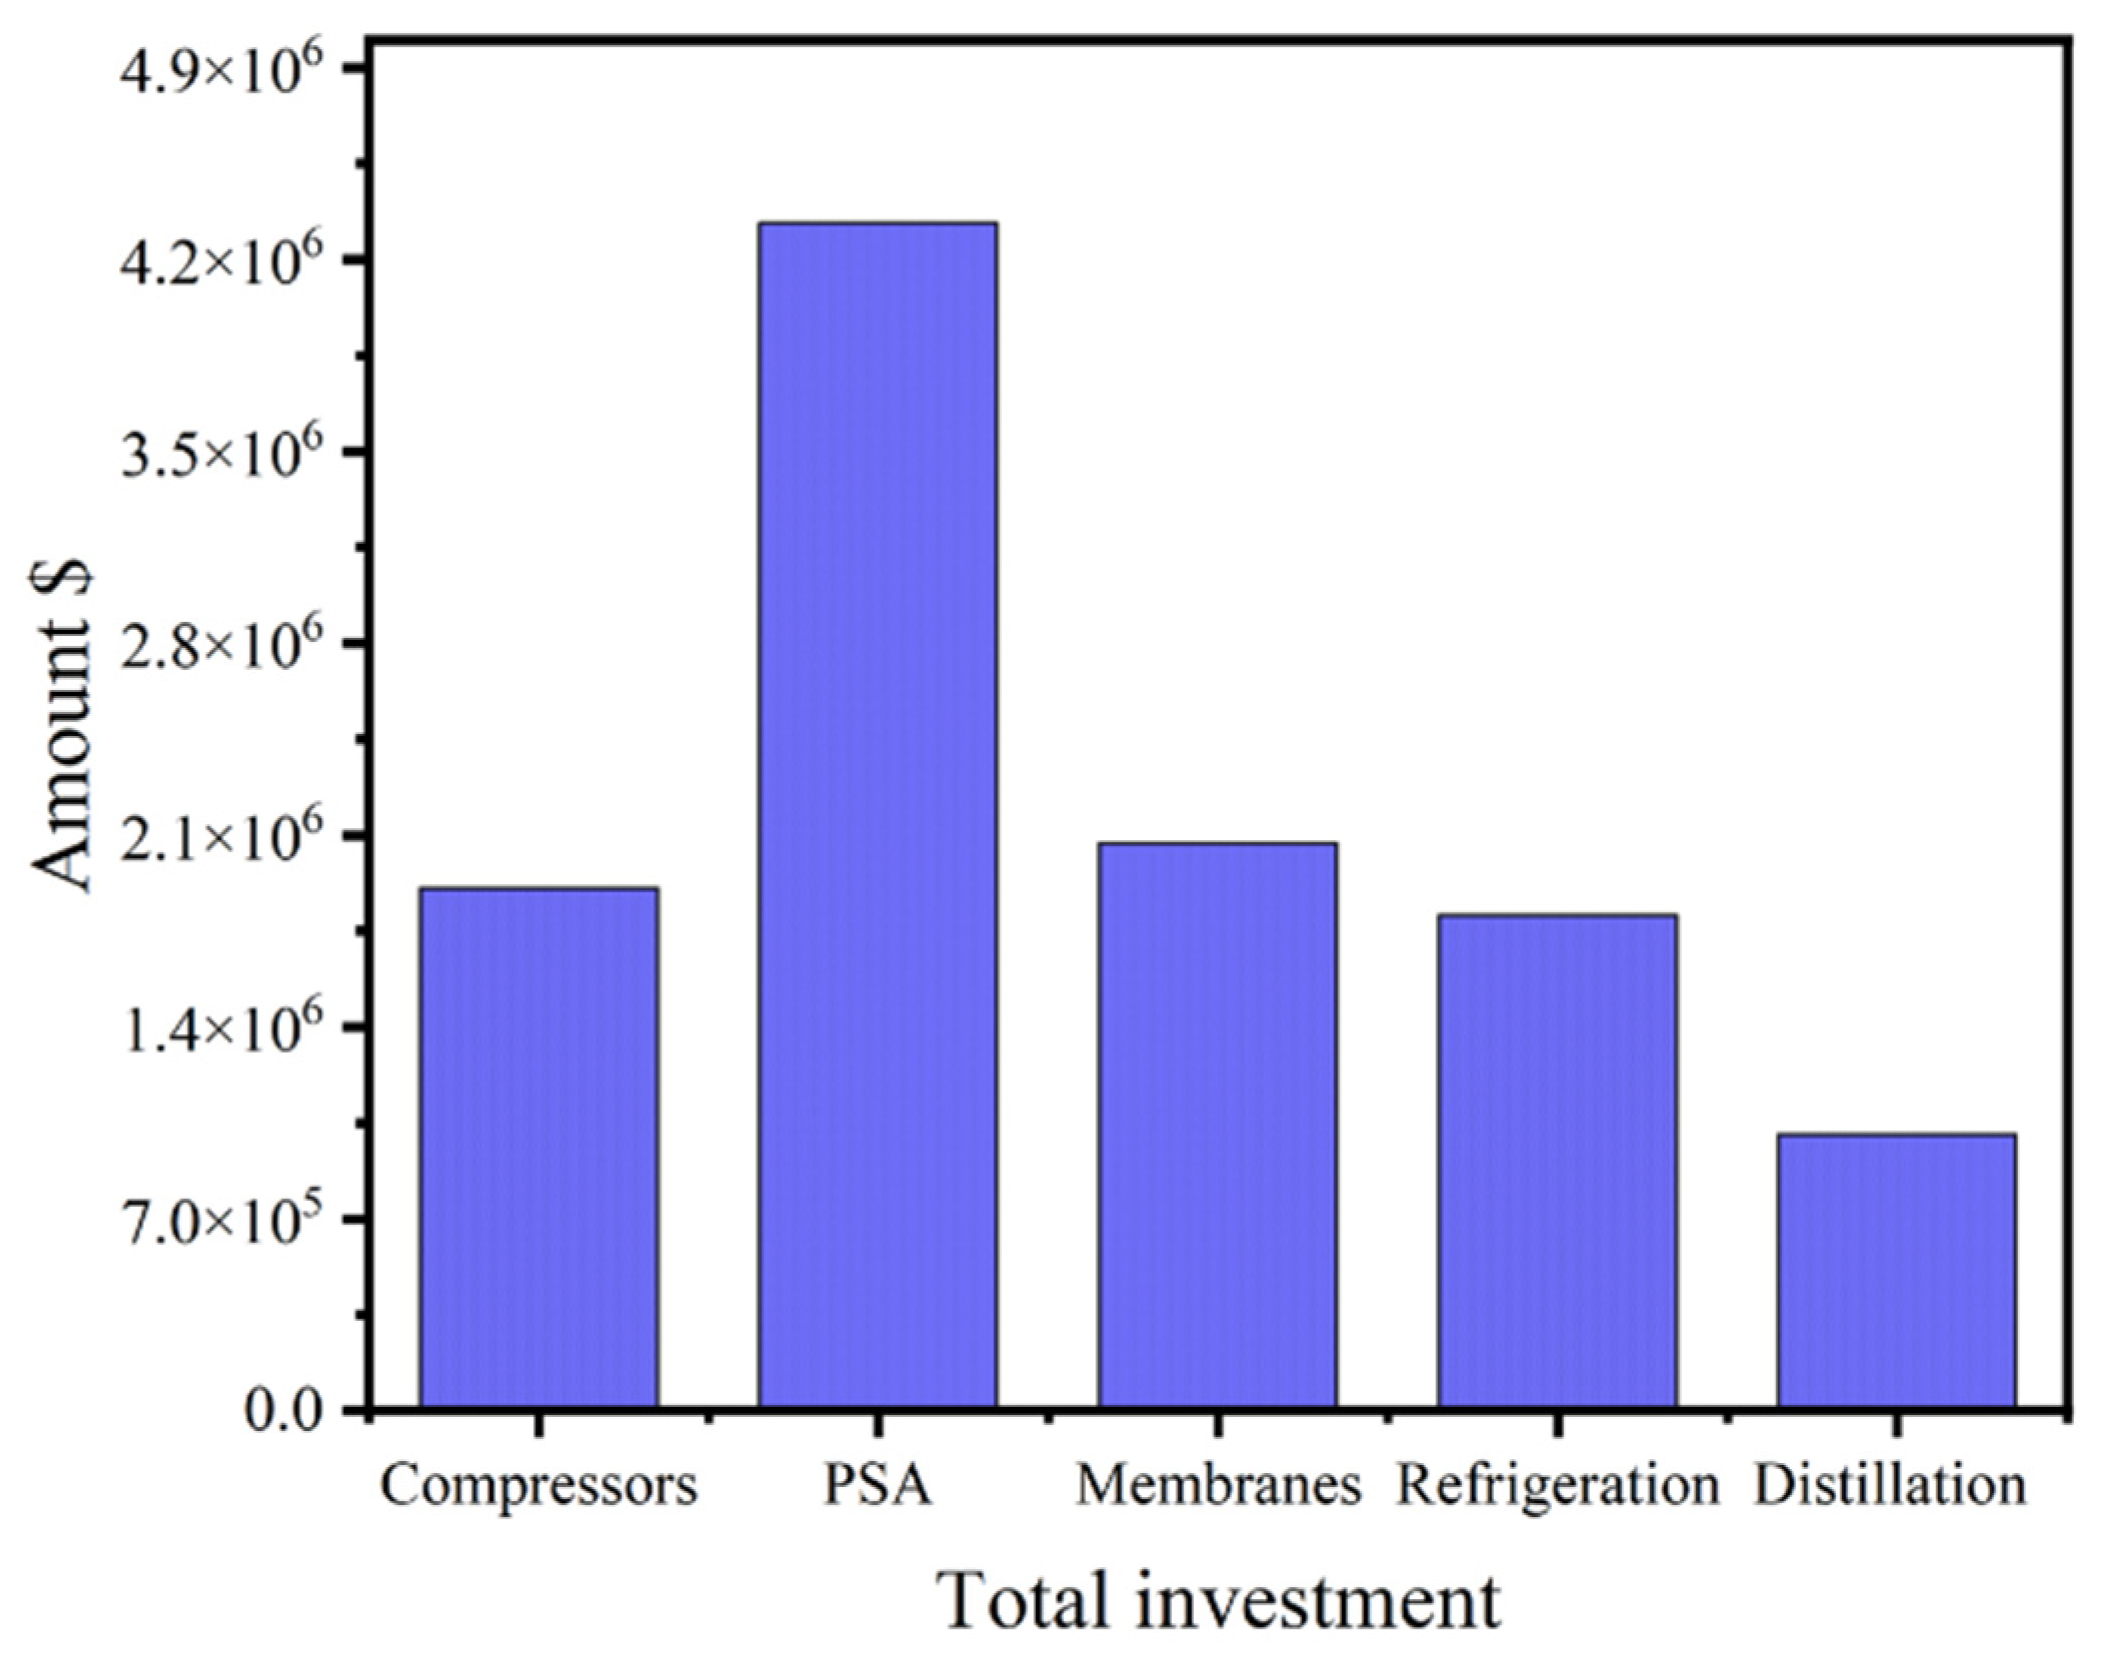
4.1. Impact of Total Investment and OPEX on Process Design

Across different regions, the membrane cost differs considerably. We therefore took a higher value with the aim of including all the conditions. The literature and industrial data, together with utility and equipment economic parameters, are shown in Table 4. The annual operating time is 8000 h.
According to the data shown in Table 5, in the process design, the cost of the PSA equipment accounts for 38.6% of the total investment, and is more than twice the total investment of the membrane module. PSA works better at high pressure, thus it is used to ensure the required hydrogen product quality. The compressor equipment and heat exchanger equipment cost, along with the distillation columns and refrigeration, contributed substantially (42.2%) to the total investment of the hybrid process.
From Table 6, the total steam (12.87 × 10⁶ kJ·h−1) in the graphic synthesis process represents 10.1% (USD 545.18 thousand/year) of the OPEX, and that of the cold water operation cost represents 5.52% while that of the electricity (4.36 × 10³ kW) happens to be 30.6%. The extra compressors used for the residual gas of the PSA device and the permeate stream of the RPM are the cause of the significantly increased electricity operation costs.
Figure 12 represents total investment breakdown of the hybrid process. The PSA and membrane investment cost calculation can be found in Appendix B and Appendix C, respectively.
The gross profit (GP) from the process design is roughly evaluated by the value of hydrogen, LHCs, and FG (fuel gas) produced, minus the major operating expenses (depreciation of membranes and other equipment, and the added cost of steam, refrigeration, cold water, and electricity), together with the feed streams values as described by Equation (2):
GP = total product yield + value of FG − (total annual cost + feed stream value)
The annual yield, calculated by multiplying the annual quantity (5.13 × 10³ t in the case of H2) produced by the unit price (3.02 × 10³ $/t), is approximately 15.47 × 10⁶ $/year. Subsequently, the gross profit, calculated by the yield less the main current expenditures, along with the value of the feed streams, is approximately USD 38.62 × 10⁶ with a payback period of less than 4 months. The payback period expressed as Equation (3):
Payback   period = TI GP
where TI is total investment and GP is the annual gross profit.
It is evident that the hybrid process validated by Ruan et al. [30] is a viable and profitable technique to produce hydrogen and LHCs. The annual product yield of H2 was 16.7% (USD 15.47 × 10⁶), while that of the LHCs was 82.9% (USD70.8 × 106), with LPG representing the highest at 55.5%, as can be illustrated in Table 7.

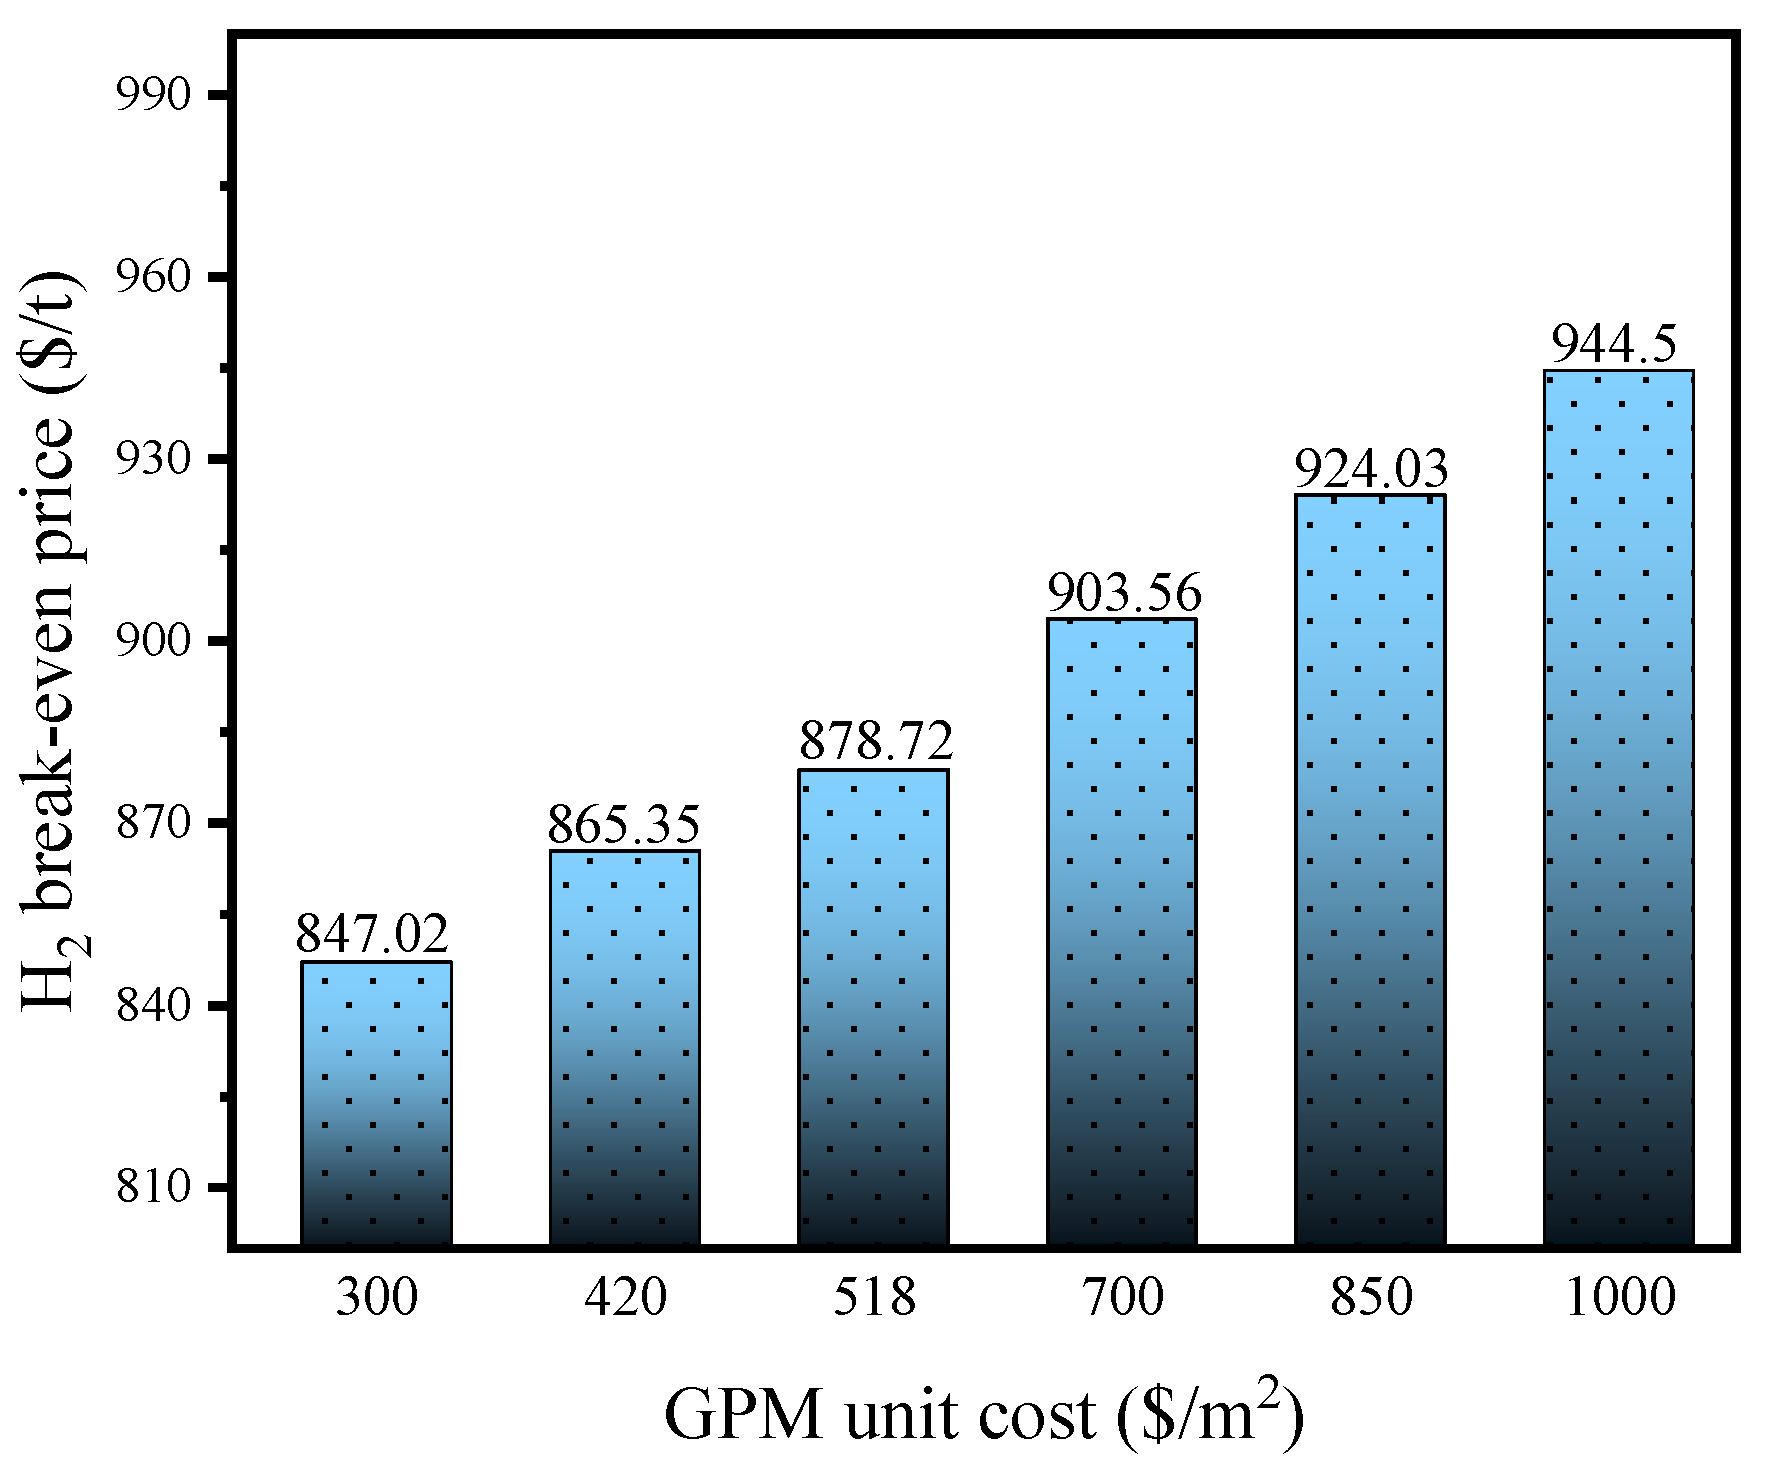
4.2. Break-Even Analysis

We ran a sensitivity analysis for the entire proposed process to see how the significant process factors affected the H2 break-even pricing. Figure 13 shows the final results. Because of the strong dependence of H2 production on membrane area, the GPM cost has the greatest impact on the hydrogen break-even price. The membrane unit cost range [5,8,39,41] (300 to 1000 $/m2) was utilized to reflect the variance in H2 break-even price, and increasing the membrane unit cost to 1000 $/m2 improves the H2 price. As a result, area and cost are important considerations, and upgrading membranes will improve the economics. The hydrogen unit production cost compared with other studies [8,35,41] was relatively lower, demonstrating economic superiority. When compared to the cost of GPM, the cost of compressors and heaters had a weak impact on price. This emphasizes the importance of GPM cost in the overall proposed process’s economics. In the case of H2 production from refinery gas using the graphic synthesis method, the membrane and its efficient operation, rather than other unit operations, determine the hydrogen break-even price.

5. Conclusions

Graphic synthesis design strategy has been presented for H2 and LHC production from refinery gases using membranes, PSA, and shallow condensation. The design strategy uses shortcut methods by merging similar components, then representing operations into a visible triangular coordinate system. In this work, 10 streams containing valuable components, organized according to their concentrations, are merged into 2 mixed streams. The first mixed stream (F1) is sent to a PSA unit for high purity H2 (> 0.99). The second (F2) mixed stream makes use of condensation, and with the aid of a membrane unit, H2 is recovered from the residual gas of the PSA and redirected back to the PSA. Finally, the products of the second stream containing high amounts of LHCs, together with those of a second shallow condensation system, are sent into distillation columns where LHCs are produced. The design sensitivity was probed by changing the operating conditions and the membrane properties. The research findings of the factors influencing the membrane process showed that the optimized areas of the GPM and RPM membranes were determined to be 3500 m2 and 600 m2, respectively. The permeate pressures of the GPM and RPM membranes were set to be 250 and 200 kPa, respectively. Further economic analysis was done according to the optimized membrane properties, and the scheduled products include 0.641 × 10³ kg·h−1 of H2, 2.778 × 10³ kg·h−1 of C2H6, 6.171 × 10³ kg·h−1 of LPG, and 1.427 × 10³ kg·h−1 of C5+, showing product yield of USD 15.47 million, 16.00 million, 48.38 million, and 12.28 million per year for H2, C2H6, LPG, and C5+, respectively. The product yield brought in an annual gross profit of USD 38.62 × 10⁶ with a payback period of less than 4 months, thus indicating the potential of this graphic synthesis method and hybrid process.

Author Contributions

Conceptualization, J.A.S.P. and W.X.; methodology, J.A.S.P. and X.R.; software, A.C.; validation, X.R., H.W., and W.X.; formal analysis, X.J. and A.C.; investigation, J.A.S.P.; resources, W.X. and H.W.; data curation, W.X.; writing—original draft preparation, J.A.S.P.; writing—review and editing, J.A.S.P. and W.X.; visualization, J.A.S.P.; supervision, W.X.; project administration, G.H.; funding acquisition, G.H. All authors have read and agreed to the published version of the manuscript.

Funding

This research was funded by the Science Fund for Creative Research Groups of the National Natural Science Foundation of China (22021005), National Natural Science Foundation of China (21978037), National Key Research and Development Program of China (Grant No. 2019YFE0119200), and Key Research and Development Projects in Shandong Province (2022CXGC010303).

Institutional Review Board Statement

Not applicable.

Informed Consent Statement

Not applicable.

Data Availability Statement

Not applicable.

Acknowledgments

The authors are grateful to the China Scholarship Council for providing support of the international student (2019GXZ019149).

Conflicts of Interest

The authors declare no conflict of interest.

Appendix A

To perform economic calculations, equations for calculating the capital cost of all equipment and the energy cost of the heat added to the reboiler are required. The major pieces of equipment in a distillation column are the column vessel (of length L and diameter D, both with units of meters) and the two heat exchangers (reboiler and condenser with heat-transfer areas AR and AC, respectively, with units of m2). Smaller items such as pumps, valves, and the reflux drum are usually not significant.

Appendix A.1. Condenser Investment Cost

The condenser vessel cost and its area can be calculated by Equations (A1) and (A2), respectively.
Condenser vessel cost = 7296 (area)0.65
A C = Q U Δ T
where AC is the heat transfer area of the condenser, Q is the thermal duty, U is the heat transfer coefficient, and ∆T is the condenser typical differential temperature.

Appendix A.2. Reboiler Investment Cost

The reboiler vessel cost and its area can be calculated by Equations (A3) and (A4), respectively.
Reboiler vessel cost = 7296 (area)0.65
A R = Q U Δ T
where AR is the heat transfer area of the reboiler, Q is the thermal duty, U is the heat transfer coefficient, and ∆T is the reboiler typical differential temperature. The condenser and reboiler heat duties are determined in simulation, but we need to have an overall heat-transfer coefficient and a differential temperature driving force in each heat exchanger to be able to calculate the required area. The formulas given above are typical of condensing and boiling hydrocarbon systems [42].

Appendix A.3. Column Vessel Investment Cost

The column vessel investment cost can be calculated using Equation (A5), where D and L represent the diameter and length in meters, respectively [42].
Column vessel cost = 17,640(D)1.066(L)0.802
where D is 1.5 m and is determined by the maximum vapor velocity. If this velocity is exceeded, the column liquid and vapor hydraulics will fail and the column will flood. The length L can be obtained from Equation (A6) below.
Length = Actual number of stages × tray spacing
Total number of trays for all columns is 20, while tray spacing is 0.55 m.

Appendix B

The PSA investment cost can be calculated by the following formula (Equation (A7)):
I 2 = I 1 × Q 2 Q 1 n
where n = 0.75 and I1, and Q1 represent the inherent investment and processing capacity of the PSA device, respectively. I2 and Q2 stand for inherent investment and processing capacity of PSA device after transformation. The original data came from the literature [8].

Appendix C

Membrane cost can be calculated by the following formula (Equation (A8)):
  MC = A total × P mem
where MC is the membrane cost and Atotal is the total membrane area. Pmem is the unit price of the membrane.

Appendix D

Appendix D.1. Membrane Separation

Membrane separation technology is one useful method to separate a gas from a gas mixture based on the difference of the permeation rates of gas molecules through the membrane [43,44]. A part of the feed gas is separated by a selective material (polyimide and poly-dimethyl siloxane, in the case of hydrogen and LHCs, respectively) as a permeate. Few of the many investigated polymeric materials developed for gas separation are used in commercial systems [14]. However, gas separation using polymer membranes (e.g., polyimide) is a well-established technology. The residue is called the retentate, and thus purification is possible from various gas mixtures, with its advantage being a high product recovery. A classic membrane separation process, for example, the hydrogen membrane separation process, is when the feed is introduced into the membrane separation module and most of the impurity gases, such as C2H6 and higher, are retained by the membrane. Hydrogen will concentrate on the permeate side of the membrane.
The permeances of the two different membrane separation units are shown in Table A1 [30]. Simulations of H2/LHC production by counter-current flow configurations were conducted based on UniSim Design integrated with Memcal, which is a UniSim Design extension that allows process designers to simulate, optimize, and evaluate the cost of complex, multistage membrane processes [36].
Table A1. Membrane permeance (GPU) a.
ComponentGPMRPM
H2277.857.3
CH42.6773.1
C2H60.67402
C3H81.19621
i-C4H1011500
n-C4H1011500
n-C5H1211500
a GPU, gas permeation unit (10−6 cm3cm−2s−1cmHg). GPM is made from polyimide Matrimid-5218. RPM consists of poly-dimethylsiloxane.

Appendix D.2. Pressure Swing Adsorption (PSA)

PSA is the second most used technology for high H2 purification [45,46]. Furthermore, it is used to guarantee the necessary product quality (an H2 purity of > 99.9%). Skarstrom’s [47] original PSA design involves four steps, which are adsorption, blow-down, purge, and pressurization. Numerous columns are needed for the multiple steps to warrant a continuous separation process. When the feed gas enters the adsorption beds during a PSA process, impurity gases such as CH4, C2H6, O2, and N2 are adsorbed by the adsorbents. The majority of the H2 not adsorbed by the adsorbents flows out of the system as the product. The impurity compositions and small amount of H2 are desorbed from the adsorbents as the residual gas or desorption gas. Activated carbon, a 5A molecular sieve, and silica gel are used as the adsorbents in the course of a PSA process. The PSA separation performance of the designed process can be seen in Table A2.
Table A2. PSA separation performance.
Feed GasProductTail Gas
Flow (kmol.h−1)494.4317.5176.9
Pressure (kPa)25002000650
Temperature (°C)39.783938.65
Mole fraction %
H280.299.9144.83
CH47.740.0921.48
C2H67.13019.93
C3H82.3306.5
C4H101.0903.07
C5+1.3803.85

Appendix D.3. Distillation

This method separates gas components based on differences in boiling points [48]. The gas must be cooled down to condense, which consumes enormous amounts of energy [49] and takes several hours of start-up time. In addition to this, it requires feed pre-treatment for those components that might freeze. The process has excellent economies of scale.

Appendix D.4. Shallow Condensation

The oil-absorption process, adsorption method, and condensation separation method are the three most extensively utilized technologies in gas separation technology. The condensation separation method offers the advantages of high recovery efficiency, low investment, and low operation cost when compared to other light hydrocarbon recovery methods. After the 1970s, it gradually superseded the oil-absorption process and adsorption method. Condensation separation methods can be separated into refrigerant refrigeration, expansion refrigeration, and combination refrigeration methods based on the different ways to produce cold energy. Refrigerant refrigeration belongs to shallow cooling method. It is necessary to install an external independent refrigeration system, and there is no requirement for the quality and pressure of the raw gas [50].

References

  1. Liu, H.; Mu, L.; Wang, B.; Liu, B.; Wang, J.; Zhang, X.; Sun, C.; Chen, J.; Jia, M.; Chen, G. Separation of ethylene from refinery dry gas via forming hydrate in w/o dispersion system. Sep. Purif. Technol. 2013, 116, 342–350. [Google Scholar] [CrossRef]
  2. Sardashti Birjandi, M.R.; Shahraki, F. Off-Gases Optimization in a Hydrogen Network Refinery. Chem. Eng. Technol. 2011, 34, 1974–1982. [Google Scholar] [CrossRef]
  3. Sardashti Birjandi, M.R.; Shahraki, F.; Birjandi, M.S.; Nobandegani, M.S. Application of global optimization strategies to refinery hydrogen network. Int. J. Hydrogen Energy 2014, 39, 14503–14511. [Google Scholar] [CrossRef]
  4. Deng, C.; Pan, H.; Li, Y.; Zhou, Y.; Feng, X. Comparative analysis of different scenarios for the synthesis of refinery hydrogen network. Appl. Therm. Eng. 2014, 70, 1162–1179. [Google Scholar] [CrossRef]
  5. Ruan, X.; Wang, L.; Dai, Y.; Zhang, N.; Yan, X.; He, G. Effective reclamation of vent gas in ethylbenzene dehydrogenation by coupling multi-stage circle absorption and membrane units. Sep. Purif. Technol. 2016, 168, 265–274. [Google Scholar] [CrossRef]
  6. Li, Y.; Luo, H. Integration of light hydrocarbons cryogenic separation process in refinery based on LNG cold energy utilization. Chem. Eng. Res. Des. 2015, 93, 632–639. [Google Scholar] [CrossRef]
  7. Zhang, D. Recovery of trace hydrogen by cryogenic adsorption. Sep. Purif. Technol. 2004, 35, 105–112. [Google Scholar] [CrossRef]
  8. Huang, W.; Jiang, X.; He, G.; Ruan, X.; Chen, B.; Nizamani, A.K.; Li, X.; Wu, X.; Xiao, W. A Novel Process of H2/CO2 Membrane Separation of Shifted Syngas Coupled with Gasoil Hydrogenation. Processes 2020, 8, 590. [Google Scholar] [CrossRef]
  9. Nikolaidis, P.; Poullikkas, A. A comparative overview of hydrogen production processes. Renew. Sustain. Energy Rev. 2017, 67, 597–611. [Google Scholar] [CrossRef]
  10. Dincer, I.; Acar, C. Review and evaluation of hydrogen production methods for better sustainability. Int. J. Hydrogen Energy 2015, 40, 11094–11111. [Google Scholar] [CrossRef]
  11. Liguori, S.; Kian, K.; Buggy, N.; Anzelmo, B.H.; Wilcox, J. Opportunities and challenges of low-carbon hydrogen via metallic membranes. Prog. Energy Combust. Sci. 2020, 80, 100851. [Google Scholar] [CrossRef]
  12. Iulianelli, A.; Drioli, E. Membrane engineering: Latest advancements in gas separation and pre-treatment processes, petrochemical industry and refinery, and future perspectives in emerging applications. Fuel Processing Technol. 2020, 206, 106464. [Google Scholar] [CrossRef]
  13. Li, B.; He, G.; Jiang, X.; Dai, Y.; Ruan, X. Pressure swing adsorption/membrane hybrid processes for hydrogen purification with a high recovery. Front. Chem. Sci. Eng. 2016, 10, 255–264. [Google Scholar] [CrossRef]
  14. Liemberger, W.; Groß, M.; Miltner, M.; Harasek, M. Experimental analysis of membrane and pressure swing adsorption (PSA) for the hydrogen separation from natural gas. J. Clean. Prod. 2017, 167, 896–907. [Google Scholar] [CrossRef]
  15. Sircar, S.; Waldron, W.E.; Rao, M.B.; Anand, M. Hydrogen production by hybrid SMR–PSA–SSF membrane system. Sep. Purif. Technol. 1999, 17, 11–20. [Google Scholar] [CrossRef]
  16. Ohs, B.; Falkenberg, M.; Wessling, M. Optimizing hybrid membrane-pressure swing adsorption processes for biogenic hydrogen recovery. Chem. Eng. J. 2019, 364, 452–461. [Google Scholar] [CrossRef]
  17. Esteves, I.A.; Mota, J.P. Gas separation by a novel hybrid membrane/pressure swing adsorption process. Ind. Eng. Chem. Res. 2007, 46, 5723–5733. [Google Scholar] [CrossRef]
  18. Mango, F.D. The light hydrocarbons in petroleum: A critical review. Org. Geochem. 1997, 26, 417–440. [Google Scholar] [CrossRef]
  19. Cui, W.G.; Hu, T.L.; Bu, X.H. Metal-Organic Framework Materials for the Separation and Purification of Light Hydrocarbons. Adv Mater 2020, 32, e1806445. [Google Scholar] [CrossRef]
  20. Yang, Y.; Bai, P.; Guo, X. Separation of Xylene Isomers: A Review of Recent Advances in Materials. Ind. Eng. Chem. Res. 2017, 56, 14725–14753. [Google Scholar] [CrossRef]
  21. Wang, H.; Wang, B.; Li, J.; Zhu, T. Adsorption equilibrium and thermodynamics of acetaldehyde/acetone on activated carbon. Sep. Purif. Technol. 2019, 209, 535–541. [Google Scholar] [CrossRef]
  22. Ma, B.; Deng, C.; Chen, H.; Zhu, M.; Yang, M.; Feng, X. Hybrid Separation Process of Refinery Off-gas toward Near-Zero Hydrogen Emission: Conceptual Design and Techno-economic Analysis. Ind. Eng. Chem. Res. 2020, 59, 8715–8727. [Google Scholar] [CrossRef]
  23. Towler, G.P.; Mann, R.; Serriere, A.J.; Gabaude, C.M. Refinery hydrogen management: Cost analysis of chemically-integrated facilities. Ind. Eng. Chem. Res. 1996, 35, 2378–2388. [Google Scholar] [CrossRef]
  24. Alves, J.J.; Towler, G.P. Analysis of refinery hydrogen distribution systems. Ind. Eng. Chem. Res. 2002, 41, 5759–5769. [Google Scholar] [CrossRef]
  25. Nishida, N.; Stephanopoulos, G.; Westerberg, A.W. A review of process synthesis. AIChE J. 1981, 27, 321–351. [Google Scholar] [CrossRef]
  26. Hendry, J.E.; Rudd, D.F.; Seader, J.D. Synthesis in the design of chemical processes. AIChE J. 1973, 19, 1–15. [Google Scholar] [CrossRef]
  27. Bausa, J.; Marquardt, W. Shortcut design methods for hybrid membrane/distillation processes for the separation of nonideal multicomponent mixtures. Ind. Eng. Chem. Res. 2000, 39, 1658–1672. [Google Scholar] [CrossRef]
  28. Kao, Y.K. Separation vector formulation for the synthesis of multicomponent separation sequences. AIChE J. 1995, 41, 78–96. [Google Scholar] [CrossRef]
  29. Shenvi, A.A.; Shah, V.H.; Zeller, J.A.; Agrawal, R. A synthesis method for multicomponent distillation sequences with fewer columns. AIChE J. 2012, 58, 2479–2494. [Google Scholar] [CrossRef]
  30. Ruan, X.; Xiao, H.; Jiang, X.; Yan, X.; Dai, Y.; He, G. Graphic synthesis method for multi-technique integration separation sequences of multi-input refinery gases. Sep. Purif. Technol. 2019, 214, 187–195. [Google Scholar] [CrossRef]
  31. Mores, P.; Arias, A.; Scenna, N.; Caballero, J.; Mussati, S.; Mussati, M. Membrane-Based Processes: Optimization of Hydrogen Separation by Minimization of Power, Membrane Area, and Cost. Processes 2018, 6, 221. [Google Scholar] [CrossRef] [Green Version]
  32. Zarca, G.; Urtiaga, A.; Biegler, L.T.; Ortiz, I. An optimization model for assessment of membrane-based post-combustion gas upcycling into hydrogen or syngas. J. Membr. Sci. 2018, 563, 83–92. [Google Scholar] [CrossRef]
  33. Ahmad, F.; Lau, K.K.; Shariff, A.M.; Murshid, G. Process simulation and optimal design of membrane separation system for CO2 capture from natural gas. Comput. Chem. Eng. 2012, 36, 119–128. [Google Scholar] [CrossRef] [Green Version]
  34. Murad Chowdhury, M.H.; Feng, X.; Douglas, P.; Croiset, E. A New Numerical Approach for a Detailed Multicomponent Gas Separation Membrane Model and AspenPlus Simulation. Chem. Eng. Technol. 2005, 28, 773–782. [Google Scholar] [CrossRef]
  35. Arias, A.; Mores, P.; Scenna, N.; Caballero, J.; Mussati, S.; Mussati, M. Optimal Design of a Two-Stage Membrane System for Hydrogen Separation in Refining Processes. Processes 2018, 6, 284. [Google Scholar] [CrossRef] [Green Version]
  36. Hoorfar, M.; Alcheikhhamdon, Y.; Chen, B. A novel tool for the modeling, simulation and costing of membrane based gas separation processes using Aspen HYSYS: Optimization of the CO2/CH4 separation process. Comput. Chem. Eng. 2018, 117, 11–24. [Google Scholar] [CrossRef]
  37. De Guido, G.; Fogli, M.R.; Pellegrini, L.A. Effect of Heavy Hydrocarbons on CO2 Removal from Natural Gas by Low-Temperature Distillation. Ind. Eng. Chem. Res. 2018, 57, 7245–7256. [Google Scholar] [CrossRef]
  38. Langé, S.; Pellegrini, L.A. Energy Analysis of the New Dual-Pressure Low-Temperature Distillation Process for Natural Gas Purification Integrated with Natural Gas Liquids Recovery. Ind. Eng. Chem. Res. 2016, 55, 7742–7767. [Google Scholar] [CrossRef]
  39. Lin, H.; He, Z.; Sun, Z.; Kniep, J.; Ng, A.; Baker, R.W.; Merkel, T.C. CO2-selective membranes for hydrogen production and CO2 capture—Part II: Techno-economic analysis. J. Membr. Sci. 2015, 493, 794–806. [Google Scholar] [CrossRef] [Green Version]
  40. Chen, B.; Jiang, X.; Xiao, W.; Dong, Y.; El Hamouti, I.; He, G. Dual-membrane natural gas pretreatment process as CO2 source for enhanced gas recovery with synergy hydrocarbon recovery. J. Nat. Gas Sci. Eng. 2016, 34, 563–574. [Google Scholar] [CrossRef]
  41. Chen, B.; Yang, T.; Xiao, W.; Nizamani, A.k. Conceptual Design of Pyrolytic Oil Upgrading Process Enhanced by Membrane-Integrated Hydrogen Production System. Processes 2019, 7, 284. [Google Scholar] [CrossRef] [Green Version]
  42. William, L. Luyben, Distillation Design and Control Using Aspen Simulation; John Wiley & Sons: Hoboken, NJ, USA, 2013. [Google Scholar]
  43. Gallucci, F.; Fernandez, E.; Corengia, P.; van Sint Annaland, M. Recent advances on membranes and membrane reactors for hydrogen production. Chem. Eng. Sci. 2013, 92, 40–66. [Google Scholar] [CrossRef]
  44. Bernardo, P.; Drioli, E.; Golemme, G. Membrane gas separation: A review/state of the art. Ind. Eng. Chem. Res. 2009, 48, 4638–4663. [Google Scholar] [CrossRef]
  45. Marcoberardino, G.; Vitali, D.; Spinelli, F.; Binotti, M.; Manzolini, G. Green Hydrogen Production from Raw Biogas: A Techno-Economic Investigation of Conventional Processes Using Pressure Swing Adsorption Unit. Processes 2018, 6, 19. [Google Scholar] [CrossRef] [Green Version]
  46. Voldsund, M.; Jordal, K.; Anantharaman, R. Hydrogen production with CO2 capture. Int. J. Hydrogen Energy 2016, 41, 4969–4992. [Google Scholar] [CrossRef]
  47. Skarstrom, C.W. Method and Apparatus for Fractionating Gaseous Mixtures by Adsorption. U.S. Patent No. 2,944,627, 12 July 1960. [Google Scholar]
  48. Adhikari, S.; Fernando, S. Hydrogen membrane separation techniques. Ind. Eng. Chem. Res. 2006, 45, 875–881. [Google Scholar] [CrossRef]
  49. Hinchliffe, A.B.; Porter, K.E. A Comparison of Membrane Separation and Distillation. Chem. Eng. Res. Des. 2000, 78, 255–268. [Google Scholar] [CrossRef]
  50. Lu, H.; Ma, G.; Cao, L.; Azimi, M. Optimization of light hydrocarbon recovery system in condensate gas field. Energy Rep. 2019, 5, 1209–1221. [Google Scholar] [CrossRef]
Figure 1. Representation and merging of multiple feed gas streams based on a triangular coordinate system.
Processes 10 00820 g001
Figure 2. Procedures of separation sequence determination of the illustrative multi-input separation process.
Processes 10 00820 g002
Figure 3. Schematic flowchart of the illustrative multi-input separation process.
Processes 10 00820 g003
Figure 4. Process flow diagram of the illustrative multi-input separation process. K: compressor, A: adsorption tower, GPM: glassy polymer membrane, RPM: rubbery polymer membrane, PSA: pressure swing adsorption, E: exchanger, V: tank, P: pump, FG: fuel gas, MIX: mixer, T: distillation tower.
Processes 10 00820 g004
Figure 5. Effects of RPM area on C2+ purity and recovery under constant permeate pressure.
Processes 10 00820 g005
Figure 6. Effects of GPM area on H2 purity and recovery under constant permeate pressure.
Processes 10 00820 g006
Figure 7. Impacts of stage cuts on (a) H2 purity and recovery of GPM and (b) C2+ purity and recovery of RPM.
Processes 10 00820 g007
Figure 8. Effects of permeate pressure on (a) H2 purity and recovery of GPM and (b) C2+ purity and recovery of RPM under a constant membrane area of 3500 m2 and 600 m2 for GPM and RPM, respectively.
Processes 10 00820 g008
Figure 9. Effect of (a) total number of trays in T-1 and (b) reflux ratio on C3+ mole fraction in the column bottom.
Processes 10 00820 g009
Figure 10. Effect of (a) total number of trays in T-2 and (b) reflux ratio on C2H6 mole fraction in the column bottom.
Processes 10 00820 g010
Figure 11. Effect of (a) total number of trays in T-3 and (b) reflux ratio on LPG and C5+ mole fraction in the gas distillates and column bottoms of the T-3 tower.
Processes 10 00820 g011
Figure 12. Breakdown of total investment on the hybrid process design.
Processes 10 00820 g012
Figure 13. Sensitivity analysis to determine the H2 break-even price of the designed process. The range of GPM unit cost is from 300 $/m2 to 1000 $/m2.
Processes 10 00820 g013
Table 1. Data of the main tail gases in a petrochemical company in China.
Streams12345678910
Temperature (°C) 40404040404040404040
Pressure (MPag) 2.502.402.500.750.670.861.201.150.580.7
Flowrate (Nm3·h−1) 6002788241513262053122910346009001200
Mole fraction %
H298.4363.3479.9531.2334.4213.4535.0175.783.4969.45
N20.000.000.002.040.000.000.000.000.000.41
O20.000.000.000.230.000.000.000.000.000.50
CH40.8814.258.9212.1710.192.605.644.271.193.35
C2H60.2311.154.9820.2115.9739.9024.042.445.3123.94
C3H80.084.732.5114.4514.6138.7920.230.6930.922.38
i-C4H100.021.090.553.914.032.396.860.1916.660.12
n-C4H100.021.110.993.717.782.314.451.3140.360.20
C5+ 0.071.021.113.298.160.533.5614.480.000.12
H2S 0.103.311.008.784.780.000.040.851.951 μL/l
Table 2. Overall mass balance of the illustrative multi-input recovery process.
Stream1318H2C2H6LPGC5+FG
Pressure/kPa250068020002150140014502100
Temperature/°C403139−7.656.68142.3−3
Rate/kmol·h−1333.5281.7317.494.77126.417.2359.17
Mole fraction %
H274.4826.6399.9100010.27
N20.060.4300002.42
O20.080.0500000.68
CH49.157.480.090.890084.58
C2H69.7721.93098.28002.04
C3H83.0223.0900.8358.940.030.01
i-C4H100.636.100015.260.440
n-C4H100.8710.260024.852.820
n-C5H121.934.04000.9496.690
H2S0.000.0000000
Table 3. Process parameters for the distillation columns.
Streams3940FG-2C2H6LPGC5+
Key componentC2H6C3+CH4C2H6LPGC5+
Mole fraction of key component0.82730.99620.9230.98280.9910.967
Pressure (kPa)230023502100215014001450
Temperature (°C)−9.190.67−84.57−7.656.68142.3
Table 4. Cost parameters for the economic assessment.
ItemUnitPriceReference
Membrane $/m2420/1000 1[5]
Compressor $/kW0.951620[5]
Refrigeration $/kW1000[39]
PSA $4.33 × 10⁶Equation (A7)
Heat exchangers $/m21500 × A0.6[5]
Pump $/(m3h−1)1.67 × 103[5]
Electricity $/kWh0.13[5]
Steam $/t14.50[40]
Refrigeration cost $/GJ56.17[22]
Cold water $/t0.10[5]
Depreciation time Year5 for membrane, 5 for PSA 2, 15 for others
1 USD 420 is the GPM’s unit price, whereas USD 1000 is the RPM’s price. 2 The depreciation life of PSA in this study is set at 5 years in a manner corresponding to the replacement period of the adsorbent material. Pumps and compressors are designed with one for working unit and one for backup.
Table 5. The capital cost and depreciation cost of the hybrid process.
ItemCapital Cost ($106)Depreciation Cost ($106/Year)
Compressors1.910.13
Refrigeration1.800.12
PSA4.330.86
Membranes2.070.41
Distillation1.0080.07
Adsorption0.400.03
Heat exchangers0.0021.4 × 10−4
Pumps0.0291.97 × 10−3
Other equipment cost 11.730.12
1 Other equipment cost include mixers, pipes and valves, control systems, and flash tanks.
Table 6. The operation cost of the hybrid process.
ItemCost ($106/Year)
Electricity1.66
Steam0.55
Refrigeration2.92
Cold water0.30
Table 7. Feed and product yield.
ComponentFlowrate (103t/Year)Unit Price ($103/t) aAmount ($106/Year)
H25.12963.01515.47
C2H622.2240.7216.00
LPG49.3680.9848.38
C5+11.4161.0812.28
FG7.2480.50 3.62
Feed gases (F1 + F2)99.9440.5049.97
a Unit price is from industrial data.
Publisher’s Note: MDPI stays neutral with regard to jurisdictional claims in published maps and institutional affiliations.

