3.1. Abundance of Heavy Metals in Sediments
The concentrations of As, Cu, Pb, Cd, Zn, and Cr in sediments from Pearl Bay and the offshore area were shown in
Table 3. The ranges of the contents of the six metals are 3.58–28.64, 0.32–67.86, 9.61–68.66, 0.02–2.65, 6.39–110.46 and 4.53–94.51 mg/kg for As, Cu, Pb, Cd, Zn and Cr, respectively, generally showing an order of Zn > Cr > Pb > Cu > As > Cd (by comparing the average values: 48.53, 35.78, 31.28, 24.16, 10.88, 0.55 mg/kg, respectively). This observation was in line with that reported in the Beibu Gulf in 2021 [
21] but slightly different from that reported in the eastern Beibu Gulf in 2013 with a Zn > Cu > Cr > Pb > As > Cd sequence [
22]. The maximum value of each element seemed to be 1–2 orders higher than the corresponding minimum value, suggesting the heterogeneity of the distribution of metals. The concentrations of the six metals in sediments of coastal Pearl Bay tended to be at a low to medium level compared with those reported from some other bays around the world (
Table 4).
When compared with background values of related elements in the sediment of the South China Sea [
18], the frequent over-standard phenomenon could be observed, suggesting that anthropogenic activities such as aquaculture have resulted in extra input of heavy metals. Compared with the standard values supposed in the National Standard of China for Marine Sediment Quality (GB 18668-2002), the average concentrations of Zn, Cr, Pb, Cu, and As were all within the range of Grade I (150, 80, 60, 35 and 20 mg/kg for Zn, Cr, Pb, Cu and As, respectively), while the average concentration of Cd was within the range of Grad II, indicating the sediments of Pearl Bay might not suffer from serious pollution of Zn, Cr, Pb, Cu, and As. In China, characteristics of Grade I marine sediment quality can be summarized as without carcasses of large animals and plants, without abnormal color and bad smells, and without submarine industries. It was mentioned that 75% of the samples were found with concentrations of Cd much lower than 0.5. The concentrations of the six metals in the sediments of Pearl Bay tended to be at a low to medium level compared with those reported from some other bays around the world (
Table 4).
3.2. Spatial and Temporal Variation of Heavy Metals
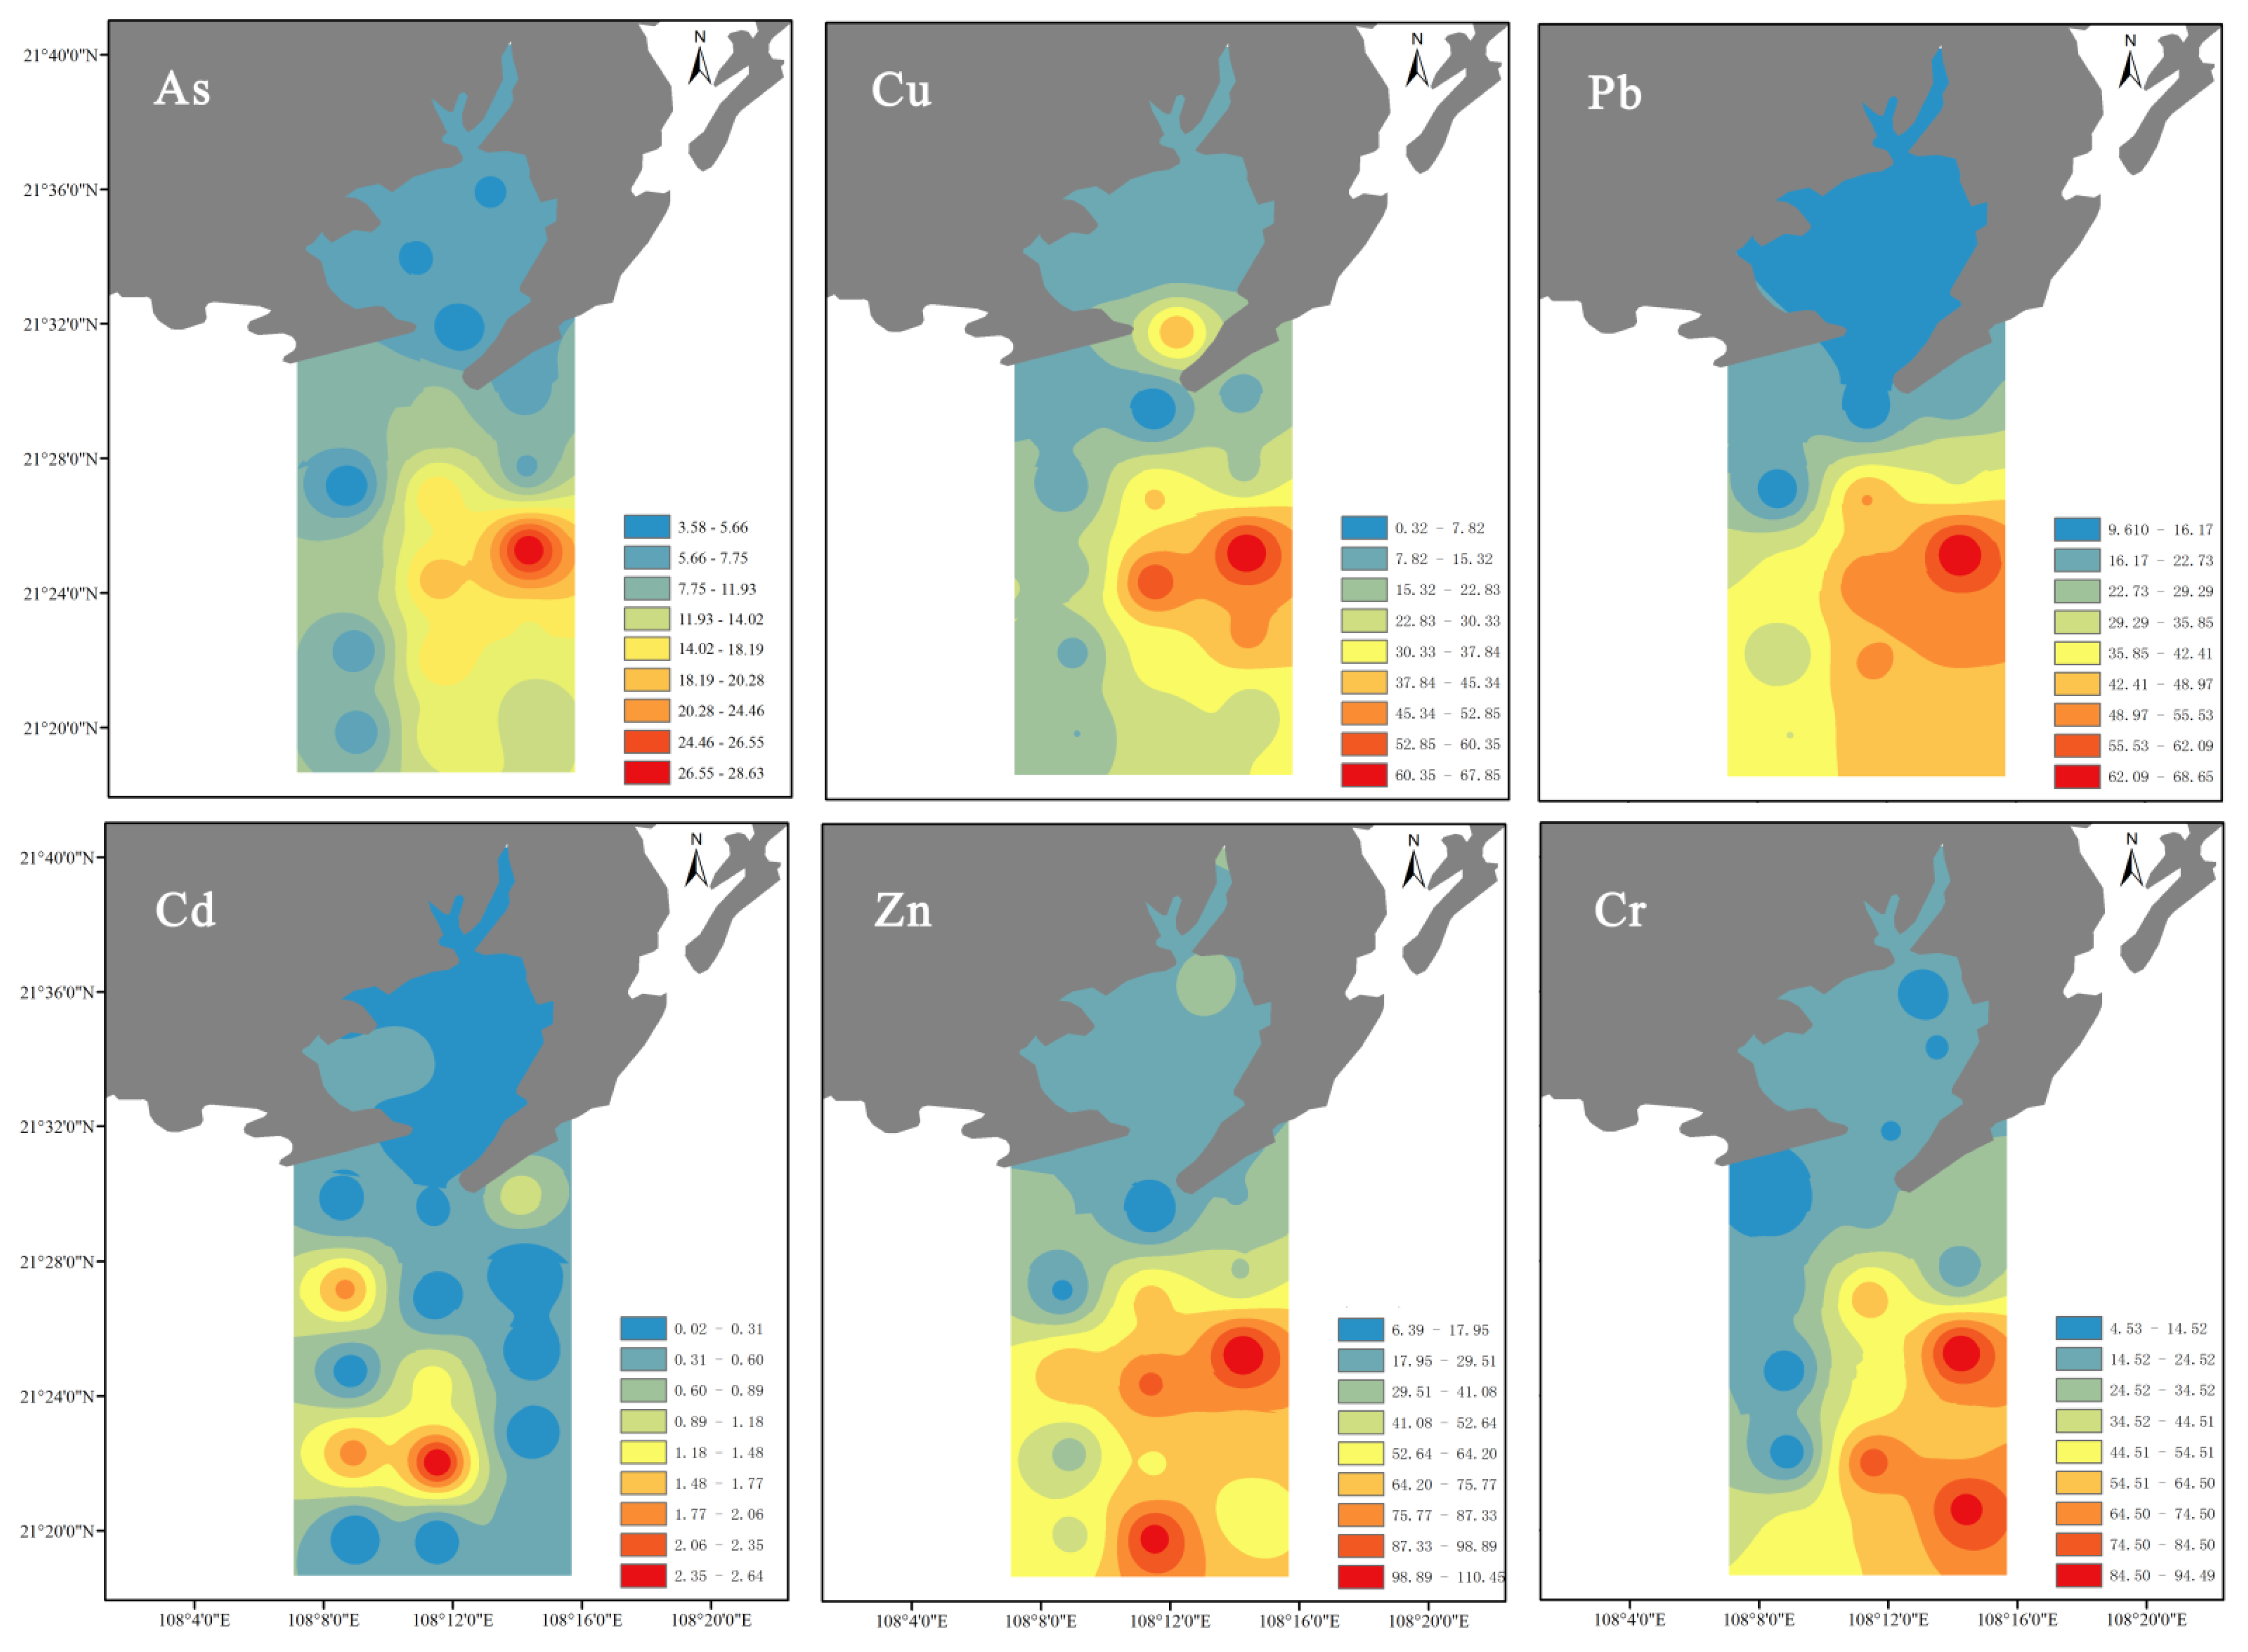
In the present study, contour maps were used to describe the spatial distributions of the heavy metal concentrations in the coastal Pearl Bay (
Figure 2). For longitudinal comparison, concentrations of the six metals in the inner bay showed generally lower levels than those in the offshore area, with the high metal content areas concentrated in the southern parts (Area III and Area IV) of the study region. The contents of As, Cu, and Pb exhibited similar distribution patterns, with decreasing values from the southeast to the northwest of the sampling area. Meanwhile, the spatial distributions of Zn and Cr displayed similar patterns, with three concentrated regions appearing in the southeastern area. Cd was an exception, and showed three high concentration zones in the southwest part, suggesting a different source and enrichment mechanism for this metal. Additionally, TOC values were found to be significantly positively correlated with most of the selected metals, except Cd. Similar relationships between TOC and heavy metals were also reported in previous studies nearby the out sea areas of Pearl Bay [
27,
33], suggesting that the abundance of heavy metals in the sediments may be burdened by organic matters. It is well documented that benthic organisms have a high affinity and play a major role in determining heavy metals in the aquatic environment [
22].
Until now, studies focusing on the heavy metals in the sediments of Pearl Bay were not available. Thus, we extracted several data information on metal concentrations from other works near this area to investigate the temporal variation (
Table 4). The results demonstrated that levels of Zn (62.37) and Pb (43.53) concentrations in 2020 were comparatively higher than those values of this study, with the rest four metals showing a slightly increasing trend of metal concentrations in recent years [
23]. Compared with the earlier phase (year 2013), the present study exhibited a considerably higher concentration profile of Cu, As, Cd, and Pb [
13]. It is worthy to note that both of the two latest Cd concentrations (including the data of the present study) were significantly higher than the corresponding value reported in 2013, indicating a rapidly growing trend of this toxic metal recently. In the coastal Pearl Bay, the increasing trend of heavy metal accumulation in sediments is likely influenced by intensive discharges of human activities, such as aquaculture input, agricultural runoff, vehicle emission, and electroplating factories [
23].
3.3. Source and Transport of Heavy Metals
Principal component analysis (PCA) was used to analyze the study the relationships between the selected heavy metals in the surface sediments of Pearl Bay. The rotated component matrixes of the PCA are presented in
Table 5. Two principal components (PCs) with eigenvalues > 1 were taken out as a consideration. Generally, metal concentrations in surface sediments exhibited a clear gradient along the main axis. PC1 explained 68.945% of the total variance and was dominated by Pb (
R = 0.961) and As (
R = 0.943), with the highest eigenvalue being 4.137. PC2 was dominated by Cd (
R = 0.994), and accounted for 17.044% of the total variance with an eigenvalue of 1.023. Negative correlations of the metal elements between PCs one and two indicated that there might be two different models of metal sources in the sediments.
The Person correlation (PC) matrix is commonly used to find a common source of metal [
19], thus the relationships among the examined heavy metals were verified using this method in the present study.
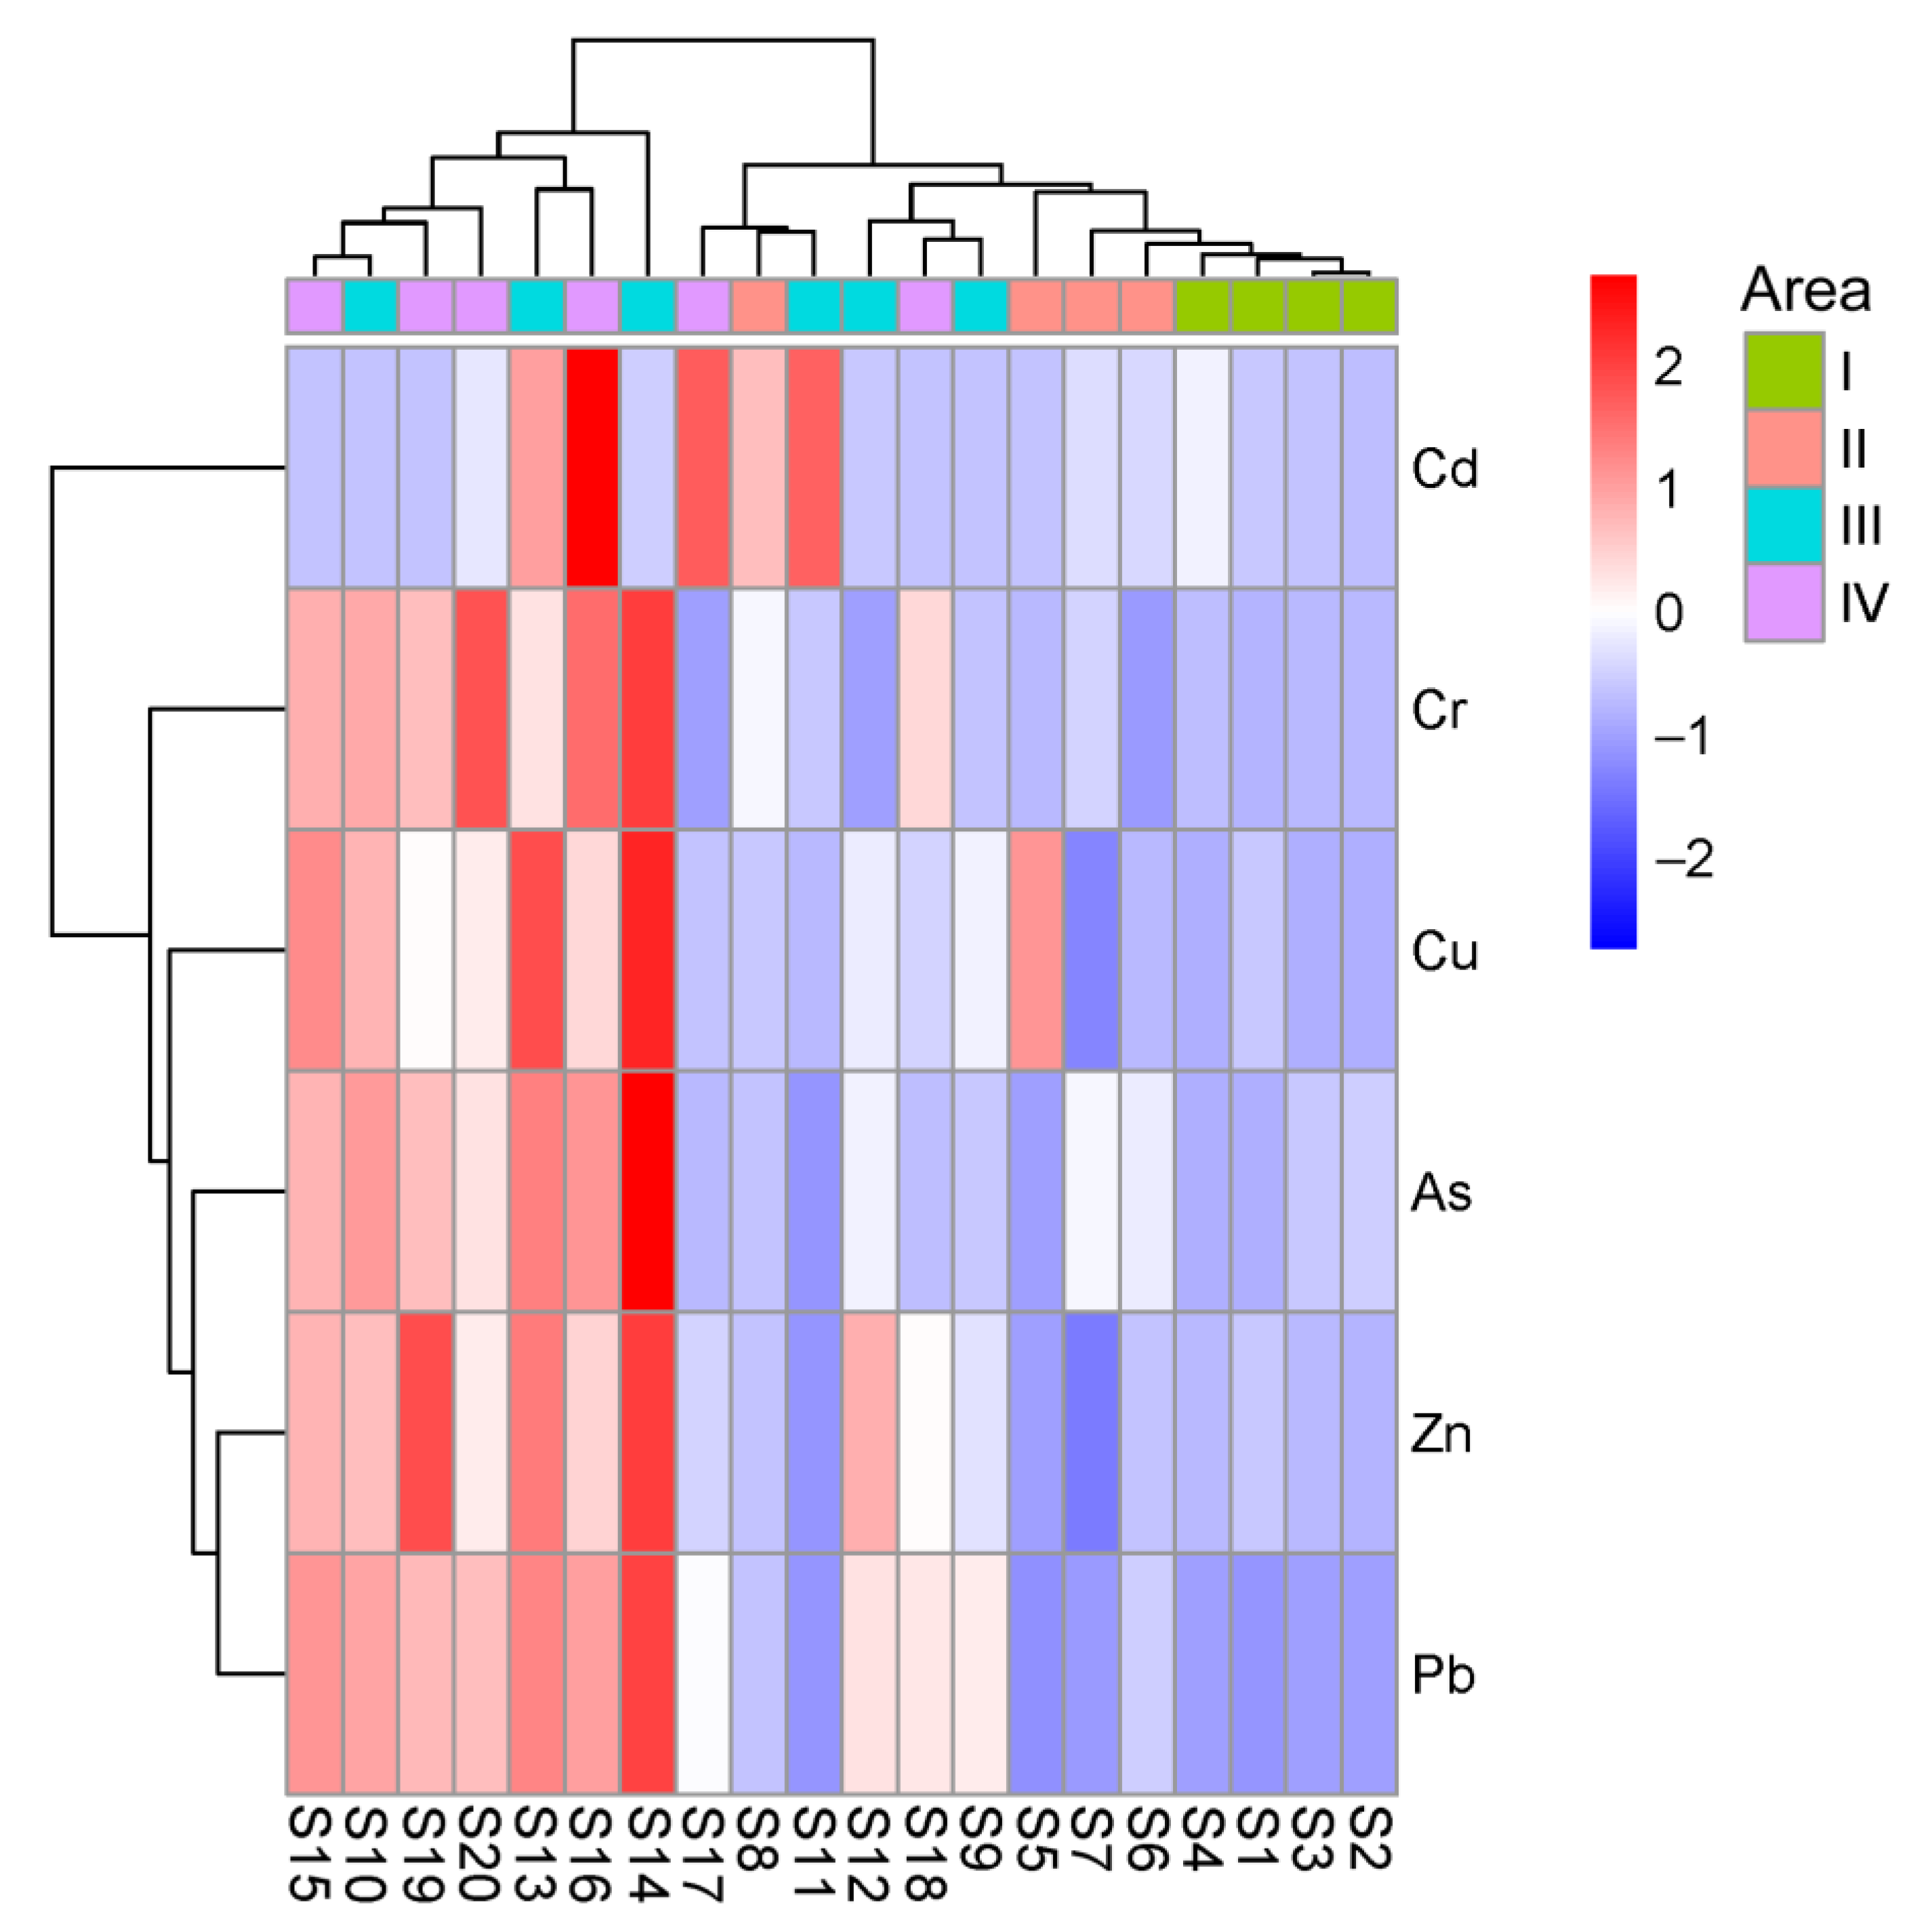
Table 6 presents the PC matrixes of heavy metals in the surface sediments of Pearl Bay. There were high correlations among metals of As, Cu, Pb, Zn, and Cr, indicating that these metals might have common anthropogenic sources. Contrarily, Cd was observed to have no correlations with the above-mentioned metals, suggesting a different inputting channel of Cd. The heat map according to hierarchical cluster analysis showed the same relationships among the six studied metal elements (
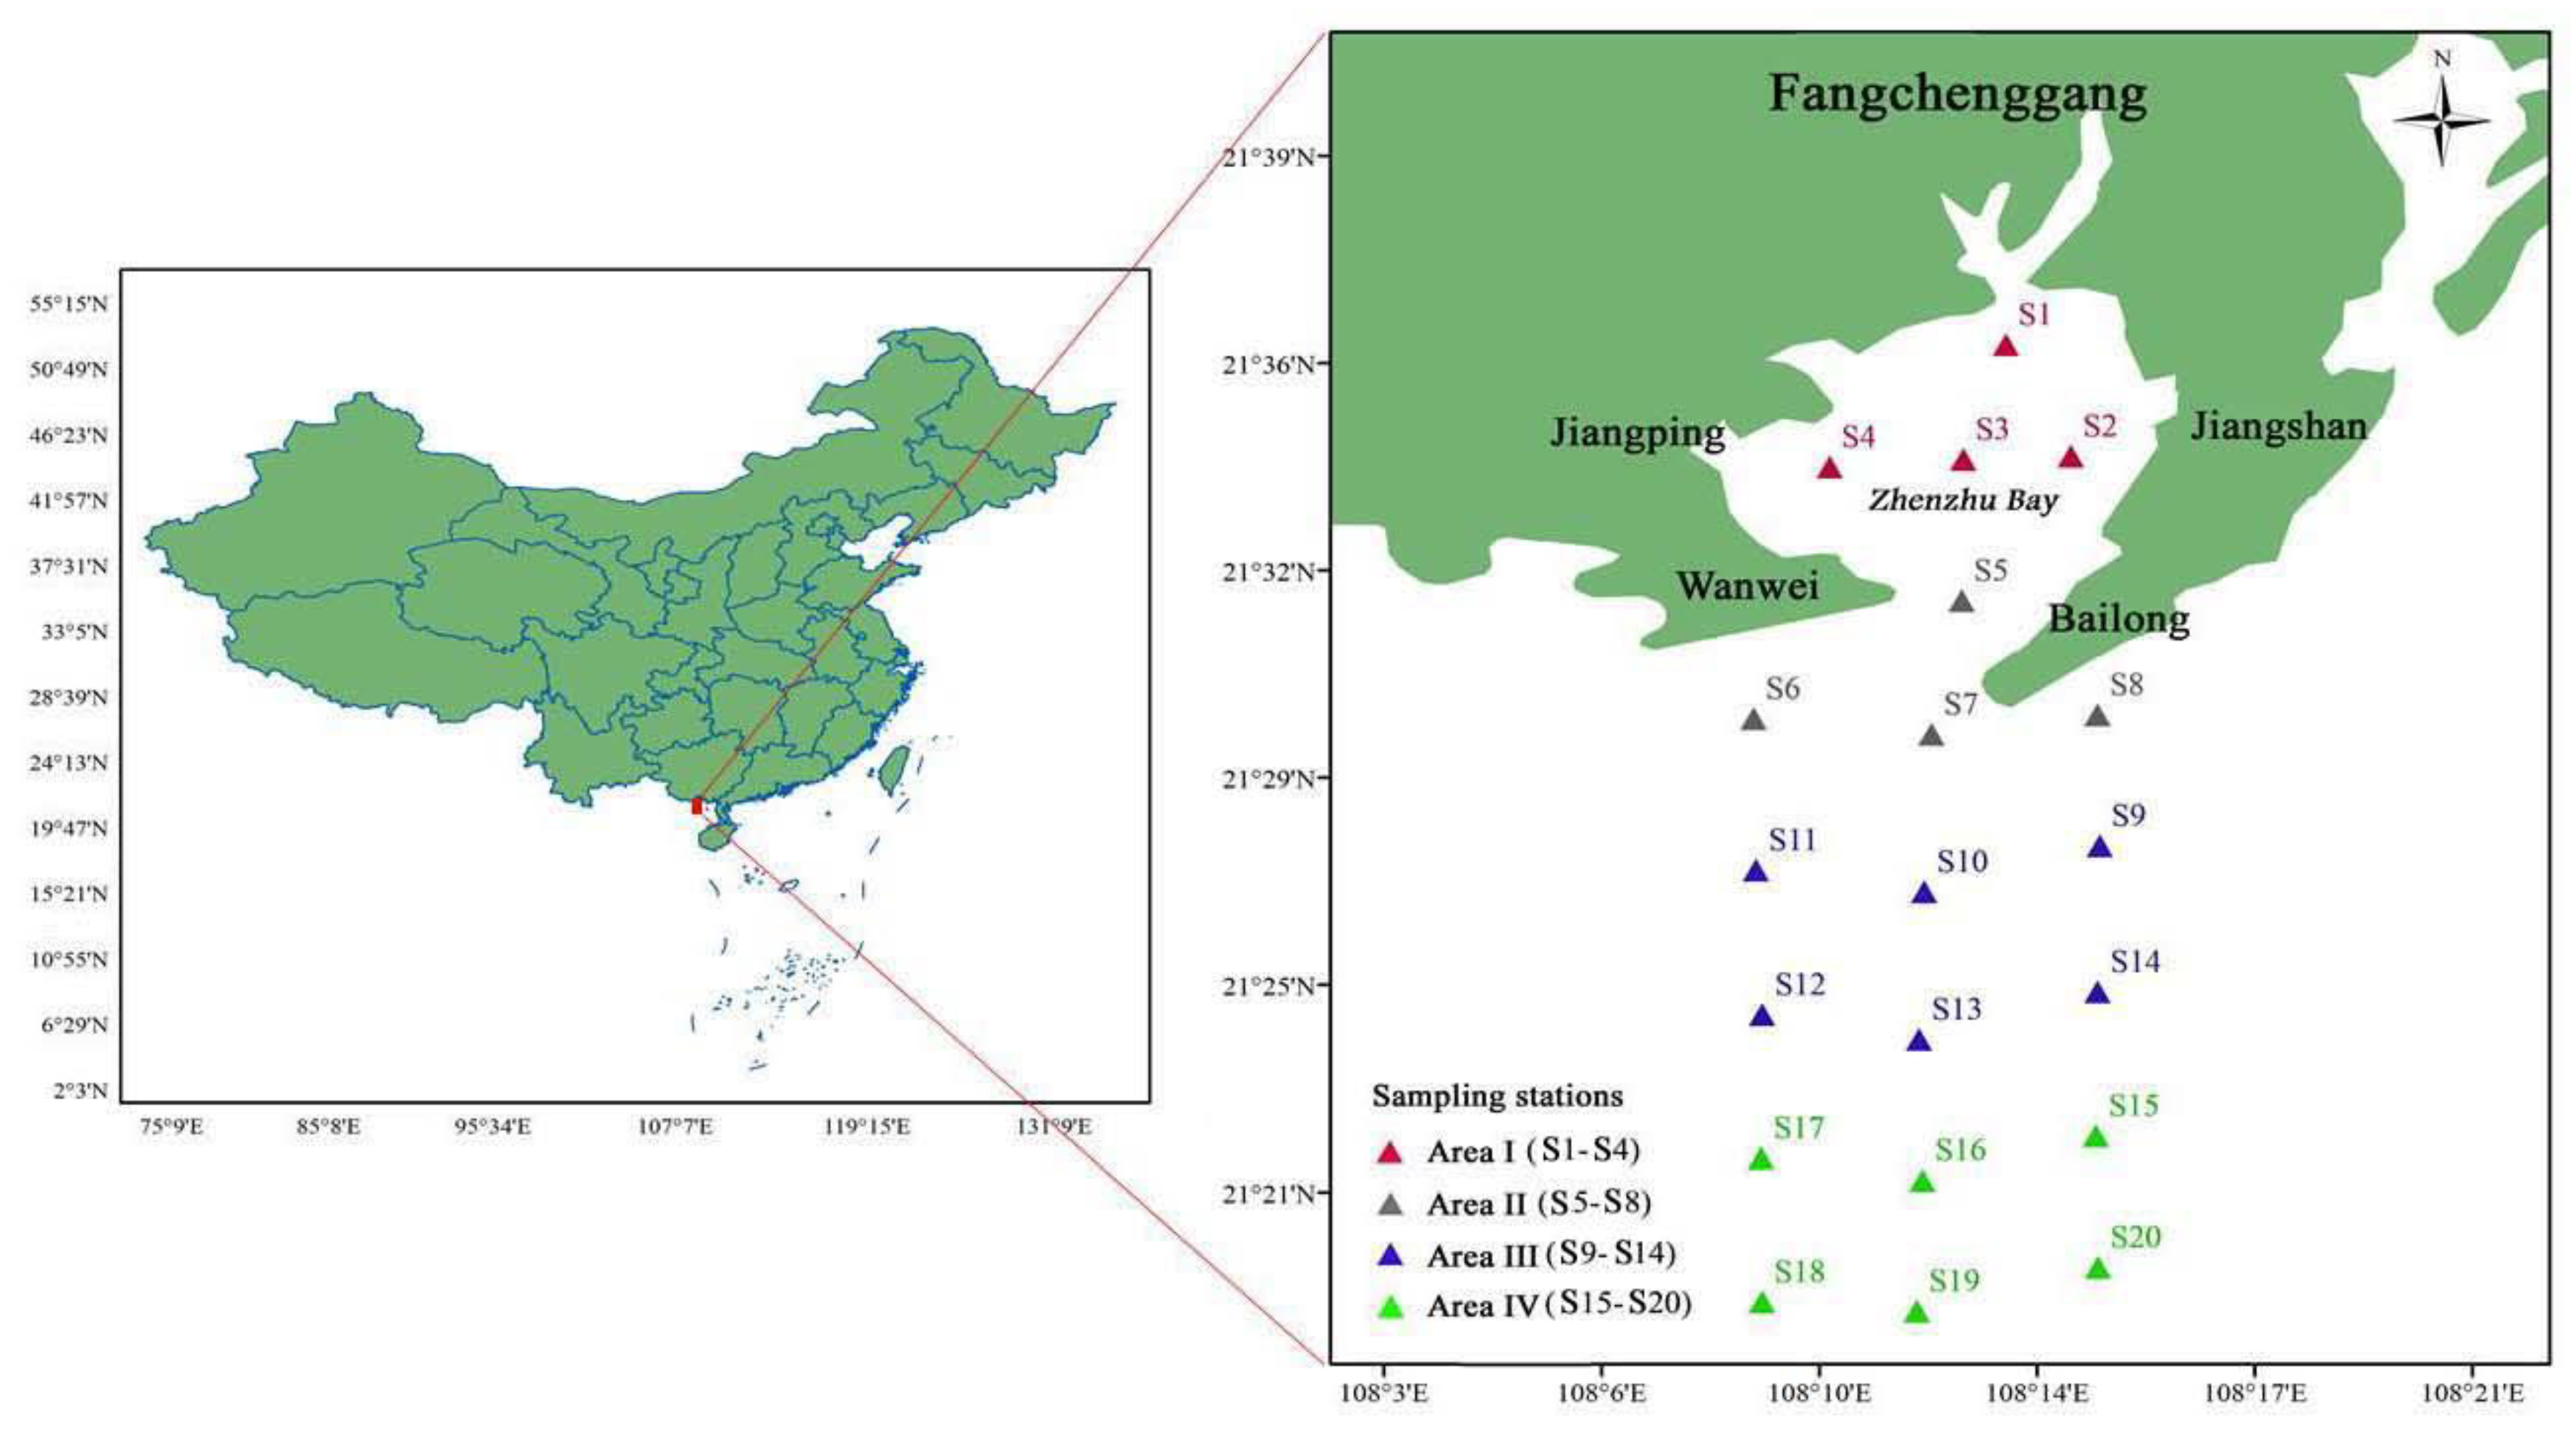
Figure 3). Moreover, the sites of Area I (S1–S4) and three sites (S1–S4) in Area II clustered together in one group, indicating the similar metal source and distribution patterns in sediment samples of these two areas. Previous studies have demonstrated that heavy metals in sediments were probably introduced from different anthropogenic and natural sources [
34,
35,
36]. The possible sources of Cu, Zn, and Cr may originate from natural sources inland. Pb and As may come from the gasoline and diesel fuel from engine boats. The relative enrichment of Cd may be caused by the high input of phosphate fertilizers used in agricultural activities and phosphate mining nearby [
13,
21,
23,
27]. Concerning this, it is necessary to develop organic agriculture and green aquaculture as well as reduce the number of high contaminative industries around Pearl Bay, to control and minimize the anthropogenic metal inputs from the primary source.
3.4. Risk Assessment
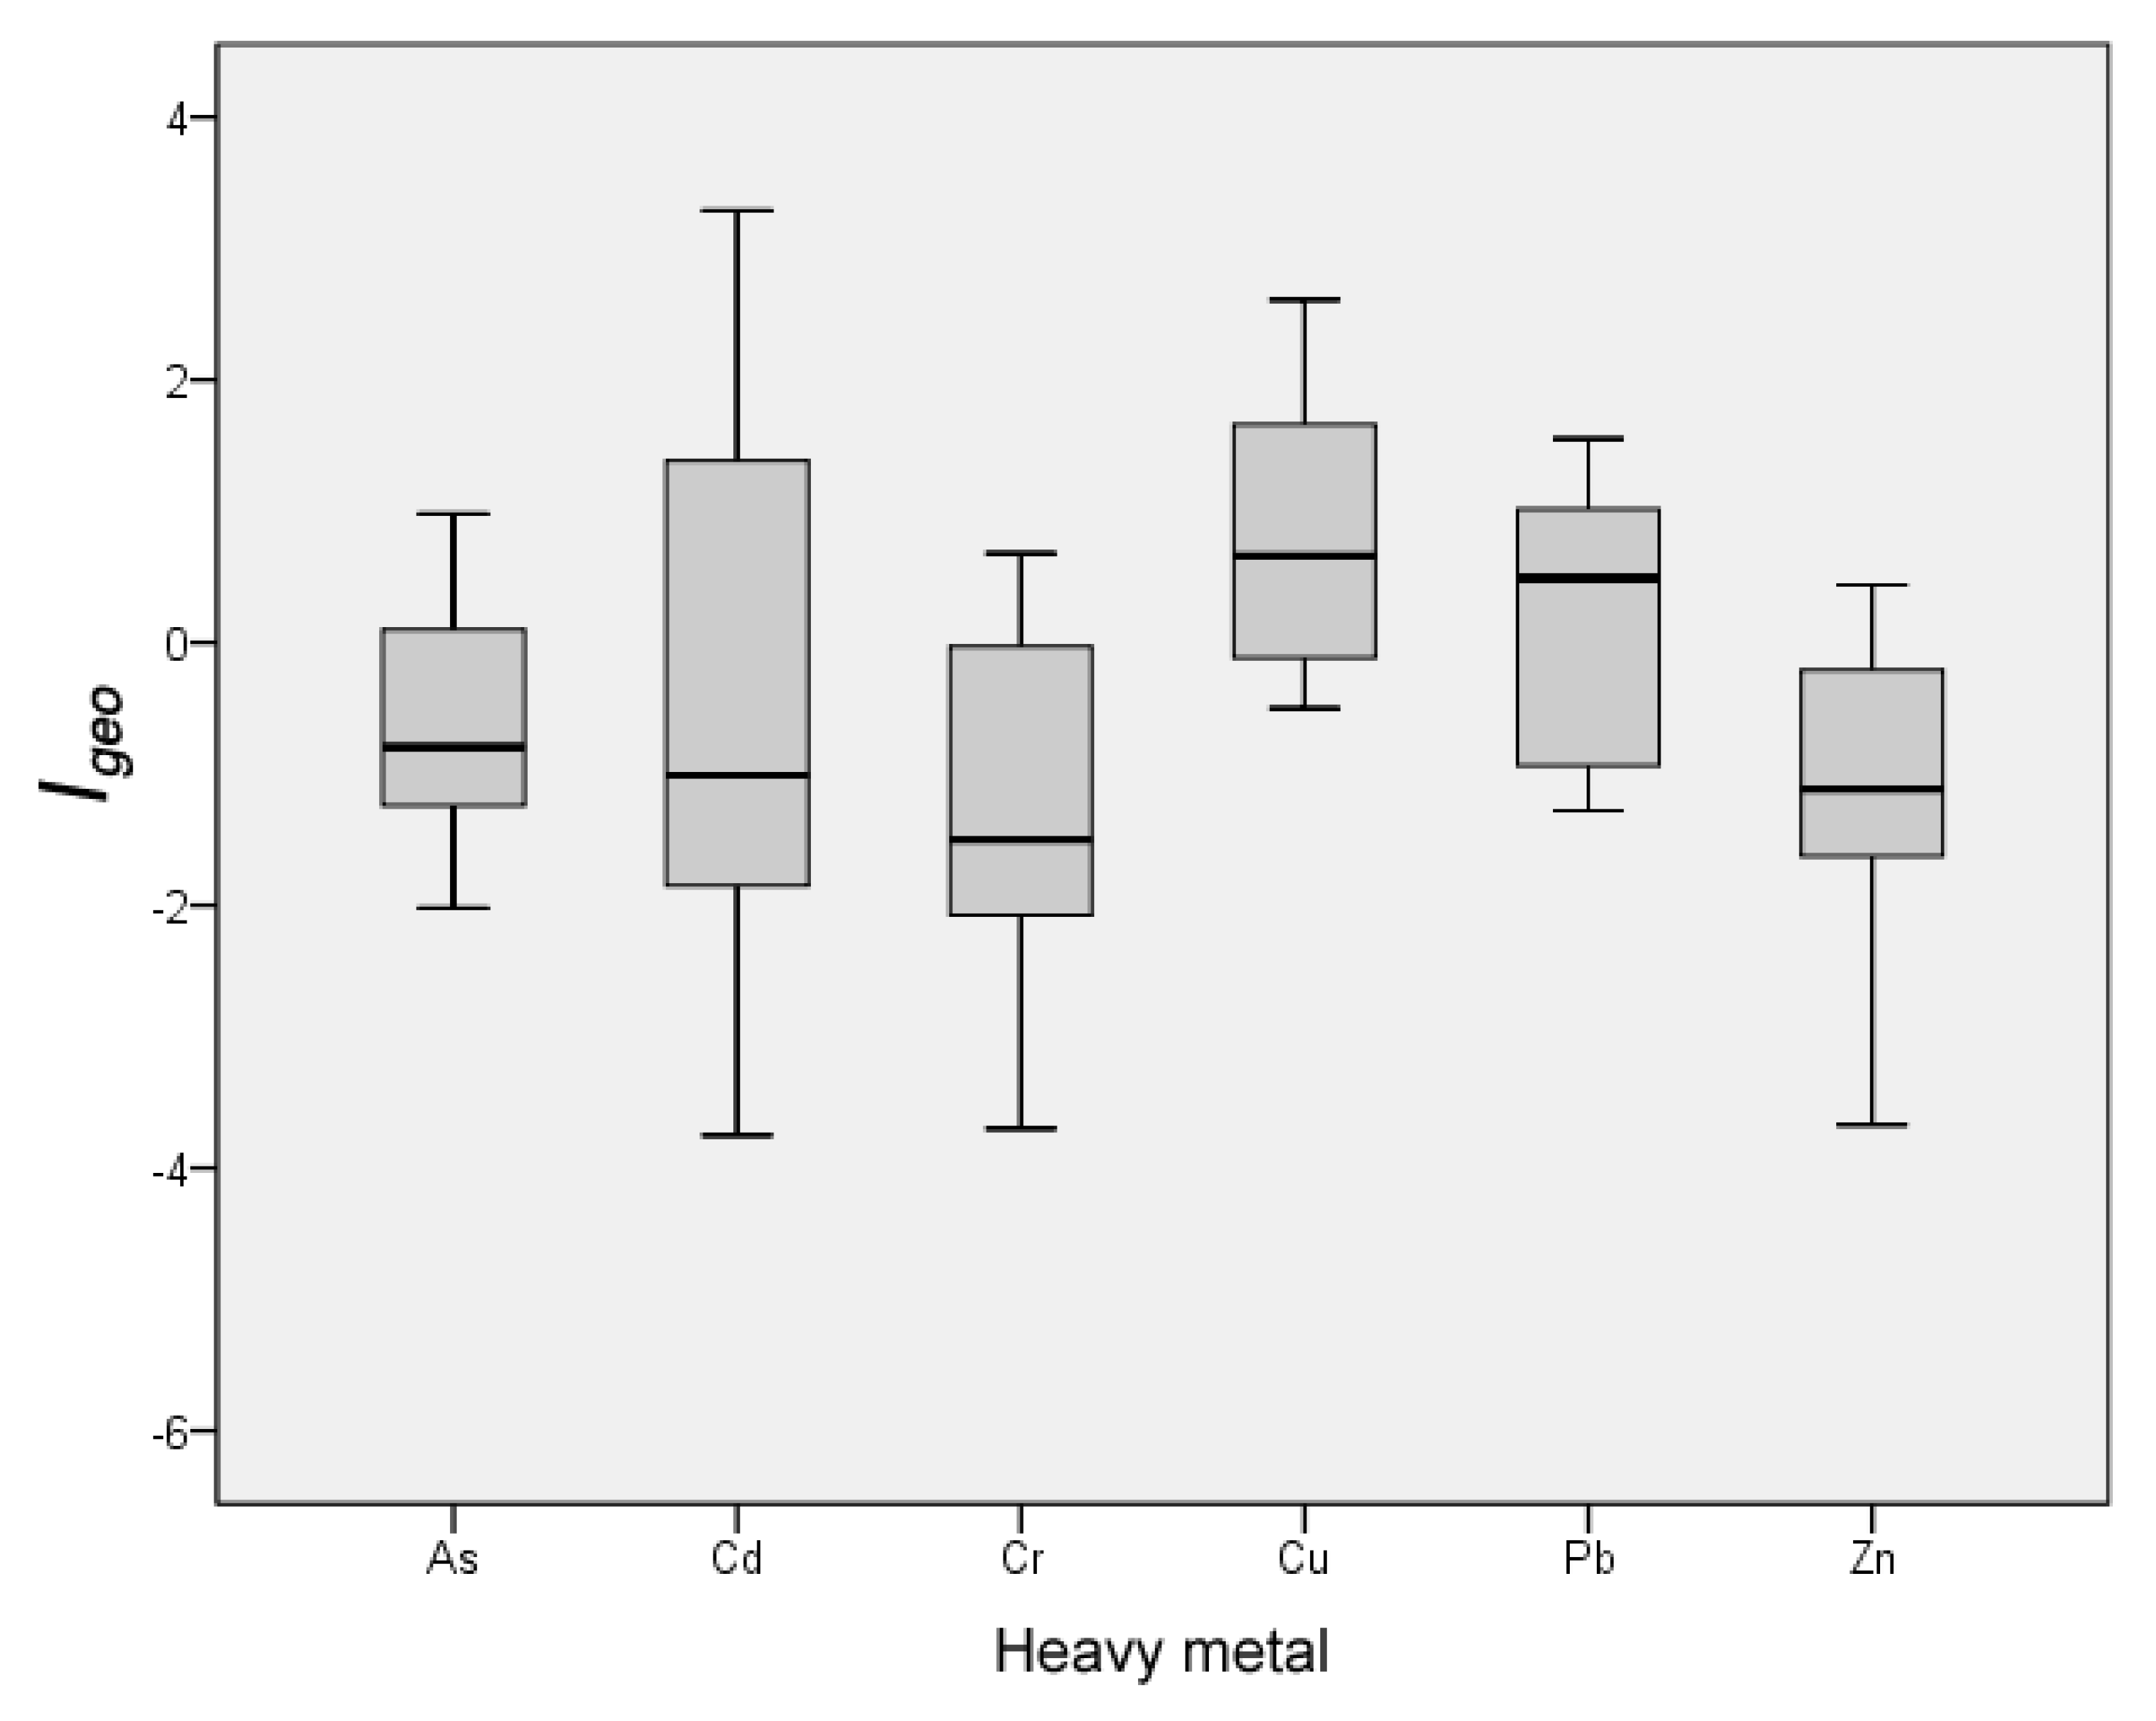
The
Igeo values for the study area are presented in
Table 7 and
Figure 4. In total,
Igeo values followed the order as: Cu > Pb > Cd > As > Zn > Cr. Among those, the average
Igeo values of Cu and Pb were > 0, indicating that there were exogenous inputs of these two metals around the study area. Except for Cu at site S1 and Cd at site S4, all the remaining
Igeo values of the six tested heavy metals in sediment of inner Pearl Bay (Area I) were below zero, representing the category ‘Practically unpolluted’ at S1–S4 sampling area. In Area II, site S5 and S8 were considered moderately to highly polluted, since these two sites showed high
Igeo value of Cu (2.01) and Cd (2.03), respectively. The average
Igeo values of Area III ranged from −1.00 (Cr) to 1.42 (Cu), indicating that site S11 was moderately polluted by Cu. Similarly, the calculated
Igeo indexes showed that Area IV stations were polluted by Cu, Pb, and Cd, with
Igeo values being 1.12, 0.86, and 0.18, respectively. The high values of
Igeo for Cu might be partly due to the low background Cu level in the study area [
37]. Actually, the measured Cu concentrations were far lower than the SQGs used by the National Oceanic and Atmospheric Administration (NOAA) [
38].
The single pollution index provides a simple, comparative means for assessing the level of heavy metal pollution, with CF value > 1 indicating a polluted condition, while CF value < 1 suggesting no metal pollution events [
39]. In the present study, CF values of Zn for all investigated sites were detected as <1, which suggests a sign of low contamination by Zn. The average CF values of As, Cu, Pb, and Cr were 0.54, 0.69, 0.52, and 0.45, respectively. However, Cd showed high CF values at sites S16 (5.30), S17 (3.80), and S11 (3.72), which are all in the range of 3–6. Consequently, these sites were tagged as considerably contaminated by Cd.
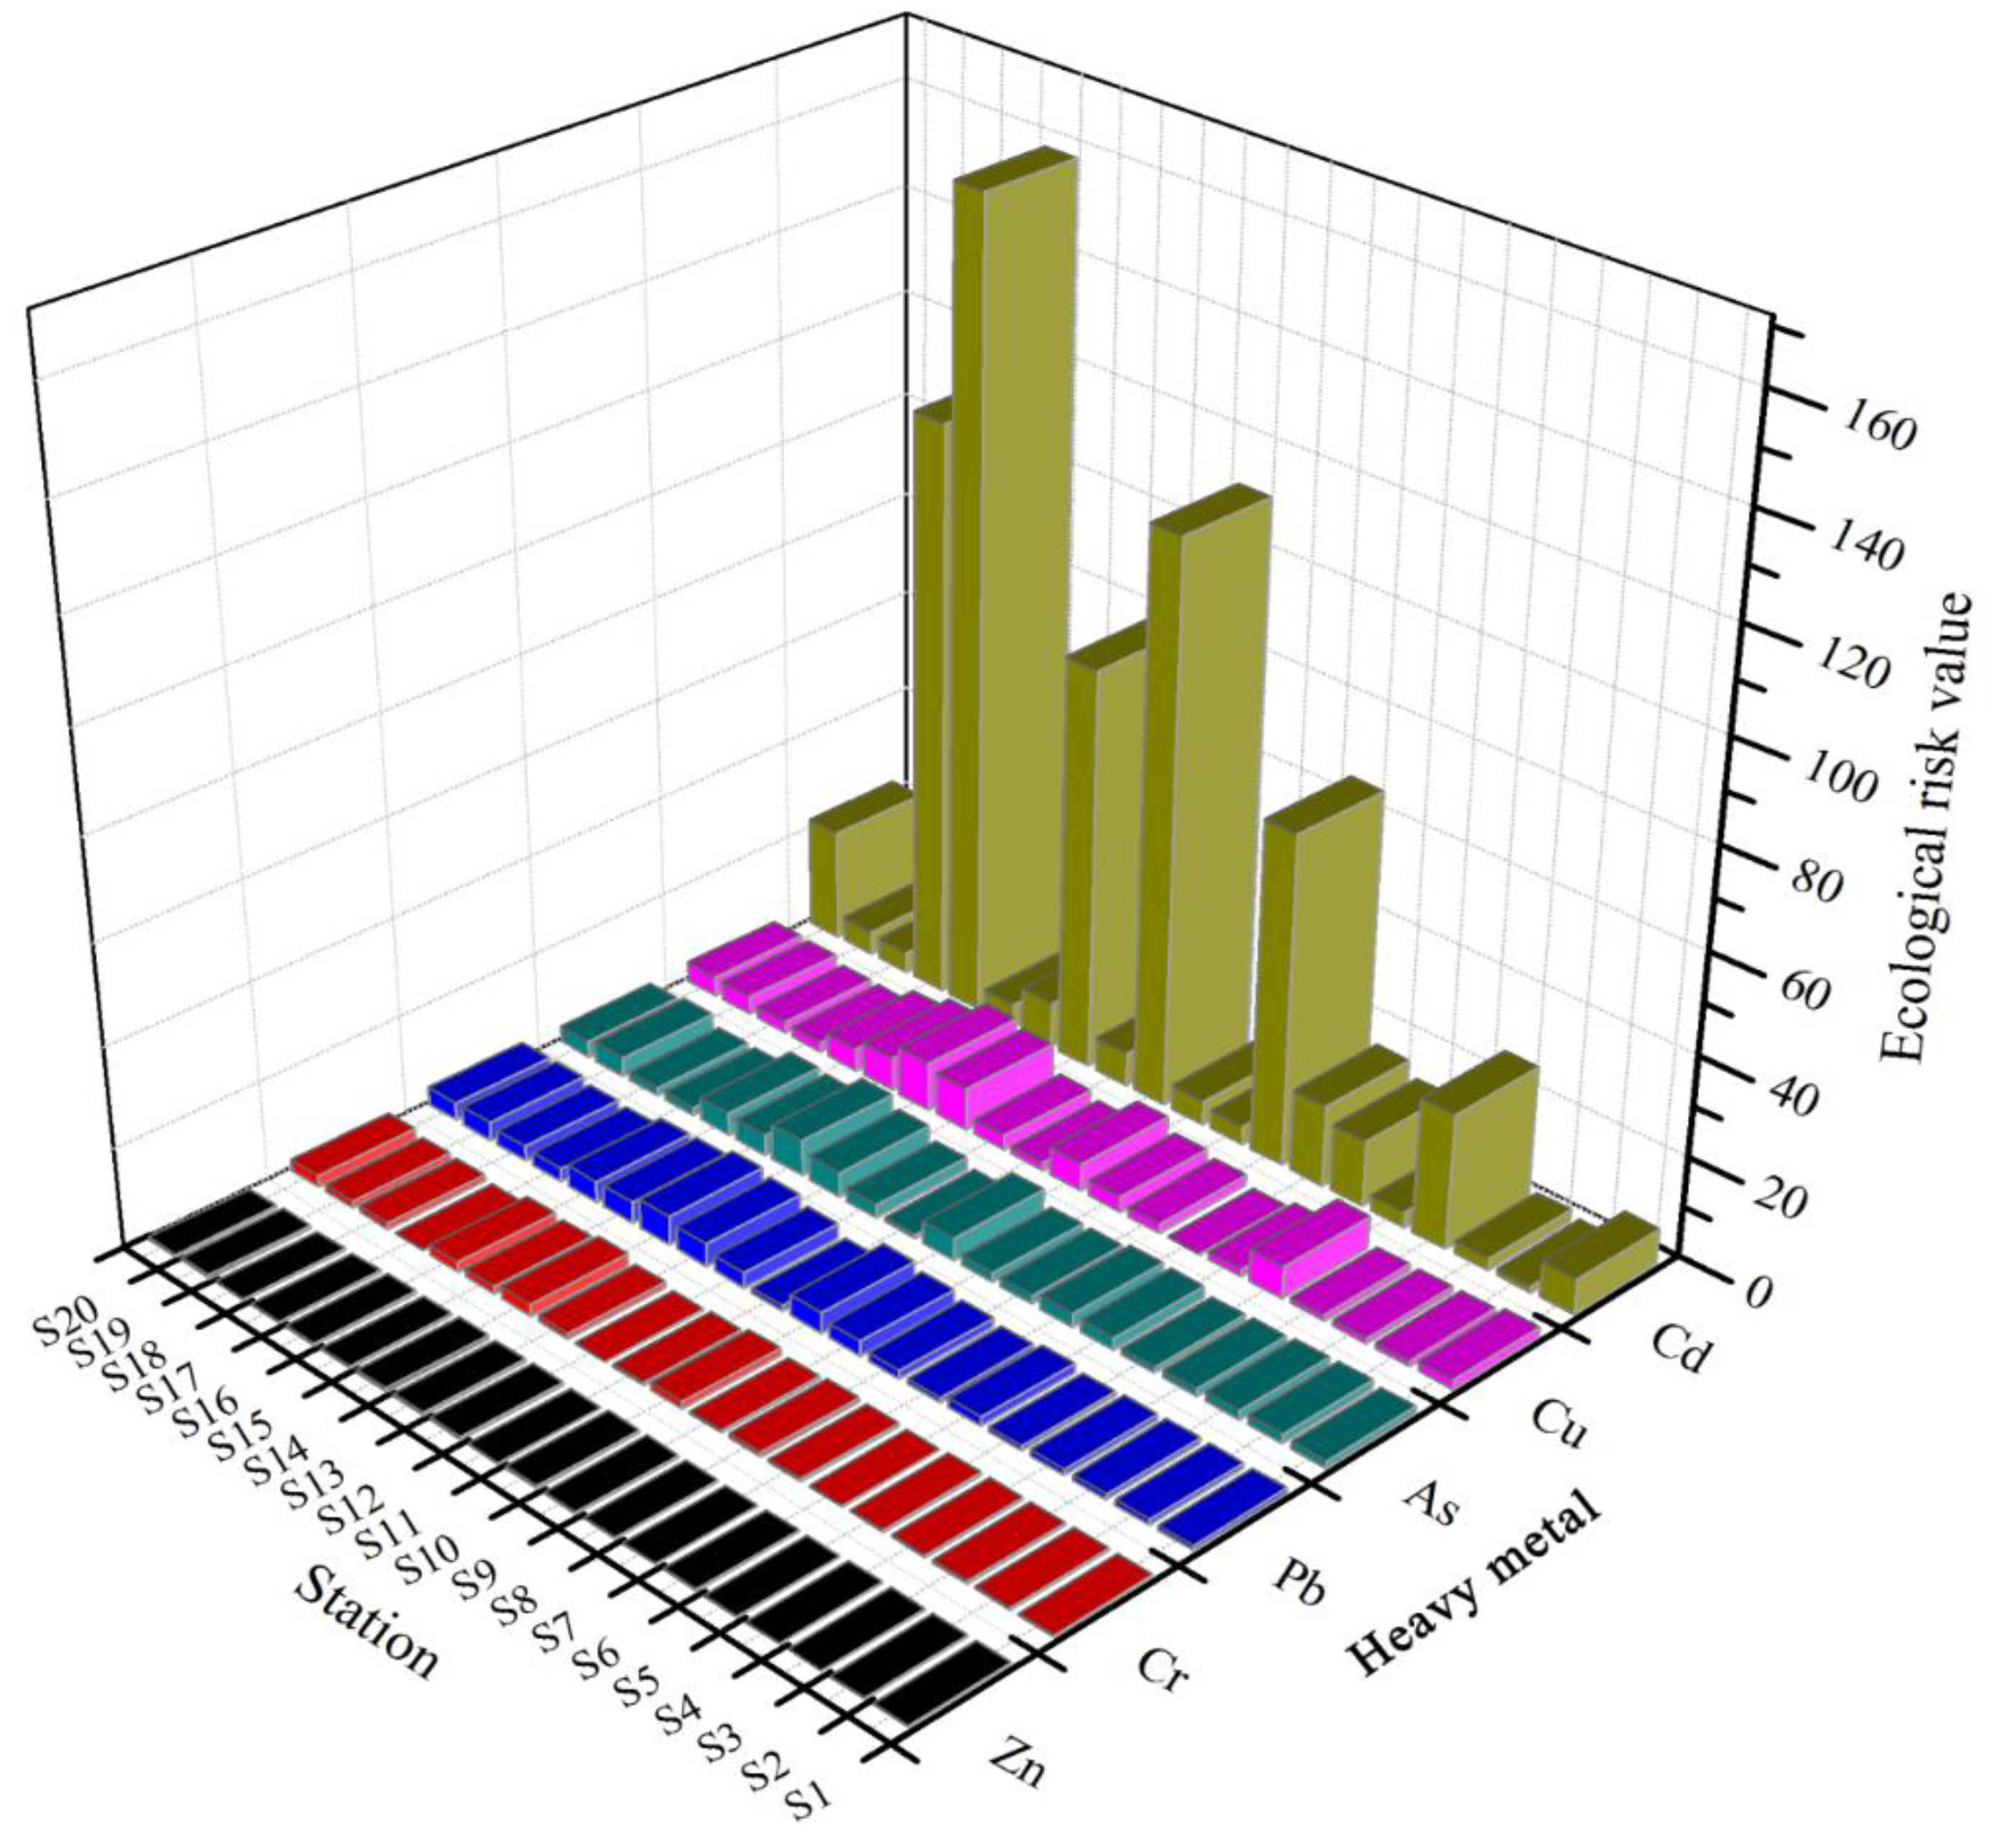
According to the potential ecological risk index, studied metals were arranged as: Cd > Cu > As > Pb > Cr > Zn (
Table 8). The
Eri values of the sampling stations around Pearl Bay were at low ecological risk by As, Cu, Pb, Zn, and Cr, since the
Eri values were lower than 40. However,
Eri values of Cd in sediments of S16 (159.0), A17 (114.0), and S11 (111.6) were >80, indicating a considerable ecological risk of Cd. Meanwhile,
Eri values of Cd at sites S13 and S8 were observed larger than 40, suggesting moderate ecological risk (
Figure 5). Though the average
Eri value of Cd was calculated under the guideline of low ecological risk, two stations in Area IV were found with extremely high
Eri values (51.50), leading to a moderate Cd risk in this study area. Cd is much more toxic and can be accumulated throughout human life and may cause some diseases, such as kidney dysfunction and reproductive deficiencies [
40]. The observations of this study demonstrated that Cd contamination was obvious in coastal areas of Pearl Bay, especially in the south region of the study area. Similar to our results, Cd contamination was also recorded in surface sediments from the Thondi coast, Palk Bay, South India, with the anthropogenic inputs such as municipal wastewater, domestic sewage discharge, fishing harbor activities, and industrial and aquaculture wastes being considered to be the potential sources [
41]. According to previous studies [
22], moderate pollution of Cd was also reported in the north of the eastern Beibu Gulf. The elevated Cd values in coastal areas of Beibu Gulf were considered to be caused by the presence of anthropogenic pollution transported by the rivers such as Bei Lun, Mao Ling, and Da Feng Rivers [
42].
In the present study,
RI was determined as another indicator to assess the potential ecological risk of heavy metals (
Table 8). Overall, the
RI values of the 20 investigated sediment samples ranged from 5.73 to 174.68. The result leads to a decision that the examined heavy metals posed low ecological risks to the surface sediments of Pearl Bay. As it was mentioned above, the sediment of site S16 was considerably polluted by Cd, resulting in moderate ecological risk at this site. Similar to our results, Dou et al. (2013) pointed out that the sediment of eastern Beibu Gulf had no ecological risk when excluding Cd pollution [
22]. However, contaminant behavior in sediments is a dynamic process and can be regulated by various physical and chemical factors, thus chemical analyses alone do not necessarily reflect the actual toxic action of contaminants [
43]. Therefore, further research is recommended to focus on finding out the accurate source of Cd and studying its transmission pattern in the aquatic ecosystem of Pearl Bay. Additionally, the integrated and multidisciplinary approaches such as the Weight Of Evidence (QOE) method, Lines Of Evidence (LOEs) chemical analyses, contaminant recognition method [
44], and geo-chemo-mechanical methodology [
45] are required to comprehensively evaluate and classify the chronically biological, chemical and toxicological impacts of the contaminants in the study area.


