Article

Evolution Prediction of Hysteresis Behavior of Sand under Cyclic Loading

1
School of Environmental and Safety Engineering, Changzhou University, Changzhou 213164, China
2
Department of Engineering Mechanics, Dalian University of Technology, Dalian 116024, China
3
School of Civil Engineering, Southeast University, Nanjing 211189, China
4
Department of Civil, Architectural, and Environmental Engineering, Missouri University of Science and Technology, Rolla, MO 65409, USA
*
Authors to whom correspondence should be addressed.
Processes 2022, 10(5), 879; https://doi.org/10.3390/pr10050879
Submission received: 1 April 2022 / Revised: 23 April 2022 / Accepted: 23 April 2022 / Published: 29 April 2022
(This article belongs to the Special Issue Advances in Numerical Modeling for Deep Water Geo-Environment)

Abstract

:
Soil cyclic degradation is a serious issue that should be considered in engineering design and maintenance. The hysteretic response causes strength degradation and excessive settlement of soil structure in engineered and natural geosystems. Hysteresis is essentially the coupling deformation of elastic and plastic components during reloading and unloading processes. Conventional hysteretic models for sand in the elastoplastic framework rely highly on yield surface or potential surface evolution and fall short on complexity and inaccuracy. This study proposes a decoupling method to describe the hysteretic response of sand. In contrast to the conventional elastoplastic approach, this decoupling method can directly decouple the elastic and plastic components by determining the boundary between the elastic strain extension domain and the plastic strain extension domain for each stress cycle. In this way, the elastic and plastic stress–strain branches during cyclic loading can be separately obtained, and the corresponding elastic and plastic parameters are employed to characterize mechanical behavior. With the respective evolution of elastic and plastic strains, the hysteretic behavior of sand is reproduced by combining all the branches. Finally, this decoupling method is validated by three conventional cyclic loading tests. The predictions are consistent with the experiments, indicating that the decoupling method is generally effective in describing the hysteretic behavior under cyclic loading. This decoupling method provides new insight to obtain elastic and plastic deformation behaviors separately, without recourse to complicated plastic surface and hardening law.

1. Introduction

The cyclic degradation of soil structure caused by cyclic loads is a serious issue that should be considered in engineering design and maintenance, which has a potentially high risk in terms of safety [1,2]. Excessive settlement and excess pore pressure accumulation are the ultimate direct results of soil cyclic degradation, hence deteriorating the long-term functionality of soil structure in engineered and natural geosystems [3,4]. For example, pavement cracking from fatigue is caused by the deterioration of the subgrade under long-term cyclic loading with coupling-resilient deformation and accumulated plastic deformation [5,6]. Soil cyclic degradation can also endanger the stability of a foundation in undrained conditions, in which the effective stress decreases with the accumulation of pore water pressures due to cyclic shearing [7]. The soil cyclic degradation process is presented well by the hysteresis response. The hysteretic response is a significant mechanical behavior performance during the cyclic degradation process, which is often regarded as an extensive research object. Therefore, it is of great significance to describe the hysteresis behavior accurately in cyclic loading.
Hysteresis constitutes coupling elastic and plastic behaviors in the unload–reload process. The conventional elastoplastic models from static analysis assume purely elastic deformation within the interior of the yield surface in response to external stress change. They work well in the static analysis but are not applicable in the cyclic analysis. One typical feature in hysteresis is the phenomenon that the unload–reload cycle with constant stress amplitude can result in a gradual accumulation of permanent strain. The different behavior in cyclic loading inevitably limits the application of the conventional elastoplastic constitutive models on the hysteretic response. For example, in classical critical-state models, as well as in modified-state surface approach models, large plastic strains occur only on primary loading (the first loading), and elastic strains are assumed on subsequent unload–reload cycles within the yield surface [8,9,10,11]. To better describe the hysteresis response, extensive endeavors have been made by introducing the hardening modulus theories, such as multiple yield surface plasticity [12,13], kinematic hardening [14,15], sub-loading surface [16], and finally boundary surface plasticity [17,18,19] and generalized plasticity [20,21]. In those continuum-based theories, hardening modulus is associated with either specified yield surface, potential surface, or directly defined, which obscures the deformation mechanism of particular soils in hysteretic response. Particles soils are found to yield in the unloading process, with a relatively large stress increment exceeding the transient elastic limit [22,23,24]. Hence, the evaluation of the elastic parameters directly in the unloading process seriously affects the accuracy of the subsequent plastic parameter calibration. Moreover, the pseudo-elasticity obtained during the unloading process depends on the stress history, resulting in the arbitrariness of the parameters of the hardening modulus calibration. In fact, the constitutive theory focuses on the yield surface or potential surface in the elastoplastic framework, and cannot directly apply to soils compared with continuum materials [25]. Thus, the hysteretic behavior needs to be understood directly from the evolution process of elastic and plastic deformation during reload–unload cycles.
The reload–unload cycle constitutes the loading and unloading branches in each cycle, and each branch has a coupling of elastic and plastic deformations. It is noted that plastic deformation (strain) develops during unloading in a contractive nature [21]. Each axial strain increment in loading or unloading is the sum of elastic and plastic strain components, and the strain increments accumulate with increasing stress levels. Therefore, the accumulated strain can be separated into the elastic strain extension domain and the plastic strain extension domain. These two domains are demarcated by loading or unloading elastic curves. If this elastic curve is obtained, the elastic strain and plastic strain at any stress level can be readily calculated, as schematically shown in Figure 1. Combining the elastic and plastic parts of each cycle, a continuous hysteretic response is reproduced immediately.
Motivated by the need to characterize the hysteresis process accurately, the objective of this study was to propose a decoupling method to accurately obtain the strain components on both sides of the elastic curve at any stress level during each stress cycle. As opposed to the aforementioned methods, the advantage of our method lies in directly describing the elastic and plastic behaviors for all branches in cyclic loading without assumptions about yielding surface expansion or hardening laws. The elastic and plastic strains are obtained directly. First, the elastic dividing curve is determined to decouple the elastic and plastic components during each loading or unloading branch. Then, empirical formulas on elastic and plastic parameters are employed to describe the corresponding variations of strains; therewith, the hysteretic behavior of sand is reproduced by combining all the branches. Finally, this decoupling method is validated by three conventional cyclic loading tests.

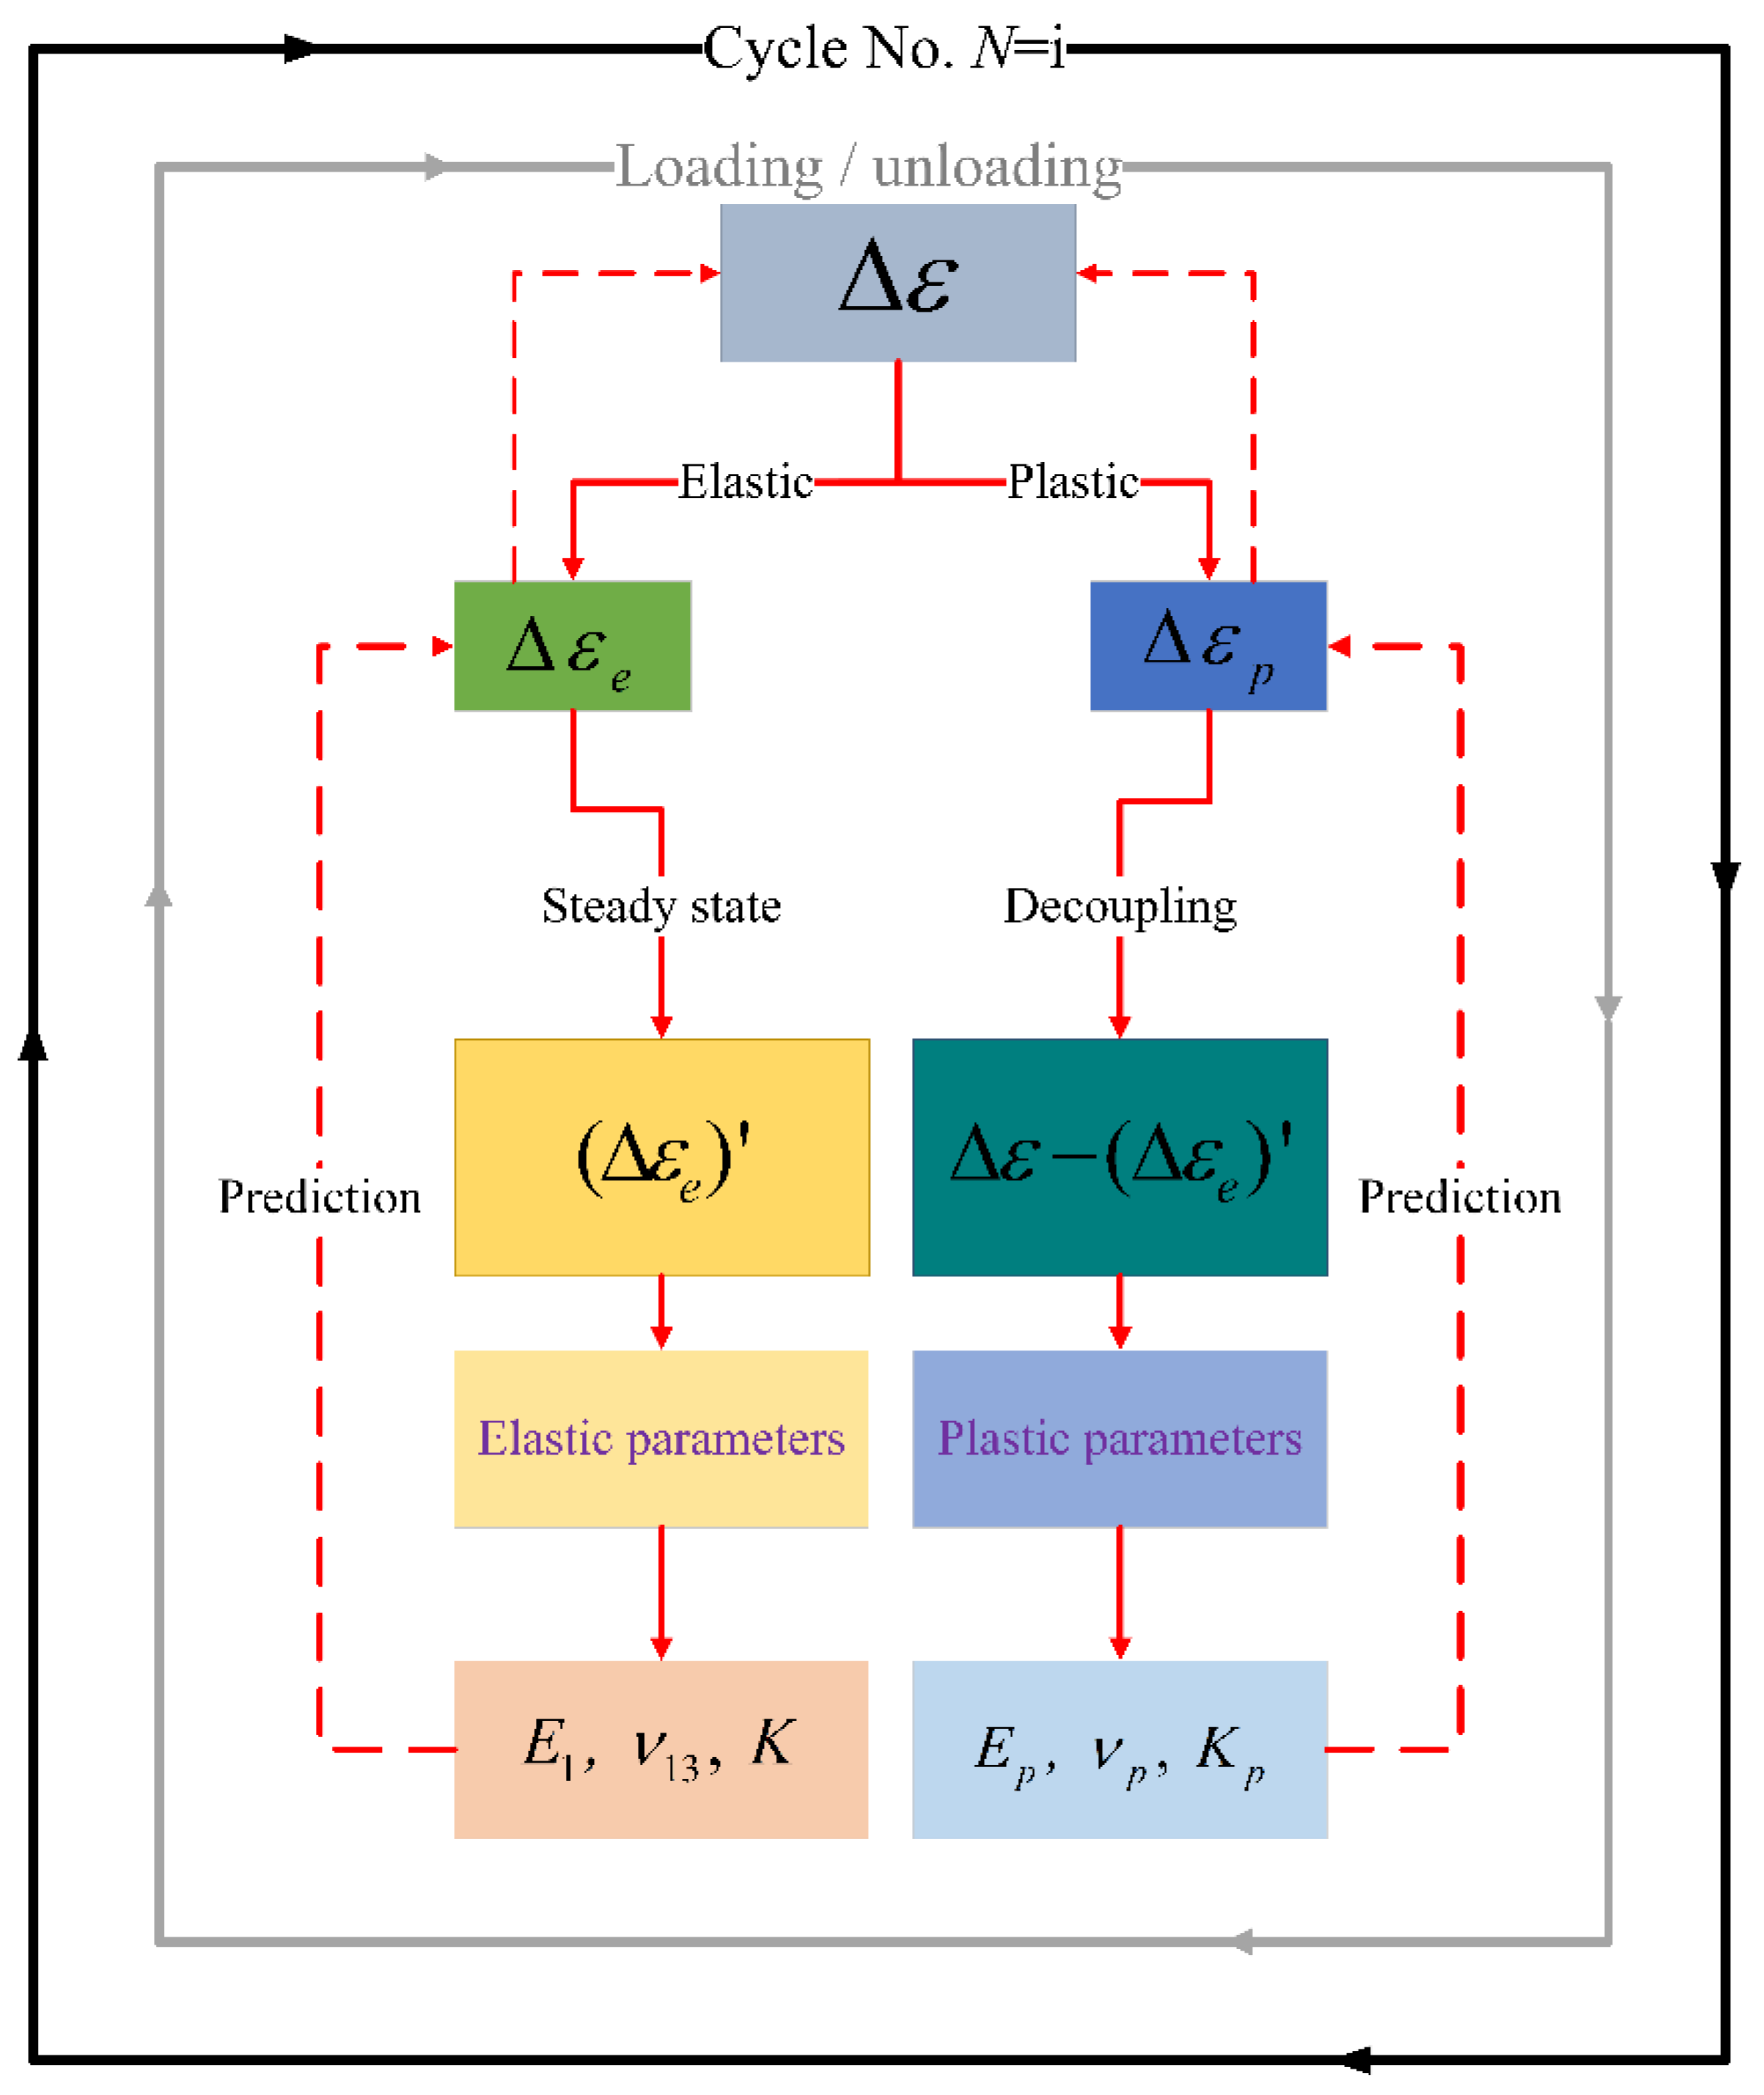
2. Details of the Decoupling Method

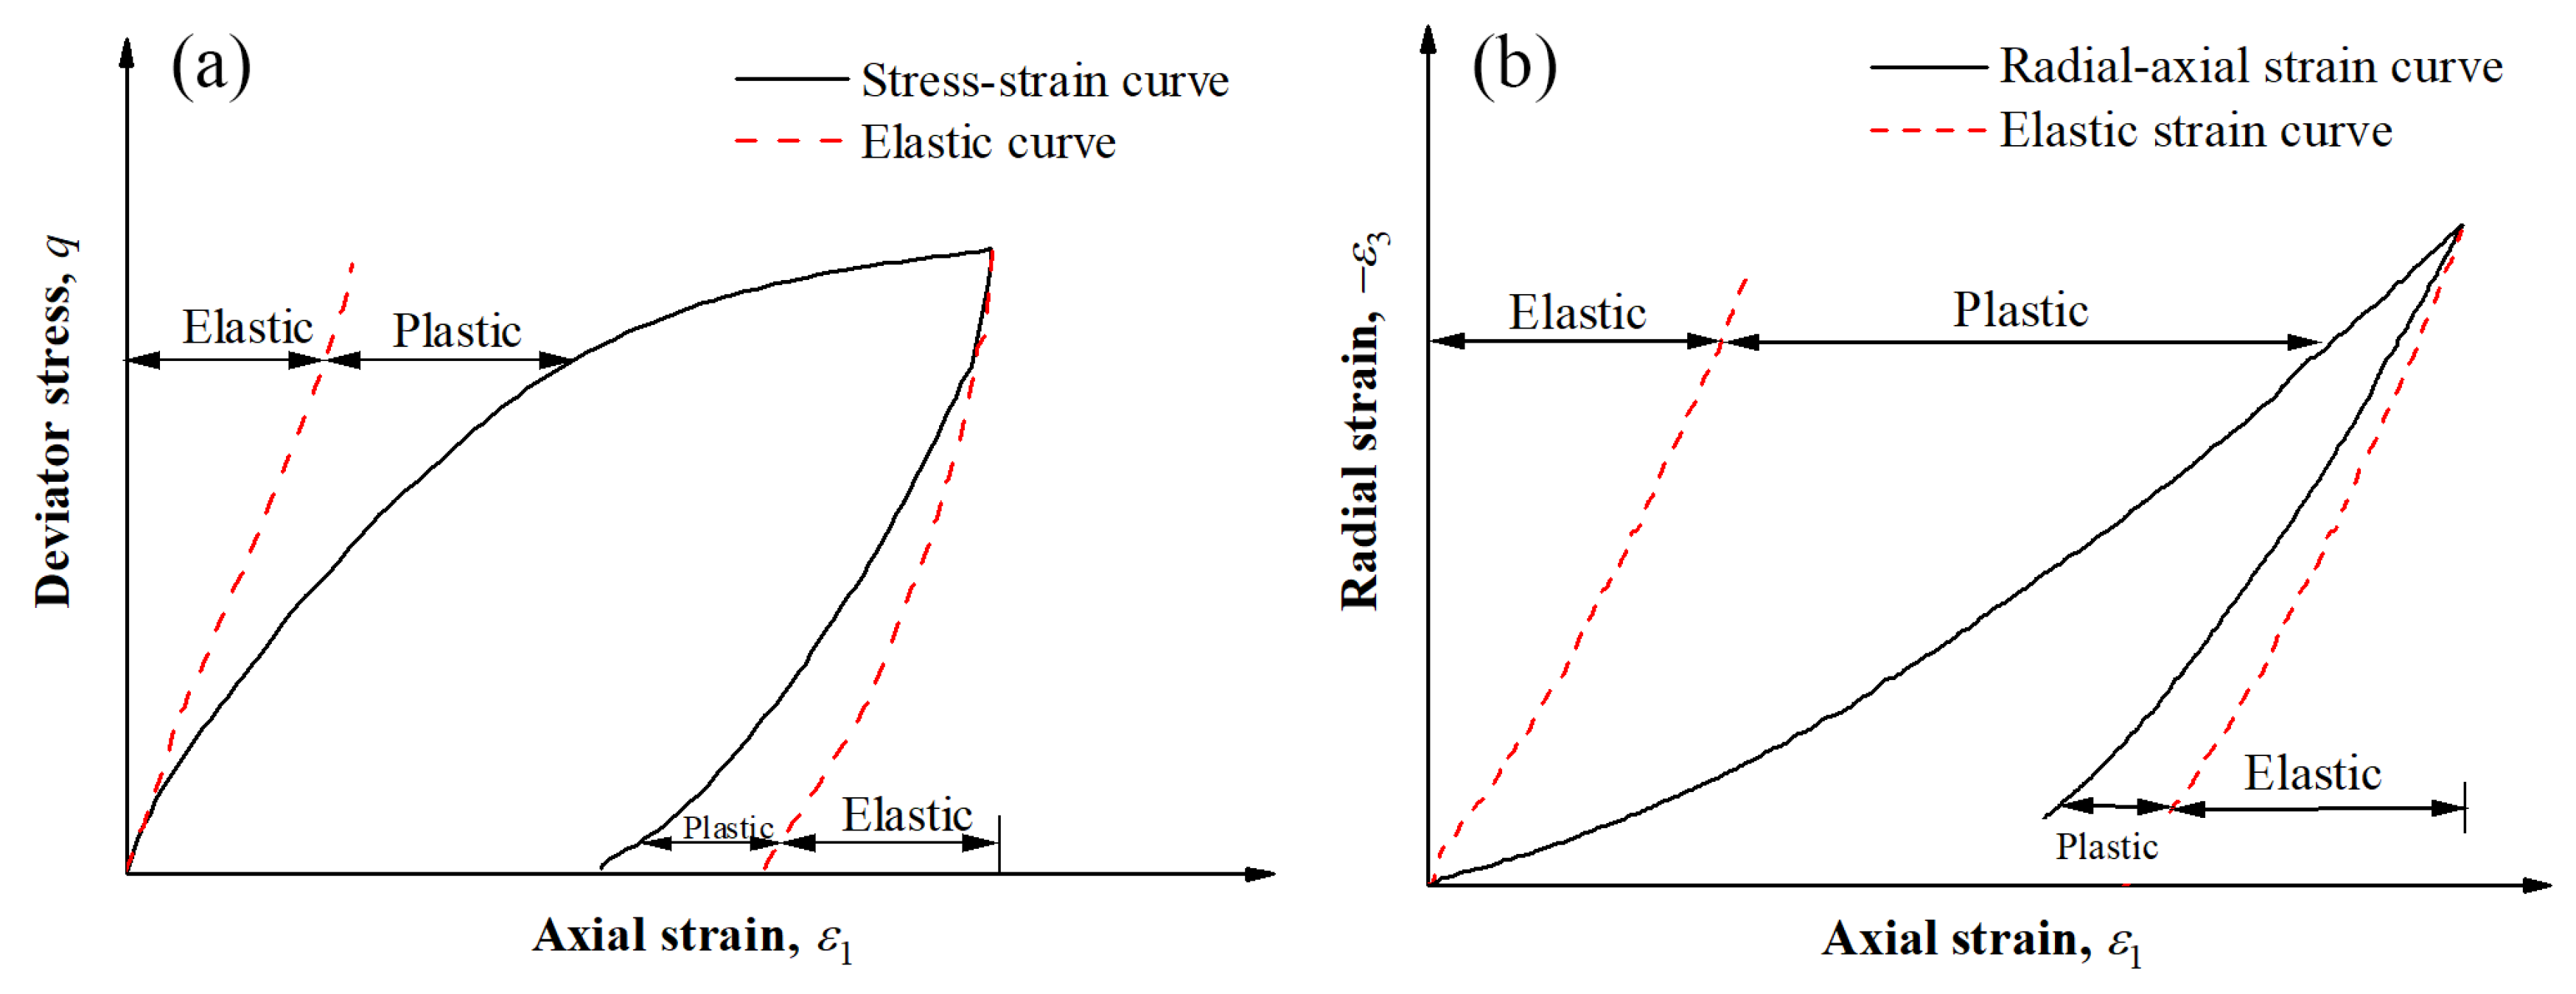
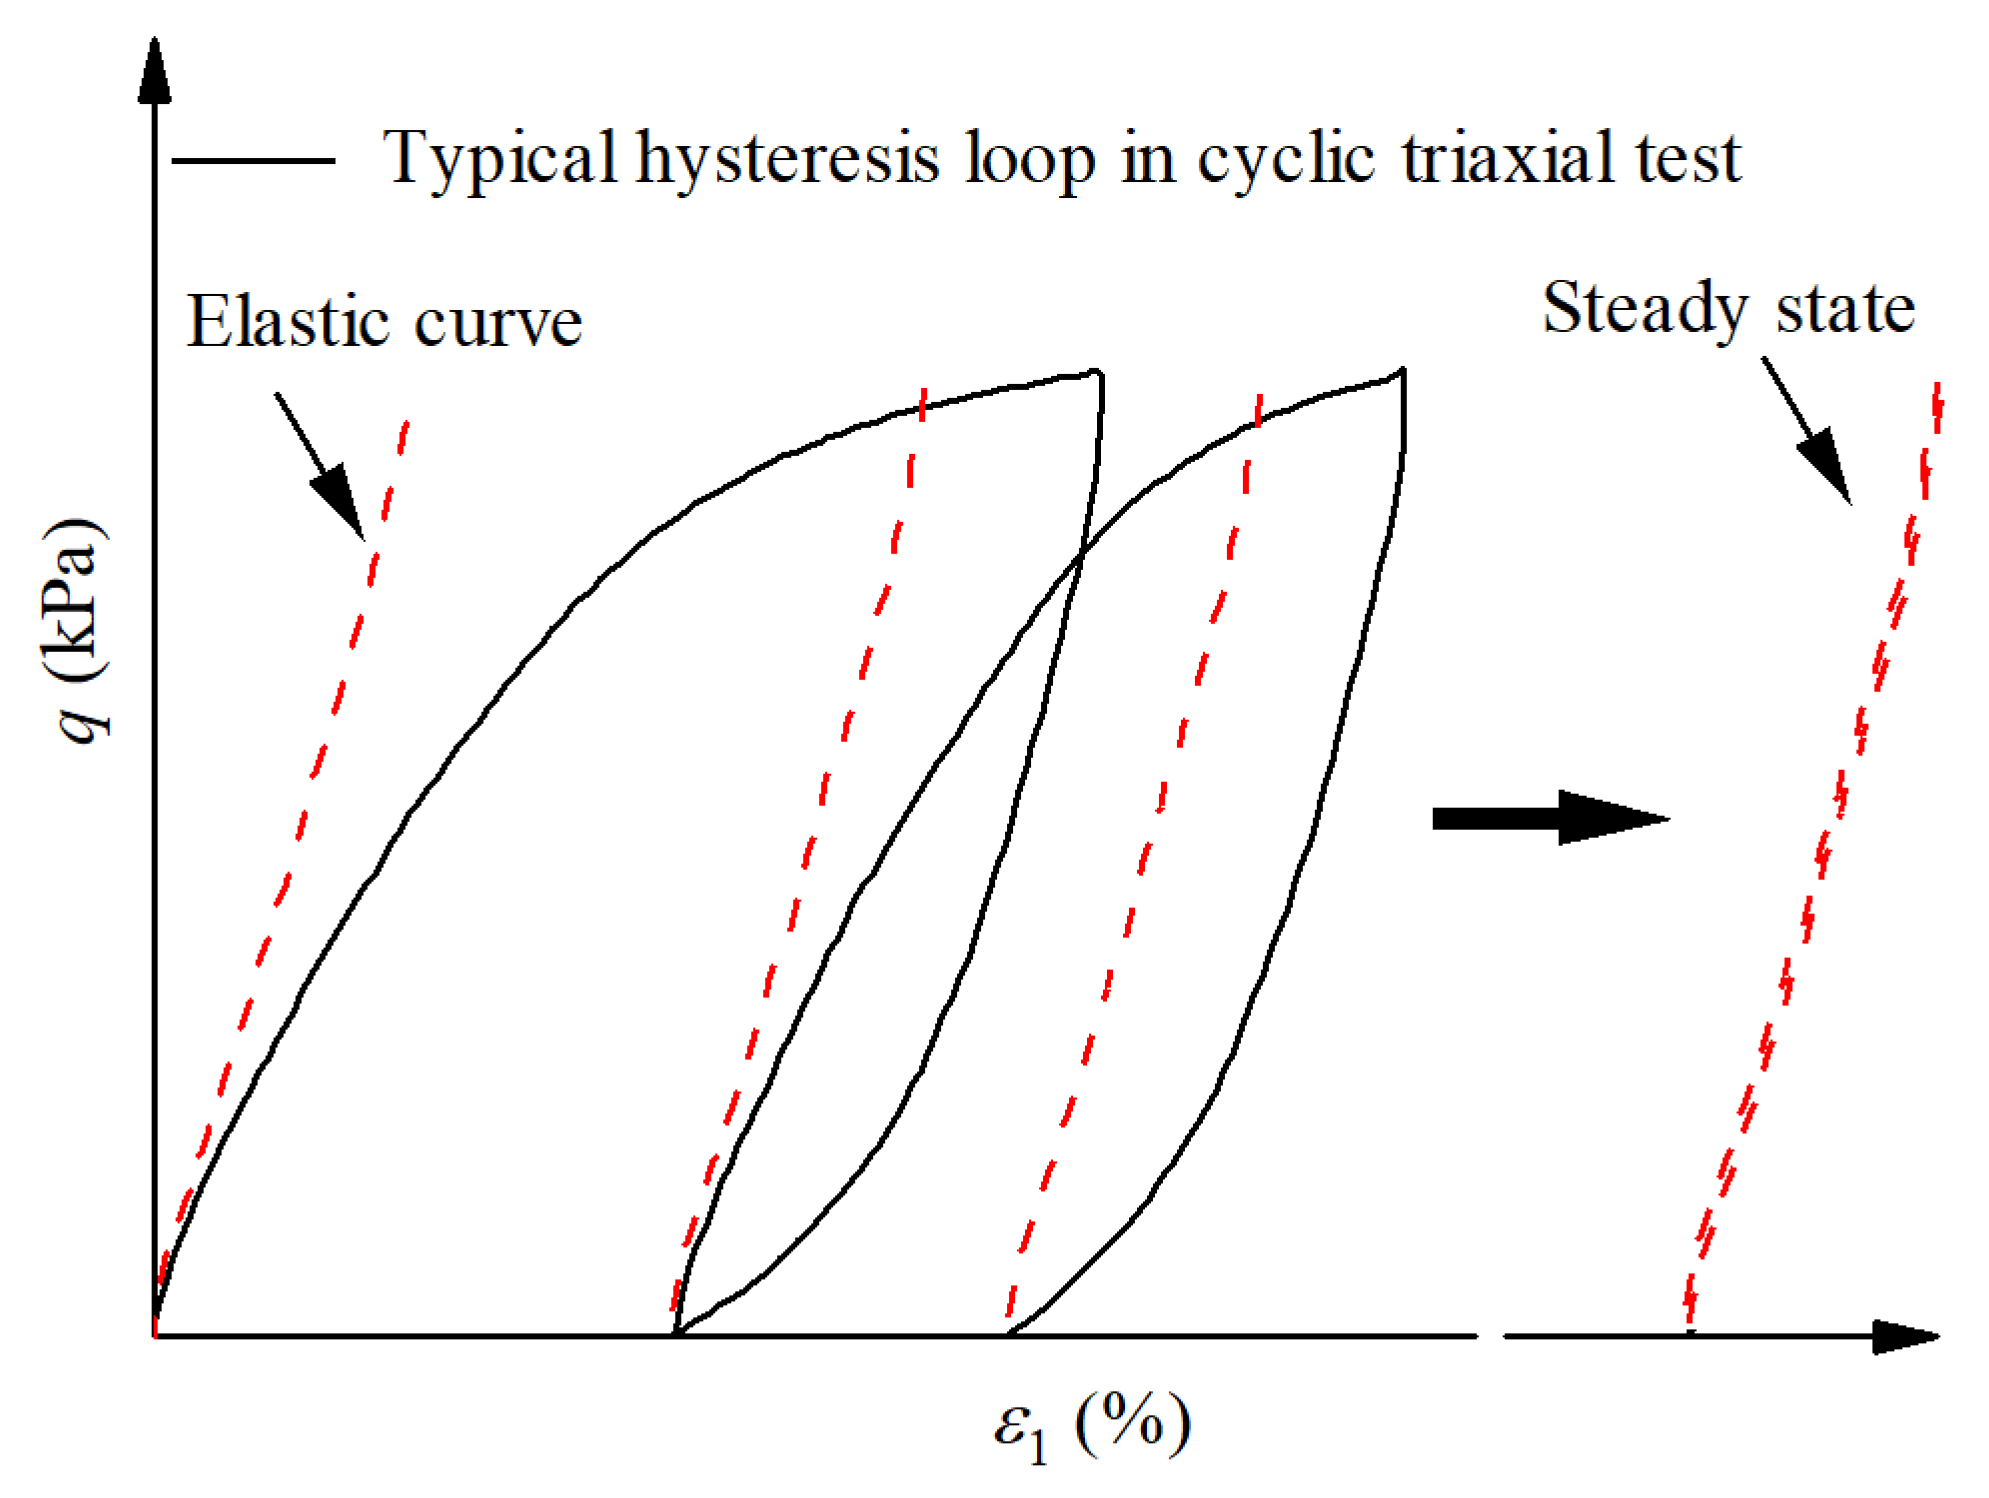
2.1. Determining the Elastic Curve

The elastic curve delineates the boundary between the elastic strain extension domain and the plastic strain extension domain at all stress levels (see Figure 1). The region between the elastic curve and the total stress–strain curve bounds the plastic stress–strain response. Therefore, it is significantly important to capture the elastic curve.
Determining the elastic curve is essential for obtaining the elastic response of the soil. Tatsuoka and Shibuya [26] showed that the deformation of geomaterials (soils) measured at strains smaller than about 0.001% is essentially strain-rate-independent and recoverable, i.e., elastic. Generally, it is assumed that the elastic domain exists at the strain below 0.001 % [26,27,28,29], which is acknowledged in a small strain regime. However, in large strain regime, the elastic domain continues to extend beyond the 0.001% limit during shearing, and it is also coupled with plastic strain. Elastic behavior in the extended elastic domain is usually characterized by the triaxial compression test, in which a single or multiple unload–reload cycles having small amplitudes of cyclic strain with the order of 10−5 or even 10−6 are applied at different stress or strain points [22,30,31,32,33]. However, this measurement cannot fully characterize the continuous nonlinear elastic behavior of the soil due to the limited stress points. Another commonly used method for testing elastic properties is dynamic testing. In the dynamic testing, the elastic properties can be evaluated by resonant column tests [34,35,36,37] or wave propagation tests [38,39,40], which often treat the test material as elastic and isotropic [41,42]. The dynamic testing generally measures the small strain elastic properties of low strain levels under the isotropic stress state, but direct application to the extended elastic domain is unreasonable. In this regard, within a large strain regime, an alternative quasi-elastic curve is obtained from the quasi-elastic domain to approximate the real elastic curve. The quasi-elasticity, rather than pure elasticity mentioned here, takes into account the energy dissipation in the nonzero area of the closed hysteresis loop. It is evidenced by experiments and numerical simulations [43,44,45,46] that the soil gradually exhibits elastic behavior under cyclic loading; therewith, the quasi-elastic domain can be obtained when the specimen reached a deformation steady state. In the deformation steady state, the stress–strain curve is a closed hysteretic loop showing the elastic behavior, and the shape of the hysteresis loop does not change dramatically in response to the subsequent stress cycles [46]. In this study, if the strain increment of two adjacent cycles is lower than 10−5 (the normal elastic strain limit), the specimen is considered to reach the deformation steady state, and the quasi-elastic curve is obtained. It is noted that the issue of whether this quasi-elastic curve can be directly regarded as the elastic curve mentioned above still needs further demonstration regarding the influence of cyclic stress history on the evolution of elastic behavior of sand.
Extensive studies have shown that soils show a gradual hardening behavior under cyclic loading. However, few studies have focused on the evolution of elastic behavior in cyclic loading. Karg and Haegeman [3] stated that the elastic properties of the soil remain almost constant during cyclic loading within the small strain regime. Xia, et al. [47] also draw a similar conclusion based on the periodic static triaxial test that the axial elastic strain increment within small strain regime is a constant in the subsequent stress cycles. Furthermore, Xia, et al. [48] experimentally compared the differences between the quasi-elastic curves obtained at different deformation steady states, showing that the quasi-elastic curves are not sensitive to the influence of cyclic stress history. Pradhan, et al. [49] directly assume that elasticity remains constant during cyclic loading based on simplification considerations. Similarly, the same assumption is made here, that the elastic behavior is independent of the loading cycles. Therefore, the quasi-elastic curve in the deformation steady state can be shifted to any stress cycle, as shown in Figure 2.

2.2. Decoupled Plastic Stress–Strain Curve

The total stress–strain relation is decoupled into elastic and plastic branches, as schematically shown in Figure 3. The elastic branch is obtained directly from the deformation steady state and remains unique. Thereafter, the plastic stress–strain relation is readily obtained by subtracting from the total stress–strain relation. It should be noted that the plastic branch in different cycles is different depending on the hardening behavior. The elastic and plastic parameters are employed to describe the elastic and plastic strain increments, respectively. Elastic parameters are the (axial) elastic modulus E and strain ratio v (different from Poisson’s ratio); plastic parameters are (axial) plastic modulus Ep and plastic strain ratio vp. They are defined as the tangent slope of the corresponding curves, as shown in Figure 3. Besides, elastic bulk modulus K and plastic bulk modulus Kp are used in isotropic cyclic loading conditions.

2.3. Implementation Procedures of Decoupling Method

Figure 4 shows the procedures of the decoupling method. Axial incremental strain ∆ε is the sum of the elastic strain increment ∆εe and plastic strain increment ∆εp. The first step is to obtain the alternative quasi-elastic curve from the deformation steady state. The alternative elastic strain increment at the deformation steady state is denoted as (∆εe)′ for each stress increment. Then, shift the quasi-elastic curve to the origin of each cycle. ∆εe is approximated at each stress level by (∆εe)′. The corresponding plastic strain can be calculated as ∆εp = ∆ε − (∆εe)′. The separated elastic and plastic strain increments are then expressed as the function of elastic and plastic parameters. Immediately, total strains can be achieved by integrating the elastic and plastic parameters over the input stress history. Finally, evolution prediction of hysteresis behavior of sand under cyclic loading is reproduced by combining all the branches. This data iteration process can be implemented easily through Excel. The following sections demonstrate the effectiveness of the decoupling method considering different cyclic loading conditions.

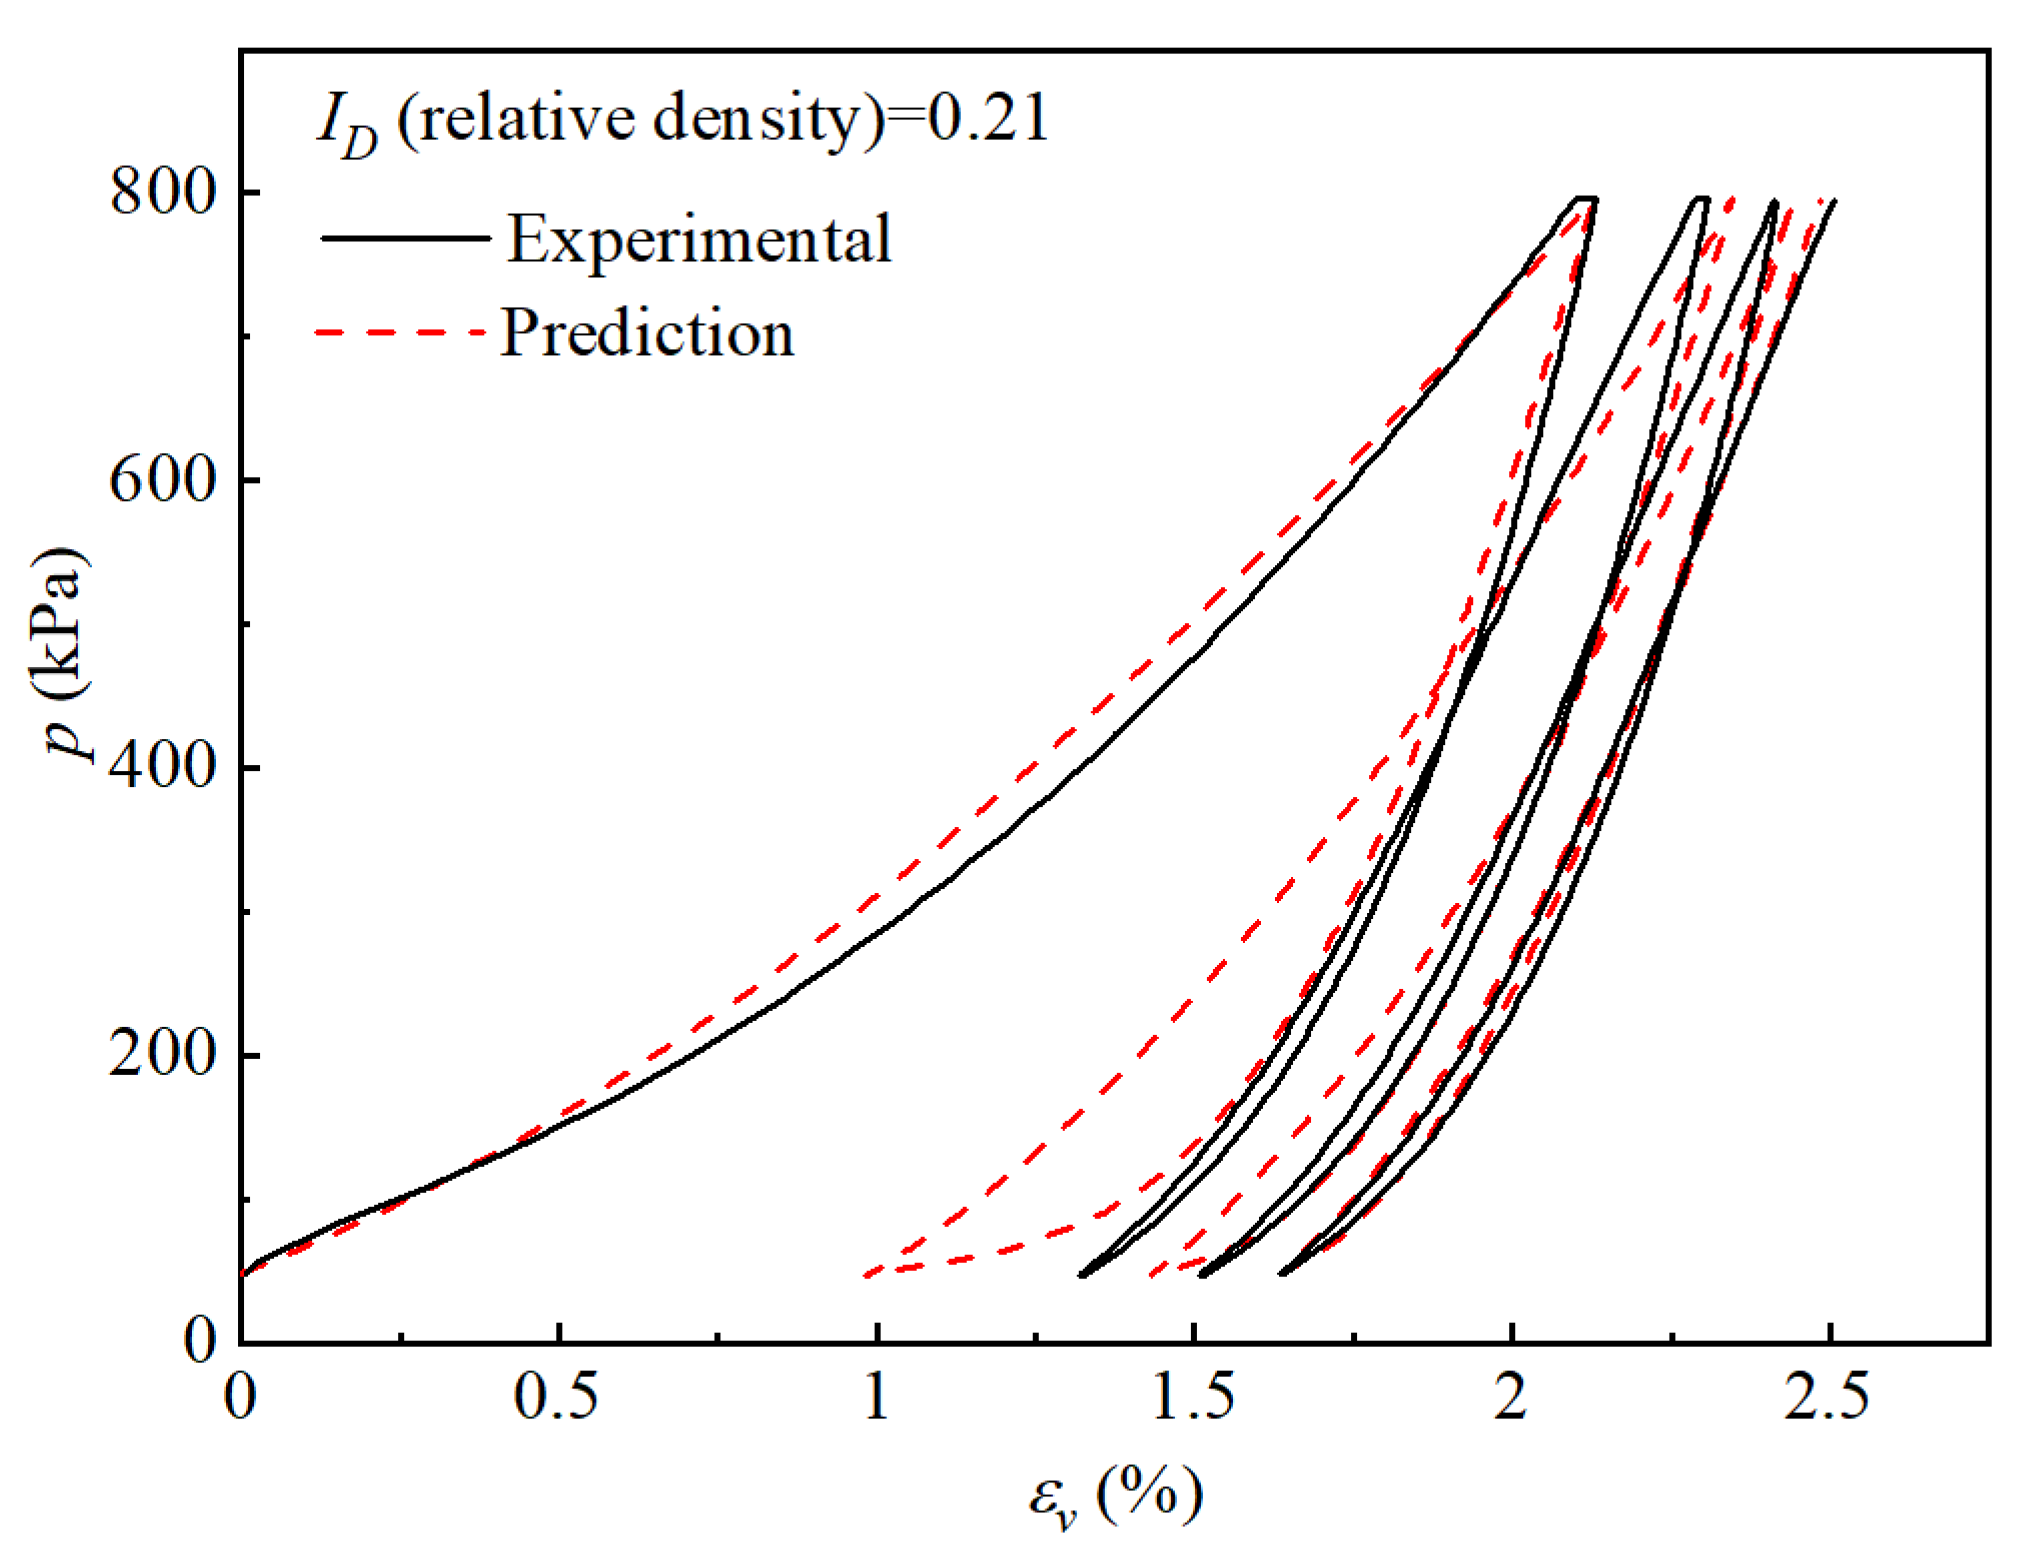
3. Application in the Cyclic Triaxial Test (CTT)

3.1. Elastic Parameters E and v

Due to the difficulty in reaching a complete elastic state, many alternative elastic parameters are defined to approximate the elastic properties [46]. To quantify soil deformation, an accurate description of E and its dependence on influencing factors is necessary. An empirical formulation for this dependent relation is an effective way and is widely used. Some researchers [50,51,52] have studied E and proposed different empirical formulations for its dependency on influencing factors. Generally, it is believed that E, defined for major elastic principal strain increments in a certain direction, is a unique function of the normal stress in that direction [22,32,53,54].
In this study, a new representation of E is used to formulate the elastic stress–strain relation in standard triaxial (axisymmetric) stress conditions, which is formulated from the deformation steady state [47,55], as follows:
E p a = E 0 + α σ 1 p a
where E0 is a constant which is related to the initial state, σ1 is the axial stress, α is the material parameter, and pa is the atmospheric pressure. In comparison with E, the existing empirical formula on v is rare. It is believed that v is not a constant but increases with the stress level in the shear direction [32,56,57,58], sometimes even exceeding 0.5 [56,58]. It is observed that the strain ratio increases linearly with the deviatoric stress in the deformation steady state [59], which is composed of two parts, as follows:
ν = ν 0 + β q p a
where v0 is the initial strain ratio, β is the coefficient, and q = σ1σ3 is deviatoric stress. The initial strain ratio was determined by confining pressure and initial void ratio, while the incremental part is related to deviatoric stress. Thus, four elastic parameters can be obtained from the deformation steady state.

3.2. Plastic Parameters Ep and vp

As important as elastic parameters, both Ep and vp play key roles in accurately describing plastic responses. According to the decoupled plastic branches, in standard triaxial stress condition, Ep in reloading can be expressed as [55]:
E p h ( N ) = b ( q q u ) ,   h ( N ) = exp ( δ N )
where qu is reloading ultimate deviatoric stress, b (<0) is reloading coefficient, h(N) is the reloading plastic modulus hardening function in which δ is a constant and N is the number of cycles. On the other hand, although the plastic behavior in the reloading is different from that in the unloading, the plastic modulus changes linearly with the deviator stress, that is, it decreases linearly in the reloading and increases linearly in unloading, but corresponds to different parameters, as follows:
E p h ( N ) = b ( q q u ) ,   h ( N ) = exp ( δ N )
where qu′ is unloading ultimate deviatoric stress, b′(>0) is the unloading coefficient, and h′(N) is the unloading plastic modulus hardening function in which δ′ is a constant. The existing study on vp is limited. By definition, the plastic strain ratio is calculated by plastic strains. Generally, in continuum mechanics, it is assumed that the plastic volume is incompressible, and the corresponding vp is a constant of 0.5 [60]. However, this is not accurate for porous materials, because the plastic deformation is mainly due to the changes in the relative position between the particles, which will inevitably cause changes in the void volume; consequently, vp of porous materials is not constant. Few studies have reported vp of microporous metallic foams; however, vp of granular materials (soils) has not been reported. In this paper, in standard triaxial stress condition, the empirically formulated vp in reloading is expressed as follows:
ν p g ( N ) = μ + ( ν 0 , p μ ) e λ q p r e f ,   g ( N ) = exp ( ω N )
where v0,p is the initial plastic strain ratio in reloading and pref is the reference pressure (in this paper pref = 1 kPa), μ, ω, and λ are constants, and g(N) is the plastic strain ratio hardening function in reloading. Moreover, the plastic strain ratio in unloading is expressed by the same formulation, as follows:
ν p g ( N ) = μ + ( ν 0 , p μ ) e λ q p r e f ,   g ( N ) = exp ( ω N )
where v0,p′ is the initial plastic strain ratio in unloading, μ′, ω′, and λ′ are constants, and g(N)′ is the plastic strain ratio hardening function in unloading.

3.3. Simulation

By combining Equations (1), (3) and (4), the axial stress–strain relations are reproduced, and the radial–axial strain relation is reproduced by combining Equations (2), (5) and (6). The empirical model parameters are calibrated through the Solver module in Excel, where the solution iteration method is a nonlinear GRG. The details of the experimental results selected can be found in [46]. The simulations and experimental results are shown in Figure 5. The predictions are consistent with the experiments, indicating that the decoupling method is effective in describing the hysteretic behavior under cyclic triaxial stress conditions. The constants of the empirical model are shown in Table 1.

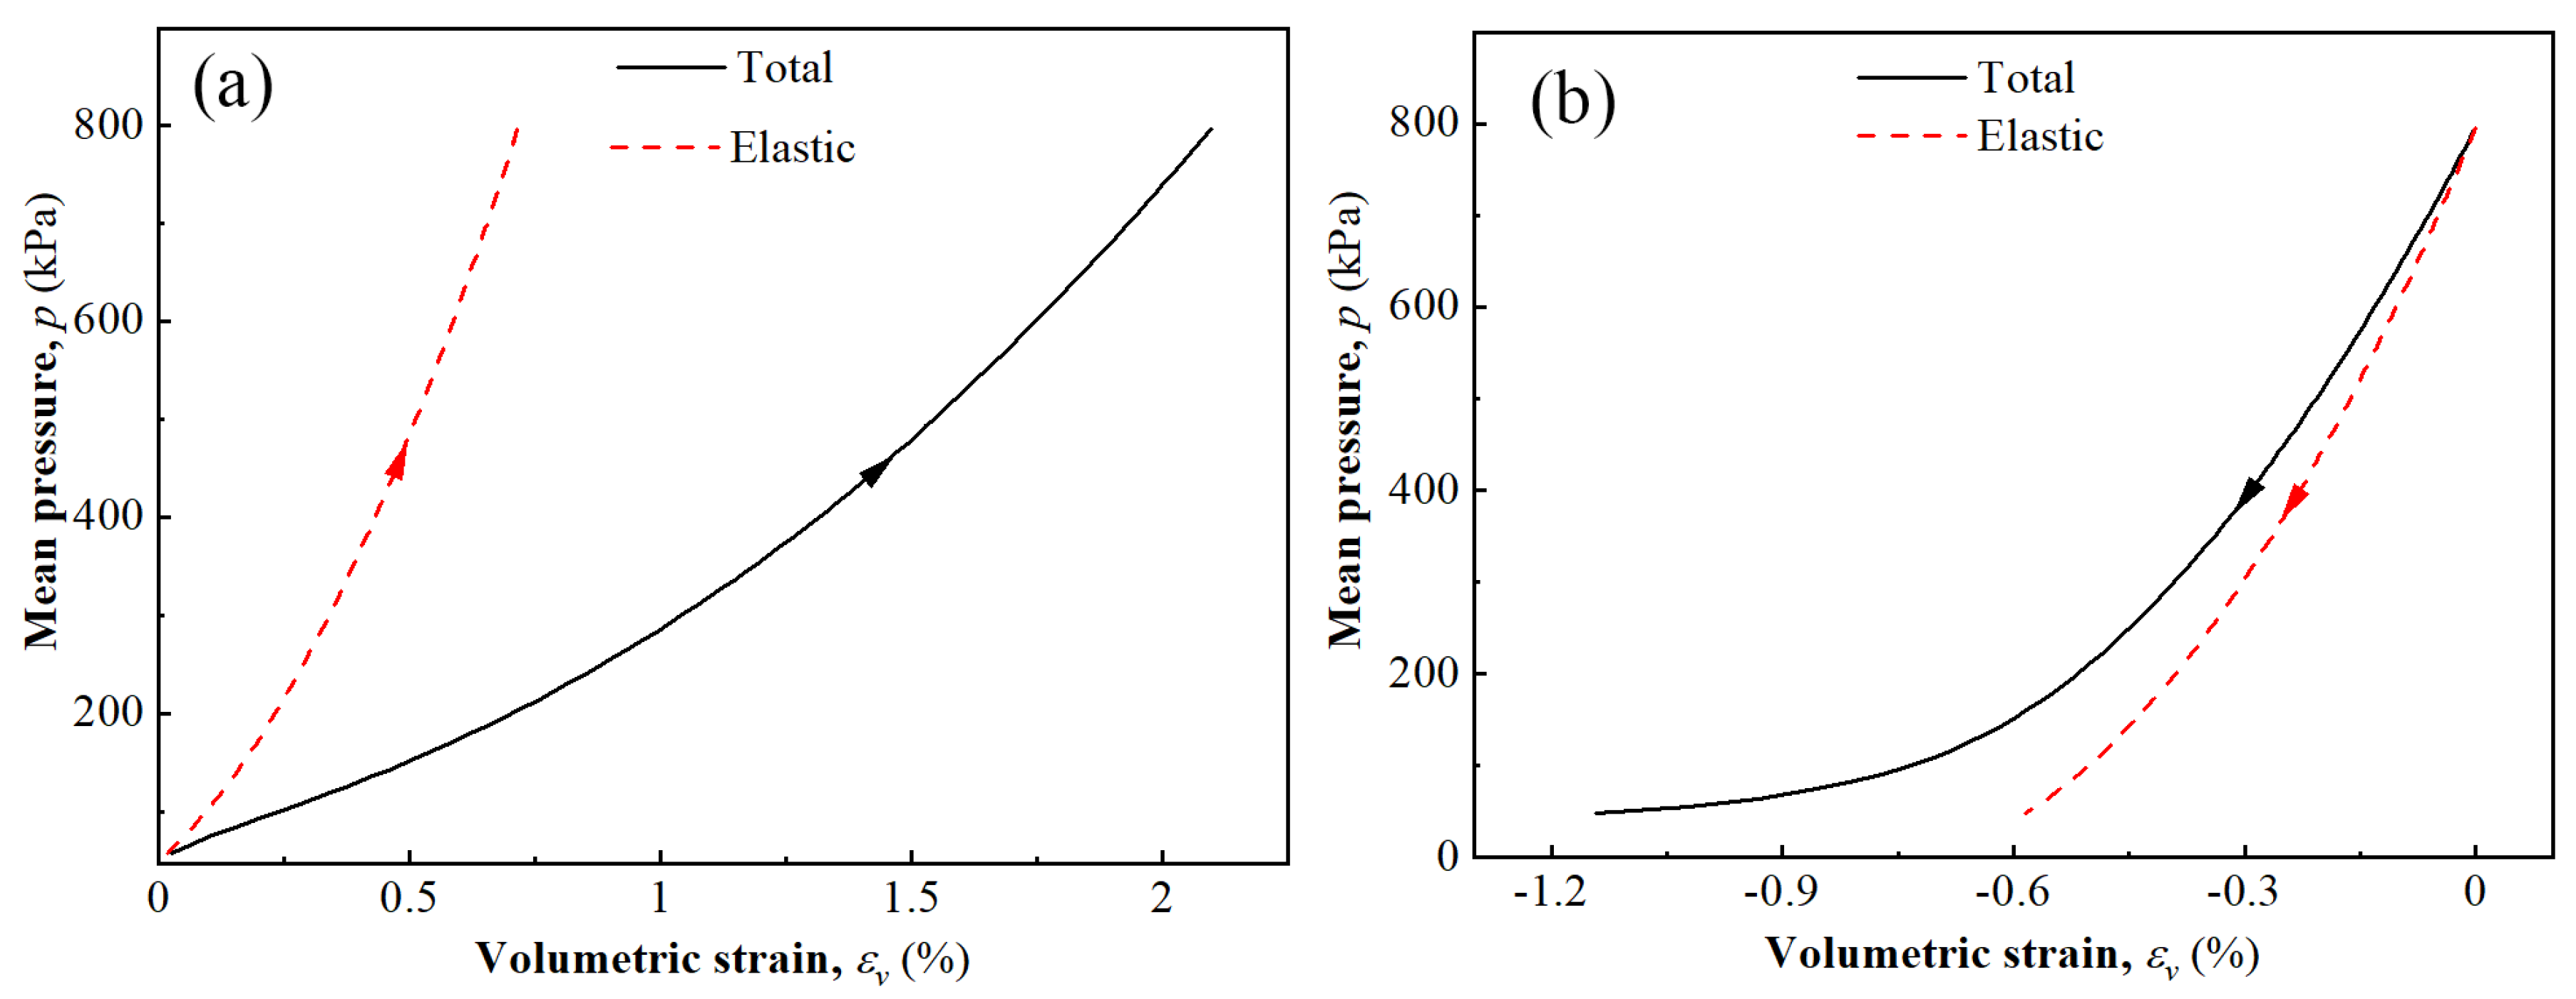
4. Application in the Cyclic Isotropic Compression Test (CICT)

Isotropic compression tests are also very common, providing a continuous relation between deformation modulus (bulk modulus) and pressure (confining pressure). In the cyclic isotropic compression test (CICT), the hysteresis loops indicate that, in both reloading and unloading, the deformation is a coupling of elastic and plastic components, as shown in Figure 6. The elastic and plastic components are calculated using the elastic bulk modulus K and plastic bulk modulus Kp, respectively. Additionally, the K is obtained from the elastic curve corresponding to the tangent slope of the elastic branch at the deformation steady state, while the Kp is obtained from the decoupled plastic stress–strain curve corresponding to the tangent slope of the plastic branch. To present the performance of this decoupling method in describing the hysteresis response during the CICT, the empirical formulas for K and Kp need to be formulated first.
Researchers have proposed some empirical formulas for volumetric stiffness. For example, Qubain, et al. [61] proposed a quasi-linear elastic constitutive model to describe the behavior of sand well below failure based on isotropic compression tests. García and Medina [62] performed detailed simulations of stress–strain relations in unconsolidated granular packs under unload–reload cycles, in which the power function was used to describe the bulk elastic modulus which scales with pressure with a 1/2 power law exponent in the limited cycle (i.e., deformation steady state). Figure 7a shows the variation of K with pressure, where (K/pa)2 changes linearly with mean pressure. Therefore, K is expressed as:
K p a = ( ϕ + φ p p a ) 1 2
where p is mean pressure (p = 1/3(σ1 + 2σ3)), and σ1, σ1, and σ3 are principal stresses. In the isotropic compression test, p = σ1 = σ2 = σ3 holds. ϕ and φ are constants. The details of the experiment for the cyclic isotropic compression test are presented in [63].
On the other hand, the decoupled bulk plastic modulus is expressed as:
K p h ( N ) p a = ( ψ + ξ p p a ) 1 2
where ψ and ξ are reloading bulk constants. Similarly, the bulk plastic modulus in unloading is expressed as:
K p h ( N ) p a = ( ψ + ξ p p a ) 1 2
where ψ′ and ξ′ are unloading bulk constants. The variation of bulk plastic modulus with pressure is plotted in Figure 7b. By combining Equations (8) and (9), the prediction is presented in Figure 8, which is consistent with the experimental results. The constants of the empirical model are shown in Table 2. Note that the large deviation has occurred during the final phase of the first unloading cycle, where the prediction highly underestimates the experiment. The possible reason is that the unloading empirical model has large errors at low stress levels in the primary unloading, resulting in smaller unloading strain. However, this deviation gradually weakens with increasing cycle number, indicating that the unloading empirical model also couples with the effect of cyclic stress history.

5. Application in Cyclic Oedometric Compression Tests (COCT)

The oedometric compression test can be regarded as a special triaxial test in which the confining pressure is variable in proportion to the axial stress. The elastic and plastic moduli presented in triaxial stress conditions are employed herein. Note that the axial plastic modulus includes the influence of the confining pressure but is expressed by the axial stress, as follows:
E p h ( N ) p a = b 1 ( σ 1 p a ) n b 2 ( σ 1 p a ) n + 1
where b1, b2, and n are the reloading constants, and b1′, b2′, and n′ are the unloading constants. The performance of the empirical formulas in the oedometric compression test is shown in Figure 9, indicating that the decoupling method is also effective in describing the hysteretic behavior under cyclic oedometric compression stress condition. The details of the experiment for the cyclic oedometric compression test are presented in [47]. The constants of the empirical model are shown in Table 3.

6. Limitations of the Decoupling Method

Although this decoupling method abandons the yield surface as the study object and can accurately describe the strains in each cycle, there are still some limitations. It can be seen from the above verification cases that the decoupling method is suitable for a single changing stress condition (here, the axial direction), such as in CTT, but the prediction results do not match well with the experimental results in the cases with changing multi-directional stress. The possible reason is that the empirical formulas established for the elastic and plastic parameters are not the most effective. Therefore, the deviation of prediction is closely related to the determination of the quasi-elastic curve, as well as the empirical formulas of elastic and plastic parameters for each branch. Considering more complex cyclic loading patterns is necessary to further verify the effectiveness of the decoupling method in the future.

7. Implications of This Work

By the decoupling method, the evolution of plastic strain with stress level and stress history is directly presented, which has implications for the development of elastic–plastic theory in assuming the hardening laws for soils. The descriptions of the hysteresis process can also facilitate the understanding of the soil shakedown limit analysis. Generally, the most likely cyclic stress is selected as the plastic shakedown limit by observing the trend of permanent strain accumulation, during which the reference and judgment criteria for selection are extremely important. At present, the reference or judgment criteria are empirical and variable, which is inseparable from the fact that researchers only focus on the final result of the permanent strain accumulation and ignore the mechanical response during the shakedown process in cyclic loading. Due to the lack of understanding of the evolution of the plastic mechanical behaviors with stress cycles, the mechanical properties of the hysteresis response or shakedown process cannot be revealed, in essence, which in turn leads to the lack of a unified and effective criterion when evaluating the plastic shakedown limit. With the decoupling method presented in this study, research on this topic has more possibilities. Nevertheless, further verification work is needed.

8. Conclusions

In this study, a decoupling method for describing the hysteresis response of sand is proposed, in which the elastic and plastic strain components are directly decoupled by the boundary between the elastic strain extension domain and the plastic strain extension domain. This boundary can be obtained directly in a deformation steady state. From the performance in three application cases, the decoupling method is generally effective in describing the hysteretic behavior under cyclic loading. However, the deviation of prediction is closely related to the determination of the quasi-elastic curve, as well as the empirical formulas of elastic and plastic parameters for each branch. Considering more complex cyclic loading patterns is necessary to further verify the effectiveness of the decoupling method in the future.

Author Contributions

Data curation, P.X.; Formal analysis, W.D. and C.Z.; Investigation, P.X. and W.D.; Methodology, P.X. and L.S.; Project administration, L.S. and W.D.; Resources, W.D. and L.S.; Supervision, L.S.; Writing—original draft, P.X., W.D. and C.Z.; Writing—review & editing, P.X. All authors have read and agreed to the published version of the manuscript.

Funding

This research was funded by [National Natural Science Foundation of China] grant number [50527803]. And The APC was funded by [Distinguished Professorship of Jiangsu Province] grant number [1105000492].

Institutional Review Board Statement

Not applicable.

Informed Consent Statement

Not applicable.

Data Availability Statement

The cyclic loading test data used to support the findings of this study are available from the corresponding author upon reasonable request.

Acknowledgments

The authors thank three anonymous reviewers for their constructive comments to improve the early version of this paper. P.X. and L.S. appreciate the sponsorship from the National Natural Science Foundation of China (No. 50527803). WD appreciate the support from the Distinguished Professorship of Jiangsu Province (Award number: 1105000492).

Conflicts of Interest

The authors declare no conflict of interest.

References

  1. Puech, A.; Garnier, J. Introduction to cyclic degradation. In Design of Piles under Cyclic Loading: SOLCYP Recommendations; ISTE Ltd: London, UK; John Wiley and Sons: Hoboken, NJ, USA, 2017; pp. 41–99. [Google Scholar]
  2. Lei, H.; Li, B.; Lu, H.; Ren, Q. Dynamic Deformation Behavior and Cyclic Degradation of Ultrasoft Soil under Cyclic Loading. J. Mater. Civ. Eng. 2016, 28, 04016135. [Google Scholar] [CrossRef]
  3. Karg, C.; Haegeman, W. Elasto-plastic long-term behavior of granular soils: Experimental investigation. Soil Dyn. Earthq. Eng. 2009, 29, 155–172. [Google Scholar] [CrossRef]
  4. Wichtmann, T.; Niemunis, A.; Triantafyllidis, T. Strain accumulation in sand due to cyclic loading: Drained triaxial tests. Soil Dyn. Earthq. Eng. 2005, 25, 967–979. [Google Scholar] [CrossRef]
  5. Da Fonseca, A.V.; Rios, S.; Amaral, M.F.; Panico, F. Fatigue Cyclic Tests on Artificially Cemented Soil. Geotech. Test. J. 2013, 36. [Google Scholar] [CrossRef] [Green Version]
  6. Vitali, O.P.M.; Nassim, M.; Khasawneh, Y. Cyclic and Monotonic Behavior of Onshore Wind Turbine Foundation Systems in Cohesionless Ground. In Proceedings of the Geo-Congress 2022, Charlotte, NC, USA, 20–23 March 2022; pp. 228–237. [Google Scholar] [CrossRef]
  7. Yang, Q.; Ren, Y.; Niu, J.; Cheng, K.; Hu, Y.; Wang, Y. Characteristics of soft marine clay under cyclic loading: A review. Bull. Eng. Geol. Environ. 2017, 77, 1027–1046. [Google Scholar] [CrossRef]
  8. Chen, W.F.; Han, D.J. Plasticity for Structural Engineers; J. Ross Publishing: Plantation, FL, USA, 2007. [Google Scholar]
  9. Yu, H.-S.; Khong, C.; Wang, J. A unified plasticity model for cyclic behaviour of clay and sand. Mech. Res. Commun. 2007, 34, 97–114. [Google Scholar] [CrossRef]
  10. Zhang, X.; Lytton, R.L. Modified state-surface approach to the study of unsaturated soil behavior. Part II: General formulation. Can. Geotech. J. 2009, 46, 553–570. [Google Scholar] [CrossRef]
  11. Zhang, X.; Lytton, R.L. Modified state-surface approach to the study of unsaturated soil behavior. Part I: Basic concept. Can. Geotech. J. 2009, 46, 536–552. [Google Scholar] [CrossRef]
  12. Iwan, W.D. On a Class of Models for the Yielding Behavior of Continuous and Composite Systems. J. Appl. Mech. 1967, 34, 612–617. [Google Scholar] [CrossRef]
  13. Mróz, Z. On the description of anisotropic workhardening. J. Mech. Phys. Solids 1967, 15, 163–175. [Google Scholar] [CrossRef]
  14. Maleki, M.; Cambou, B.; Dubujet, P. Development in modeling cyclic loading of sands based on kinematic hardening. Int. J. Numer. Anal. Methods Géoméch. 2009, 33, 1641–1658. [Google Scholar] [CrossRef]
  15. Oka, F.; Yashima, A.; Kato, M.; Sekiguchi, K. A constitutive model for sand based on the non-linear kinematic hardening rule and its application. In Proceedings of the 10th World Conference Earthquake Engineering, Madrid, Spain, 19–24 July 1992; pp. 2529–2534. [Google Scholar]
  16. Hashiguchi, K. Mechanical requirements and structures of cyclic plasticity models. Int. J. Plast. 1993, 9, 721–748. [Google Scholar] [CrossRef]
  17. Heidarzadeh, H.; Oliaei, M. Development of a generalized model using a new plastic modulus based on bounding surface plasticity. Acta Geotech. 2017, 13, 925–941. [Google Scholar] [CrossRef]
  18. Dafalias, Y.F.; Herrmann, L.R. Bounding Surface Plasticity. II: Application to Isotropic Cohesive Soils. J. Eng. Mech. 1986, 112, 1263–1291. [Google Scholar] [CrossRef]
  19. Bardet, J.P. Bounding Surface Plasticity Model for Sands. J. Eng. Mech. 1986, 112, 1198–1217. [Google Scholar] [CrossRef]
  20. Zienkiewicz, O.C.; Mroz, Z. Generalized plasticity formulation and applications to geomechanics. Mech. Eng. Mater. 1984, 44, 655–680. [Google Scholar]
  21. Ling, H.I.; Yang, S. Unified Sand Model Based on the Critical State and Generalized Plasticity. J. Eng. Mech. 2006, 132, 1380–1391. [Google Scholar] [CrossRef]
  22. Hardin, B.O.; Blandford, G.E. Elasticity of Particulate Materials. J. Geotech. Eng. 1989, 115, 788–805. [Google Scholar] [CrossRef]
  23. Hashiguchi, K. Subloading surface model in unconventional plasticity. Int. J. Solids Struct. 1989, 25, 917–945. [Google Scholar] [CrossRef]
  24. Sawicki, A.; Świdziński, W. Elastic moduli of non-cohesive particulate materials. Powder Technol. 1998, 96, 24–32. [Google Scholar] [CrossRef]
  25. Niemunis, A.; Wichtmann, T.; Triantafyllidis, T. A high-cycle accumulation model for sand. Comput. Geotech. 2005, 32, 245–263. [Google Scholar] [CrossRef]
  26. Tatsuoka, F.; Shibuya, S. Deformation characteristics of soils and rocks from field and laboratory tests. In Proceedings of the 9th Asian Regional Conference on Soil Mechanics and Foundation Engineering, Bangkok, Thaliland, 9–13 December 1992; pp. 101–170. [Google Scholar]
  27. Gu, X.; Yang, J.; Huang, M. Laboratory measurements of small strain properties of dry sands by bender element. Soils Found. 2013, 53, 735–745. [Google Scholar] [CrossRef]
  28. Cuccovillo, T.; Coop, M.R. Yielding and pre-failure deformation of structured sands. Geotechnique 1997, 47, 491–508. [Google Scholar] [CrossRef]
  29. Tatsuoka, F.; Jardine, R.J.; Presti, D.L.; Benedetto, H.D.; Kodaka, T. Characterising the pre-failure deformation properties of geomaterials. In Proceedings of the Fourteenth International Conference on Soil Mechanics and Foundation Engineering, Hamburg, Germany, 6–12 September 1997; Balkema, A.A., Ed.; The National Academies of Sciences, Engineering, and Medicine: Washington, DC, USA, 1997; pp. 1–36. [Google Scholar]
  30. Ezaoui, A.; Benedetto, H. Experimental measurements of the global anisotropic elastic behaviour of dry Hostun sand during triaxial tests, and effect of sample preparation. Géotechnique 2009, 59, 621–635. [Google Scholar] [CrossRef]
  31. Gu, X.; Yang, J.; Huang, M. DEM simulations of the small strain stiffness of granular soils: Effect of stress ratio. Granul. Matter 2013, 15, 287–298. [Google Scholar] [CrossRef]
  32. Hoque, E.; Tatsuoka, F. Anisotropy in Elastic Deformation of Granular Materials. Soils Found. 1998, 38, 163–179. [Google Scholar] [CrossRef] [Green Version]
  33. Hoque, E.; Tatsuoka, F. Effects of stress ratio on small-strain stiffness during triaxial shearing. Géotechnique 2004, 54, 429–440. [Google Scholar] [CrossRef]
  34. Chen, Y.-C.; Ishibashi, I.; Jenkins, J.T. Dynamic shear modulus and fabric: Part I, depositional and induced anisotropy. Géotechnique 1988, 38, 25–32. [Google Scholar] [CrossRef]
  35. Drnevich, V.; Hardin, B.; Shippy, D. Modulus and damping of soils by the resonant-column method. In Dynamic Geotechnical Testing; ASTM International: West Conshohocken, PA, USA, 1978. [Google Scholar] [CrossRef]
  36. Knodel, P.; Thomann, T.; Hryciw, R. Laboratory Measurement of Small Strain Shear Modulus Under K0 Conditions. Geotech. Test. J. 1990, 13, 97. [Google Scholar] [CrossRef]
  37. Yang, J.; Gu, X. Shear stiffness of granular material at small strains: Does it depend on grain size? Géotechnique 2013, 63, 165–179. [Google Scholar] [CrossRef] [Green Version]
  38. Bellotti, R.; Jamiolkowski, M.; Presti, D.L.; O’Neill, D.A. Anisotropy of small strain stiffness in Ticino sand. Géotechnique 1996, 46, 115–131. [Google Scholar] [CrossRef]
  39. Jia, X.; Caroli, C.; Velicky, B. Ultrasound Propagation in Externally Stressed Granular Media. Phys. Rev. Lett. 1999, 82, 1863–1866. [Google Scholar] [CrossRef] [Green Version]
  40. Sharifipour, M.; Dano, C.; Hicher, P.-Y. Wave velocities in assemblies of glass beads using bender-extender elements. In Proceedings of the 17th ASCE Engineering Mechanics Conference, Newark, NJ, USA, 13–16 June 2004; pp. 1–8. [Google Scholar]
  41. Hicher, P.Y. Elastic properties of soils. J. Geotech. Eng. 1996, 122, 641–648. [Google Scholar] [CrossRef]
  42. Xia, P.; Shao, L.; Deng, W. Mechanism study of the evolution of quasi-elasticity of granular soil during cyclic loading. Granul. Matter 2021, 23, 84. [Google Scholar] [CrossRef]
  43. Chen, C.; Indraratna, B.; McDowell, G.; Rujikiatkamjorn, C. Discrete element modelling of lateral displacement of a granular assembly under cyclic loading. Comput. Geotech. 2015, 69, 474–484. [Google Scholar] [CrossRef]
  44. Indraratna, B.; Thakur, P.K.; Vinod, J.S. Experimental and Numerical Study of Railway Ballast Behavior under Cyclic Loading. Int. J. Géoméch. 2010, 10, 136–144. [Google Scholar] [CrossRef]
  45. Nguyen, N.-S.; François, S.; Degrande, G. Discrete modeling of strain accumulation in granular soils under low amplitude cyclic loading. Comput. Geotech. 2014, 62, 232–243. [Google Scholar] [CrossRef]
  46. Zeng, F.; Shao, L. Unloading Elastic Behavior of Sand in Cyclic Triaxial Tests. Geotech. Test. J. 2016, 39, 20150171. [Google Scholar] [CrossRef]
  47. Xia, P.; Zeng, C.; Shao, L.; Zhang, X.; Guo, X. Axial component of plastic modulus of sand under slow periodic load. J. GeoEng. 2021, 16, 47–59. [Google Scholar] [CrossRef]
  48. Xia, P.; Deng, W.; Shao, L.; Zhang, X. Role of elastic upper limit in shakedown study for granular soils. Transp. Geotech. 2022, 34, 100746. [Google Scholar] [CrossRef]
  49. Pradhan, T.B.; Tatsuoka, F.; Sato, Y. Experimental Stress-Dilatancy Relations of Sand Subjected to Cyclic Loading. Soils Found. 1989, 29, 45–64. [Google Scholar] [CrossRef] [Green Version]
  50. Hicher, P.; El Hosri, M.; Homsi, M. Cyclic Properties of Soils Within a Large Range of Strain Amplitude. Soils Found. 1987, 365–378. [Google Scholar] [CrossRef]
  51. Sharma, S.S.; Fahey, M. Degradation of Stiffness of Cemented Calcareous Soil in Cyclic Triaxial Tests. J. Geotech. Geoenvironmental Eng. 2003, 129, 619–629. [Google Scholar] [CrossRef]
  52. Pincus, H.; Tatsuoka, F.; Sato, T.; Park, C.-S.; Kim, Y.-S.; Mukabi, J.; Kohata, Y. Measurements of Elastic Properties of Geomaterials in Laboratory Compression Tests. Geotech. Test. J. 1994, 17, 80. [Google Scholar] [CrossRef]
  53. Chang, C.S. Compressibility for sand under one-dimensional loading condition. Proc. Settl. Geotech. Spec. Publiccation 1994, 1, 1298–1311. [Google Scholar]
  54. Hardin, B.O. The nature of stress-strain behavior for soils. In Proceedings of the ASCE Geotechnical Engineering Division Specialty Conference, Honolulu, HI, USA, 11–15 January 1978; pp. 3–90. [Google Scholar]
  55. Xia, P.; Zeng, C.; Shao, L.; Zhang, X. Axial strain accumulation projection model for sand in cyclic loading. Soil Dyn. Earthq. Eng. 2021, 147, 106819. [Google Scholar] [CrossRef]
  56. Sun, Y.; Shao, L.; Fan, Z. Experimental research on Poisson’s ratio of sandy soil. Rock Soil Mech. 2009, 30 (Suppl. S1), 433–438. [Google Scholar] [CrossRef]
  57. Zhao, Y.; Mahmood, N.S.; Coffman, R.A. Small-Strain and Large-Strain Modulus Measurements with a Consolidation Device. J. Test. Eval. 2018, 47. [Google Scholar] [CrossRef]
  58. Duncan, J.M.; Chang, C.Y. Nonlinear analysis of stress and strain in soils. J. Soil Mech. Found. Div. 1970, 96, 1629–1653. [Google Scholar] [CrossRef]
  59. Xia, P.; Shao, L.; Deng, W. Stress-state dependency of the strain ratio of quasi-elastic granular soils under cyclic loading. Geotechnique, 2021; under review. [Google Scholar]
  60. Liu, Z.; Wang, R.; Zhao, G. Plastic Poisson’s ratio and elastic-plastic Poisson’s ratio of material. J. Plast. Eng. 1999, 6, 26–29. [Google Scholar]
  61. Qubain, B.S.; Kaliakin, V.N.; Martin, J.P. Variable bulk modulus constitutive model for sand. J. Geotech. Geoenviron. Eng. 2003, 129, 158–162. [Google Scholar] [CrossRef]
  62. García, X.; Medina, E. Hysteresis effects studied by numerical simulations: Cyclic loading-unloading of a realistic sand model. GEOPHYSICS 2006, 71, F13–F20. [Google Scholar] [CrossRef]
  63. Wichtmann, T.; Triantafyllidis, T. An experimental database for the development, calibration and verification of constitutive models for sand with focus to cyclic loading: Part II—Tests with strain cycles and combined loading. Acta Geotech. 2016, 11, 763–774. [Google Scholar] [CrossRef]
Figure 1. Sketch of the elastic strain extension domain and plastic strain extension domain during one cycle in (a) stress–strain relation and (b) radial–axial strain relation.
Processes 10 00879 g001
Figure 2. Sketch of determining elastic curve for each stress cycle.
Processes 10 00879 g002
Figure 3. Elastic and plastic branches in (a) reloading stress–strain curves, (b) unloading stress–strain curves, (c) reloading radial–axial strain curves, and (d) unloading radial–axial strain curves.
Processes 10 00879 g003
Figure 4. Flow chart of the decoupling method.
Processes 10 00879 g004
Figure 5. Comparison of prediction with experimental results of silica powder in the cyclic triaxial test (a) and (b): the stress–strain relations, (c) and (d): the radial–axial strain relations.
Processes 10 00879 g005
Figure 6. Sketch of the branches in mean pressure–volumetric strain curves in (a) reloading and (b) unloading in the CICT.
Processes 10 00879 g006
Figure 7. Pressure dependency of (a) bulk elastic modulus and (b) bulk plastic modulus.
Processes 10 00879 g007
Figure 8. Comparison of prediction with experimental results of Karlsruhe fine sand in the cyclic isotropic compression test.
Processes 10 00879 g008
Figure 9. Comparison of prediction with experimental results of silica sand in a cyclic oedometric compression test.
Processes 10 00879 g009
Table 1. Parameters for empirical formulations in CTT.
CTTParameter E 0 α υ 0 β b / b q u / q u
Value33.82.50.350.016−4.9/15.2310/3.2
Parameter δ / δ μ / μ υ 0 , p / υ 0 , p λ / λ ω / ω
Value0.24/0.130.13/0.020.17/0.320.001/0.154.8/12
Table 2. Parameters for empirical formulations in CICT.
CITCParameter ϕ φ ψ ξ δ / δ
Value231221494910.341.63/6.35
Table 3. Parameters for empirical formulations in COCT.
COCTParameter E 0 α b 1 / b 1 b 2 / b 2 n / n δ / δ
Value120328110/20000.6/100.01/0.010.3/0.3
Publisher’s Note: MDPI stays neutral with regard to jurisdictional claims in published maps and institutional affiliations.

