Article

Polyethylenimine/cGAMP Nanocomplexes for STING-Mediated Cancer Immunotherapy: Formulation and Characterization Using Orthogonal Techniques

1
Institute of Pharmaceutical Sciences of Western Switzerland (ISPSO), University of Geneva, 1 Rue Michel Servet, 1211 Geneva, Switzerland
2
Section of Pharmaceutical Sciences, University of Geneva, 1 Rue Michel Servet, 1211 Geneva, Switzerland
*
Author to whom correspondence should be addressed.
Processes 2022, 10(5), 882; https://doi.org/10.3390/pr10050882
Submission received: 7 March 2022 / Revised: 25 April 2022 / Accepted: 27 April 2022 / Published: 29 April 2022
(This article belongs to the Special Issue Design and Preparation of Pharmaceutical Formulation)

Abstract

:
Cyclic GMP-AMP (cGAMP) has lately been extensively investigated in cancer immunotherapy due its activation of the innate immunity stimulation of interferon genes (STING) pathway within antigen presenting cells (APC) leading to an increase in tumor specific CD8+ T cells. As negatively charged dinucleotides are prone to enzymatic degradation before being taken up by APC, there is a need for an appropriate carrier. Therefore, polyethylenimine (PEI), a gold standard for oligonucleotide delivery, was selected. Molecular weight, type of PEI and N/P ratio between PEI/cGAMP were investigated in terms of toxicity, efficacy and physicochemical properties of the nanocomplexes (NCs) such as size, zeta potential and shape. Due to lack of nano-medicine regulations and the need for a case-by case assessment, here we examine these parameters by several orthogonal methods, such as dynamic light scattering (DLS), nanoparticle tracking analysis (NTA) and online asymmetric flow field flow fractionation (AF4) connected to DLS. N/P ratio of 2/1 ratio using linear PEI 25 kDa resulted in larger, positively charged particles of elongated shape, which were shown to have the best toxicity/efficacy ratio among different PEIs and ratios tested.

Graphical Abstract

1. Introduction

Over the years, nanomaterials as drug delivery systems have attracted the attention of researchers and scientists, due to their ability to improve efficacy and reduce the toxicity of treatments, the possibility of targeted delivery of the drug within tissues and the cell cytosol (gene therapy), and the enhancement of drug stability and solubility [1]. Although the US Food and Drug Administration (FDA) has issued guidance for nanomaterials in food, cosmetics and animal food, only a draft guidance was issued for nanomedicine. Additionally, the FDA recommends a case-by-case evaluation of safety for each specific nanosystem [2]. Although nanocomplexes (NCs) are considered to be in the nano-size range of 1 to 100 nm [3], the size of the NCs can go up to several hundred nanometers if it is related to the NC’s therapeutic activity [1].
Cyclic GMP-AMP (cGAMP), a dinucleotide, is a ligand of the innate immunity stimulation of interferon gene (STING) pathway [4]. This pathway is present in all cells and is activated by cytosolic dsDNA (microbial or tumor) [5]. Recently, cGAMP has been widely investigated for the purpose of cancer immunotherapy, where the targeted antigen presenting cells (APC) will, upon presence of cGAMP, activate the intracellular STING pathway, produce interferon beta and eventually cause an increase in tumor-specific CD8+ T cells [5,6,7]. Different natural cGAMPs have been isolated, such as 2′3′-cGAMP or 3′3′-cGAMP and administered either i.v. or i.t. in mice [8]. Due to the difficulty for negatively charged molecules to enter cells, higher doses of cGAMP were used causing side effects such as T cell apoptosis [9,10]. Moreover, as a dinucleotide, cGAMP is prone to degradation by blood hydrolases [6]. There is therefore a need for a carrier which would both protect the dinucleotide and enable successful transfection of cGAMP.
Polyethylenimine (PEI) has become the gold standard as a carrier for oligonucleotide delivery due to its remarkable pH-buffering capacity and ability to electrostatically condense genetic material enabling its protection and cellular uptake [11]. We thus decided to complex cGAMP with PEI, spontaneously forming NCs. Once internalized by the cell, PEI causes osmotic swelling and final disruption of the endosome, leading to the endosomal escape of the drug cargo. Depending on the type and number of amino groups within the PEI chain, this disruption effect is more or less pronounced. There are two types of PEI structures, the branched one, having more primary amino groups, and the linear one, having more secondary amino groups. Molecular weight also plays an important role in the buffering capacity of PEI: the higher the molecular weight, the higher the transfection efficacy. This should be balanced with the toxicity increasing with the number of available positively charged (primary) amino groups [11,12]. We therefore investigated both branched (1.2 and 10 kDa) and linear PEI (4 and 25 kDa) in order to determine the best balance between toxicity and efficacy, and to ensure adequate physicochemical stability.
The targeted NCs’ properties also depend on the route of administration [13]. We aimed here at an intratumoral (i.t.) administration, avoiding potential T-cell apoptosis upon i.v. administration of the required high dose of cGAMP [14].
A critical step for i.t. administration is to trigger endocytosis by the tumor microenvironment. Noteworthy, the optimal size for uptake would depend on the targeted cells of the tumor microenvironment: (i) phagocytic cells for which up to now contradictory data on optimal target size for uptake have been reported, generally favoring NCs larger than 200 nm and [15,16] (ii) non-phagocytic cells for which uptake increases for diameters below 50 nm [15,16]. Additionally, it was shown that the toxicity is inversely proportional to the size of the NCs, with higher toxicity observed for smaller NCs [17].
With regard to the shape of the NCs, phagocytic cells preferably take up elongated shape particles (resembling bacteria), as compared to non-phagocytic cells for which the uptake rate increases for smaller and spherical NCs.
Finally, the N/P charge ratio is also an important parameter to investigate. Based on the available literature, higher absolute charge of NCs is favorable for better transfection efficacy by APC [15,18]. Still, it is important to take into account that excess of positively charged polymers such as PEI, amino groups can cause toxicity, as they interact with different cell compartments, such as cell or mitochondrial membranes [19]. In preliminary experiments, we assessed a broad range of ratios (1/5 to 8/1) showing that high N/P ratios were causing high toxicity and low N/P ratios were not stable. Therefore, we focused on 1/1 and 2/1 N/P ratios in the context of this study.
Due to the lack of regulations in nanomedicine, two world organizations—Nanotechnology Characterization Laboratory of the US National Cancer Initiative (NCL-NCI) and European Nanomedicine Characterization Laboratory—have been establishing standard protocols for nanomaterial characterization using adequate analytical methods [3,20]. This implies a detailed understanding of the critical quality attributes (CQAs), as well as additional toxicological tests towards regulatory acceptable methods. Based on EU-NCL guidelines [20], the main physicochemical CQAs for preclinical characterization are size, size distribution, charge/zeta potential (ZP), stability in relevant media and over time, encapsulation efficiency and aggregation behavior. These parameters will strongly impact toxicity, efficacy and immunogenicity [1,13,21,22,23]. It is therefore critical to perform a thorough preclinical physicochemical characterization of CQA for a system such as PEI/cGAMP NCs [24].
In order to obtain solid data on those crucial parameters, several techniques have been employed to establish possible quality control protocols [20,25,26,27,28]. For examining the size of PEI/cGAMP NCs in the 1–1000 nm range, International Standard Organization (ISO) guidelines and health agencies recommend conventional analytical techniques such as dynamic light scattering (DLS ISO 22412:2017), nanotracking particle analysis (NTA ISO 19430:2016) and electron microscopy (EM ISO/TC 202/SC 4). Additionally, Asymmetrical Flow Field Flow Fractionation (AF4 ISO/TS 21362:2018) was recently accepted by ISO as a high-resolution fractionation technique. For mostly monomodal distribution of PEI/cGAMP NCs, DLS is able to provide reliable data. Nevertheless, in case of very high polydispersity index (PDI) values, e.g., in the presence of aggregates, DLS fails to describe the distribution showing the need for orthogonal techniques [29]. NTA and scanning electron microscopy (SEM) are suitable approaches based on particle-by-particle measurements [20,30]. Nevertheless, as both of these techniques give a number-averaged size distribution, whereas DLS gives an intensity-averaged one, it is important to mathematically transform DLS results from intensity to number (volume) average for comparison with SEM and NTA [31,32]. For that purpose, the sample’s refractive index (RI) and absorbance must be known, and PEI/cGAMP NCs are assumed to be spherical [31]. Additionally, more advanced techniques such as online AF4-DLS provide information on the size of each population separately [28].
Drug loading is another challenging property to assess. Based on concentration detectors such as UV (AF4-UV-DLS), drug loading (recovery (R)) can be obtained for each of the populations [28]. To obtain more solid data, AF4-UV results are compared with standard methods such as UPLC-UV to confirm encapsulation efficiency (EE) [33,34]. Finally, AF4 coupled with online DLS may provide information on the shape factor. Shape factor or molecular conformation represents the average radii of gyration (Rg-mass distribution of NCs) obtained by AF4-MALS (multiangle static light scattering) divided by the hydrodynamic radii Rh obtained by AF4-DLS [35,36]. Based on the shape factor, NCs can be classified as micro (nano)gels for values <0.7, homogeneous spheres for 0.775, branched molecules (1–1.5), random coils (1.5–2.1) and rod-like, elongated structures for values >2. In addition, electron microscopy can serve as a qualitative technique to compare shapes [35]. Another important property impacting colloidal stability is the zeta potential (ZP), which can be measured by both DLS and NTA [37,38].
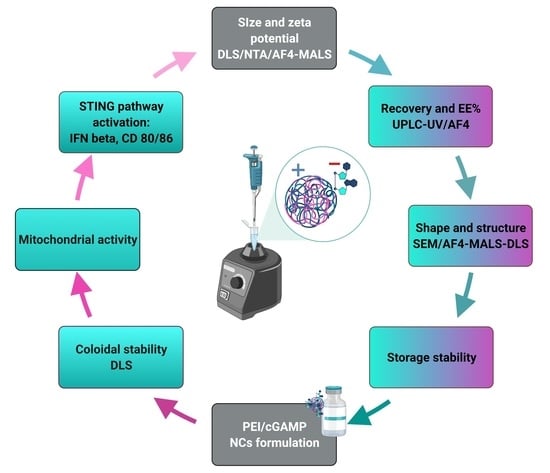
The aim of this work was to formulate positively charged PEI/cGAMP NCs preferably larger than 200 nm for optimal uptake following i.t. administration, with the lowest toxicity/efficacy ratio, and a shape favoring phagocytosis. Moreover, due to the lack of specific regulations appointing for the characterization of CQA, several orthogonal techniques were employed, and protocols proposed to obtain reliable data on size, shape, zeta potential and drug content of the NCs.

2. Materials and Methods

2.1. Chemicals

Polyethylenimine polymers (PEI), linear (linPEI) 4 kDa, 25 kDa and branched (brPEI) (1.2 kDa, 10 kDa), were purchased from polysciences (Hirschberg an der Bergstrasse, Germany) and 2′3′-cGAMP was obtained from Invivogen (Toulouse, France).

2.2. Fabrication of PEI/cGAMP NCs

Stock of dissolved PEI and cGAMP in LAL water (endotoxin-free water) was separately kept at 1 mg/mL at −20 °C. Two N/P (PEI/cGAMP) ratios of 1/1 and 2/1 were used. The concentration of cGAMP in PEI/cGAMP NCs suspensions was fixed at 0.01 mg/mL for in vitro experiments and both 0.01 and 0.1 mg/mL for physicochemical characterization.
To obtain 0.010 mg/mL cGAMP concentration in PEI/cGAMP NCs, we added in equal parts a solution of 20 μg/mL of cGAMP and a solution of:
  • 2.5 μg/mL (ratio 1/1) or 5.0 μg/mL (ratio 2/1) of linear PEI;
  • 11.1 μg/mL (ratio 1/1) and 22.2 μg/mL (ratio 2/1) of branched PEI.
PEI/cGAMP NCs were prepared by ionic gelation method, as described previously for chitosan particles [39,40]. PEI was added dropwise to the cGAMP solution while vortexing for 30 s. Complexation was completed at room temperature (RT) for 30 min. At pH 6–7, both PEI and cGAMP are fully ionized (chemicalize software, Chemaxon Ltd., Busdapest, Hungary). PEI/cGAMP NCs were prepared in three different media depending on the experiment: water, phosphate-buffered saline (PBS Gibco™; 1×, and pH 7.4, without CaCl2 and MgCl2) and Dulbecco’s Modified Eagle Medium (DMEM Gibco™; pH 7.4) both media from Thermofisher scientific, Waltham, MA, USA.

2.3. Analytical Procedures for Nanoparticle Characterization

Dynamic light scattering (DLS), nanoparticle tracking analysis (NTA), asymmetric flow field flow fractionation–ultraviolet–visible spectroscopy–multiangle light scattering–dynamic light scattering (AF4-UV-MALS-RI-DLS) and scanning electron microscopy (SEM) were used for size and shape examination of obtained nanoparticles. Zeta potential was also investigated by electrophoretic light scattering (ELS) to confirm differences in surface charge for two PEI/cGAMP ratios (1/1 expected to be neutral and 2/1 expected to be positively charged) by by DLS and NTA. Moreover, the zeta potential of PEI/cGAMP NCs prepared using different PEI types of varying molecular weights was investigated. In addition, encapsulation efficacy (%) was examined by Ultra Performance Liquid Chromatography ultraviolet–visible spectroscopy (UPLC-UV/Vis) and compared to cGAMP recovery (%) data obtained by AF4-UV-MALS.

2.3.1. Encapsulation Efficacy

PEI/cGAMP NCs were separated from free cGAMP by centrifugation using VIVASPIN 3000 MWCO (Littleton, MA, USA) at 12,000× g and 6000× g over 10 min and the filtrate was analyzed. Different centrifugation speeds were chosen in order to examine whether centrifugal force may affect the weak ionic binding between negatively charged cGAMP and positively charged PEI. cGAMP loading was quantified by a Waters UPLC system (Milford, MA, USA), consisting of ACQUITY UPLC System, and an ACQUITY BEH C18 column (1.7 µm, 2.1 × 50 mm). Mobile phases ammonium formate (pH 7.4, 10 mM) and acetonitrile (pH 7.4) were used with a gradient starting at 100:0 for 0.2 min, 1.4 min 90:10 at 1.4 min, 10:90 at 2 min, 100:0 at 2.26 min, kept for 3.2 min. Analytes were detected and quantified by ACQUITY UPLC PDA at a wavelength of 256 nm. Flow rate was fixed at 0.3 mL/min. PEI/cGAMP NCs were prepared in PBS at a concentration of 0.01 mg/mL PEI/cGAMP (2.2.), with 5 µL injection volume. Results are presented as mean ± SD of triplicate experiments (n = 3). Encapsulation efficiency (EE) was calculated as shown in Equation (1):
E   % = 100 e x p e r i m e n t a l   c G A M P   c o n c t h e o r e t i c a l   c G A M P   c o n c × 100

2.3.2. Batch-Mode DLS Analysis

The hydrodynamic diameter (Dh), polydispersity index (PDI) and zeta potential of PEI/cGAMP NCs were measured by DLS and ELS (Zetasizer nano-ZS, Malvern Panalytical, Malvern, UK). Zetasizer was equipped with a red 633 nm He–Ne laser and 173° degree scattering angle. All measurements were performed at 25 °C. The refractive index (RI) and the value for the viscosity of water (1.331; 0.8872 cP) were used. The laser power-attenuator was adjusted automatically. The derived count rate (mean count rate divided by the attenuation factor) reflecting the concentration of PEI/cGAMP NCs was used to compare PEI/cGAMP NCs at two different cGAMP concentrations of 0.1 and 0.01 mg/mL. To convert from intensity to number averages, we used the RI of water (1.331) and absorbance of latex (0.01), as both values were unknown for cGAMP, and for PEI. Size measurements were performed in disposable cuvettes ZEN0040 and zeta potential in DTS1070 reusable cuvettes. Data were analyzed by Malvern Instruments Zetasizer Software version 7.12.
Particle z-average and PDI were determined in Milli-Q® water, PBS and DMEM at 0.1 and 0.01 mg/mL of PEI/cGAMP NCs. Zeta potential was measured in Milli-Q® water at 40 V (n = 3) at 0.1 mg/mL PEI/cGAMP. Results are presented as mean ± SD.

2.3.3. Electron Microscopy Analysis

For imaging, 1 µL of 0.01 mg/mL PEI/cGAMP NCs in Milli-Q® water was placed on a copper grid and then either lyophilized (Christ alpha 2–4 ld plus, Osterode am Harz, Germany) or vacuum-dehydrated on silica gel overnight. Samples were sputter-coated with 20 nm gold (Leica EM SCD500, Wetzlar, Germany) and imaged by scanning electron microscopy (SEM, JSM-7001F, JEOL, Tokyo, Japan).

2.3.4. AF4-UV-MALS-DLS Analysis

To determine the recovery of cGAMP (%), radii of gyration (Rg) and shape factor (Rg/Rh) of the PEI/cGAMP NCs, we performed AF4-UV-MALS-DLS (Postnova Analytics GmbH, Landsberg am Lech, Germany); DLS nanoseries ZS (Malvern Panalytical, Malvern, UK). Membrane material was RC (regenerated cellulose) with a 10 kDa molecular weight cut-off, 350 µm spacer and 0.05% Novachem surfactant (Postnova Analytics GmbH, Landsberg am Lech, Germany) was used as mobile phase. This concentration is four times more diluted compared to previous reports found in the literature in order to avoid micelle formation, and moreover not to interfere with online AF4-DLS measurements [41,42,43]. In order to avoid unspecific binding of NCs, every time a new membrane was placed, it was blocked with 0.5 mg/mL BSA during 2 h [8], as previously recommended in the literature. The particle size or gyration radii (Rg) was determined by multiangle light scattering (MALS), using Berry formalism, where linearity was obtained once 28° and 156° detectors were excluded [44]. Hydrodynamic radii (Rh) or z-average was determined by AF4-DLS. Shape factor represents Rg/Rh. Values for RI and UV intensity on the graphs are represented as a mean value out of three independent experiments.

Determination of cGAMP Extinction Index

The extinction coefficient of cGAMP was determined at a wavelength of 256 nm. In total, a 50 µL of each sample was manually injected in duplicate at 0, 0.05, 0.1, 0.15 and 0.2 mg/mL of cGAMP in Milli-Q® water. Mobile phase used was 0.05% Novachem. TIP flow was adjusted at 0.5 mL/min and no cross flow was applied.

No Cross Flow Analysis

To examine the recovery of the PEI/cGAMP NCs and to confirm complexation, first examinations were performed without cross flow (cf). PEI/cGAMP NCs were analyzed at 0.1 mg/mL (5 µg) of PEI/cGAMP prepared in Milli-Q® water (2.2.). In total, a 50 µL of the sample was manually injected. Mobile phase used was 0.05% Novachem. TIP flow was adjusted to 0.5 mL/min. Samples were performed in triplicates (n = 3) and results are shown as a mean value. Recovery of cGAMP without cross flow (w/o cf) (%) was calculated as shown in Equation (2):
R 0   % = w / o   c f   e x p e r i m e n t a l   c G A M P   c o n c t h e o r e t i c a l   c G A M P   c o n c × 100

Cross Flow Analysis

PEI/cGAMP NCs were analyzed at a concentration of 0.1 mg/mL of PEI/cGAMP prepared in Milli-Q® water (2.2.). In total, a 50 µL of sample (5 µg) was manually injected. The method was optimized based on the Postnova® latex method with a duration of 25 min (Table 1). In total, 0.05% Novachem was used as the mobile phase. Samples were performed in triplicates (n = 3) and results shown as a mean value. Due to higher molecular weight (10 kDa) of the RC membrane pore compared to cGAMP (700 Da), there is a certain cGAMP loss calculated as in Equation (3). Recovery of cGAMP with cross flow from PEI/cGAMP complexes (%) was calculated according to Equation (4).
c G A M P   l o s s   % = c f   e x p e r i m e n t a l   c G A M P   c o n c w / o   c f   e x p e r i m e n t a l   c G A M P   c o n c × 100
Rcf   % = c f   e x p e r i m e n t a l   c G A M P   c o n c t h e o r e t i c a l   c G A M P   c o n c × 100

Membrane Cleaning

To avoid adhesion of the positively charged PEI/cGAMP NCs to the membrane, we performed 2 consecutive injections of 50 µL Acetic buffer (pH 4; 0.1 M) and 50 µL of water, respectively, before introducing the sample. This was followed by an injection of 50 µL of 0.1% SDS. Injections were carried out under the conditions described in Table 1.

Determination of NCs Size and Shape

PEI/cGAMP NCs were prepared at a concentration of 0.1 mg/mL in Milli-Q® water and analyzed by AF4-UV-MALS-DLS (see Section 2.2). A 50 µL sample was manually injected. Malvern Zetasizer software was set to “flow” measurement and the data were exported to Postnova software for analysis. All raw data corresponding to Rh, Rg and Rg/Rh for the selected eluted peak were exported to an Excel file and calculated as average value of all PEI/cGAMP NCs examined within the peak range selected. Samples were measured in triplicate (n = 3) and results are shown as mean ± SD.

2.3.5. Nanoparticle Tracking Analysis (NTA)

The size and zeta potential of PEI/cGAMP NCs were analyzed at 0.01 mg/mL of PEI/cGAMP in both Milli-Q® water and PBS by nanoparticle tracking analysis (NTA; Particle Matrix ZetaView). Laser wavelength was 520 nm. Cell used is ZetaView® NTA-ZNTA. Measurements were taken over 1 cycle at 11 positions. Zeta potential was measured on pulses at −20 and 20 V. Measurements were performed in triplicate (n = 3) and results are shown as mean ± SD.

2.4. In Vitro Analysis

Bone-marrow-derived dendritic cells (BMDC) were differentiated from C57BL/6JRj mice bone marrow cells [45]. RAW 264.7 were obtained from ATCC (LGC Standards, Molsheim, France). BMDC and RAW 264.7 cells were cultured using T75 Corning culture flasks with vented caps. BMDC were grown in RPMI 1640 cell culture medium, 10% fetal bovine serum (FBS, Gibco, Thermofisher scientific, USA), supplemented with 1% Pen/Strep, 1% L-glutamine, 0.1% β-mercaptoethanol (50 mM) and 0.5% sodium pyruvate. RAW 264.7 were grown in DMEM both supplemented with 10% FBS and 1% penicillin. The flasks were kept at 37 °C in 5% CO2 and the cells passaged every 2 to 3 days. Cells were always kept at 80% working confluence. Per 96 well, 200 µL of 0.01 mg/mL cGAMP in NCs were distributed (corresponding to 2 µg). PEI/cGAMP NC suspensions were prepared in DMEM.

2.4.1. Mitochondrial Activity

WST-1 assay (Roche, Basel, Switzerland) was used to measure the impact of the PEI/cGAMP NC on mitochondrial activity as a surrogate for cytotoxicity. Cells were seeded at an initial density of 1 × 10⁶ cells/well (RAW) and 1 × 10⁵ cells/well (BMDC), respectively, in 96-well plates. After that, cells were treated with PEI/cGAMP NCs and incubated for 1 h, 2 h and 24 h. Following incubation, the medium was aspirated and 100 µL of 1/10 diluted WST1 solution added (10 µL of WST1 in 90 µL of medium). Optical absorbance was measured at 450 and 690 nm using a microplate reader (Biotek SynergyMx, Santa Clara, CA, USA). Respective cell culture media were used as a positive control corresponding to 100% viability. Mitochondrial activity is presented as mean ± SD of triplicate experiments (n = 9, 3 independent experiments in triplicate).

2.4.2. Interferon β Level

BMDCs and RAW 264.7 cells were exposed to different PEI/cGAMP NCs in 96-well plates over 1 h, 2 h and 2 h/24 h (2 h cell exposure to the NCs followed by fresh media replacement and 22 h incubation). Supernatants were then removed and assessed for Interferon β (IFN beta) contents as follows. After coating plates with 50 µL/well anti-IFN beta RMMB-1 (PBL, 22400-1) and incubation overnight at 4 °C, standard dilutions of mouse IFN beta (PBL, 12400-1) and samples were added (total 50 µL/well). NCs were prepared at 0.01 mg/mL. After adding the detection antibody anti-IFN beta (PBL, 32400-1), and the secondary antibody anti-rabbit IgG, HRP-linked (Cell Signaling, 7074S), reaction was induced by addition of TMB substrate (BD OptEIA, 555214) and stopped by the addition of 25 µL H2SO4. Optical absorbance was measured at 450 and 570 nm using a microplate reader (Biotek SynergyMx) and IFN beta levels expressed as U/mL. Results are presented as mean ± SD of triplicate experiments (n = 9, 3 independent experiments in triplicate).

2.4.3. CD80/86

BMDC were seeded at a seeding density of 105 cells/well in 100 μL RPMI 1640 media on 48-well plates (Corning®) (n = 9, 3 wells per experiment 3×). NCs were prepared 0.01 mg/mL of cGAMP. Cells were scraped and together with media transferred to 1.5 mL Eppendorf tube and filled to the top with PBS. Samples were centrifuged 300× g over 5 min (Beckman, Avanti 30 Centrifuge, Indianopolis, IN, USA, supernatant removed and 1/200 dilution of CD80-Pe (PE anti-human CD80 Antibody, Biolegend, San Diego, CA, USA), 1/200 dilution of CD86-Bv510 (Brilliant Violet 510™ anti-mouse CD86 Antibody, Biolegend, San Diego, CA, USA) and 1/100 dilution of Fc-block (Human BD Fc Block™, BD Biosciences, Allschwil, Switzerland) added. The process was followed by incubation over 30 min at 4 °C, washing with 1.5 mL FACS buffer (PBS 1% BSA) and finally resuspension in 100 μL FACS buffer. Two μL Draq7, (DR71000, Biostatus, Leicestershire, UK) was added for live/dead assay. Finally, samples were analyzed on FACS Cytoflex S 4L (Beckman Coulter, Brea, CA, USA), CD80-Pe was excited with a 561 nm yellow green laser and CD86-Bv510 by a 405 nm violet laser. Results are presented as % normalized towards live/dead cells as a mean ± SD of triplicate experiments (n = 9, 3 independent experiments in triplicate).

2.5. Statistical Analysis

The results were analyzed using two-way analysis of variance (ANOVA) followed by Tukey’s multiple comparison test. p < 0.05 was considered as statistically significant. * p < 0.05; ** p < 0.01; *** p < 0.001; **** p < 0.0001.

3. Results and Discussion

The characterization of the physicochemical properties of PEI/cGAMP nanocomplexes, as other nanoformulations, requires an orthogonal approach. In the following we discuss results obtained for these NCs with respect to their stability, size, charge, shape, encapsulation efficiency, in vitro efficacy and toxicity.

3.1. Physicochemical Stability of PEI/cGAMP NCs

The goal of these experiments was to identify a stable formulation for PEI/cGAMP NCs of varying polymer nature and N/P ratio in relevant media (Figure 1a–d). Moreover, complexation was examined by measuring PEI/cGAMP NCs zeta potential (Figure 1f) at the pH at which they were prepared (Figure 1e).
Influence of polymer nature and media on the NCs’ size and PDI. PEI/cGAMP NCs prepared using branched PEI shown high size and PDI variations depending on the media (water, PBS, DMEM, Figure 1a,b vs. Figure 1c,d). In contrast, NCs prepared with linear PEI had similar characteristics in different media. Moreover, branched PEI/cGAMP NCs prepared in PBS were significantly (p < 0.0001, n = 9) smaller compared to linear PEI NCs (Figure S1a). Finally, it appears that linP25/cGAMP NCs prepared in PBS were the most stable having the lowest standard deviations in size and PDI values.
Surface charge and pH of NCs. Since the positive charge plays an important role in complexation with negatively charged cGAMP, we examined the zeta potential of PEI/cGAMP NCs and PEIs alone as a control. Linear PEI/cGAMP NCs had higher zeta potential values compared to branched PEIs, most probably due to the preparation pH (Figure 1e,f). At high pH, branched PEI is less charged (pKa 9.1) and thus the zeta potential is reduced. Based on the molar charge N/P ratio calculation, it was expected to obtain nearly neutralized PEI/cGAMP NCs in case of 1/1 ratio and positive charge in case of 2/1 ratio after complexation. Accordingly, zeta potential for the linP25/cGAMP 2/1 ratio (7.7 ± 6 mV) was twice that of 1/1 ratio (4 ± 2.3 mV). PEI/cGAMP NCs made of branched PEIs followed the same trend. Significant differences in zeta potential values were observed only in the case of linear PEI 25 in the comparison of empty to loaded PEI/cGAMP NCs (p < 0.0001, n = 3). This difference was confirmed by NTA measurements, although higher zeta potential values (p < 0.0001, n = 3) were measured with this approach (Figure S1b). This is suggested to be due to the increased electrophoretic mobility of the measurements obtained by NTA compared to DLS (p < 0.0001) (Figure S1c). Electrophoretic mobility is inversely proportional to the electric field strength, which was in the case of DLS 40 V/cm and NTA 20 V/cm [37]. Thus, besides the particle-by-particle measurement obtained by NTA, different amplitudes and modulation of the electric field might be the reason for the higher values. These data suggest successful complexation having our N/P ratio calculation in accordance with the data obtained, 2/1 NCs being twice as highly charged as 1/1 NCs, as expected.
Based on the media stability data showing no significant difference in size and size distribution in water, PBS and culture medium (DMEM), linear PEIs compared to the branched ones have an advantage as a carrier for cGAMP (Figure 1a–d). The number of amino groups exposed to the solvent in branched PEI is less controlled due to conformational variability, which might explain the lack of stability and size variations in different media. Moreover, it was reported that pH plays an important role, having at lower pH more protonated groups and better binding, favoring again linear PEIs which were able to be buffered compared to the branched ones (Figure 1e) [46]. Stability of the NCs in DMEM is important for ensuing biological studies. Moreover, linear PEI 25 is the only polymer having statistically lower zeta potential values once complexed with cGAMP, suggesting successful complexation.

3.2. Toxicity/Efficacy Ratio of PEI/cGAMP NCs

Besides stability profile in different media, surface charge and pH, toxicity and activation of the STING pathway (IFN beta level) were important properties to be examined in order to pick the cGAMP polymers for further studies (Figure 2).
NCs impact on mitochondrial enzymatic activity. It is well accepted that PEI toxicity is time, cell type and dose dependent [47]. In this study, significant differences in mitochondrial activity were detected between time points 30 min, 1 h, 2 h and 24 h (Figure S2a). There was no significant difference between BMDC and RAW cells, but BMDC tended to be more sensitive than RAW cells in terms of the lower mitochondrial activity measured upon NCs incubation (Figure S2b). After 24 h of exposure, both free branched PEI and NCs prepared using branched PEI were significantly more toxic compared to the negative control (p < 0.05, n = 9). There was a trend of NCs made of branched PEI to be more toxic compared to NCs made of linear PEI (Figure 2a). Several factors may explain this difference in toxicity, with pH as a first factor. Preparations of NCs made of branched PEI had a higher pH compared to linPEI/cGAMP NCs (Figure 1e). Moreover, surface chemistry plays an important role, with branched PEI being more toxic compared to linear PEI due the presence of a higher number of primary amino groups [17,48]. Another important parameter influencing cytotoxicity may be the size of PEI/cGAMP NCs. The smaller the PEI/cGAMP NCs, the higher their cytotoxicity [17]. In our case, NCs made of branched PEI were indeed smaller than linear PEI NCs (Figure S2c).
In order to select the best formulation taking into account its activity, we examined the secretion of IFN beta, the final product of the STING pathway activation and the expression of CD80/86 markers in BMDC.
IFN beta level induced by NCs. Incubation with NCs made of linP25 resulted in the highest IFN beta expression (Figure 2b, 2.5-fold increase compared to cGAMP in the case of 1/1 ratio and 3-fold for 2/1). Moreover, only in the case of linear PEI 25 kDa, a significant increase in IFN beta response was observed over time (Ratio 1/1: 2 h 24 h vs. 1 h and 2 h p < 0.001; ratio 2/1: 2 h 24 h vs. 1 h and 2 h p < 0.0001, n = 9) (Figure S2d). Branched PEI did not induce significant IFN-β expression, probably due to its toxicity (Figure 2a,b).
CD80/86 expression on BMDC induced by NCs. To further investigate the carrier of choice, we examined the expression of cell markers CD 80 and CD 86, important for providing co-stimulation to T cells [49]. Due their significant toxicity, NCs made of branched PEI were not further investigated. The highest expression of both CD86 and CD80 was observed with 2/1 NCs prepared from PEI 25 (1.9-fold higher CD 80 and 1.6-fold higher CD86 higher expression compared to the control, naked cGAMP).
It is important to notice that the cGAMP dose (2 µg) used in this work is five times lower than the average one reported in the literature [14]. Our aim was to at least double the activation of STING pathway at this low dose compared to naked cGAMP. LinP25 and LinP4 as carriers were compared due their acceptable toxicity, cationic nature needed for transfection and ability to control the pH (Figure 1e,f). Besides the influence of molecular weight on efficacy already reported in the literature [50], we speculate on possible NCs’ size correlation with bioactivity. NCs 2/1 linP25 in DMEM (Figure 1b) had a trend to be larger (ca. 600 nm) than NCs 2/1 linP4 in DMEM (ca. 400 nm). Moreover, based on Gustafson et al., phagocytosis is favored for larger particles [16]. Therefore, the trend towards higher STING pathway activation for NCs 2/1 linP25 might be due to their size. Additionally, variations (STD) in IFN beta, CD80 and CD86 expression (Figure 2b) might be partially explained by high STD in size (Figure 1a,b). Finally, we selected linear PEI 25 for further studies due to (i) its acceptable toxicity on BMDC and RAW cells, (ii) promotion of IFN beta/CD80/86 expression level compared to free cGAMP, (iii) NCs’ stability in different media, (iv) positive charge and (v) the pH 6 of the preparation, which corresponds to the tumor microenvironment.

3.3. cGAMP Extinction Coefficient Determination and Method Optimization for AF4 Measurements

We determined the extinction coefficient of cGAMP (Figure 3a) in order to compare NCs’ recovery with and without applying cross flow during the run (Figure 3b) and to allow the quantification of cGAMP complexed in the NCs. We first checked that the UV signal at 256 nm arises mostly from cGAMP by injecting cGAMP alone (5 µg) and linP25 alone at two concentrations corresponding to 1/1 (0.625 µg) and 2/1 (1.25 µg) ratios (Figure S3a). While applying the cross flow, the linP25/cGAMP may stick to the membrane. Therefore, we had to establish an efficient cleaning protocol besides BSA conditioning (Figure 3c).
Extinction coefficient cGAMP. First, we determined the extinction coefficient of cGAMP in order to obtain recovery results as precise as possible. Extinction coefficient at 256 nm of cGAMP was calculated as an average of all extinction coefficients adjusted on Postnova software corresponding to different recoveries (0, 0.05, 0.1, 0.15 and 0.2 mg/mL), with a final value of 16.82 ± 0.88 mL/(mg·cm). This value was lower than reported for a parent molecule c-diGMP (34.9 mL/(mg·cm) [12], maybe due to different mobile phases used. Linearity was established between different concentrations of cGAMP, which proved the reliability of the UV detector (R2 = 0.991) (Figure 3a). Unfortunately, the RI signal suffered from higher SD, and RI linearity was not confirmed for cGAMP (R2 = 0.96) (Figure S3c). Therefore, we based our cGAMP recovery results on UV detection, and continued following RI results only qualitatively in order to check if linP25/cGAMP remained complexed.
Recovery of cGAMP with and without cross flow. By injecting three times cGAMP alone without cross flow (Figure 3b, pink curve/fractogram), recovery was around 100% (5.06 ± 0.33 μg recovered). Once the cross flow was applied (Figure 3b, overlapping orange, blue and green graphs) cGAMP recovery was 61.7% (1.9 ± 0.2 μg recovered), probably due to losses through the membrane with a high molecular weight cut off (10 kDa), with respect to the molecular weight of cGAMP (718.28 g/mol) [51]. UV was thus used for further studies on cGAMP recovery as a concentration detector, considering a maximum recovery Rcf of 60% under crossflow.
Cleaning protocol. In order to avoid overloading of the PEI/cGAMP sample, there was a need for every sample injection to be preceded by and followed by “cleaning” phases as follows: 1. acetic buffer pH 4 0.1 M; 2. water; 3. sample; and 4. SDS 0.1%. Comparison of injections 4 and 2 shows that after the sample run, there was still cGAMP remaining on the membrane that needed to be removed before the next measurement run (Figure 3c).

3.4. Orthogonal Techniques for Size Comparison (DLS, NTA and AF4-DLS) of Empty Linear PEI 25 and PEI/cGAMP NCs

The aim of the experiment was to examine the size of 1/1 and 2/1 NCs compared to the parent polymer linP25 (Figure 4). Size was obtained through different techniques (DLS z-average and number size, NTA and AF4-MALS-UV-DLS Dg and Dh).
Size and PDI of 1/1 and 2/1 NCs vs. linP25. Based on DLS measurements (both z- and number averages), both 1/1 and 2/1 NCs were significantly smaller than linP25 (p < 0.0001) and PDI was lower, suggesting polymer condensation upon the addition of cGAMP (Figure 4). Moreover, 2/1 NCs were significantly bigger compared to 1/1 (p < 0.0001), as expected for a more extensive dinucleotide complexation. The trend was confirmed by NTA and AF4-DLS size measurements, where linP25 was bigger compared to NCs. Altogether, we can conclude that cGAMP complexes linP25, forming smaller PEI/cGAMP NCs at lower PDI values compared to PEI alone.
Comparison of sizing techniques. Both z-average values of NCs were significantly higher than number-average values (p < 0.0001), which together with PDI values (0.4) suggests that we might not have a monomodal distribution. Nevertheless, there was no significant difference in between NTA and DLS number-average size values for the loaded NCs (Figure 4). On the contrary, in the case of free polymer (linP25), DLS number-average values were statistically higher than NTA size values and polydispersity high, suggesting polymer aggregation.
There was a significant difference (p < 0.0001) between z-average by DLS and Dh calculated by AF4-DLS, which may be due to the selected population eluted and separated by AF4. As for the gyration size measured by MALS, the difference between Dg (2xRg) and Dh (2xRh) arise from their definitions. Rh is the hydrodynamic radii, i.e., the size of the solvated particle, and the gyration radii is calculated as the average distance from the center of mass to the molecule’s surface. Moreover, in the next section, we will discuss in more detail the ratio between the two radii, called shape factor. The trend towards higher STD in case of 2/1 NCs compared to 1/1 was shown by all sizing techniques and might be due to the fact that lower fraction of bound PEI decreases colloidal stability.
Effect of NCs’ concentration. Measurements were performed at 0.01 mg/mL of cGAMP in NCs corresponding to a sufficient concentration for STING pathway activation. To first confirm that DLS measurements were consistent between 0.01 and 0.1 mg/mL, we compared the derived count rate and z-average (Figure S4a,b). It was shown that the values measured at a 0.01 mg/mL concentration matched those at the higher particle concentration of 0.1 mg/mL, concluding that a different concentration does not affect physicochemical parameters of NCs.
In terms of cGAMP complexation, both 1/1 and 2/1 LinP25/cGAMP NCs are smaller than empty NCs (linP25), as shown by several orthogonal techniques used (DLS, NTA, AF4-MALS-DLS for size) at different concentrations. (Figure 4 and Figure S1b). Moreover, zeta potential was measured my two orthogonal techniques NTA and DLS (Figure S1b) and for both 1/1 and 2/1 NCs significantly lower zeta potential compared to empty linP25 was shown. These data strongly suggest a successful complexation of cGAMP by linP25. However, there is still a need to perform encapsulation efficiency to confirm at what extent there is complexation between the two.
A general approach for the characterization of gel-like nanocomplexes would start with the size measurements using intensity-based average (z-average), DLS. In the case of high PDI values (>0.08 corresponding to mid-range distribution based on Malvern Panalytical guidlines), we propose to use particle-by-particle methods such as NTA. In order to compare DLS and NTA, intensity-based results are transformed to number based, provided the particle shape is spherical and refractive index is known. Nevertheless, if results from intensity-based DLS and NTA are significantly different, it might point out the presence of large agglomerates or aggregates, as DLS intensity-based technique is highly sensitive to large particles. For accurate analysis of a multimodal size distribution, it is beneficial to separate small particles from agglomerates. AF4 coupled to DLS was employed for this purpose, measuring gyration diameter Dg and hydrodynamic radii Dh.
In our case, NCs are having a higher PDI value of 0.4, and intensity-based results being significantly higher than number-based NTA, we performed AF4-DLS analysis to separate the different populations. Based on NTA most of the NCs both for 1/1 and 2/1 were in the 200 nm range, and once separated by AF4-DLS the size decreased to 50 nm. We speculate that loose NC aggregates–floccules might form under static DLS conditions. The DLS/NTA difference is even more marked for 2/1 NCs, probably due to more NCs flocculating together, possibly resulting from higher concentration of free PEI. We hypothesize that those formations are either flocculate or agglomerate randomly.

3.5. Shape, Encapsulation Efficiency and Recovery of linP25/cGAMP NCs

The aim of this study was to determine the encapsulation efficiency of cGAMP obtained by UPLC-UV compared to its recovery R0 (no cross flow) and Rcf (with cross flow) by AF4-UV (Figure 5c and Figure S3). The two N/P ratios investigated were 1/1 and 2/1. In addition, the shape of the PEI/cGAMP NCs was examined. We compared the shape of the PEI/cGAMP NCs observed by electron microscopy (Figure 5e) to the shape factor obtained by real time AF4-UV-DLS (Figure 5a,b,d).
Recovery and EE of cGAMP in NCs. UV absorption of cGAMP was higher than linP25 (Figure S3a) at a concentration used in the NCs, while the RI of linP25 was the same as for NCs (Figure S3e,f). Based on Figure 5a,b and Figure S3e,f, we can hypothesize that we have NCs’ complexation suggested by UV and RI spectra overlapping. In order to confirm the complexation, we compared the recovery of cGAMP in NCs under cross flow (Rcf) to EE-indirect measurement by UPLC-UV. For the latter, we collected the centrifuged and filtered fraction (free cGAMP, not bound to linP25) using a membrane with the same cut off as the AF4 membrane. Moreover, we applied two different centrifugation speeds (6000× g and 12,000× g over 10 min, Figure S3g) in order to check whether complexation is dependent on shear forces. For both ratios, there was a significant difference (p < 0.0001) between Rcf (around 30%) and EE (around 60%) at both 6 and 12,000× g (around 60%) (Figure 5c). The centrifugation speed did not affect EE. By applying cross flow, we only obtained one elution peak (Figure 5a,b and Figure S3e,f). Noteworthy, only one peak was eluted from the polydisperse system. This might be due to the effect of the cross flow, forcing the loose, larger aggregates to stick to the slightly negatively charged membrane. In order to investigate this hypothesis, we performed non-cross flow measurements to examine R0. As expected, R0 was significantly higher (p < 0.0001) compared to both NCs analyzed under mechanical stresses (Rcf—cross flow studies, centrifugation), supporting the hypothesis (Figure S3g). We will thus base our result on EE%.
Gyration and hydrodynamic radii, shape factor. LinP25/cGAMP NCs were corresponding to elongated structures based on the measured shape factor of 3 ± 1.2 for 1/1 and 4.1 ± 1.8 for 2/1 NCs (Figure 5d). We speculate that NCs are rod-like structures, having at 2/1 ratio more elongated shape than at a ratio of 1/1. In contrast, its structure resembles more that of a gel as determined by SEM (Figure 5e). These findings are directly in line with previous reports on PEI-based nanogels for gene therapy [11]. In addition, in the case of the 2/1 ratio we can observe more gelified and rigid structures by SEM, both after dehydration or lyophilization of the sample (Figure 5e down left and right).
LinP25 and cGAMP are forming elongated scaffolds and eventually nanogels, being complexed as shown by size, zeta potential, shape and drug loading measurements. Both 1/1 and 2/1 N/P ratio shown EE around 60% and elongated structures (Figure 4 and Figure 5c,d). However, the 2/1 NCs were significantly larger as shown by DLS (Figure 4), more positively charged (Figure 1f and Figure S1b), showing occasionally large floccules, higher IFN beta level and CD80, 86 expression (Figure 2b,c) compared to 1/1 NCs. Thus 2/1 were kept for further investigation. However, high STD from biological assays for 2/1 might be due to loosely bound floccules and accordingly high STD in size. Possibly, one of the future approaches for stabilization of such complexes would be the increase in viscosity of the external phase.

3.6. Storage Stability

The goal of these experiments was to investigate the stability of particles of different preparation methods for the storage, for instance in view of further in vivo studies. Particles were prepared in water and stored at 4 °C (Figure S4c) or stored in a dry form (dehydrated or lyophilized) and rehydrated (Figure 6a). Moreover, INF β expression of lyophilized or dehydrated forms after rehydration was compared to the fresh form (Figure 6b).
Stability of the NCs’ suspension and storage of dry forms. The NCs show limited stability in water suspension, with a non-significant trend towards size increase over 1 week (1/1 NCs) or 1 month (2/1 NCs) (Figure S4c). Therefore, in view of translating to in vivo application, we assessed dehydration and lyophilization for long-term storage of the nanoparticles. Compared to freshly prepared NCs, both the particle size and IFN beta levels were not significantly different compared to the ones dehydrated or lyophilized. Nevertheless, there was a trend of lyophilized samples having a slightly lower expression of IFN beta and forming smaller NCs compared to both freshly prepared and dehydrated samples. Therefore, the preferred process for storage stability would be to dehydrate the sample. Our future goal is to check the use of possible cryoprotectants and examine the effects of time and temperature on our dehydrated samples.

4. Conclusions

Due to analytical challenges and lack in regulatory standards when determining the exact size and zeta potential by a single technique and the difficulty of the characterization of polydisperse samples such as PEI/cGAMP polyectrolyte nanocomplexes, characterization by orthogonal techniques is required. The aim of this work was to select NCs for i.t. administration which are the most stable in terms of constant size in different media, absence of aggregation, storage stability and the best efficacy/toxicity ratio. In order to separate different size populations, online coupled AF4 with DLS was employed and as expected, for all NCs’ preparations Dh (AF4-DLS) was significantly lower compared to z-average (DLS) after separation of possible aggregates by AF4-DLS. Although differences in size were measured by different techniques (DLS, NTA and AF4-DLS), all techniques did not have the same value, but the same trend, indicated by loaded NCs being smaller than empty carriers, suggesting a polyelectrolyte complexation. Zeta potential values confirmed the complexation, with cGAMP loaded NCs having a significantly lower charge. Encapsulation efficiency data measured by two techniques, UPLC-UV and AF4-UV, were significantly different having a value of around 60–70% obtained by UPLC-UV and around 30% by AF4-UV. As NCs were eluted only in one peak once cross flow was applied, having almost 100% recovery without cross flow, we speculate that NCs might stick to the oppositely charged membrane. The shape observed by SEM and the AF4-DLS shape factor >2 suggests an elongated rod-like structure, which would be preferred for the phagocytosis of NCs, which would have a shape similar to bacteria. Finally, samples stored as dehydrated or lyophilized dry forms did neither lose their activity nor have a significant change in their size and PDI.
Based on in-depth orthogonal analytical techniques of PEI/cGAMP NCs characterization, we would select as an immunotherapy carrier the 2/1 linear PEI 25 kDa/cGAMP NCs prepared in PBS, based on its comparably low cytotoxicity, highest IFN beta expression, CD80 and CD86 marker expression on BMDC, larger size, positive surface charge and bacteria-like elongated shape. In addition, this formulation showed a high encapsulation rate for cGAMP (60%). Nevertheless, there are few challenges remaining to be solved, such as a choice of more neutral-based AF4 membrane and additional stabilization of complexes.

Supplementary Materials

The following supporting information can be downloaded at: https://www.mdpi.com/article/10.3390/pr10050882/s1, Figure S1: Size and zeta potential of PEI/cGAMP complexes; Figure S2: Viability and IFN-β expression of BMDC exposed to immunocomplexes; Figure S3: AF4 analysis of immunocomplexes; Figure S4: Concentration influence on of PEI/cGAMP complexes and stability over time.

Author Contributions

Conceptualization, M.P.; methodology, M.P. and O.J.; software, M.P.; formal analysis, M.P.; investigation, M.P.; resources, O.J. and G.B.; data curation, M.P.; writing—original draft preparation, M.P.; writing—review and editing, O.J. and G.B.; visualization, M.P.; supervision, project administration, O.J. and G.B. All authors have read and agreed to the published version of the manuscript.

Funding

This research received no external funding.

Institutional Review Board Statement

Not applicable.

Informed Consent Statement

Not applicable.

Data Availability Statement

Not applicable.

Acknowledgments

I would like to thank the following individuals for their expertise and assistance throughout all aspects of our study and for their help in writing the manuscript: Carole Bourquin, Julia Wagner, Viola Puddinu and Eloise Dupuychaffray, as well as Tayeb Jbilou for SEM imaging and AF4 training and Emmanuelle Sublet for cell culture.

Conflicts of Interest

The authors declare no conflict of interest.

References

  1. Shi, J.; Kantoff, P.W.; Wooster, R.; Farokhzad, O.C. Cancer nanomedicine: Progress, challenges and opportunities. Nat. Rev. Cancer 2017, 17, 20–37. [Google Scholar] [CrossRef] [PubMed]
  2. Foulkes, R.; Man, E.; Thind, J.; Yeung, S.; Joy, A.; Hoskins, C. The regulation of nanomaterials and nanomedicines for clinical application: Current and future perspectives. Biomater. Sci. 2020, 8, 4653–4664. [Google Scholar] [CrossRef] [PubMed]
  3. Paradise, J. Regulating Nanomedicine at the Food and Drug Administration. AMA J. Ethics 2019, 21, E347–E355. [Google Scholar] [PubMed] [Green Version]
  4. Burdette, D.L.; Vance, R.E. STING and the innate immune response to nucleic acids in the cytosol. Nat. Immunol. 2013, 14, 19–26. [Google Scholar] [CrossRef] [PubMed]
  5. Barber, G.N. STING: Infection, inflammation and cancer. Nat. Rev. Immunol. 2015, 15, 760–770. [Google Scholar] [CrossRef] [Green Version]
  6. Liu, Y.; Jesus, A.A.; Marrero, B.; Yang, D.; Ramsey, S.E.; Sanchez, G.A.M.; Tenbrock, K.; Wittkowski, H.; Jones, O.Y.; Kuehn, H.S.; et al. Activated STING in a vascular and pulmonary syndrome. N. Engl. J. Med. 2014, 371, 507–518. [Google Scholar] [CrossRef] [Green Version]
  7. Li, T.; Cheng, H.; Yuan, H.; Xu, Q.; Shu, C.; Zhang, Y.; Xu, P.; Tan, J.; Rui, Y.; Li, P.; et al. Antitumor Activity of cGAMP via Stimulation of cGAS-cGAMP-STING-IRF3 Mediated Innate Immune Response. Sci. Rep. 2016, 6, 19049. [Google Scholar] [CrossRef] [PubMed] [Green Version]
  8. Zhang, H.; Lyden, D. Asymmetric-flow field-flow fractionation technology for exomere and small extracellular vesicle separation and characterization. Nat. Protoc. 2019, 14, 1027–1053. [Google Scholar] [CrossRef]
  9. Gulen, M.F.; Koch, U.; Haag, S.M.; Schuler, F.; Apetoh, L.; Villunger, A.; Radtke, F.; Ablasser, A. Signalling strength determines proapoptotic functions of STING. Nat. Commun. 2017, 8, 427. [Google Scholar] [CrossRef]
  10. Larkin, B.; Ilyukha, V.; Sorokin, M.; Buzdin, A.; Vannier, E.; Poltorak, A. Cutting Edge: Activation of STING in T Cells Induces Type I IFN Responses and Cell Death. J. Immunol. 2017, 199, 397–402. [Google Scholar] [CrossRef] [Green Version]
  11. Zou, Y.; Li, D.; Shen, M.; Shi, X. Polyethylenimine-Based Nanogels for Biomedical Applications. Macromol. Biosci. 2019, 19, e1900272. [Google Scholar] [CrossRef] [PubMed]
  12. Lv, Y.; Sun, Q.; Wang, X.; Lu, Y.; Li, Y.; Yuan, H.; Zhu, J.; Zhu, D. Highly Efficient Preparation of Cyclic Dinucleotides via Engineering of Dinucleotide Cyclases in Escherichia coli. Front. Microbiol. 2019, 10, 2111. [Google Scholar] [CrossRef] [PubMed] [Green Version]
  13. Ernsting, M.J.; Murakami, M.; Roy, A.; Li, S.D. Factors controlling the pharmacokinetics, biodistribution and intratumoral penetration of nanoparticles. J. Control. Release 2013, 172, 782–794. [Google Scholar] [CrossRef] [PubMed] [Green Version]
  14. Petrovic, M.; Borchard, G.; Jordan, O. Considerations for the delivery of STING ligands in cancer immunotherapy. J. Control. Release 2021, 339, 235–247. [Google Scholar] [CrossRef]
  15. Kettler, K.; Veltman, K.; van de Meent, D.; van Wezel, A.; Hendriks, A.J. Cellular uptake of nanoparticles as determined by particle properties, experimental conditions, and cell type. Environ. Toxicol. Chem. 2014, 33, 481–492. [Google Scholar] [CrossRef] [PubMed]
  16. Gustafson, H.H.; Holt-Casper, D.; Grainger, D.W.; Ghandehari, H. Nanoparticle Uptake: The Phagocyte Problem. Nano Today 2015, 10, 487–510. [Google Scholar] [CrossRef] [Green Version]
  17. Kazemi Oskuee, R.; Dabbaghi, M.; Gholami, L.; Taheri-Bojd, S.; Balali-Mood, M.; Mousavi, S.H.; Malaekeh-Nikouei, B. Investigating the influence of polyplex size on toxicity properties of polyethylenimine mediated gene delivery. Life Sci. 2018, 197, 101–108. [Google Scholar] [CrossRef]
  18. Xiao, K.; Li, Y.; Luo, J.; Lee, J.S.; Xiao, W.; Gonik, A.M.; Agarwal, R.G.; Lam, K.S. The effect of surface charge on in vivo biodistribution of PEG-oligocholic acid based micellar nanoparticles. Biomaterials 2011, 32, 3435–3446. [Google Scholar] [CrossRef] [Green Version]
  19. Fröhlich, E. The role of surface charge in cellular uptake and cytotoxicity of medical nanoparticles. Int. J. Nanomed. 2012, 7, 5577–5591. [Google Scholar] [CrossRef] [Green Version]
  20. Caputo, F.; Clogston, J.; Calzolai, L.; Rösslein, M.; Prina-Mello, A. Measuring particle size distribution of nanoparticle enabled medicinal products, the joint view of EUNCL and NCI-NCL. A step by step approach combining orthogonal measurements with increasing complexity. J. Control. Release 2019, 299, 31–43. [Google Scholar] [CrossRef]
  21. Tang, M.X.; Szoka, F.C. The influence of polymer structure on the interactions of cationic polymers with DNA and morphology of the resulting complexes. Gene Ther. 1997, 4, 823–832. [Google Scholar] [CrossRef] [PubMed] [Green Version]
  22. Wolfert, M.A.; Dash, P.R.; Nazarova, O.; Oupicky, D.; Seymour, L.W.; Smart, S.; Strohalm, J.; Ulbrich, K. Polyelectrolyte vectors for gene delivery: Influence of cationic polymer on biophysical properties of complexes formed with DNA. Bioconjugate Chem. 1999, 10, 993–1004. [Google Scholar] [CrossRef] [PubMed]
  23. Bremer-Hoffmann, S.; Halamoda-Kenzaoui, B.; Borgos, S.E. Identification of regulatory needs for nanomedicines. J. Interdiscip. Nanomed. 2018, 3, 4–15. [Google Scholar] [CrossRef]
  24. Elsabahy, M.; Wooley, K.L. Design of polymeric nanoparticles for biomedical delivery applications. Chem. Soc. Rev. 2012, 41, 2545–2561. [Google Scholar] [CrossRef] [Green Version]
  25. Fornaguera, C.; Solans, C. Characterization of Polymeric Nanoparticle Dispersions for Biomedical Applications: Size, Surface Charge and Stability. Pharm. Nanotechnol. 2018, 6, 147–164. [Google Scholar] [CrossRef] [PubMed]
  26. Eaton, P.; Quaresma, P.; Soares, C.; Neves, C.; de Almeida, M.P.; Pereira, E.; West, P. A direct comparison of experimental methods to measure dimensions of synthetic nanoparticles. Ultramicroscopy 2017, 182, 179–190. [Google Scholar] [CrossRef] [PubMed]
  27. Barrett, D.M.; Singh, N.; Porter, D.L.; Grupp, S.A.; June, C.H. Chimeric antigen receptor therapy for cancer. Annu. Rev. Med. 2014, 65, 333–347. [Google Scholar] [CrossRef] [PubMed] [Green Version]
  28. Caputo, F.; Mehn, D.; Clogston, J.D.; Rösslein, M.; Prina-Mello, A.; Borgos, S.E.; Gioria, S.; Calzolai, L. Asymmetric-flow field-flow fractionation for measuring particle size, drug loading and (in)stability of nanopharmaceuticals. The joint view of European Union Nanomedicine Characterization Laboratory and National Cancer Institute-Nanotechnology Characterization Laboratory. J. Chromatogr. A 2021, 1635, 461767. [Google Scholar] [PubMed]
  29. Zheng, T.; Bott, S.; Huo, Q. Techniques for Accurate Sizing of Gold Nanoparticles Using Dynamic Light Scattering with Particular Application to Chemical and Biological Sensing Based on Aggregate Formation. ACS Appl. Mater. Interfaces 2016, 8, 21585–21594. [Google Scholar] [CrossRef]
  30. Hou, J.; Ci, H.; Wang, P.; Wang, C.; Lv, B.; Miao, L.; You, G. Nanoparticle tracking analysis versus dynamic light scattering: Case study on the effect of Ca2+ and alginate on the aggregation of cerium oxide nanoparticles. J. Hazard. Mater. 2018, 360, 319–328. [Google Scholar] [CrossRef]
  31. Kim, A.; Ng, W.B.; Bernt, W.; Cho, N.J. Validation of Size Estimation of Nanoparticle Tracking Analysis on Polydisperse Macromolecule Assembly. Sci. Rep. 2019, 9, 2639. [Google Scholar] [CrossRef] [PubMed] [Green Version]
  32. Yeap, S.P.; Lim, J.; Ngang, H.P.; Ooi, B.S.; Ahmad, A.L. Role of Particle-Particle Interaction Towards Effective Interpretation of Z-Average and Particle Size Distributions from Dynamic Light Scattering (DLS) Analysis. J. Nanosci. Nanotechnol. 2018, 18, 6957–6964. [Google Scholar] [CrossRef] [PubMed]
  33. Fuster, J.; Negro, S.; Salama, A.; Fernández-Carballido, A.; Marcianes, P.; Boeva, L.; Barcia, E. HPLC-UV method development and validation for the quantification of ropinirole in new PLGA multiparticulate systems: Microspheres and nanoparticles. Int. J. Pharm. 2015, 491, 310–317. [Google Scholar] [CrossRef] [PubMed]
  34. Colombo, M.; Melchiades, G.L.; Figueiró, F.; Battastini, A.M.O.; Teixeira, H.F.; Koester, L.S. Validation of an HPLC-UV method for analysis of Kaempferol-loaded nanoemulsion and its application to in vitro and in vivo tests. J. Pharm. Biomed. Anal. 2017, 145, 831–837. [Google Scholar] [CrossRef]
  35. Guo, P.; Li, Y.; An, J.; Shen, S.; Dou, H. Study on structure-function of starch by asymmetrical flow field-flow fractionation coupled with multiple detectors: A review. Carbohydr. Polym. 2019, 226, 115330. [Google Scholar] [CrossRef]
  36. Amaro-Gahete, J.; Benítez, A.; Otero, R.; Esquivel, D.; Jiménez-Sanchidrián, C.; Morales, J.; Caballero, Á.; Romero-Salguero, F.J. A Comparative Study of Particle Size Distribution of Graphene Nanosheets Synthesized by an Ultrasound-Assisted Method. Nanomaterials 2019, 9, 152. [Google Scholar] [CrossRef] [Green Version]
  37. Bhattacharjee, S. DLS and zeta potential—What they are and what they are not? J. Control. Release 2016, 235, 337–351. [Google Scholar] [CrossRef]
  38. Wilson, D.R.; Green, J.J. Nanoparticle Tracking Analysis for Determination of Hydrodynamic Diameter, Concentration, and Zeta-Potential of Polyplex Nanoparticles. Methods Mol. Biol. 2017, 1570, 31–46. [Google Scholar]
  39. Desai, K.G. Chitosan Nanoparticles Prepared by Ionotropic Gelation: An Overview of Recent Advances. Crit. Rev. Ther. Drug Carr. Syst. 2016, 33, 107–158. [Google Scholar] [CrossRef]
  40. Vaezifar, S.; Razavi, S.; Golozar, M.A.; Karbasi, S.; Morshed, M.; Kamali, M. Effects of Some Parameters on Particle Size Distribution of Chitosan Nanoparticles Prepared by Ionic Gelation Method. J. Clust. Sci. 2013, 24, 891–903. [Google Scholar] [CrossRef]
  41. Paillet, S.; Grassl, B.; Desbrières, J. Rapid and quantitative determination of critical micelle concentration by automatic continuous mixing and static light scattering. Anal. Chim. Acta 2009, 636, 236–241. [Google Scholar] [CrossRef] [PubMed]
  42. Nwoko, K.C.; Liang, X.; Perez, M.A.; Krupp, E.; Gadd, G.M.; Feldmann, J. Characterisation of selenium and tellurium nanoparticles produced by Aureobasidium pullulans using a multi-method approach. J. Chromatogr. A 2021, 1642, 462022. [Google Scholar] [CrossRef] [PubMed]
  43. Li, B.; Chua, S.L.; Yu, D.; Chan, S.H.; Li, A. Separation and size characterization of highly polydisperse titanium dioxide nanoparticles (E171) in powdered beverages by using Asymmetric Flow Field-Flow Fractionation hyphenated with Multi-Angle Light Scattering and Inductively Coupled Plasma Mass Spectrometry. J. Chromatogr. A 2021, 1643, 462059. [Google Scholar] [PubMed]
  44. Andersson, M.; Wittgren, B.; Wahlund, K.G. Accuracy in multiangle light scattering measurements for molar mass and radius estimations. Model calculations and experiments. Anal. Chem. 2003, 75, 4279–4291. [Google Scholar] [CrossRef] [PubMed]
  45. Helft, J.; Böttcher, J.; Chakravarty, P.; Zelenay, S.; Huotari, J.; Schraml, B.U.; Goubau, D.; Reis e Sousa, C. GM-CSF Mouse Bone Marrow Cultures Comprise a Heterogeneous Population of CD11c+MHCII+ Macrophages and Dendritic Cells. Immunity 2015, 42, 1197–1211. [Google Scholar] [CrossRef] [Green Version]
  46. Sun, C.; Tang, T.; Uludağ, H.; Cuervo, J.E. Molecular dynamics simulations of DNA/PEI complexes: Effect of PEI branching and protonation state. Biophys. J. 2011, 100, 2754–2763. [Google Scholar] [CrossRef] [Green Version]
  47. Edet Uwem, O.; Gihan, H.; Poussy Abu El, W.; Opetiti, A.; Nicole, C.; Elecia, H. In-vitro cytotoxicity of Polyethyleneimine on HeLa and Vero Cells. Int. J. Innov. Appl. Stud. 2014, 5, 192–199. [Google Scholar]
  48. Kafil, V.; Omidi, Y. Cytotoxic impacts of linear and branched polyethylenimine nanostructures in a431 cells. BioImpacts 2011, 1, 23–30. [Google Scholar]
  49. Sansom, D.M.; Manzotti, C.N.; Zheng, Y. What’s difference between CD80 and CD86? Trends Immunol. 2003, 24, 314–319. [Google Scholar] [CrossRef]
  50. Pandey, A.P.; Sawant, K.K. Polyethylenimine: A versatile, multifunctional non-viral vector for nucleic acid delivery. Mater. Sci. Eng. C Mater. Biol. Appl. 2016, 68, 904–918. [Google Scholar] [CrossRef]
  51. Marioli, M.; Kok, W.T. Recovery, overloading, and protein interactions in asymmetrical flow field-flow fractionation. Anal. Bioanal. Chem. 2019, 411, 2327–2338. [Google Scholar] [CrossRef] [PubMed] [Green Version]
Figure 1. DLS: Media influence on size (z-average) and PDI of PEI/cGAMP NCs (0.01 mg/mL) prepared with (a) linear PEI 4 kDa, pH 7; (b) linear PEI 25 kDa, pH 7; (c) branched PEI 1.2 kDa pH 9; (d) branched PEI 10 kDa pH 9. Influence of the composition of different 0.01 mg/mL PEI/cGAMP NC on (e) pH and (f) zeta potential. pH and zeta potential measurements were performed in water. n = 3; ** p < 0.01; *** p < 0.001; **** p < 0.0001.
Processes 10 00882 g001aProcesses 10 00882 g001bProcesses 10 00882 g001c
Figure 2. (a) WST-1, mitochondrial activity of BMDC after 24 h of exposure to 0.01 mg/mL PEI/cGAMP NCc, (b) ELISA, IFN βlevel of after 2 h of exposure to PEI/cGAMP NCs, fresh media replacement and 24 h collection and (c) 24 h NCs exposure to BMDC, CD80/86 marker expression. n = 3; * p < 0.05.
Processes 10 00882 g002aProcesses 10 00882 g002b
Figure 3. (a) AF4/UV, cGAMP calibration curve for ε determination. (b) Recovery comparison in between three independently injected cGAMP solutions (5 µg) via method—cf application and no cf application. (c) Cleaning protocol for method: 1. Acetic buffer pH 4 0.1 M; 2. water run; 3. Sample run; 4. 0.1% SDS run. n = 3.
Processes 10 00882 g003aProcesses 10 00882 g003b
Figure 4. DLS (z-average and numbers), NTA and AF4-UV-MALS-RI-DLS (Dg and Dh) comparison of empty (linP25) and loaded NCs, graphical and table representation of the values at 0.01 mg/mL. n = 3; **** p < 0.0001.
Processes 10 00882 g004
Figure 5. AF4-UV, graph overlap of cGAMP, linP25 and 1/1 linP25/cGAMP NCs. (a) AF4-UV, graph overlap of cGAMP, linP25 and 1/1 linP25/cGAMP NCs, (b) AF4-UV, graph overlap of cGAMP, linP25 and 2/1 linP25/cGAMP NCs (c) UPLC-UV, encapsulation efficiency vs. AF4-UV recovery of 1/1 and 2/1 NCs, (d) AF4-DLS, shape factor Rg/Rh and (e) SEM: dehydrated and lyophilized samples of 1/1 and 2/1 NCs. n = 3.
Processes 10 00882 g005aProcesses 10 00882 g005bProcesses 10 00882 g005c
Figure 6. DLS, (a) storage stability of lyophilized and dehydrated NCs compared to the freshly prepared ones. (b) ELISA, IFN beta, graph overlap of linP25 and 2/1 linP25/cGAMP NCs; n = 3.
Processes 10 00882 g006aProcesses 10 00882 g006b
Table 1. Parameters for AF4 method—Detector flow was kept at 0.5 mL/min.
FOCUS STEPTIP flow0.20 mL/min3 min
Cross flow1 mL/min3 min
Focus flow1.30 mL/min0.2 min
ELUTION STEPConstant cross flow1 mL/min0.2 min
Exponential cross flow power 0.21–0.1 mL/min10 min
Linear cross flow0.1–0 mL/min10 min
RINSE STEPTIP flow0.1 mL/min0.5 min
Focus flow0.1 mL/min0.5 min
Publisher’s Note: MDPI stays neutral with regard to jurisdictional claims in published maps and institutional affiliations.

