Article

Fracture Interference and Refracturing of Horizontal Wells

The Unconventional Oil and Gas Institute, China University of Petroleum, Beijing 102249, China
*
Author to whom correspondence should be addressed.
Processes 2022, 10(5), 899; https://doi.org/10.3390/pr10050899
Submission received: 4 April 2022 / Revised: 25 April 2022 / Accepted: 28 April 2022 / Published: 2 May 2022

Abstract

:
Due to fracture interference, not all perforations can be fractured, resulting in 20% of fractures contributing to 80% of the total production. The extraction of oil and gas also reduces production, necessitating refracturing. In this study, the finite element method was used to simulate multiple fractures fracturing simultaneously and the stress field distribution was then extracted and applied to a new geological model. This paper explains the effect of stress around the horizontal wellbore on new fractures during the refracturing of old wells using a temporary plugging technique. The results show that initial breaking pressures are the same, but as fractures extend, inter-fracture interference increases, resulting in different fracture extension pressures and widths. The fracturing fluid is filtered into the reservoir matrix after fracturing, reducing formation stress. Compared with fracturing at the initial fracture site, reperforating fracturing has a lower fracture extension pressure and a longer fracture length. According to this study, hydraulic fractures have a 15 m effective influence radius on the external formation. Stress relief is beneficial for fracture initiation prior to refracturing. Reperforating and fracturing, in combination with temporary plugging technology, can assist in increasing the effective stimulated reservoir volume and achieving high and stable production.

1. Introduction

Tight oil and gas, shale oil and gas, and other resources have a lot of potential for exploration and development [1,2,3]. However, because most unconventional oil and gas resources have low porosity and permeability, they are unable to achieve industrial productivity without the use of special reservoir stimulation techniques [4]. The hydraulic fracturing process must be thoroughly studied, in terms of the mechanical properties of the reservoir rock, the distribution of the in situ stress field, the migration of the fracturing fluid in the porous medium, and the natural fracture system inside the reservoir, in order to improve the stimulation effect of unconventional oil and gas reservoirs [5]. Systematically hydraulic fracturing research is a multidisciplinary scientific problem that involves rock mechanics, engineering fluid mechanics, fracture mechanics, and seepage mechanics [4].
Horizontal well drilling and staged volume fracturing are two key technologies for improving oil and gas recovery in unconventional reservoirs [4,6,7,8]. The goal is to create a spatial fracture network and increase reservoir stimulation volume, thereby increasing the reservoir drainage area and overall drainage capacity of the region, as well as improving single-well production and ultimate recovery [9,10,11]. For the staged stimulation of horizontal wells in unconventional reservoirs in North America, the cluster spacing has been reduced from 20–30 m to 5–10 m. The formation of network fractures between clusters is no longer a necessary condition when the cluster spacing is small and the oil and gas functions in the matrix are essentially unobstructed [9]. The fluid pressure in the fractures, as well as the stress shadow exerted by the surrounding fractures, affect the simultaneous expansion of multiple fractures [8,12]. The stress field around the fracture changes results in discrepancies in the geometry and parameters of the fractures [13]. The effect of the stimulated reservoir volume (SRV), which has a significant impact on improving the productivity of oil and gas wells, is related to the mutual interference of multiple fractures [14].

1.1. Decline in Production Capacity and Low Recovery

Hydraulic fractures improve the conductivity of reservoirs that were previously deemed uneconomical due to permeability issues. The recovery factor of unconventional shale reservoirs, even with closely spaced hydraulic fractures, remains extremely low (as low as 4% for Midland Basin wells) [15].
During pressure depletion, effective stress rises, fracture conductivity deteriorates at different rates, and fracture opening decreases due to compaction [16,17]. The reduction in fracture opening can result in a 50 percent reduction in oil recovery [18].
The impacts of the change in hydraulic fracture conductivity are evaluated on pressure depletion patterns and drained rock volume (DRV). The tracer front advance represents an extreme case of a high flow-rate well (Figure 1a,). After one month of production, the DRVs around individual hydraulic fractures in most Eagle Ford and Wolfcamp shale wells were negligibly small (Figure 1b) [18].
Understanding fluid withdrawal patterns and rates in unconventional reservoirs requires a careful distinction between convective fluid depletion (DRV) and diffusive pressure depletion zones (SRV) [19,20].

1.2. Inter-Fracture Stress Interference

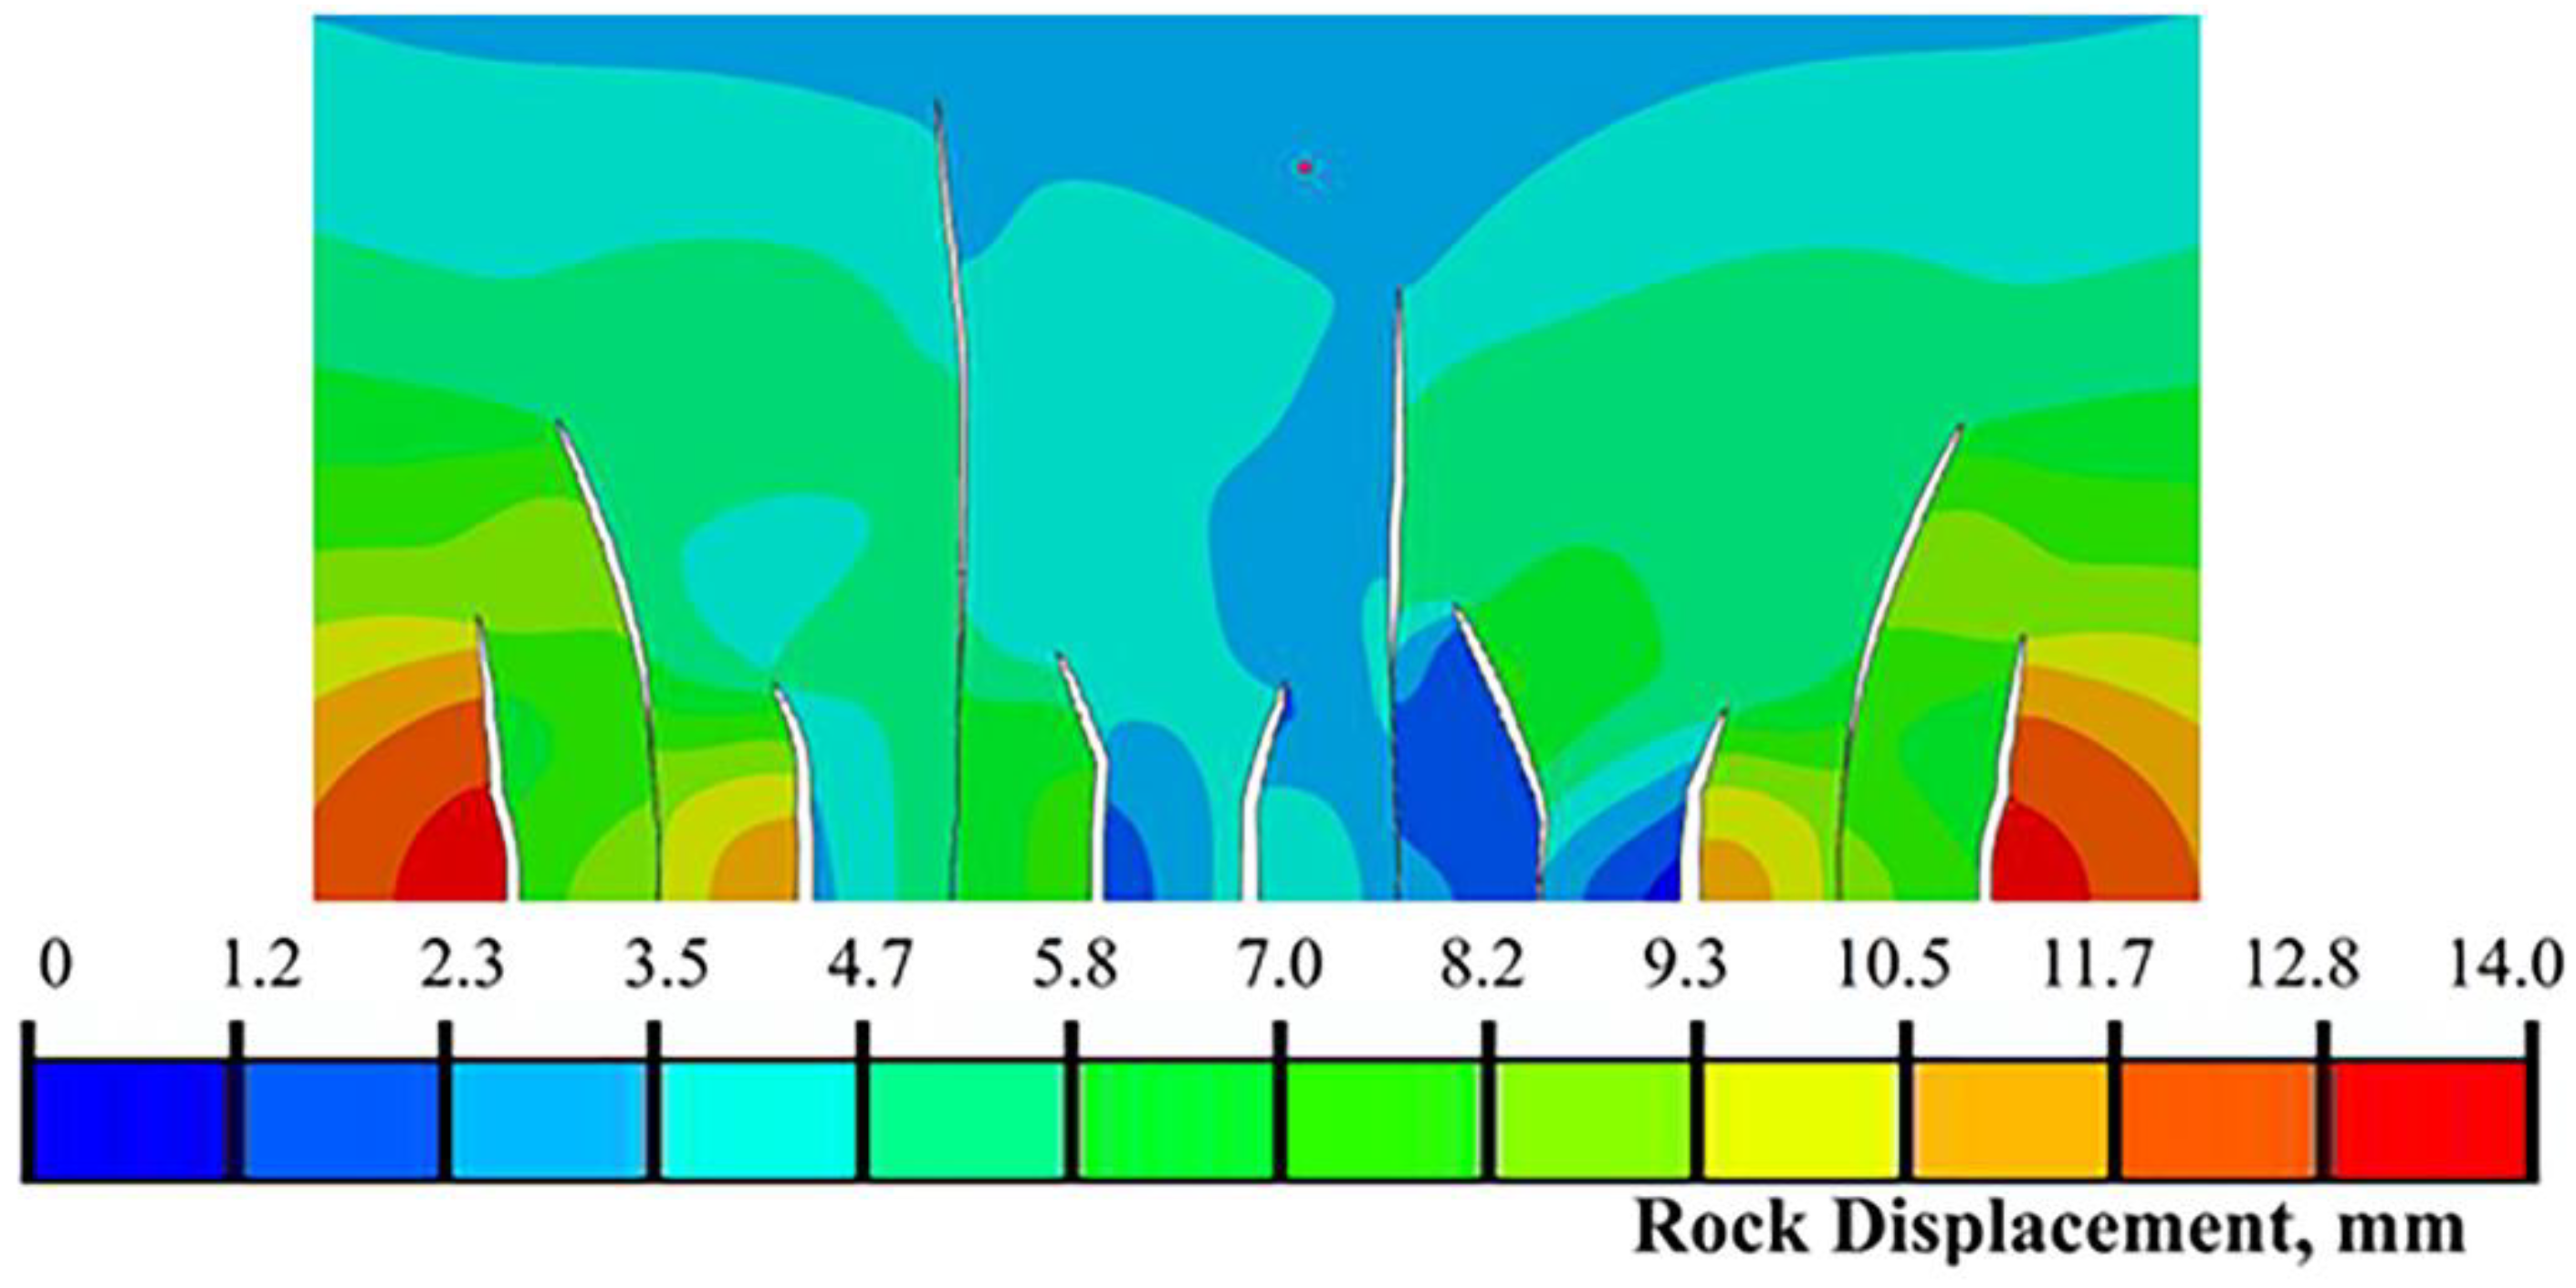
Geomechanical stress shadowing effects during rock fracturing have been shown in recent studies to cause significant spatial variation in hydraulic fracture quality. In a section with three clusters, for example, only one “superfracture” may consume all of the injected fluid, resulting in fracture performance that differs significantly from the expected completion design [12,18]. Fracture clusters form a complex hydraulic–mechanical coupling system, resulting in fracture propagation geometries and reservoir mechanical responses that are significantly different from individual fractures, as shown in Figure 2 [4,21].
When an oil well is hydraulically fractured, the fracture propagation from the wellbore is determined by the reservoir’s far-field stress. Fracture initiation from the wellbore, on the other hand, is heavily reliant on the stress state passing through the wellbore [22].
Sneddon theoretically studied the stress field around a single fracture in an infinite elastic body under the condition of contained hydraulic pressure as early as 1964 and deduced the calculation formula for the stress field around a single hydraulic fracture in an infinite elastic body under the condition of contained hydraulic pressure [23].
Warpinski et al. (1987) published an analytical solution to the stress field exerted by an infinite vertical fracture on the surrounding rock mass when the fracture height remains constant [24].
Based on the elastic mechanics calculation principle, Liu (2004), Deng (2005), and others developed a mathematical model of the induced stress field of refracturing gas wells and conducted quantitative analysis [25,26].
Cheng (2009) used the displacement discontinuity method (DDM) to investigate the stress field changes around hydraulic fractures and their effects on the geometry of new hydraulic fractures theoretically [27].
Nagel (2011) and Yoon (2015) established numerical models using finite element and discrete element software to analyze the influencing factors of stress shadows and use them to guide on-site fracturing construction, respectively. Regarding in situ stress anisotropy on hydraulic fractures [28,29], Proppant placement has a clear effect [30].
The “stress shadow” has a strong influence on the fracture width when a complex fracture network is formed, affecting the flow distribution of each perforation cluster, the shape of the entire fracture network, and the spread of proppant [31].
Cheng et al. (2014) and Dehghan (2020) studied the effects of natural fractures and horizontal stress on hydraulic fracture propagation in a series of hydraulic fracturing experiments [6,32].
Zeng et al. (2015) developed a mathematical model for the simultaneous expansion of multiple fractures and numerically simulated the simultaneous expansion of multiple fractures in horizontal wells using the extended finite element method [13,33].
Ren (2016) solved the problem of stress interference in the process of multi-fracture propagation using the improved displacement discontinuity method and the finite element numerical solution method, proposed a mathematical model of fluid distribution in fractures, and simulated the volume fracturing network of horizontal wells in tight reservoirs [10].
Under the conditions of different anisotropic in situ stress fields and initial fracturing spacing, Xia and Zeng (2018) investigated the effect of stress shadowing on the initiation pressure and propagation form of new hydraulic fractures. The initial hydraulic fracture restricts the expansion of the new hydraulic fracture, making it difficult to form a complex fracture network [34].
Wang (2018) discovered that the initial in situ stress was redistributed as a result of the fractures that were first opened, making subsequent fractures more difficult to initiate and extend [35].
Gao et al. (2019) developed a two-dimensional fluid–solid fully coupled geomechanical model based on the cohesive element model, which can simulate hydraulic fracture initiation and extension, fracturing fluid flow and filtration, pore fluid seepage, and rock deformation [36].
Zuo et al. (2020) investigated the effects of various factors on hydraulic fracturing initiation pressure and failure mode [37].
On a laboratory scale, Shokouhi et al. (2020) investigated the coupling between elastic and hydraulic properties of rocks [38].
Weijermars, Wang, and Nelson et al. (2020) used stress field stacking to systematically analyze stress changes near horizontal well sections in shale and clay formations [39].

1.3. Fracturing Fluid Filtration Loss and Variation of Pore Pressure

According to previous research, fluid leakage into the formation changes the local pore pressure to control the length and direction of the fracture, resulting in changes in the magnitude and direction of the local principal stress around the fracture tip [40,41,42,43,44].
Fluid flow inside fractures was realistically modelled by Gholami, Aghighi, and Rahman (2017), taking into account fracturing fluid loading on the fracture walls and fluid leakage into the formation [40].
Gao et al. (2019) discovered that downhole fluid injection and production frequently cause pore pressure changes and stress inversions, which affect the propagation behavior of hydraulic fractures [36].
Dehghan et al. (2020) also mentioned that fracturing fluid loss influences the minimum stress, which has a well-known effect on fracture propagation pressure and fracture height growth [6].
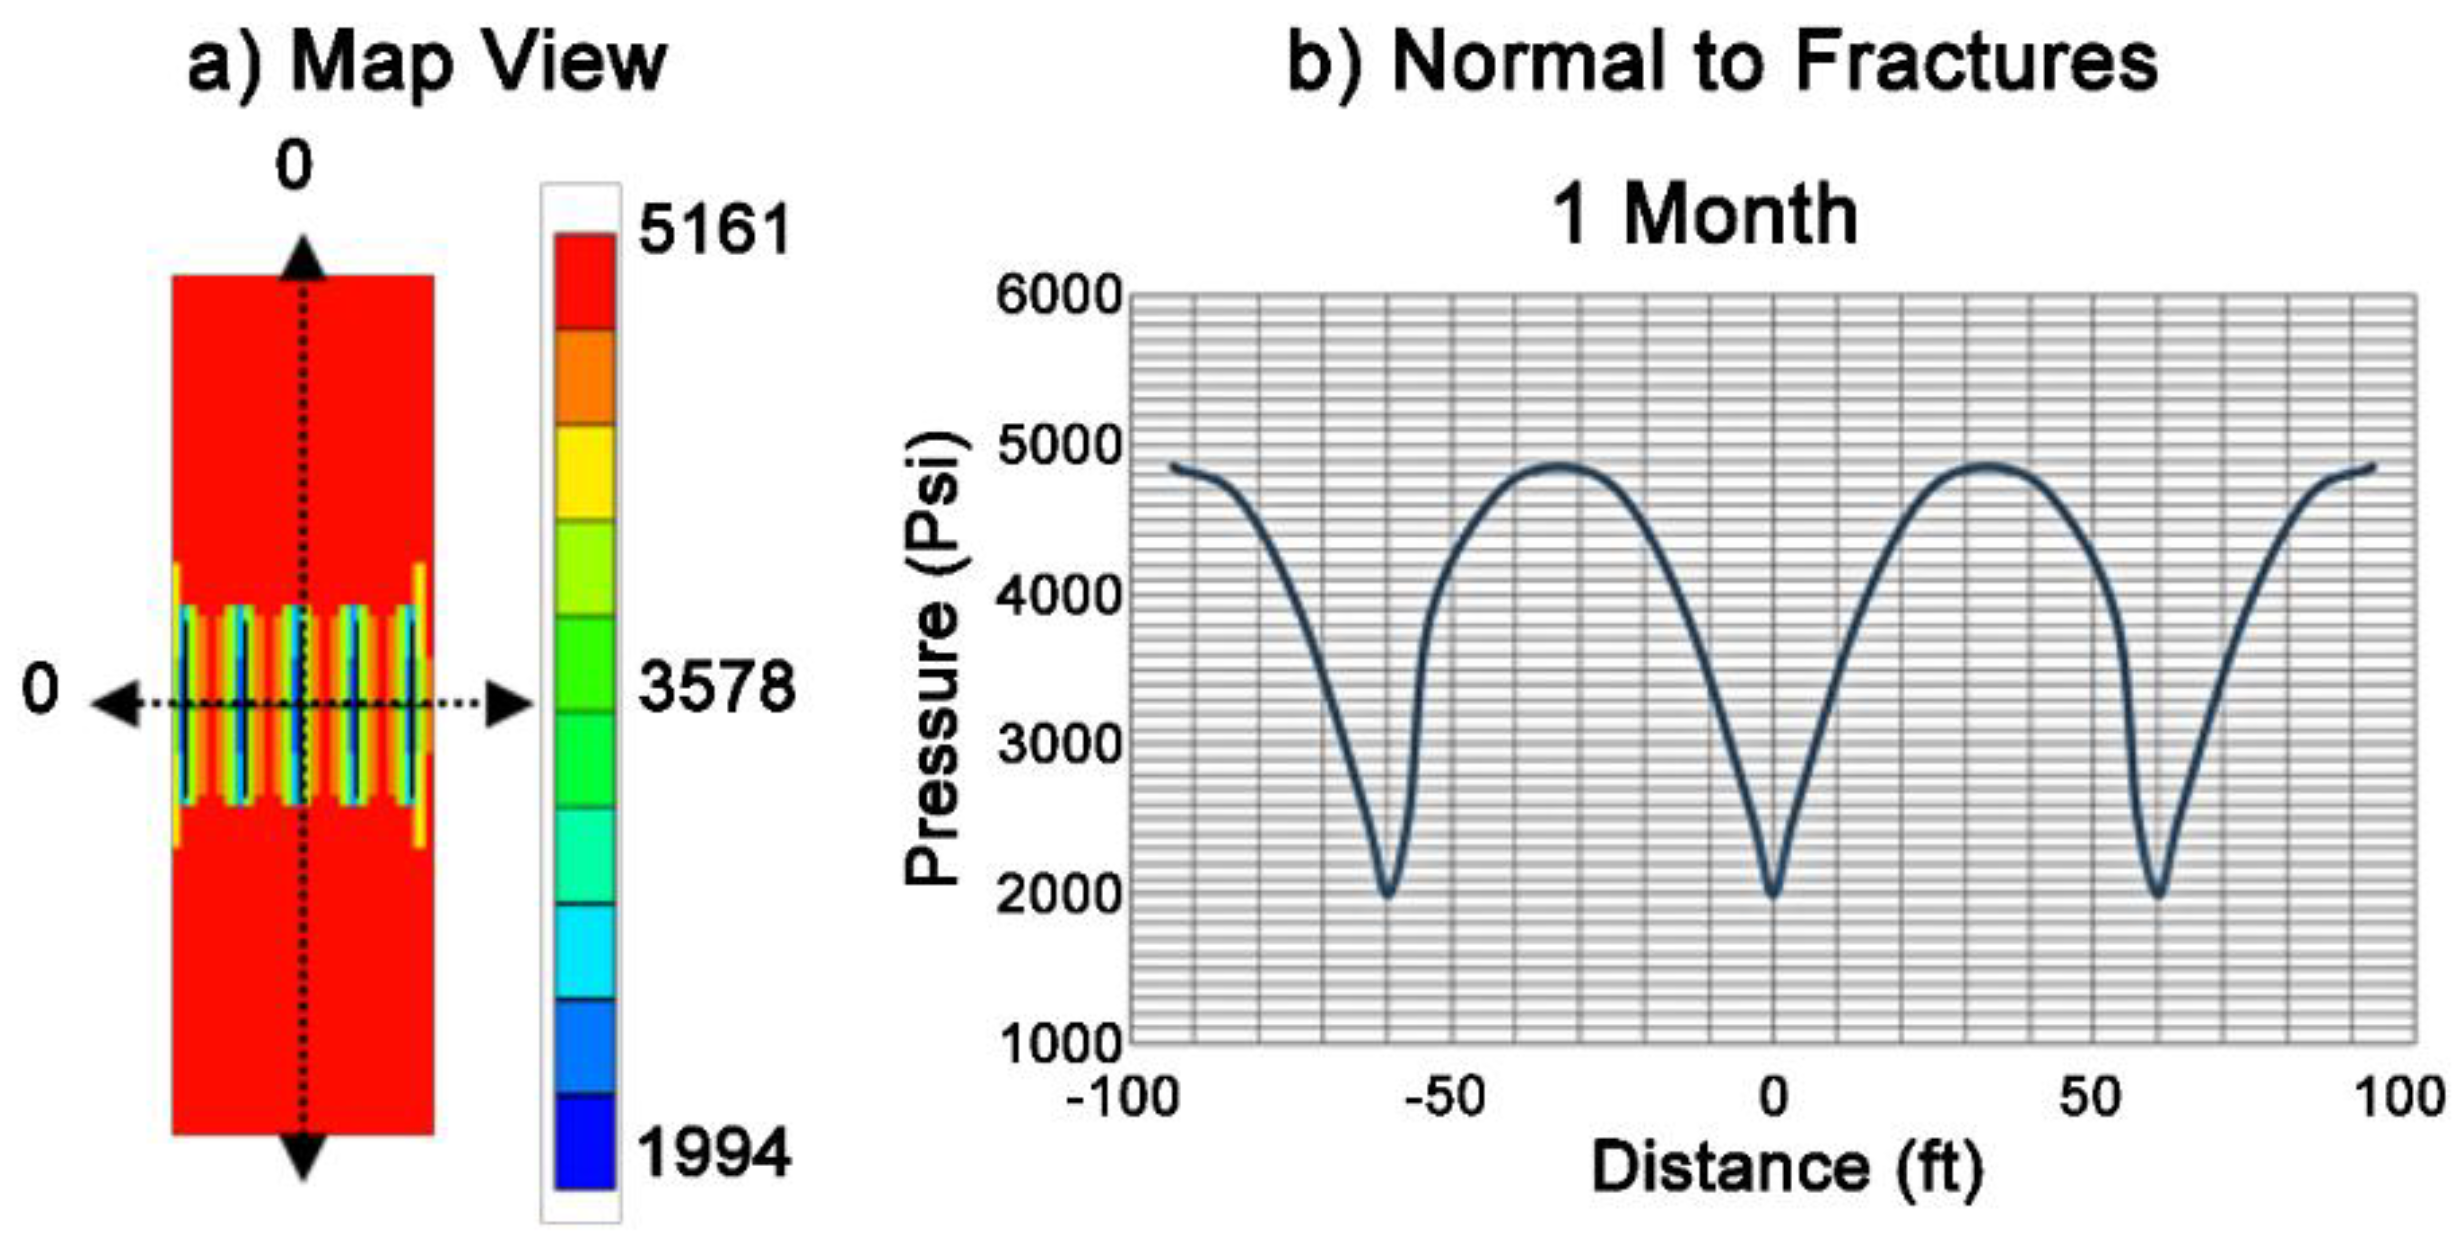
Weijermars (2019) discovered that pressure communication between closely spaced hydraulic fractures is established quickly in most shale wells (Figure 3). The pressure gradient normal to the fractures in Figure 3 (for a Wolfcamp well with 100 nD matrix permeability) shows that the original reservoir pressure of 4800 psi has already been reduced everywhere between the fractures after one month of production [44].
As shown in Figure 4, Khanal and Weijermars (2020) used a complex analytical model (CAM) to investigate the fluid production rate and pressure drop after multi-fracture fracturing [18].
As shown in Figure 4, the pressure around the fracture gradually decreases as production progresses, necessitating refracturing operations. Refracturing technology measures can effectively increase reservoir stimulation volume and supplement formation energy, improve single well production, and extend the stable production period [45,46,47]. However, initial fractures disrupt the in situ stress field around the wellbore and long-term production influences formation pressure, resulting in a more complex formation environment for refracturing [48,49,50,51].

2. Theory and Model Design

2.1. Calculation of Multi-Fracture Interference Stress Field

To explain the superposition of the strain near the wellbore due to far-field deformation and the radial strain due to the pressure load inside the wellbore effect, Weijermars, Pham, and Ettehad (2020) used the linear superposition method (LSM) of the stress tensor field and displacement vector field [52].
The displacement field equation for multiple cracks is:
u x = i = 1 n P 0 , i ( 1 + v ) E [ ( 1 2 v ) ( r 1 , i r 2 , i cos θ 1 , i + θ 2 , i 2 r i cos θ i ) r i 2 r 1 , i r 2 , i sin θ i sin ( θ i θ 1 , i + θ 2 , i 2 ) ]
u y = i = 1 n P 0 , i ( 1 + v ) E [ 2 ( 1 v ) ( r 1 , i r 2 , i sin θ 1 , i + θ 2 , i 2 r i sin θ i ) + r i sin θ i [ 1 r i r 1 , i r 2 , i cos ( θ i θ 1 , i + θ 2 , i 2 ) ] ]
where (r, θ) is a polar coordinate system with its origin at the fracture tip and θ = 0 means tangential to the fracture tip. ux, uy is the displacement of the target point near the wellbore, m; n is the number of fractures; P0,i is the pressure of the fluid in the fracture, MPa; E is the Young’s modulus of the rock, GPa; ν is the Poisson’s ratio; r1,i, r2,i, and ri are the distances from the two endpoints and the midpoint of the fracture to the target point, m; θ1,i, θ2,i, and θi are the angles from the two endpoints and the midpoint of the crack to the target point, respectively.
The displacement of cracks can be calculated, superposed, and added using Equations (1) and (2). The plane strain constitutive equation is used to calculate strain tensors and convert them to stress magnitudes. The superposition formulae in Equations (1) and (2) completely describe the characteristics of each fracture and their interaction with one another, resulting in displacements, strains, stresses, and stress orientations throughout the elastic continuum. It is important to remember that each fracture has its own fracture geometry, orientation, and internal loaded pressure.

2.2. Fracturing Fluid Flow and Filtration

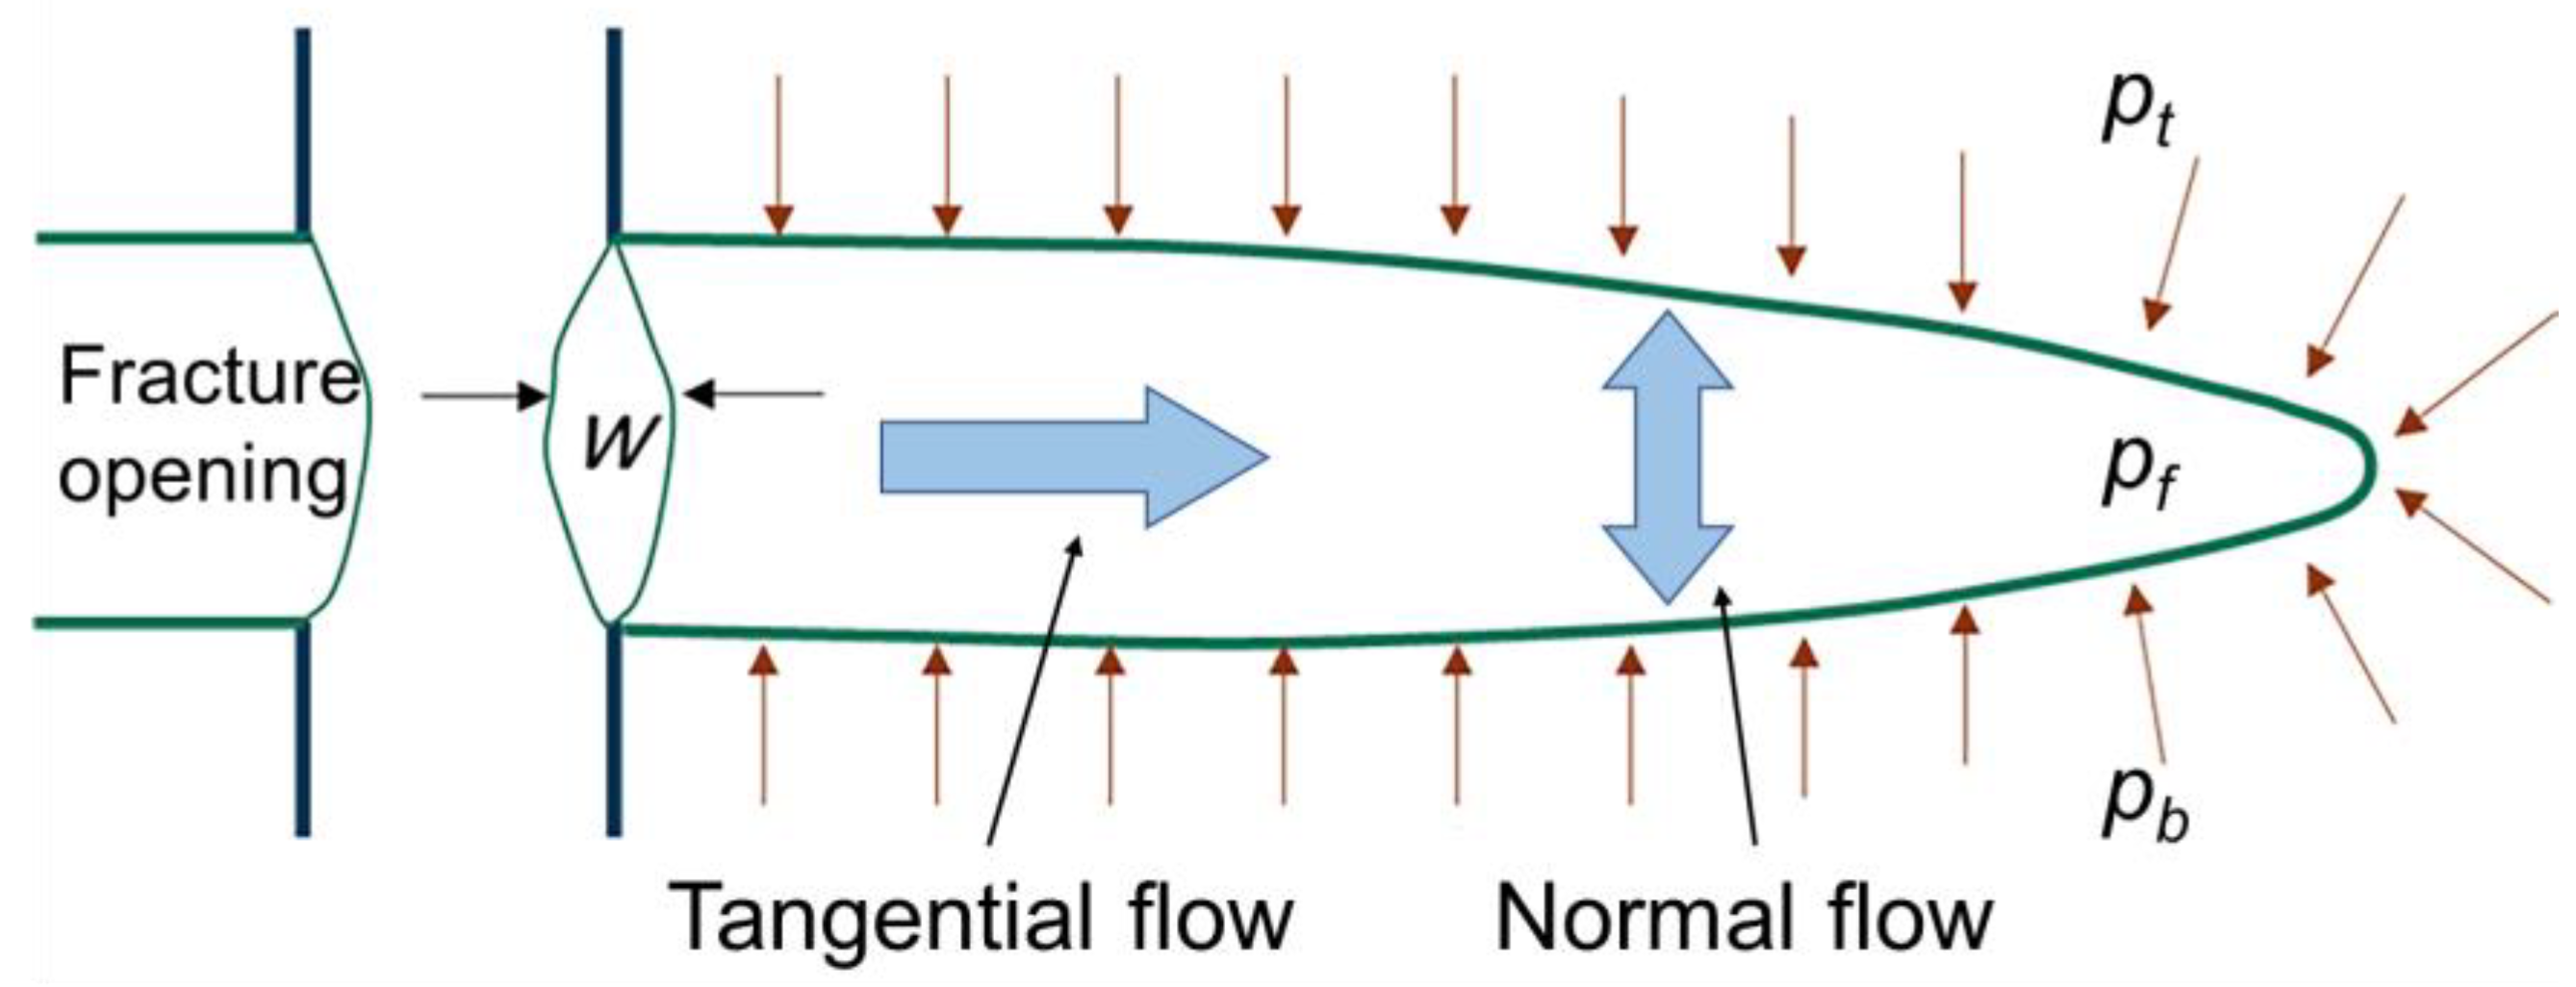
Hydraulic fracturing is frequently used in low permeability rocks to increase the flow of oil and/or gas to a well from both conventional and unconventional hydrocarbon reservoirs [53]. Fracturing fluid constitutive response inside the hydraulic fracture is made up of two parts: tangential flow along the fracture surfaces and normal flow (i.e., leak-off) across the fracture surfaces, as shown in Figure 5. The Poiseuille equation can be used to calculate the tangential fluid flow rate between two parallel plates in the case of a Newtonian fracturing fluid [36].
q f = w 3 12 μ p f x
where qf is the local tangential flow rate within the fracture, m/s; w is the fracture aperture, m; μ is the fracturing fluid viscosity, mPa·s; and pf is the fluid pressure inside the hydraulic fracture, MPa.
A pressure-dependent leak-off model for normal flow is defined by including a fluid leak-off coefficient, which can be thought of as the permeability of a thin layer of material on the fracture surfaces:
{ q t = c t ( p f p t ) q b = c b ( p f p b )
where qt and qb are the local fracturing fluid leak-off rates through the upper and lower fracture surfaces, m/s; ct and cb are the fluid leak-off coefficients on the upper and lower fracture surfaces; pt and pb are the formation pressures adjacent to the upper and lower fracture surfaces, MPa.

2.3. Establishment of Fracturing Model

The cohesive zone model (CZM) is used to describe nonlinear fracture problems by inserting cohesive elements between elements, which can effectively avoid the problem of infinite stress at the crack tip in linear elastic fracture mechanics. It has been widely used in hydraulic fracturing simulation. The damage evolution of cohesive elements is described by the relationship between the traction force between the upper and lower interfaces and the separation distance.
This paper develops a finite element model of simultaneous expansion of five clusters of fractures based on the cohesive element, analyzes the evolution process of the in situ stress field before and after fracturing, and extracts the in situ stress field at various times and assigns it to a new geological model. In this paper, refracturing simulation is performed using temporary fracture plugging technology and the law of initiation and extension of new fractures is investigated.
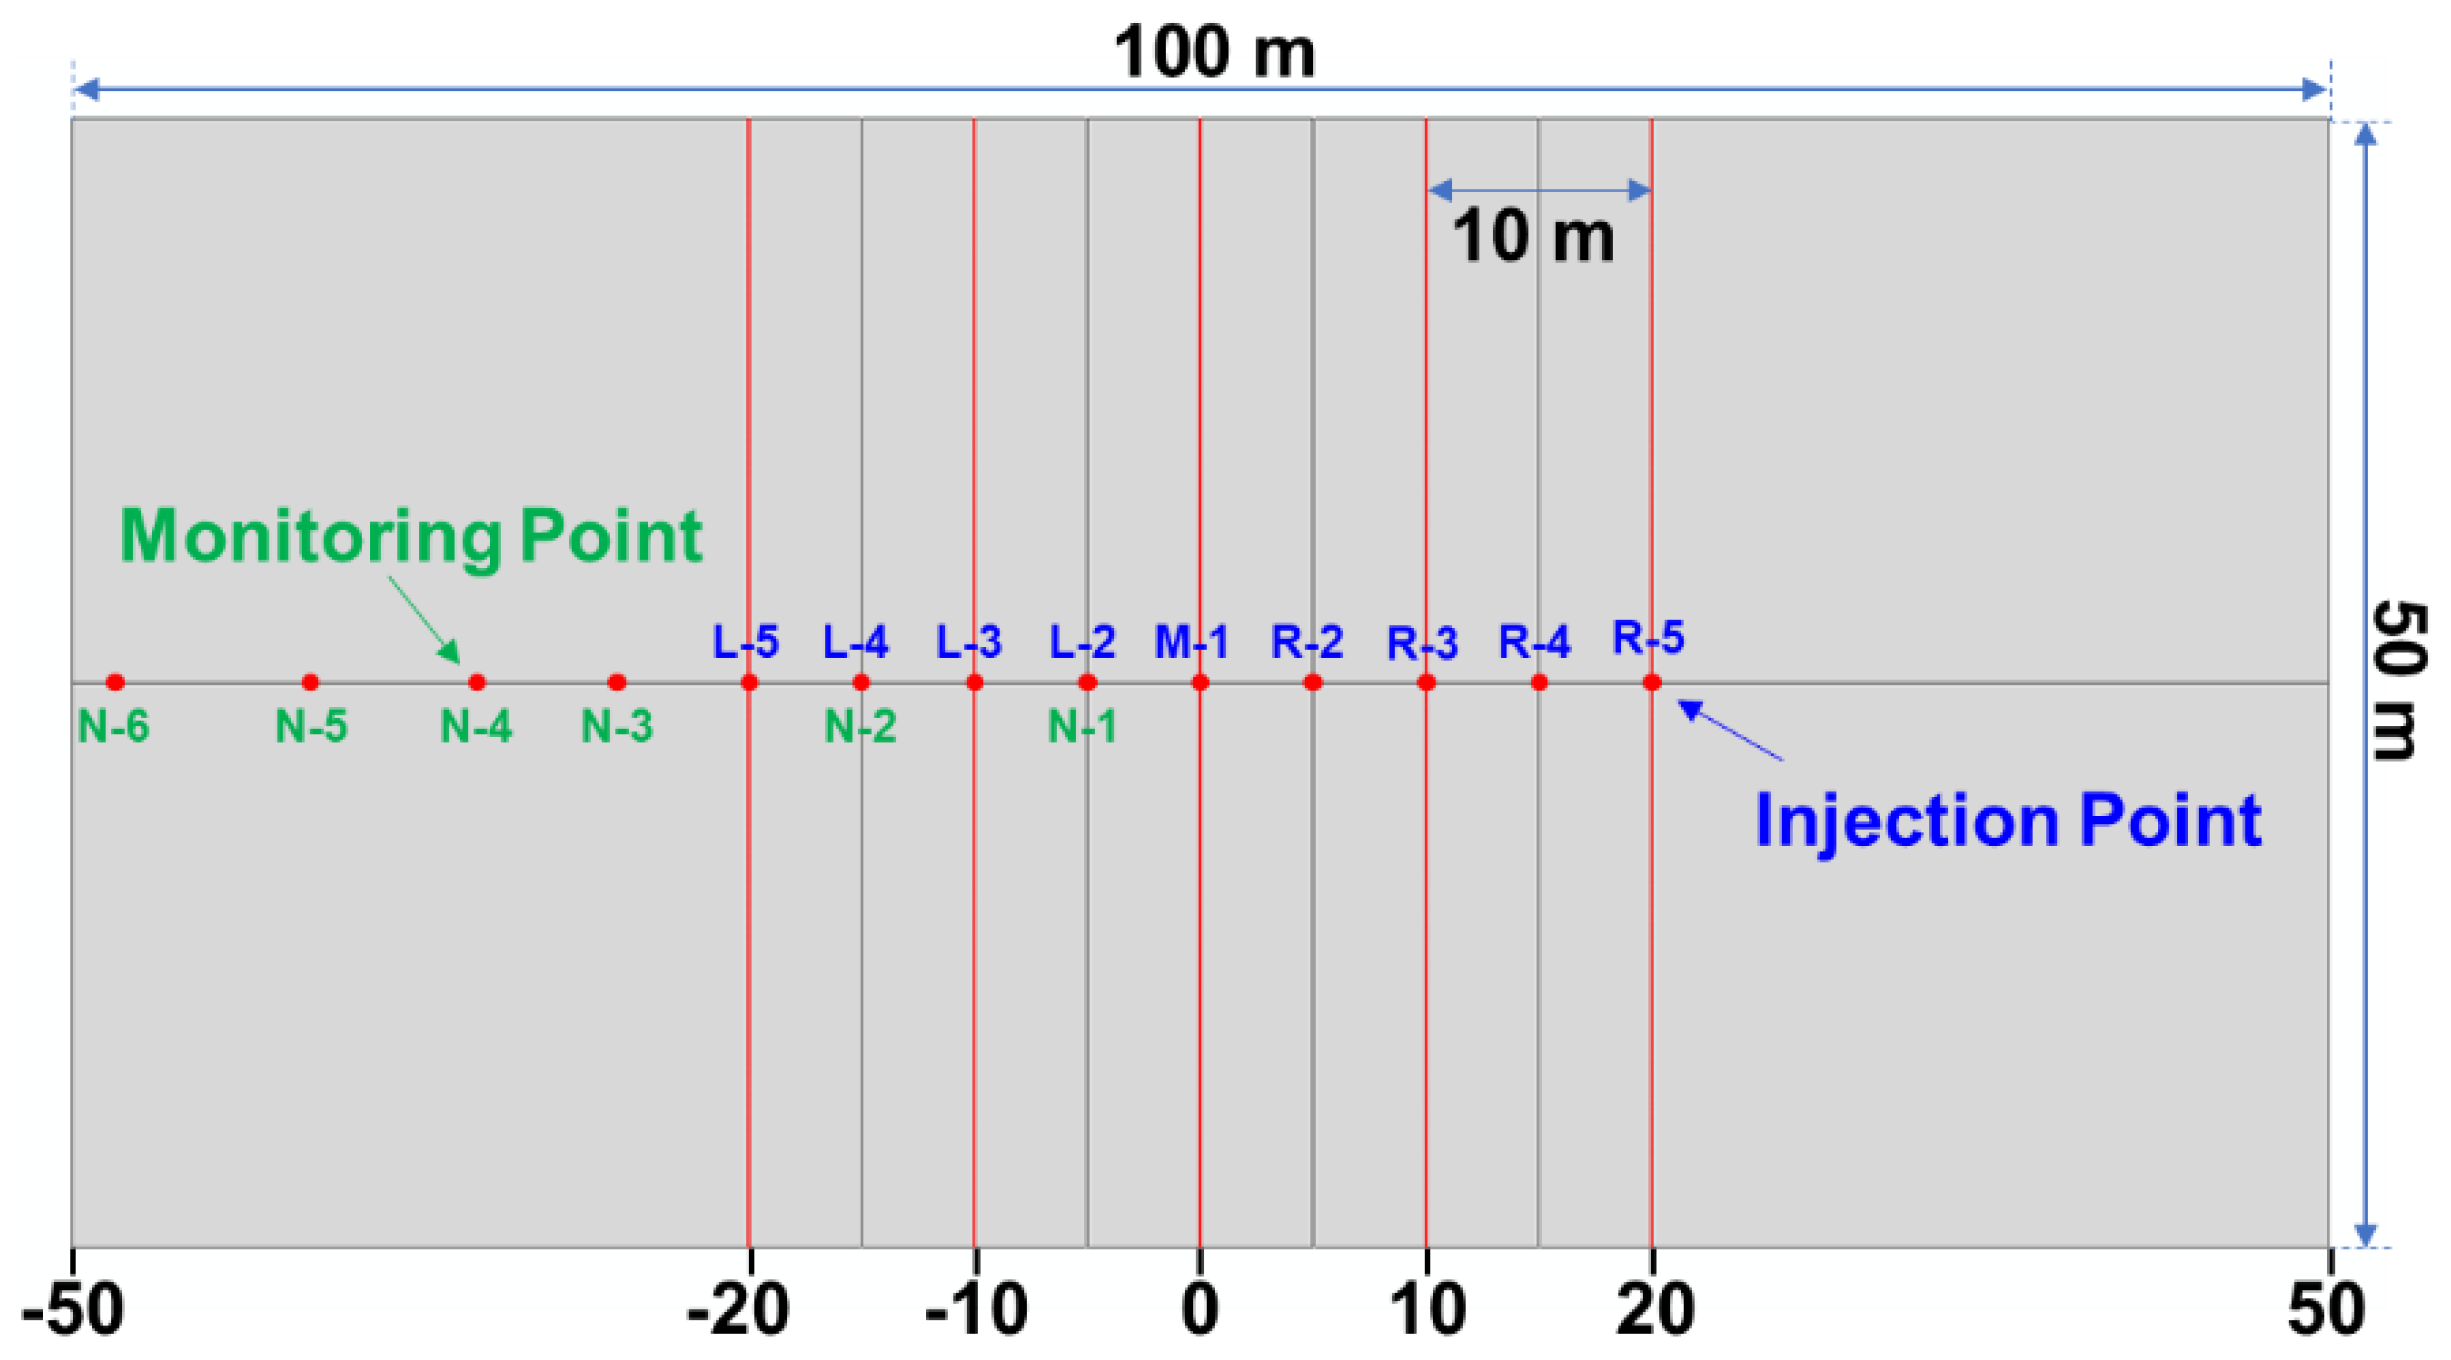
The plane strain element is used in this paper to study the multi-fracture initiation law in the plane and to simplify the three-dimensional formation. The size of the geological model is set to 100 m × 50 m to avoid the influence of the model’s boundary effect on the expansion of hydraulic fractures, and the expansion paths of nine hydraulic fractures are preset in the middle of the model, as shown in Figure 6. The injection points are marked L-5, L-3, M-1, R-3, and R-5 for initial fracturing simulation and in situ refracturing after assigning a new stress field to the model. The four black lines simulate temporary plugging with element suppression technology and can be activated as needed to simulate reperforation and refracturing. L-4, L-2, R-2, and R-4 are the injection locations.
The model’s reservoir properties are based on laboratory tests of rock samples from the Tarim Basin. To minimize the effect of heterogeneity, the formation’s properties are simplified, as illustrated in Table 1.
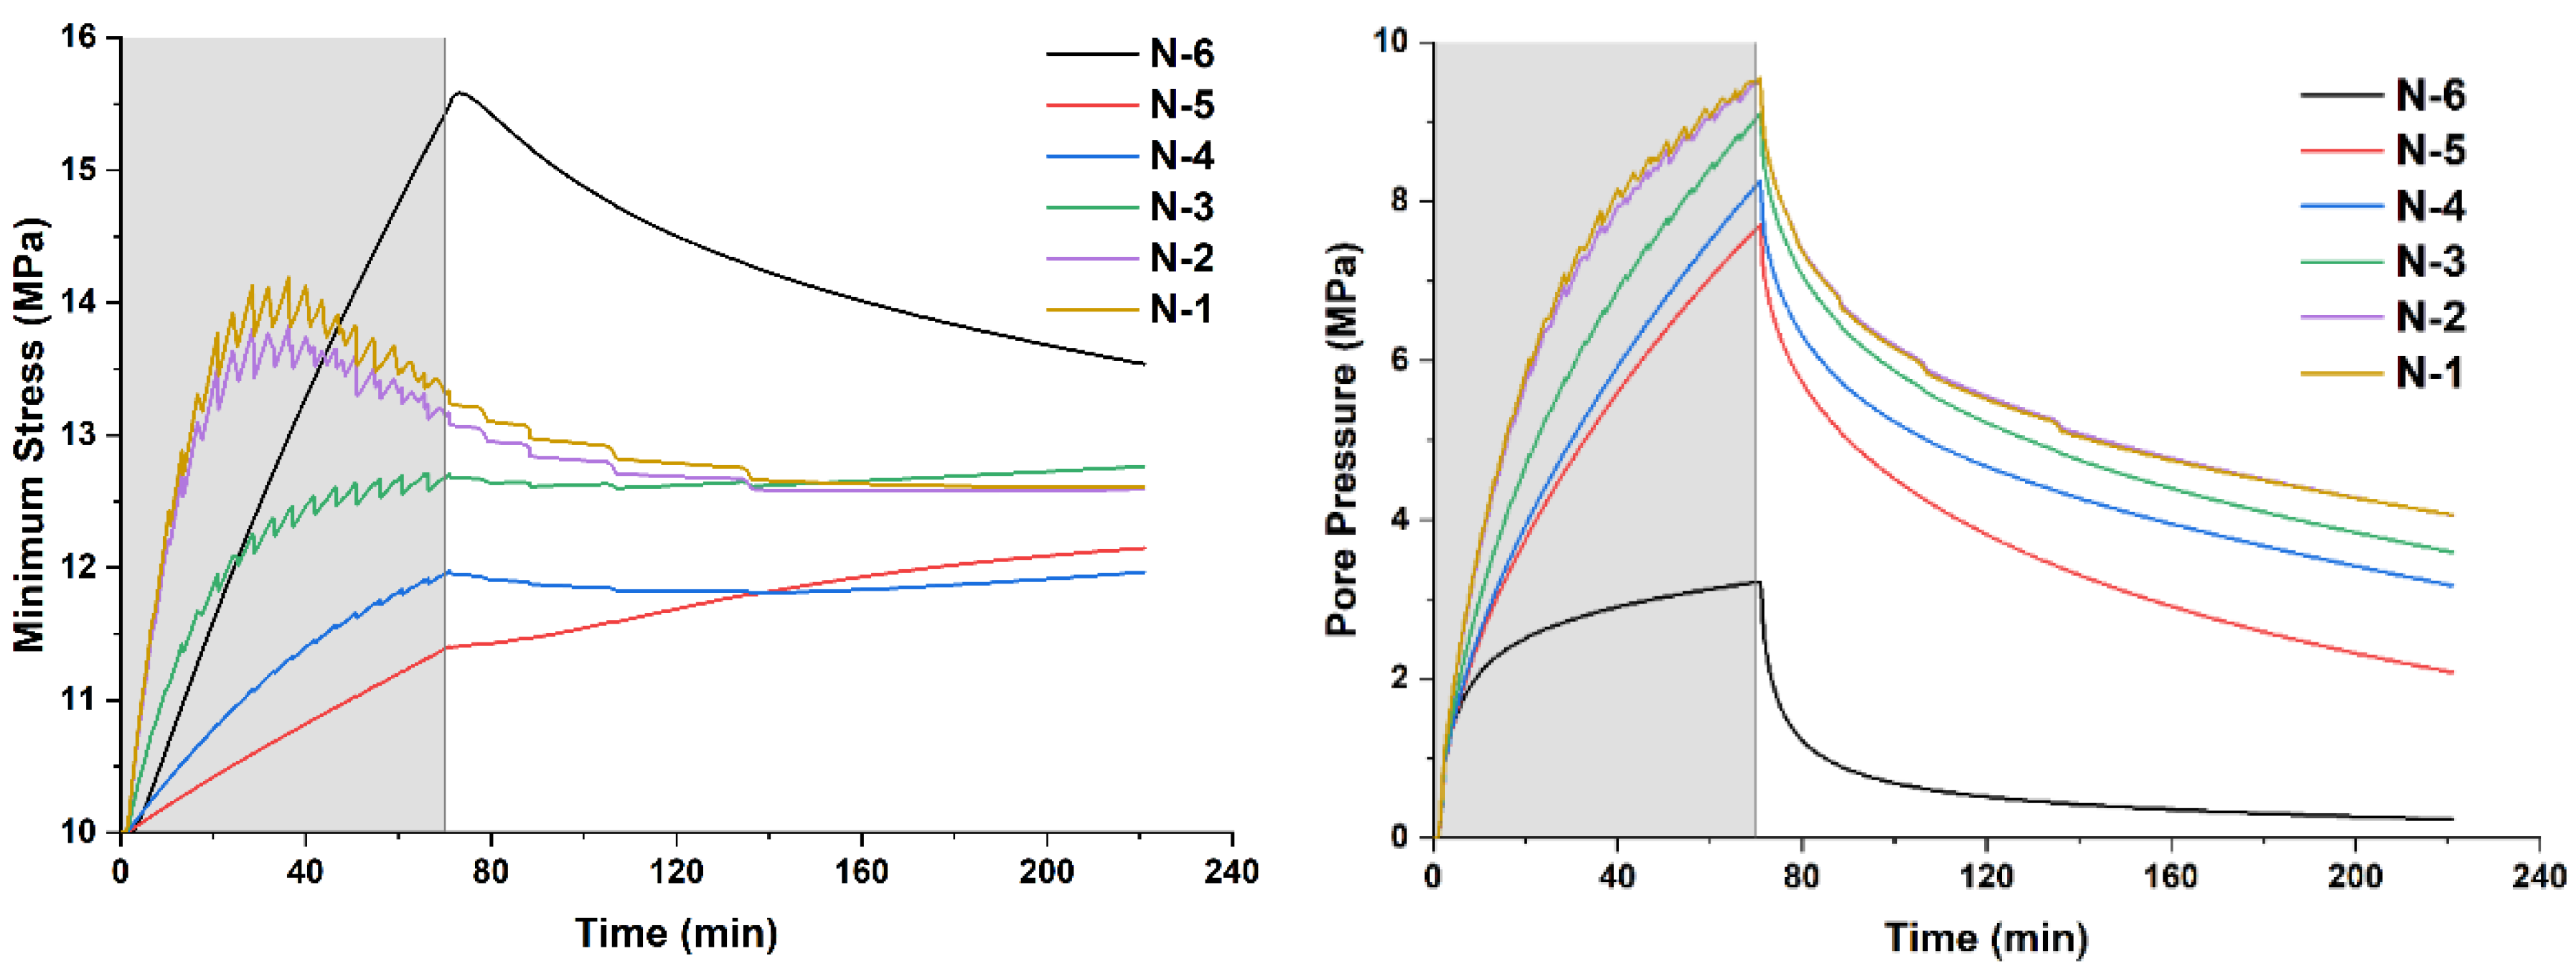
During the entire fracturing process, six monitoring points are also set on the left side of the model, N-6 to N-3, N-2 (L-4), and N-1 (L-2), allowing the stress and pore pressure at various locations of the formation to be monitored over time.
Figure 7 depicts the effect of the fracture temporary plugging simulation technique. Because the horizontal fracture on the left and right sides was plugged, the vertical fracture on the right side was activated and opened during the initial fracturing. When the plugging was removed, the hydraulic fracture extended to the left and right sides and maintained high pressure throughout the horizontal fracture, forcing the vertical fracture in the middle to open. Temporary plugging agents can be used in refracturing reservoirs to increase the pressure in the wellbore and achieve uniform growth of new fractures, as well as in drilling fractured reservoirs to block natural fractures and reduce drilling fluid loss [9,54].

3. Multi-Cluster Fracturing Simulation

3.1. Initial Fracturing Simulation

The initial fracturing simulation is divided into three stages:
  • Ground stress balance stage.
  • Pump 150 m3 (70 min) fracturing fluid, the cracks open and extend forward, and then stop the pump.
  • A 150-min simulation of fracturing fluid filtration loss and in situ stress field evolution.
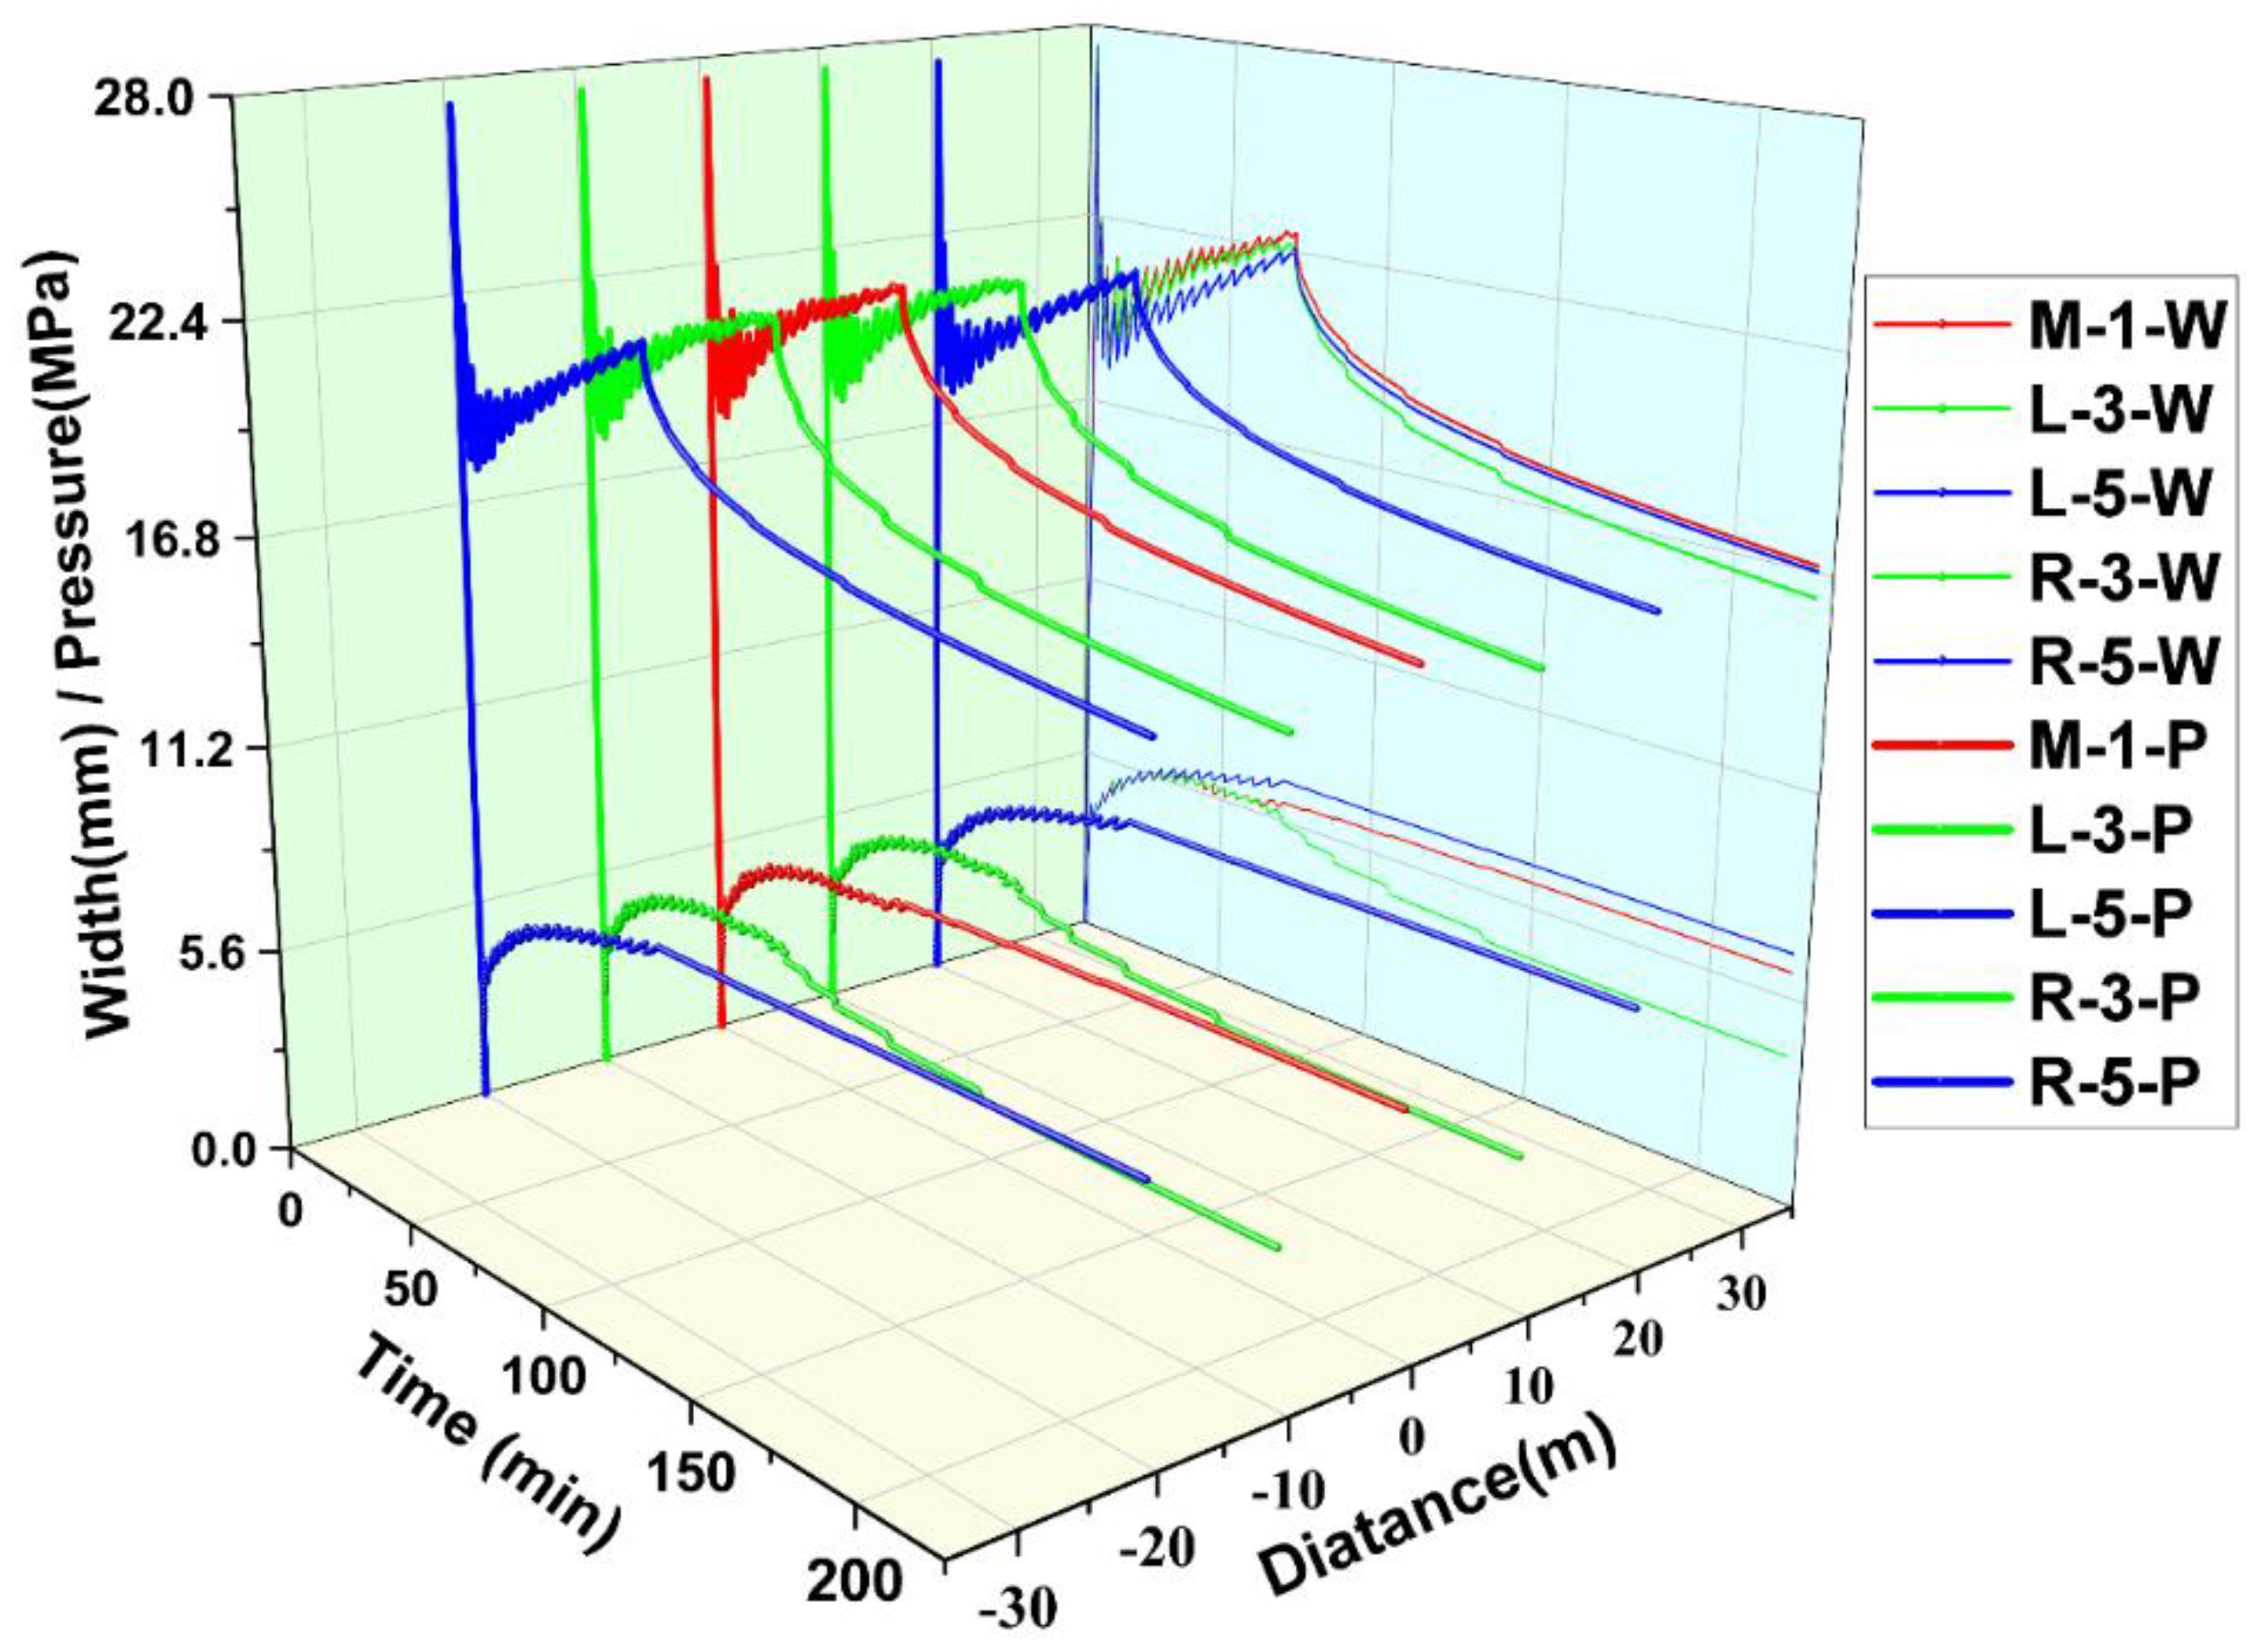
Figure 8 depicts the fracture breaking pressure and fracture width curves for these three stages.
Because the reservoir properties are the same at the beginning of fracturing, the breaking pressures of the formations are all the same, as shown in Figure 8. The formations squeeze each other during the initiation and extension of fractures, resulting in differences in formation stress. As shown in Figure 8, the pore pressures and fracture widths of the five injection points deviate and gradually differentiate into three curves. The curves of L-3 and R-3 overlap, and the curves of L-5 and R-5 overlap due to the symmetry of the model settings. These two overlapping curves are referred to collectively as L/R-3 or L/R-5 for ease of expression.
Figure 9 depicts the fracture morphology and minimum principal stress nephogram of the initial fracturing. The minimum principal stress at the red dot on the model’s horizontal center line is extracted, drawn as a curve, and superimposed on the image. The information of pressure and fracture size at different stages in the simulation process is summarized in Table 2.

3.2. Refracturing Simulation

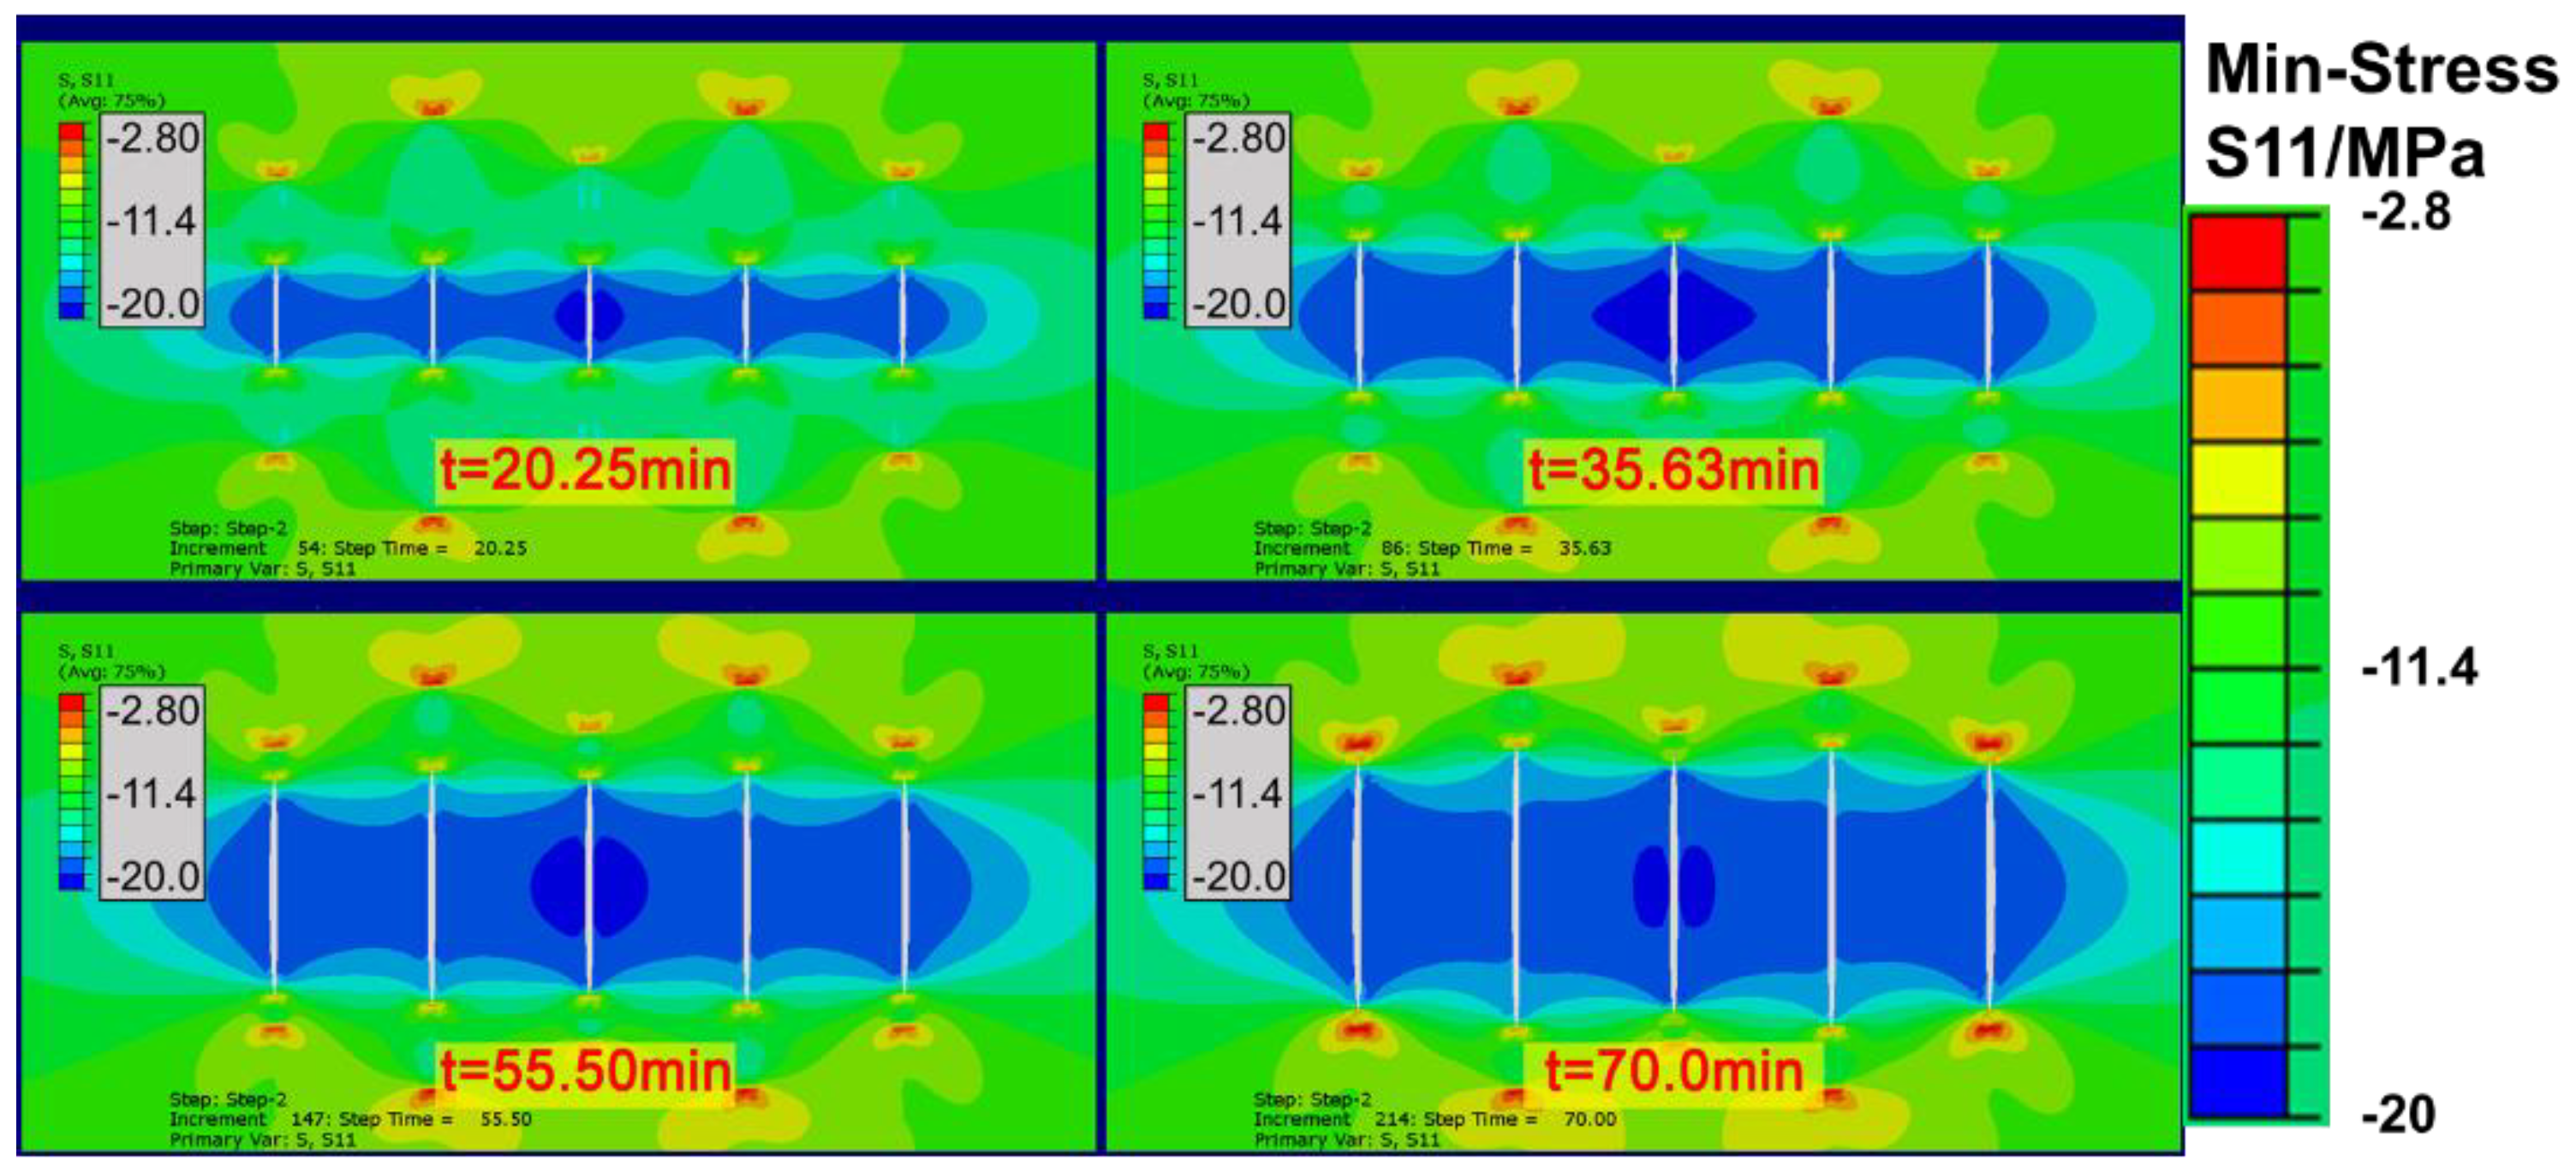
The stress fields at different times in the fracturing results were extracted and assigned to the same geological model based on the initial fracturing results to analyze the difficulty of fracture initiation during refracturing under different stress fields. Figure 10 depicts the simulation results of in situ reinjection fracturing, while Figure 11 depicts the results of reperforating and refracturing in the middle of the original fracture after it had been simulated and plugged. The stress field extracted is the stress field at the end of Step 3 of the initial fracturing simulation. The fluid in the fracture was filtered out for 150 min, and the formation’s pore pressure and in situ stress had returned to their original states. In addition, at the end of Step 2 of the initial fracturing simulation, the in situ stress field was extracted and the formation just finished fracturing, resulting in a higher stress field.
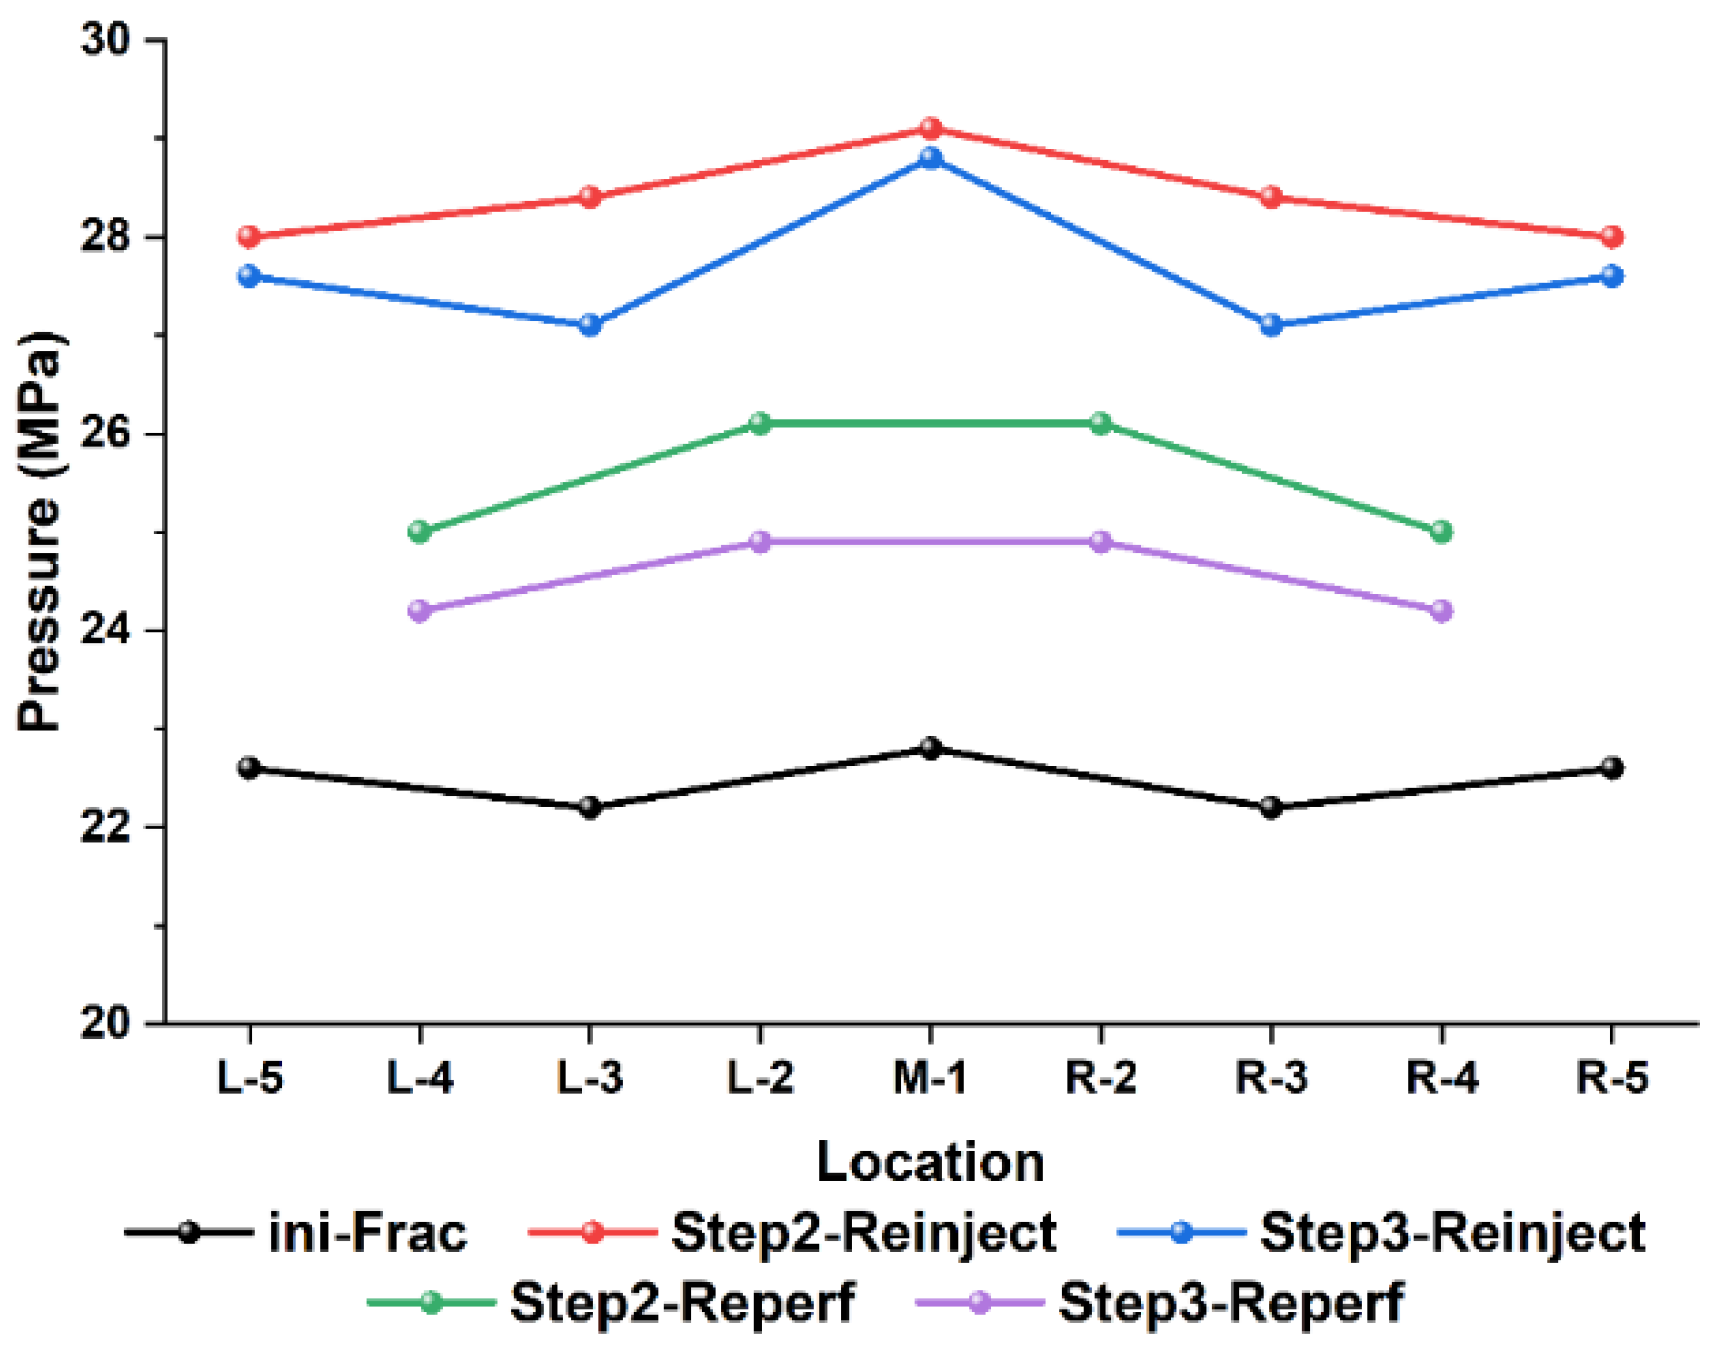
The pressure data from the refracturing simulation, as well as the size of the fractures, are counted in this paper, as shown in Table 3. Drawn charts are shown in Figure 12, Figure 13, Figure 14, Figure 15.

4. Discussion

4.1. Fracturing Fluid Filtration Loss and Variation of Pore Pressure

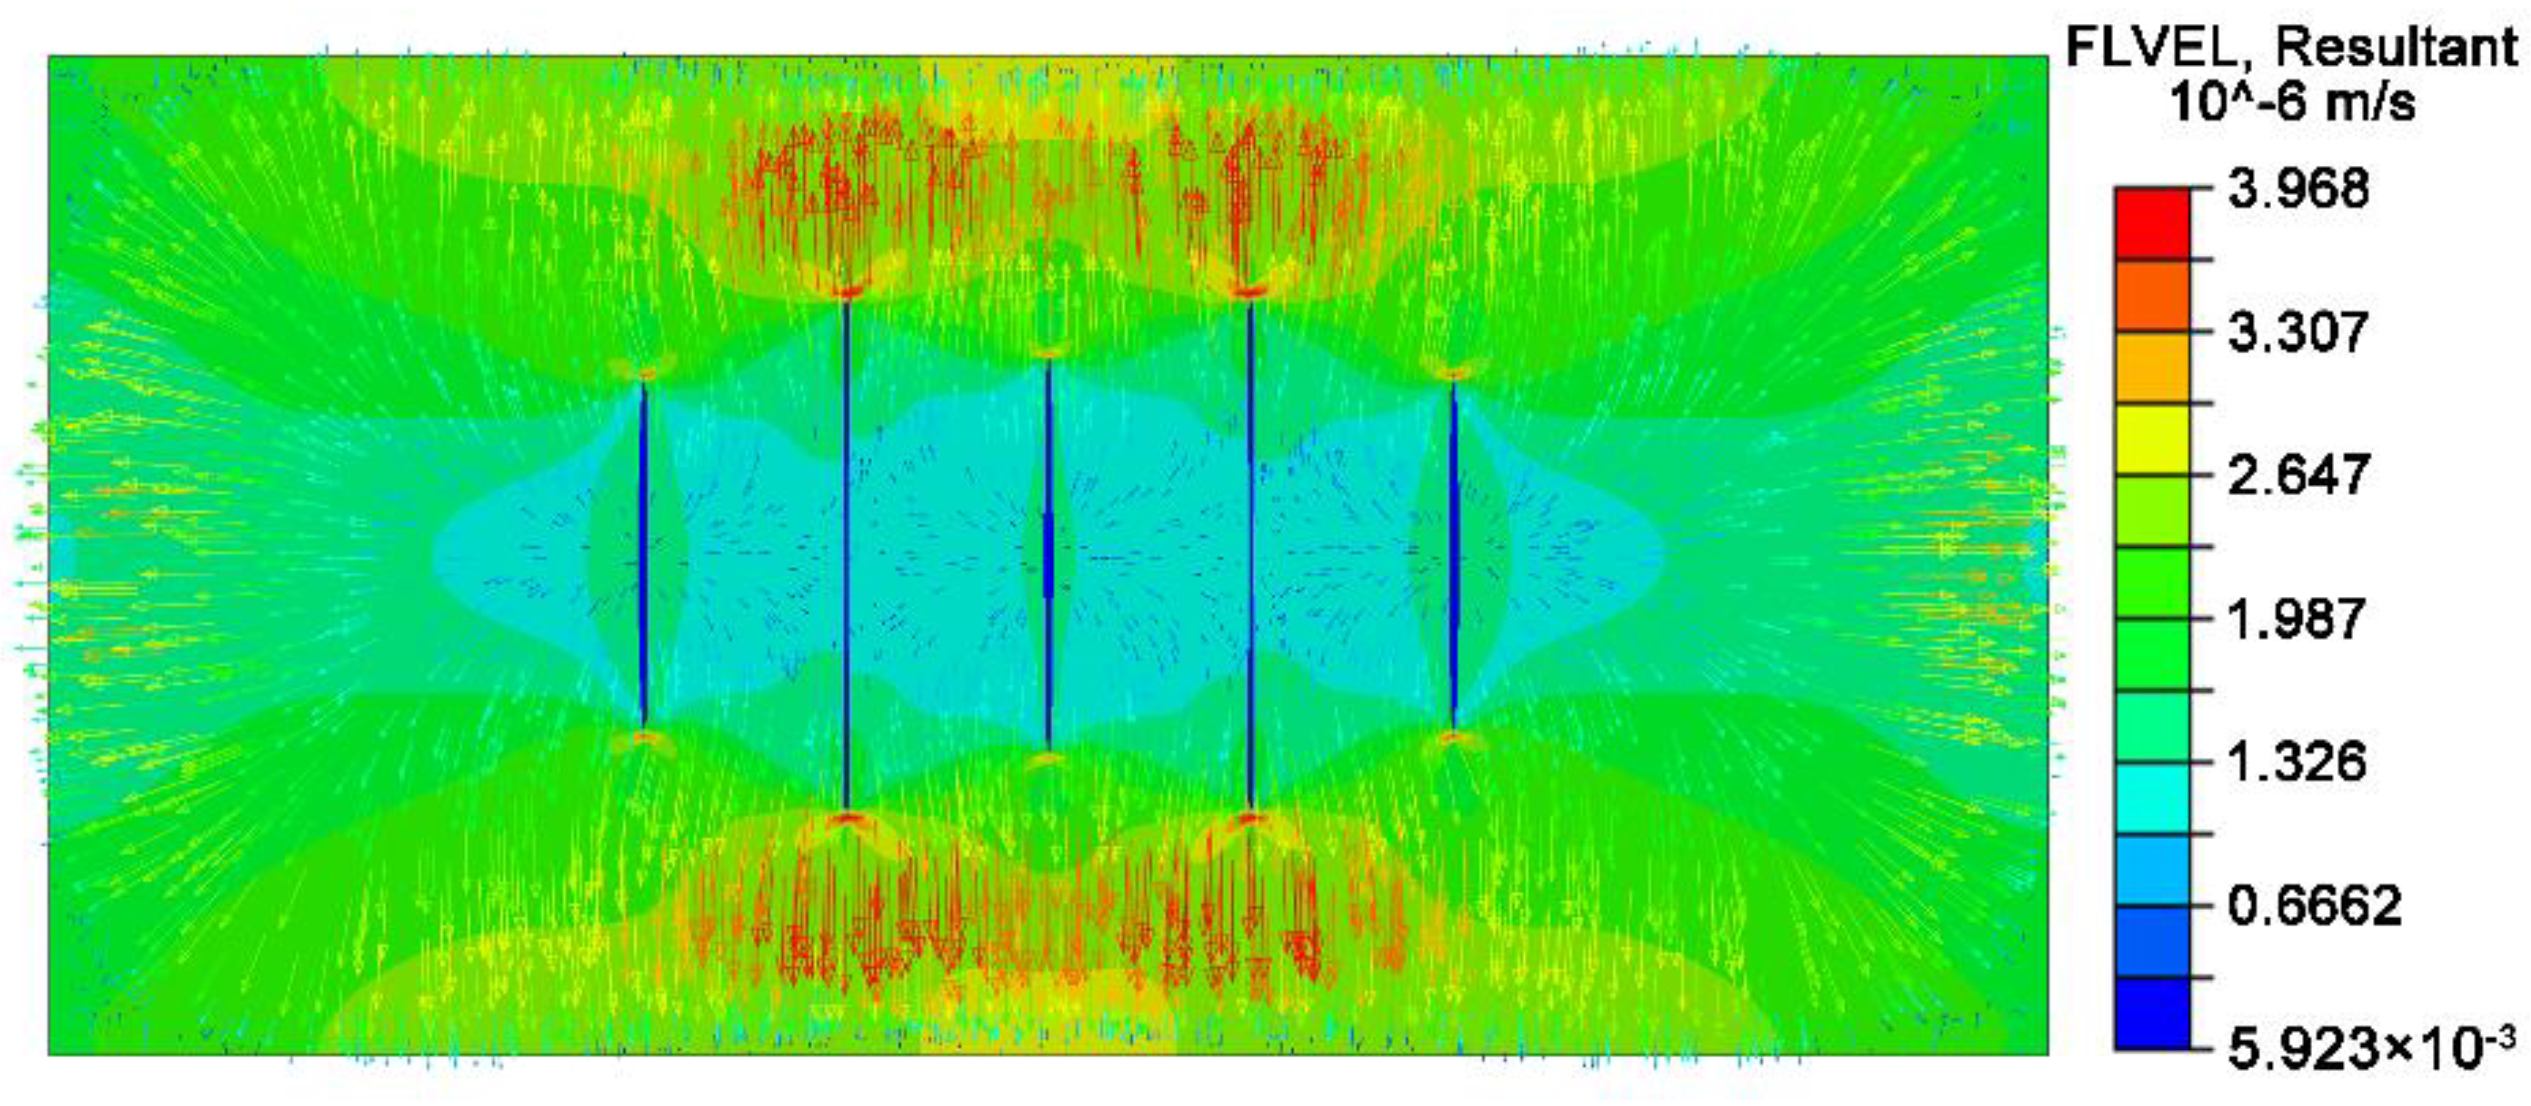
The pore pressure curve in Figure 8 shows that as the fracture expands, the pore pressure at the injection point gradually increases, indicating that the fracture extension pressure gradually increases. The fluid in the fractures is lost to the surrounding formations after fracturing. Figure 16 depicts the seepage field after the pump has been turned off for 100 min, while Figure 17 depicts the pore pressure distribution along the process at the end of Steps 2 and 3.

4.2. Changes of Fracture Size

The fracture surface first opened perpendicular to the direction of the minimum principal stress in the early stages of fracturing and the fracture width increased rapidly, with the fracture extending forward, as shown in Figure 8. The fluid pressure in the fracture and the stress in the formation reached a balance in the middle and late stages of fracturing, and the fracture widths of M-1 and L/R-3 remained essentially unchanged. Because there is no fracture extrusion on the outside, the fracture width of L/R-5 can still be gradually increased, as evidenced by the fact that the minimum principal stress on the outside is lower than that on the inside.
When comparing Figure 9a,b, it can be seen that the fracture morphology of M-1 and L/R-5 did not change significantly after the pump was turned off for 150 min, but the fracture width of L/R-3 decreased from 5.7 mm to 4 mm and the fracture length was extended forward by 4 m. The analysis is necessary because both sides of L/R-3 are squeezed when the pump is turned off. Although the ground stress is similar to M-1, the pore pressure in the fracture is lower, so L/R-3 is only slightly higher. The fracture width can be reduced and extended forward, but the M-1 can keep the fracture width and thus the length the same.

4.3. Evolution of Stress Field

As can be seen in Figure 9a, the stress around the fracture is relatively high at the end of pumping, around 13–13.5 MPa, which is slightly higher than the initially applied horizontal minimum principal stress of 10 MPa. The main reason is that the ground stress rises after the formation is compressed. At the position far away from the crack, the minimum principal stress decreases gradually, and the minimum is about 11.5 MPa.
The pore pressure of the formation and the in situ stress both decrease after the formation fluid seeps to the boundary for 150 min (Figure 18). The main reason is that the fluid in the fracture filters into the formation (Figure 16), lowering the pressure in the fracture and weakening the compression on the formation, allowing formation deformation to recover and ground stress to be reduced, as evidenced by the decrease in fracture width of L/R-3 (Figure 13). However, because there is no room to shrink on the outside of the L/R-5, the minimum stress remains constant. This implies that if pore pressure can be transmitted to a distant location in an open stratum, the magnitude of in situ stress changes is directly proportional to the magnitude of stratum extrusion deformation.
For the N-6 monitoring point closest to the boundary, anomalies in minimum principal stress and pore pressure were also discovered. Because the model uses an ultra-hydrostatic pressure system with a constant pore pressure on the boundary of 0 MPa, the fluid near N-6 tends to flow to the boundary and the pore pressure cannot rise rapidly, while N-5 is largely unaffected. The minimum stress of N-6 increases linearly throughout the entire fracturing process of Step 2. The reasons for this can be analyzed using the in-situ stress of L/R-5 and the change in the fracture width of L/R-5 throughout the entire fracturing process. When modeling geology, the rock’s displacement is limited at the boundary position, and the compression force of the hydraulic fracture is endured, causing the stress to rise. After the pumping, the hydraulic fracture’s extrusion stops, the boundary’s high stress field propagates to the interior, and the stress field at and near the boundary is neutralized, as evidenced by the gradual decrease in stress of N-6, while the stress of N-5 increases slowly. N-4 is largely unaffected by boundary effects, implying that the size of the hydraulic fracturing model is reasonable. The effective influence radius of hydraulic fractures on the surrounding area is 15 m, according to the monitoring curves of pore pressure and minimum principal stress.

4.4. Refracturing

The fracture pressure and fracture extension pressure obtained from all the refracturing processes are significantly higher than those obtained from the initial fracturing, as shown in Figure 12 and Figure 13. The minimum stress decreases as the formation deformation recovers and the fracture pressure gradually decreases. When performing refracturing, it is recommended that stress relief be performed first to aid fracture initiation. The ground pressure system is put under more stress during in situ refracturing, especially during the extension phase of the fracture.
Figure 14 and Figure 15 show that, under the same pumping conditions, the fracture widths produced during refracturing are larger than those produced during initial fracturing, and the fracture lengths of reinjection fracturing are significantly better than those produced during in situ refracturing and even exceed those of initial fracturing.

5. Conclusions

This paper used a novel combination of stress field extraction and fracture temporary plugging simulation technology to explain how stress around the wellbore affects the new fracture during repeated fracturing of the old well. The conclusions are as follows:
  • There is stress concentration around the fractures during multi-cluster fracturing of horizontal wells due to formation deformation, which is more obvious between fractures. The hydraulic fracture’s effective influence radius on the external formation is about 15 m.
  • The formation stress gradually recovers after the fracturing is completed, but it is still significantly higher than the original in situ stress. When refracturing is performed, it is recommended that stress relief be performed first, as this aids fracture initiation.
  • Reperforating fracturing has a lower fracture extension pressure and a longer fracture length than in situ refracturing. As a result, it is recommended that reperforating fracturing be used first when refracturing is performed. With repeated stimulation, fracture temporary plugging technology increases the effective volume of reservoir stimulation and achieves high and stable production.

Author Contributions

F.Z. conceived and designed the simulation; H.L. calculated the parameters; H.L. and Z.S. wrote the paper; Y.T. drew the figures. All authors have read and agreed to the published version of the manuscript.

Funding

This research was funded by National Natural Science Foundation of China, grant number 52174045.

Data Availability Statement

The data presented in this study are available on request from the corresponding author.

Acknowledgments

We appreciate the valuable comments from the editors and anonymous reviewers.

Conflicts of Interest

The authors declare no conflict of interest.

References

  1. Yew, C.H.; Li, Y. Fracturing of a Deviated Well. SPE Prod. Eng. 1988, 3, 429–437. [Google Scholar] [CrossRef]
  2. Chen, M.; Chen, Z.; Huang, R. Hydraulic Fracturing of Highly Deviated Wells. J. Univ. Pet. 1995, 19, 30–35. [Google Scholar]
  3. Zhang, G.; Chen, M.; Wang, Q. Three-dimensional model for space reorientation of hydraulic fractures near deflecting well bore. J. Univ. Pet. 2004, 28, 51–55. [Google Scholar]
  4. Pu, C.; Zheng, H.; Yang, Z.; Gao, Z. Research status and development trend of the formation mechanism of complex fractures by staged volume fracturing in horizontal wells. Acta Pet. Sin. 2020, 41, 1734–1743. [Google Scholar]
  5. Ahmed, M.; Rahim, Z.; Al-Anazi, H.; Al-Kanaan, A.; Mohiuddin, M. Development of Low Permeability Reservoir Utilizing Multi-Stage Fracture Completion in the Minimum Stress Direction. In Proceedings of the SPE Saudi Arabia Section Technical Symposium and Exhibition, Al-Khobar, Saudi Arabia, 8 April 2012; p. SPE-160848-MS. [Google Scholar]
  6. Dehghan, A.N. An Experimental Investigation into the Influence of Pre-Existing Natural Fracture on the Behavior and Length of Propagating Hydraulic Fracture. Eng. Fract. Mech. 2020, 240, 107330. [Google Scholar] [CrossRef]
  7. Wang, Y.; Dusseault, M.B. Defining SRV in Unconventional Reservoirs; How Is It Related to Production? In Proceedings of the 54th U.S. Rock Mechanics/Geomechanics Symposium Golden, CO, USA, 28 June–1 July 2020; OnePetro: The Woodlands, TX, USA, 2020. [Google Scholar]
  8. Xing, C. Numerical Simulation on Multi-Crack Initiation and Propagation under the Influence of Stress Shadow Effect. Master’s Thesis, Northeast Petroleum University, Daqing, China, 2017. [Google Scholar]
  9. Xu, Y.; Lei, Q.; Chen, M.; Wu, Q.; Yang, N.; Weng, D.; Li, D.; Jiang, H. Progress and development of volume stimulation techniques. Pet. Explor. Dev. 2018, 45, 932–947. [Google Scholar] [CrossRef]
  10. Ren, L. Fracture Network Propagation and Productivity Prediction Based on Fluid-Solid Fully Coupling of SRV-Fractured Horizontal Wells in Tight Oil Reservoirs. Ph.D. Thesis, China University of Petroleum (East China), Qingdao, China, 2016. [Google Scholar]
  11. Gale, J.F.W.; Laubach, S.E.; Olson, J.E.; Eichhubl, P.; Fall, A. Natural Fractures in Shale: A Review and New Observations. AAPG Bull. 2014, 98, 2165–2216. [Google Scholar] [CrossRef]
  12. Wang, D.; Qin, H.; Ma, H.; Li, J.; Sun, D. Numerical Simulation of Stress Shadow Effect of Multi-fractures via Finite Element Methods. J. Beijing Inst. Petrochem. Technol. 2020, 28, 22–28. [Google Scholar] [CrossRef]
  13. Zeng, Q.; Yao, J. Numerical simulation of multiple fractures simultaneous propagation in horizontal wells. Acta Pet. Sin. 2015, 36, 1571–1579. [Google Scholar]
  14. Yu, Y.; Zhu, W.; Li, L.; Wei, C.; Dai, F.; Liu, S.; Wang, W. Analysis on stress shadow of mutual interference of fractures in hydraulic fracturing engineering. Chin. J. Rock Mech. Eng. 2017, 36, 2926–2939. [Google Scholar] [CrossRef]
  15. Khanal, A.; Weijermars, R. Pressure Depletion and Drained Rock Volume near Hydraulically Fractured Parent and Child Wells. J. Pet. Sci. Eng. 2019, 172, 607–626. [Google Scholar] [CrossRef]
  16. Raterman, K.T.; Liu, Y.; Warren, L. Analysis of a Drained Rock Volume: An Eagle Ford Example. In Proceedings of the Unconventional Resources Technology Conference (URTeC), Denver, Colorado, 22–24 July 2019; SEG Global Meeting Abstracts. pp. 4106–4125. [Google Scholar]
  17. Wang, H.; Sharma, M.M. Estimating Unpropped-Fracture Conductivity and Fracture Compliance From Diagnostic Fracture-Injection Tests. SPE J. 2018, 23, 1648–1668. [Google Scholar] [CrossRef]
  18. Khanal, A.; Weijermars, R. Distinguishing Fracture Conductivity and Fracture Flux: A Systematic Investigation of Individual Fracture Contribution to Well Productivity. In Proceedings of the 8th Unconventional Resources Technology Conference, Houston, TX, USA, 16–18 July 2021; American Association of Petroleum Geologists: Tulsa, OK, USA, 2020. [Google Scholar]
  19. Weijermars, R.; Nandlal, K.; Tugan, M.F.; Dusterhoft, R.; Stegent, N. Wolfcamp Hydraulic Fracture Test Site Drained Rock Volume and Recovery Factors Visualized by Scaled Complex Analysis Method (CAM): Emulating Multiple Data Sources (Production Rates, Water Cuts, Pressure Gauges, Flow Regime Changes, and b-Sigmoids). In Proceedings of the Unconventional Resources Technology Conference, Houston, TX, USA, 20–22 July 2020; pp. 588–629. [Google Scholar]
  20. Weijermars, R. Improving Well Productivity—Ways to Reduce the Lag between the Diffusive and Convective Time of Flight in Shale Wells. J. Pet. Sci. Eng. 2020, 193, 107344. [Google Scholar] [CrossRef]
  21. Fu, W.; Morris, J.P.; Fu, P.; Huang, J.; Sherman, C.S.; Settgast, R.R.; Ryerson, F.J. Developing Upscaling Approach for Swarming Hydraulic Fractures Observed at Hydraulic Fracturing Test Site through Multiscale Simulations. SPE J. 2021, 26, 2670–2684. [Google Scholar] [CrossRef]
  22. Chang, F.F.; Bartko, K.; Dyer, S.; Aidagulov, G.; Suarez-Rivera, R.; Lund, J. Multiple Fracture Initiation in Openhole Without Mechanical Isolation: First Step to Fulfill an Ambition. In Proceedings of the SPE Hydraulic Fracturing Technology Conference, The Woodlands, TX, USA, 4 February 2014; p. SPE-168638-MS. [Google Scholar]
  23. Sneddon, I.N. The Distribution of Stress in the Neighborhood of a Crack in an Elastic Solid. Philos. Trans. R. Soc. Lond. Ser. A 1946, 187, 1934–1990. [Google Scholar]
  24. Warpinski, N.R.; Teufel, L.W. Influence of Geologic Discontinuities on Hydraulic Fracture Propagation (Includes Associated Papers 17011 and 17074 ). J. Pet. Technol. 1987, 39, 209–220. [Google Scholar] [CrossRef]
  25. Liu, H.; Hu, Y.; Zhao, J.; Li, W.; Liu, W.; Hu, G. Simulation Study of Induced Stress Field in Refracturing Gas Well. Chin. J. Rock Mech. Eng. 2004, 23, 4022–4027. [Google Scholar]
  26. Deng, Y. Research on the Mechanics Mechanism of Deng Yan Refracturing New Fractures. Ph.D. Thesis, Southwest Petroleum Institute, Chengdu, China, 2005. [Google Scholar]
  27. Cheng, Y. Boundary Element Analysis of the Stress Distribution Around Multiple Fractures: Implications for the Spacing of Perforation Clusters of Hydraulically Fractured Horizontal Wells. In Proceedings of the SPE Eastern Regional Meeting, Charleston, WV, USA, 23–25 September 2009. [Google Scholar]
  28. Nagel, N.B.; Sanchez-Nagel, M. Stress Shadowing and Microseismic Events: A Numerical Evaluation; OnePetro: The Woodlands, TX, USA, 2011. [Google Scholar]
  29. Yoon, J.S.; Zimmermann, G.; Zang, A. Numerical Investigation on Stress Shadowing in Fluid Injection-Induced Fracture Propagation in Naturally Fractured Geothermal Reservoirs. Rock Mech. Rock Eng. 2015, 48, 1439–1454. [Google Scholar] [CrossRef]
  30. Wu, R.; Kresse, O.; Weng, X.; Cohen, C.; Gu, H. Modeling of Interaction of Hydraulic Fractures in Complex Fracture Networks; OnePetro: The Woodlands, TX, USA, 2012. [Google Scholar]
  31. Manchanda, R.; Olson, J.E.; Sharma, M.M. Mechanical, Failure And Flow Properties of Sands: Micro-Mechanical Models. OnePetro: The Woodlands, TX, USA, 2012. [Google Scholar]
  32. Cheng, W.; Jin, Y.; Chen, M.; Xu, T.; Zhang, Y.; Diao, C. A criterion for identifying hydraulic fractures crossing natural fractures in 3D space. Pet. Explor. Dev. 2014, 41, 371–376. [Google Scholar] [CrossRef]
  33. Zeng, Q. Numerical Simulation Study of Hydraulic Fracture Propagation in Shale and Tight Reservoirs. Ph.D. Thesis, China University of Petroleum (East China), Qingdao, China, 2016. [Google Scholar]
  34. Xia, L.; Zeng, Y. Stress shadow effect of alternative fracturing based on numerical simulation of PFC2D. Rock Soil Mech. 2018, 39, 4269–4281. [Google Scholar] [CrossRef]
  35. Wang, X. Horizontal Well Fracturing Multiple Fracture Stress Disturbance Size Simulation and Application Research. Master’s Thesis, China University of Petroleum (Beijing), Beijing, China, 2018. [Google Scholar]
  36. Gao, Q.; Han, S.; Cheng, Y.; Yan, C.; Sun, Y.; Han, Z. Effects of Non-Uniform Pore Pressure Field on Hydraulic Fracture Propagation Behaviors. Eng. Fract. Mech. 2019, 221, 106682. [Google Scholar] [CrossRef]
  37. Zuo, S.; Ge, Z.; Deng, K.; Zheng, J.; Wang, H. Fracture Initiation Pressure and Failure Modes of Tree-Type Hydraulic Fracturing in Gas-Bearing Coal Seams. J. Nat. Gas Sci. Eng. 2020, 77, 103260. [Google Scholar] [CrossRef]
  38. Shokouhi, P.; Jin, J.; Manogharan, P.; Wood, C.; Rivière, J.; Elsworth, D.; Marone, C. An Experimental Investigation of the Coupling Between Elastodynamic and Hydraulic Properties of Naturally Fractured Rock at the Laboratory Scale; American Rock Mechanics Association: Golden, CO, USA, 2020. [Google Scholar]
  39. Weijermars, R.; Wang, J.; Nelson, R. Stress Concentrations and Failure Modes in Horizontal Wells Accounting for Elastic Anisotropy of Shale Formations. Earth-Sci. Rev. 2020, 200, 102957. [Google Scholar] [CrossRef]
  40. Gholami, A.; Aghighi, M.A.; Rahman, S.S. Effect of Non-Uniform Pore Pressure Fields on Hydraulic Fracture Propagation. J. Pet. Sci. Eng. 2017, 159, 889–902. [Google Scholar] [CrossRef]
  41. Prabhakaran, R.; De Pater, H.; Shaoul, J. Pore Pressure Effects on Fracture Net Pressure and Hydraulic Fracture Containment: Insights from an Empirical and Simulation Approach. J. Pet. Sci. Eng. 2017, 157, 724–736. [Google Scholar] [CrossRef]
  42. Lian, P.; Cheng, L.; Deng, B. Simulation of Ground Stress Field and Fracture Anticipation with Effect of Pore Pressure. Theor. Appl. Fract. Mech. 2011, 56, 34–41. [Google Scholar] [CrossRef]
  43. Ikeda, R.; Tsukahara, H. Hydraulic Fracturing Technique: Pore Pressure Effect and Stress Heterogeneity. Int. J. Rock Mech. Min. Sci. Geomech. Abstr. 1989, 26, 471–475. [Google Scholar] [CrossRef]
  44. Weijermars, R.; Nandlal, K.; Khanal, A.; Tugan, M.F. Comparison of Pressure Front with Tracer Front Advance and Principal Flow Regimes in Hydraulically Fractured Wells in Unconventional Reservoirs. J. Pet. Sci. Eng. 2019, 183, 106407. [Google Scholar] [CrossRef]
  45. Jin, Y.; Chen, M.; Zhang, X. Hydraulic fracturing initiation pressure models for directional wells in naturally fractured formation. Acta Pet. Sin. 2006, 27, 124–126. [Google Scholar]
  46. Jia, C.; Li, M.; Deng, J.; Tian, C.; Chang, L. Large-Scale Three Dimensional Simulation Test For Directional Perforation And Fracturing In Deflected Well. J. Southwest Pet. Univ. 2007, 29, 135–137. [Google Scholar]
  47. Hou, B.; Zhang, R.; Diao, C.; Li, L.; Cheng, M. Experimental study on hydraulic fracture propagation in highly deviated wells. China Offshore Oil Gas 2016, 28, 85–91. [Google Scholar]
  48. Bérard, T.; Desroches, J.; Yang, Y.; Weng, X.; Olson, K. High-Resolution 3D Structural Geomechanics Modeling for Hydraulic Fracturing. In Proceedings of the SPE Hydraulic Fracturing Technology Conference, The Woodlands, TX, USA, 3–5 February 2015. [Google Scholar]
  49. Zhang, G.; Chen, M.; Yao, F.; Zhao, Z. Study on optimal re-fracturing timing in anisotropic formation and its influencing factors. Acta Pet. Sin. 2008, 29, 885–888, 893. [Google Scholar]
  50. Guo, T.; Zhang, S.; Wang, L.; Sui, W.; Wen, H. Optimization of proppant size for frac-pack completion based on a new equipment. J. Pet. Sci. Eng. 2012, 96–97, 1–9. [Google Scholar] [CrossRef]
  51. Liu, X.; Zhang, W.; Qu, Z.; Guo, T.; Sun, Y.; Rabiei, M.; Cao, Q. Feasibility evaluation of hydraulic fracturing in hydrate-bearing sediments based on analytic hierarchy process-entropy method (AHP-EM). J. Nat. Gas Sci. Eng. 2020, 81, 103434. [Google Scholar] [CrossRef]
  52. Pham, T.; Weijermars, R. Solving Stress Tensor Fields around Multiple Pressure-Loaded Fractures Using a Linear Superposition Method (LSM). Appl. Math. Model. 2020, 88, 418–436. [Google Scholar] [CrossRef]
  53. Gaurina-Međimurec, N.; Brkić, V.; Topolovec, M.; Mijić, P. Fracturing Fluids and Their Application in the Republic of Croatia. Appl. Sci. 2021, 11, 2807. [Google Scholar] [CrossRef]
  54. Gaurina-Međimurec, N.; Pašić, B.; Mijić, P.; Medved, I. Drilling Fluid and Cement Slurry Design for Naturally Fractured Reservoirs. Appl. Sci. 2021, 11, 767. [Google Scholar] [CrossRef]
Figure 1. Particle paths (blue) after 1 month of production for a hydraulic fractured in the Permian Basin well. The hydraulic fracture stages are 250 ft apart and have a half-length of 100 ft. (a) DRV around individual hydraulic fractures (b) DRVs in a low productivity well [18] (Reproduced with permission from SEG, 2020).
Processes 10 00899 g001
Figure 2. Schematic illustration of the influence of stress shadow on the dynamic propagation of hydraulic fractures.
Processes 10 00899 g002
Figure 3. Pressure depletion (psi) progression for the central three fractures in a Wolfcamp shale well (Midland Basin, West Texas) constructed using a production history-matched CMG model. (a) Map views of pressure depletion in production bench with wellbore horizontal in image and transverse fractures sets spaced at 60 ft. (b) Pressure gradient normal to the fractures after 1 month [44]. (Reproduced with permission from Elsevier, 2019).
Processes 10 00899 g003
Figure 4. CAM model. (a) Map view of velocity magnitude contours (ft/day) (b) Vertical velocities measured at y = 0. (c) Map view of normalized pressured depletion contours. (d) Vertical profile of pressure magnitude variations along the well at y = 0 [18]. (Reproduced with permission from SEG, 2020).
Processes 10 00899 g004
Figure 5. Fracturing fluid flow in hydraulic fracture.
Processes 10 00899 g005
Figure 6. Schematic diagram of the geological model.
Processes 10 00899 g006
Figure 7. Schematic diagram of fracture temporary plugging simulation.
Processes 10 00899 g007
Figure 8. Curves of fracture width and injection point pressure. The upper curve represents the pressure at the injection point, the lower curve represents the width of the fracture, and the red curve represents the intermediate injection point. The lateral curve is the projection of pressure and width of the five fractures.
Processes 10 00899 g008
Figure 9. The minimum principal stress nephogram of initial fracturing. The curve represents the minimum stress at the red horizontal point in the middle of the model.
Processes 10 00899 g009
Figure 10. Results of in situ refracturing. The four figures show the fracture morphology and stress field distribution at different times during the refracturing process. After pumping (70 min), the morphology of the five fractures in the in situ refracturing is more uniform than that of initial fracturing.
Processes 10 00899 g010
Figure 11. Results of reperforation hydraulic fracturing. The formation was reperforated in the middle of the five fractures of the initial fracturing, and the initial fracture was blocked by the temporary plugging technology, resulting in only four fractures during the refracturing.
Processes 10 00899 g011
Figure 12. Breaking pressure of different fracturing methods.
Processes 10 00899 g012
Figure 13. Fracture extension pressure of different fracturing methods.
Processes 10 00899 g013
Figure 14. Fracture width of different fracturing methods.
Processes 10 00899 g014
Figure 15. Fracture lengths of different fracturing methods.
Processes 10 00899 g015
Figure 16. The seepage field after the pump was stopped for 100 min. The fracturing fluid continues to filter out into the formation because the fluid pressure in the fracture is still greater than the pore pressure in the reservoir.
Processes 10 00899 g016
Figure 17. Variation of pore pressure along the central horizontal line. The pressure at the five injection points is always greater than the pore pressure in the nearby reservoir matrix.
Processes 10 00899 g017
Figure 18. Variation curve of minimum principal stress and pore pressure at monitoring points. The gray area represents the fracturing stage, and the pump stops after 70 min.
Processes 10 00899 g018
Table 1. Stratigraphic properties.
Geological OropertiesNumerical Value
Young’s modulus20 GPa
Poisson’s ratio0.25
Porosity10%
Permeability1 mD
Tensile strength6 MPa
Horizontal minimum principal stress10 MPa
Horizontal maximum principal stress20 MPa
Table 2. Statistical table of initial fracturing data.
Injection PointBreaking Pressure
MPa
Fracture Pressure
MPa
Average Fracture Width
mm
Average Fracture Length
m
Step2Step3Step2Step3Step2Step3
L/R-527.622.616.96.96.81818
L/R-327.622.216.25.742026
M-127.622.8176.26.32020
Table 3. Data statistics of refracturing.
Data InformationBreaking Pressure/MPaExtension Pressure/MPa
Fracturing MethodInjection PointSource of Stress FieldInjection PointSource of Stress Field
Step2Step3Step2Step3
reinjectM-133.532.5M-129.128.8
L/R-333.532.5L/R-328.427.1
L/R-533.532.5L/R-52827.6
reperforationL/R-233.432L/R-226.124.9
L/R-433.432L/R-42524.2
Data InformationAverage Fracture Width/mmAverage Fracture Length/m
Fracturing MethodInjection PointSource of Stress FieldInjection PointSource of Stress Field
Step2Step3Step2Step3
reinjectM-16.87.2M-11717
L/R-36.46.5L/R-31818
L/R-57.47.4L/R-51616
reperforationL/R-26.36.4L/R-22219
L/R-46.76.3L/R-42521
Publisher’s Note: MDPI stays neutral with regard to jurisdictional claims in published maps and institutional affiliations.