Article

Continuous-Flow Magnetic Fractionation of Red Blood Cells Based on Hemoglobin Content and Oxygen Saturation—Clinical Blood Supply Implications and Sickle Cell Anemia Treatment

1
William G. Lowrie Department of Chemical and Biomolecular Engineering, The Ohio State University, 151 West Woodruff Avenue, Columbus, OH 43210, USA
2
Department of Chemical Engineering, Texas Tech University, Lubbock, TX 79409, USA
3
Department of Biomedical Engineering, Cleveland Clinic, 9500 Euclid Avenue, Cleveland, OH 44195, USA
4
The James Comprehensive Cancer Center, The Ohio State University, 460 West 10th Avenue, Columbus, OH 43210, USA
*
Author to whom correspondence should be addressed.
Processes 2022, 10(5), 927; https://doi.org/10.3390/pr10050927
Submission received: 21 April 2022 / Revised: 3 May 2022 / Accepted: 5 May 2022 / Published: 7 May 2022
(This article belongs to the Section Biological Processes and Systems)

Abstract

:
Approximately 36,000 units of red blood cells (RBCs) are used every day in the U.S. and there is a great challenge for hospitals to maintain a reliable supply, given the 42-day expiration period from the blood donation date. For many years, research has been conducted to develop ex vivo storage solutions that limit RBC lysis and maintain a high survival rate of the transfused cells. However, little attention is directed towards potential fractionation methods to remove unwanted cell debris or aged blood cells from stored RBC units prior to transfusion, which could not only expand the ex vivo shelf life of RBC units but also avoid adverse events in transfused patients. Such fractionation methods could also limit the number of transfusions required for treating certain pathologies, such as sickle cell disease (SCD). In this work, magnetic fractionation is studied as a potential technology to fractionate functional and healthy RBCs from aged or sickle cells. It has been reported that during ex vivo RBC storage, RBCs lose hemoglobin (Hb) and lipid content via formation of Hb-containing exosomes. Given the magnetic character of deoxygenated- or met-Hb, in this work, we propose the use of a quadrupole magnetic sorter (QMS) to fractionate RBCs based on their Hb content from both healthy stored blood and SCD blood. In our QMS, a cylindrical microchannel placed inside the center of the quadrupolar magnets is subjected to high magnetic fields and constant field gradients (286 T/m), which causes the deflection of the paramagnetic, Hb-enriched, and functional RBCs from their original path and their collection into a different outlet. Our results demonstrated that although we could obtain a significant difference in the magnetic mobility of the sorted fractions (corresponding to a difference in more than 1 pg of Hb per cell), there exists a tradeoff between throughput and purity. Therefore, this technology when optimized could be used to expand the ex vivo shelf life of RBC units and avoid adverse events in transfused individuals or SCD patients requiring blood exchange therapy.

1. Introduction

Each year, approximately 10 million of the 13.6 million collected red blood cell (RBC) units are used in the United States [1]. Along with a higher collection rate in industrialized countries, 15% of the world’s population uses 48% of the 118 million global RBC units that are collected annually [2,3]. These generously donated RBC units are given to organ transplant recipients, patients experiencing blood loss, and to individuals with hematologic diseases that require regular blood transfusions, such as the 100,000 Americans with sickle cell disease (SCD). In the former two cases, as well as anemic patients, RBC transfusion is used to increase the hematocrit and improve oxygen carrying capacity. Due to the unpredictable onset of painful vaso-occlusive crises (VOC), many SCD patients undergo routine exchange transfusions, where native RBCs are continuously removed, in order to reduce the concentration of HbS (hemoglobin (Hb) with the sickle mutation) [4].
Although only a small fraction of cells in stored RBC units show irreversible morphological damage due to ex vivo aging, approximately 25% of RBCs are removed by the recipient’s spleen within 24 h after transfusion. Similarly, only a small fraction of native SCD RBCs are permanently polymerized and elongated. Regardless, all native blood (including donated exogenous RBCs) is discarded by an apheresis device when performing RBC exchange therapy to prevent VOC in SCD patients [5,6,7]. If a negative selection separation could be performed on stored blood and/or transfusion product that only removes the few detrimental RBCs, it may result in more effective use of the finite available supply of RBC units. Many hospitals have already amended their transfusion protocols during the COVID-19 pandemic and blood donor shortage by diluting RBC units (as well as tightening transfusion criteria) [8]. Such separation technique may reduce the harmful consequences of repeated RBC transfusions such as alloimmunization, iron overload, and delayed hemolytic reactions [9]. This concept could not only extend the blood supply to areas with low supply, but potentially extend the ex vivo storage lifetime of aged RBC units.
A potential technique that could be used to fractionate ex vivo stored RBC units or SCD apheresis discarded product is magnetophoresis. Magnetophoresis, or the manipulation of material through the application of external magnetic fields, has been successfully used to separate particles and cells for different applications [10,11,12]. Indeed, we have previously shown that healthy RBCs lose, on average, 17% of their Hb after 42 days of ex vivo storage, the maximum FDA-approved length of time for cold storage of RBCs in an additive solution [13]. It is hypothesized that this decrease in internal RBC Hb concentration during ex vivo RBC storage is related to the production of Hb-containing RBC-derived microvesicles [14]. Interestingly, sickle RBCs possess different oxygen affinities than healthy RBCs [15]. Even at the low and high extremes of oxygenation in the buffer, the magnetic effects of these physiologic differences are apparent [16]. The results of Scrima et al. [17] reveal the influence of the Adair model kinetic parameters and allow for the prediction of these rate constants if an oxygen equilibrium curve is inputted. However, high throughput fractionation of unlabeled RBCs using magnetophoresis has not been explored before to the best of our knowledge.
Therefore, in this work, we explore the potential of magnetic fractionation techniques to separate RBCs from both healthy and SCD blood with the main goal to separate the iron-rich (and presumably healthy) fractions from the iron-poor, aged, or sickle RBCs. The particular permanent magnet used in this experiment has been used to separate paramagnetic RBCs from diamagnetic polystyrene (PS) beads as well as paramagnetic glioblastoma non-stem cells from diamagnetic stem cells in a continuous manner with high purity and yield in each case [18,19]. Additionally, the velocity profile and transport lamina, or the boundary surface within the channel that the user can predetermine with controlled flow rates, have been described [20,21]. The NdFeB permanent magnet has a constant magnetic flux density gradient of 286 T/m in the radial direction and a maximum field of 1.36 T along the inner wall of the channel. The high field produced by this magnet is also capable of batch enrichment of nanoscale magnetic particles as small as 5 nm [22,23]. The RBC and buffer pass through an annulus with a length of 152 mm, inner and outer radii of 3.57 and 4.51 mm, respectively. Because the magnetic gradient points radially outward, the RBCs are introduced along the inner rod and migrate towards the outer wall (Figure 1). The energy gradient will cause the deflection of the paramagnetic, Hb-enriched, and functional RBCs from their original path and their collection into a different outlet. Based on their deflection, proportional to the Hb content of an individual RBC, we expect to be able to separate healthy and functional RBCs from detrimental RBCs.

2. Theory

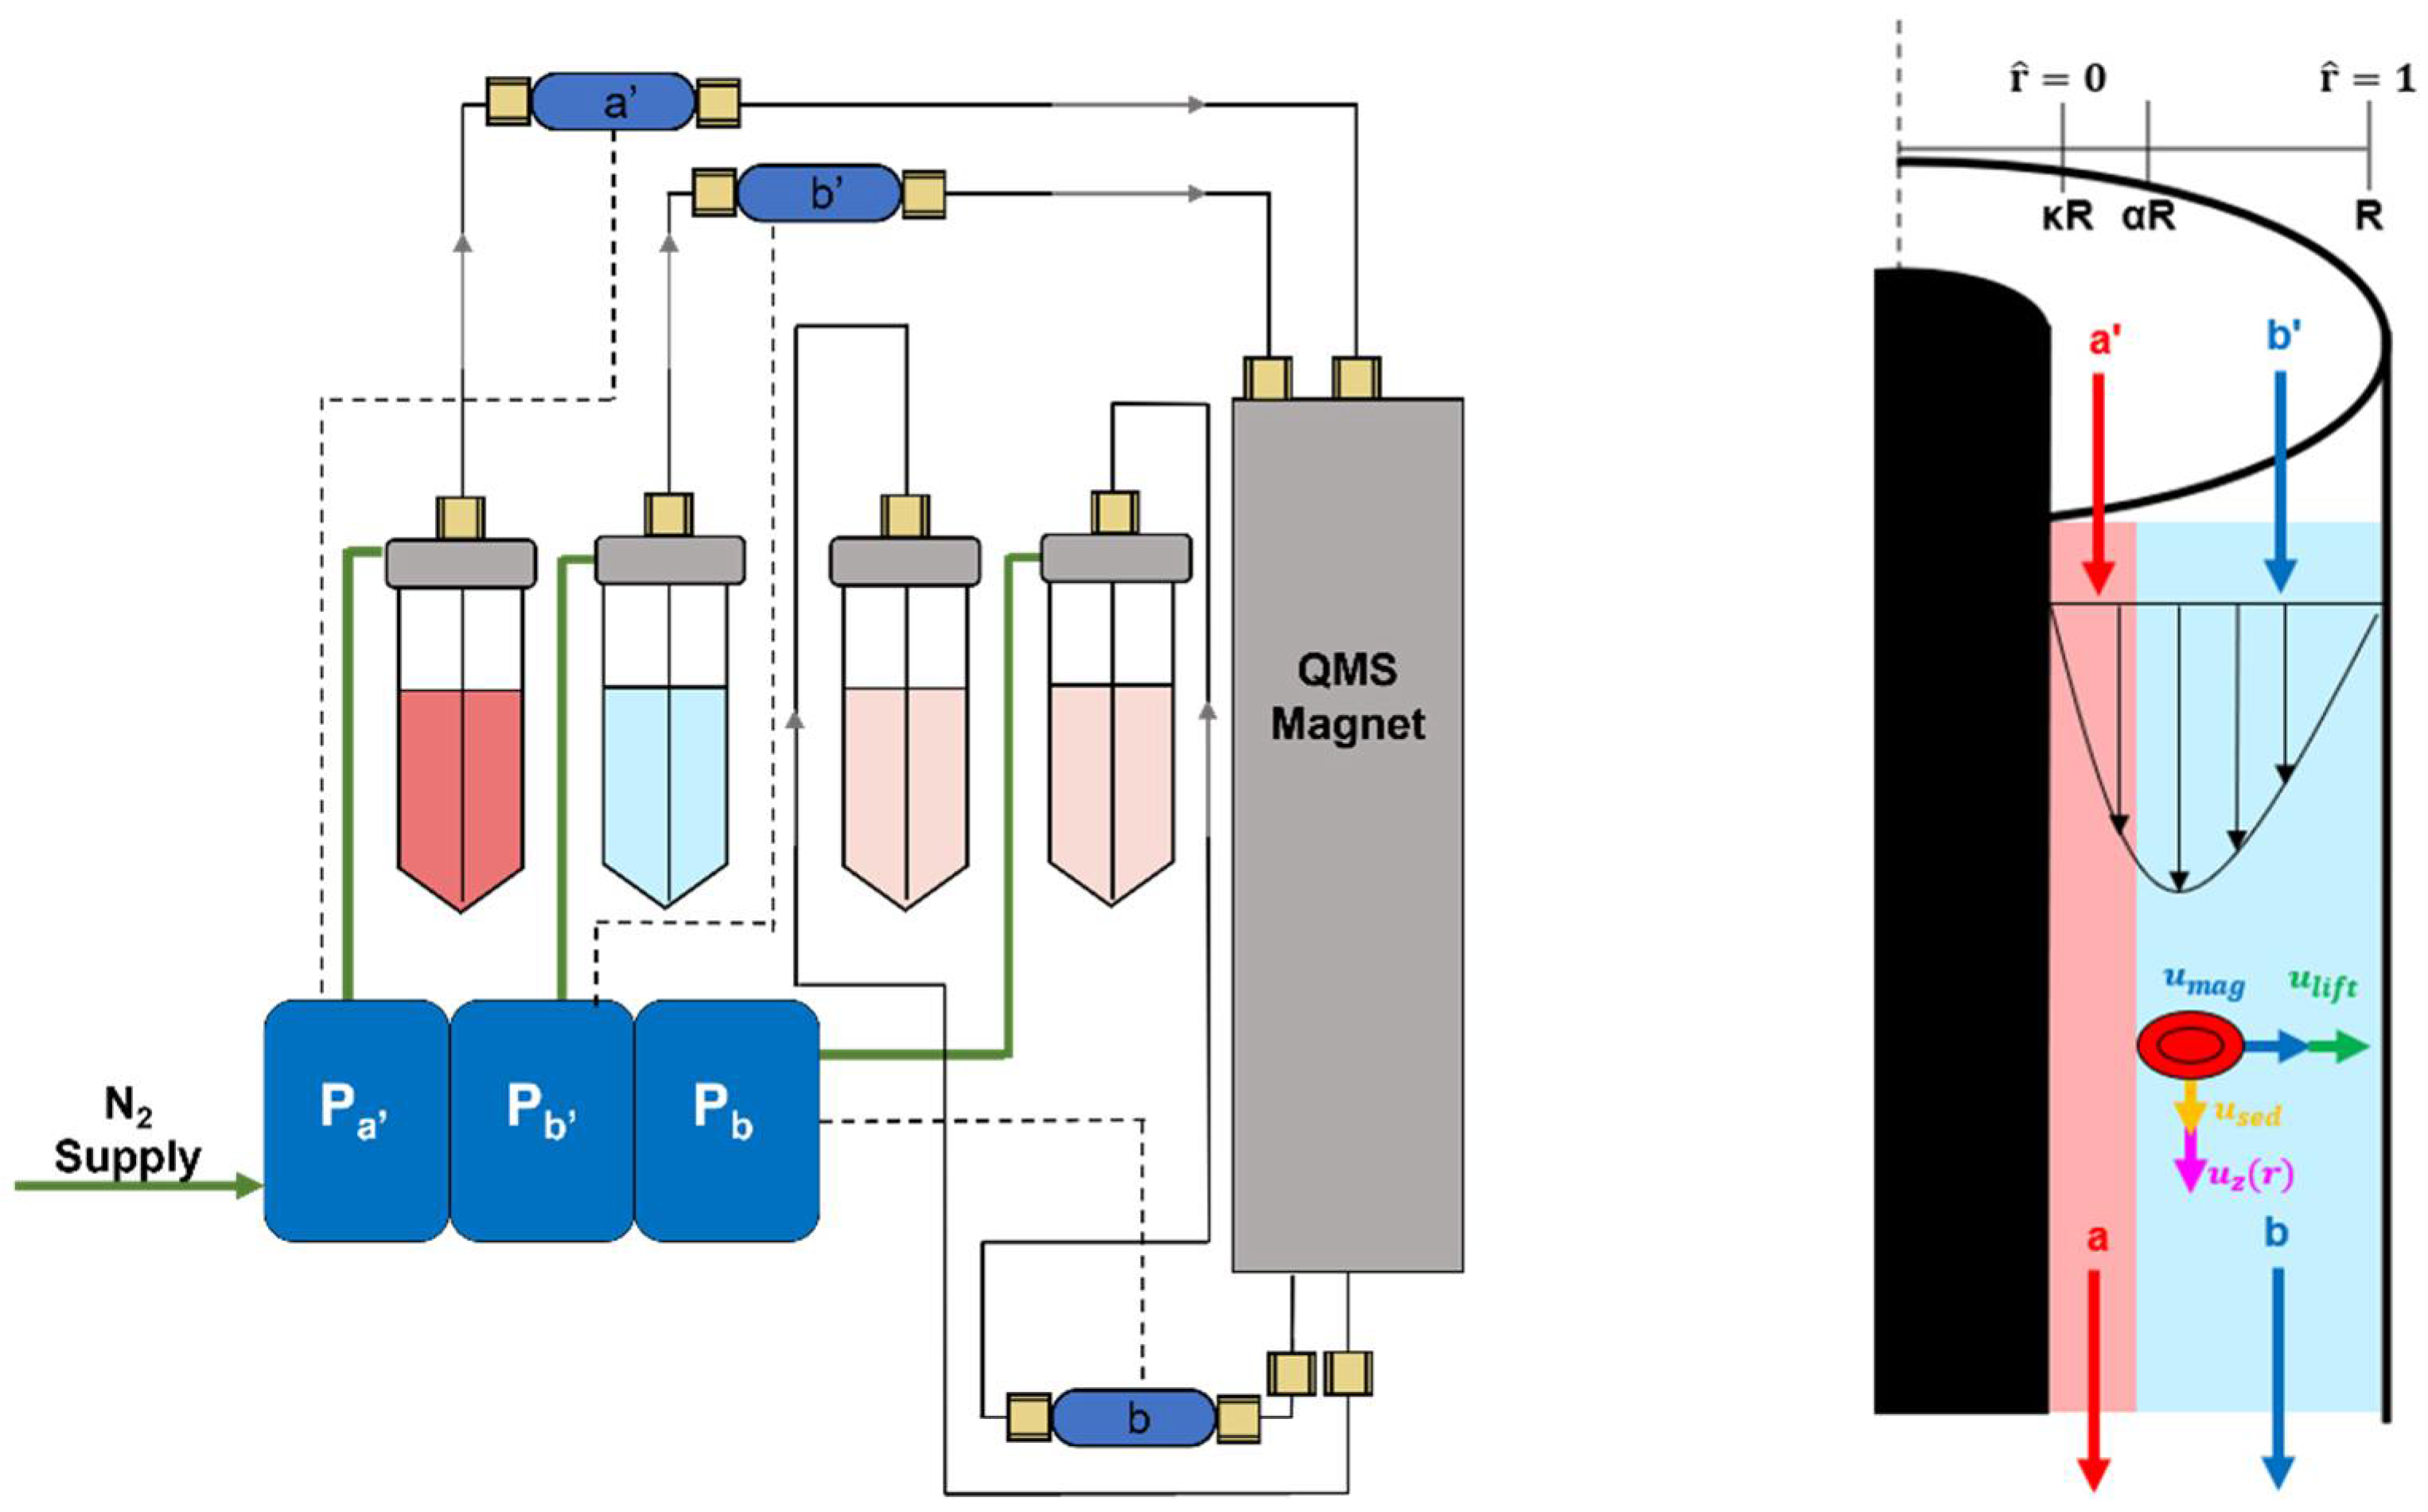
2.1. One and Two Phase Annular Flow

The Hagen–Poiseuille equation relates the volumetric flow rate of a Newtonian fluid in a tube to the pressure differential across the tube and geometry of the channel. A similar expression can be developed for each stream of the annular flow. The axial velocity of the fluid can be expressed as [24]:
v z = Δ P R 2 4 µ L [ 1 ( r R ) 2 1 κ 2 ln ( 1 κ ) ( ln ( R r ) ) ]
where vz represents the axial velocity, ΔP is the pressure drop between the entrance and exit of the annulus, R is the outer radius of the annulus, μ is the viscosity of the buffer fluid, L is the length of the anulus, and κ is the ratio of the inner radius (the central rod) divided by R. Integrating over the cross section for each stream, we obtain the volumetric flow of the blood and buffer solutions as:
V B l o o d ˙ = 0 2 π d θ κ R α R v z ( r ) r   d r = π Δ P R 2 2 μ L [ R 2 2 ( α 2 κ 2 ) R 2 4 ( α 4 κ 4 ) 1 κ 2 ln ( 1 κ ) [ R 2 2 ( α 2 l n ( 1 α ) κ 2 l n ( 1 κ ) ) + R 2 4 ( α 2 κ 2 ) ] ]
V P B S ˙ = 0 2 π d θ α R R v z ( r ) r   d r = π Δ P R 2 2 μ L [ R 2 2 ( 1 α 2 ) R 2 4 ( 1 α 4 ) 1 κ 2 ln ( 1 κ ) [ R 2 4 ( 1 α 2 ) α 2 R 2 2 l n ( 1 α ) ] ]
where α = rinterface/R and represents the boundary between the blood and buffer at the inlet. It is noteworthy that ΔP is the same for each stream and suggests only pressure gradients in the direction of primary flow (no pressure-induced radial RBC migration). The pressure term can conveniently be removed by expressing a ratio between the two streams that allows the user to input the desired transport lamina boundary at the entrance. Dividing Equation (2) by Equation (3) yields:
V Blood ˙ V P B S ˙ = [ R 2 2 ( α 2 κ 2 ) R 2 4 ( α 4 κ 4 ) 1 κ 2 ln ( 1 κ ) [ R 2 2 ( α 2 ln ( 1 α ) κ 2 ln ( 1 κ ) ) + R 2 4 ( α 2 κ 2 ) ] ] [ R 2 2 ( 1 α 2 ) R 2 4 ( 1 α 4 ) 1 κ 2 ln ( 1 κ ) [ R 2 4 ( 1 α 2 ) α 2 R 2 2 ln ( 1 α ) ] ]
One additional input, V ˙ Total , allows the user to determine the flowrate setpoints since the right hand side is filled with column dimensions and inputs.
Next, the fluid velocity profile must be determined. Rearranging and adding Equations (2) and (3) yields the Hagen–Poiseuille solution for one-phase annular flow:
Δ P = 2 μ L V Total ˙ π R 2 ( [ R 2 2 ( α 2 κ 2 ) R 2 4 ( α 4 κ 4 ) 1 κ 2 ln ( 1 κ ) [ R 2 2 ( α 2 ln ( 1 α ) κ 2 ln ( 1 κ ) ) + R 2 4 ( α 2 κ 2 ) ] ] + [ R 2 2 ( 1 α 2 ) R 2 4 ( 1 α 4 ) 1 κ 2 ln ( 1 κ ) [ R 2 4 ( 1 α 2 ) α 2 R 2 2 ln ( 1 α ) ] ] ) 1
where ΔP can be calculated for the desired operating conditions and substituted into Equation (1).
The annular flow profile described in Equations (1)–(5) can be expanded to a two-phase system of immiscible fluids that meet at an interface, such as saline and saline with polyethylene glycol (PEG) [25]. Simplification of the momentum balance for incompressible, axial flow in cylindrical coordinates yields a second order ordinary differential equation:
d d r r τ r z = Δ P L r  
τ r z = µ d v z d r  
Therefore, the boundary conditions must be satisfied for both the velocity and the shear stress ( τ r z ) for both phases. In the case of two miscible streams, the boundary condition that expresses zero shear stress occurs at a particular radial coordinate with the maximum velocity. That particular radial coordinate can be eliminated from Equation (1) because a second no-slip condition exists at r = R.
For a two-phase annular flow profile, each phase has one no-slip boundary and both phases share a boundary condition that states equal shear stress and continuity at the interface. Therefore:
v z , 1 | r = κ R = 0
v z , 2 | r = R = 0
τ r z , 1 | r = α R = τ r z , 2 | r = α R
v z , 1 | r = α R = v z , 2 | r = α R
Integrating Equation (6) yields:
τ r z , 1 = Δ P 2 L r + C Ι , 1 r  
τ r z , 2 = Δ P 2 L r + C Ι , 2 r  
and substituting Equation (10) reveals:
C Ι , 1 = C Ι , 2 = C Ι
Integrating Equations (12) and (13) yield:
v z , 1 = Δ P 4 µ 1 L r 2 + C Ι ln ( r ) µ 1 + C Ι Ι , 1
v z , 2 = Δ P 4 µ 2 L r 2 + C Ι ln ( r ) µ 2 + C Ι Ι , 2
Applying the no-slip boundary conditions from Equations (8) and (9) yield:
C Ι Ι , 1 = Δ P 4 µ 1 L ( κ R ) 2 C Ι µ 1 ln ( κ R )
C Ι Ι , 2 = Δ P 4 µ 2 L ( R ) 2 C Ι µ 2 ln ( R )
and the continuity condition from Equation (11) yields:
C Ι Ι , 2 C Ι Ι , 1 = Δ P 4 L ( α R ) 2 ( 1 µ 1 1 µ 2 ) + C Ι ln ( α R ) ( 1 µ 1 1 µ 2 )
so that (17) and (18) can be substituted to express CI in terms of the pressure differential and user-defined operating conditions as follows:
C Ι = Δ P 4 L ( ( R ) 2 µ 2 ( κ R ) 2 µ 1 + ( α R ) 2 ( 1 µ 1 1 µ 2 ) ) ( ln ( R ) µ 2 + ( ln ( α R ) ( 1 µ 1 1 µ 2 ) ln ( κ R ) µ 1 ) )
Substituting into Equations (15) and (16) yields:
v z , 1 = ( r 2 + ( κ R ) 2 + c Ι ln ( r κ R ) µ 1 )
v z , 2 = ( r 2 + ( R ) 2 + c Ι ln ( r R ) µ 2 )
where ₱ = ΔP/4L.
Finally, and integrating over the cross section of each phase with interface radius αR, we obtain:
V B l o o d ˙ = π 2 µ 1 R 2 [ 2 α 2 c Ι ln ( α κ ) ( α 2 κ 2 ) c Ι + R 2 ( κ 4 α 4 + 2 α 2 κ 2 ) ]
V B u f f e r ˙ = π 2 µ 2 R 2   [ 2 α 2 c Ι ln ( α ) ( 1 α 2 ) c Ι + R 2 ( 1 + α 4 2 α 2 ) ]
Similar to the one-phase analysis, choosing a total flow rate allows the calculation of the pressure term in Equations (21) and (22). Now that each phase is represented by constants and the user-defined radial cutoffs, the two phases entering and exiting the QMS can be controlled without pressure gradients in the radial direction.

2.2. RBC Transport

In addition to the axial fluid velocity, a migrating RBC has a net buoyancy that increases the sedimentation velocity under Stokes drag, vs:
v s = D R B C 2 Δ ρ 18 μ f d
where DRBC is the RBC diameter for a sphere of equivalent volume, fd is a unitless drag coefficient (1.0 for sphere, 1.23 for RBCs) and Δ ρ = ρ R B C ρ f l u i d is the difference between the density of the cell and the medium [26].
The magnetically induced force on a paramagnetic RBC, Fmagnetic is expressed as:
F m a g n e t i c = B B ( r ) 2 μ 0 V Δ χ
where B is the magnetic flux density, V is cell volume, Δ χ is the difference between the magnetic susceptibility of the cell and the medium and μ 0 is the magnetic permeability of free space. In our device, the magnetic field gradient is constant, but the field strength increases as the RBC migrates towards the wall. The effect of this force is also mitigated by Stokes drag [27].
Alternatively, the magnetically induced velocity vm can be expressed using the magnetophoretic mobility, m. This can be determined using our unique cell tracking velocimetry (CTV) device, which has been reported before in the literature [28,29,30,31]. More specifically, within the CTV field of view, the magnetic energy gradient is constant, and the magnetic velocity of the RBC can be expressed as:
v m = m B B ( r ) 2 μ 0
Additionally, lift forces that concentrate particles to inertial equilibrium positions based on particle size and channel dimension are considered where the net migration velocity depends on the sedimentation velocity and distance from the nearest wall [32]. This lift velocity vlift acting on the cell can be expressed as:
v l i f t = 3 D R B C ρ f l u i d u z 2 64 μ ( 1 11 32 ( ρ f l u i d u z l R B C w a l l μ ) 2 )
Lastly, the radial position of RBCs and the phase interface can be expressed as a unitless radius, r ^ , ranging from 0 to 1
r ^ = r   [ m m ] 3.572 4.509 3.572
Although separating magnetic and nonmagnetic cells has been achieved with this system, the average mobilities between these objects differ by a factor between 10 and 50. Separating RBCs with similar paramagnetic mobility would be valuable to both research and clinical fields. Ex vivo stored RBCs and diseased blood samples may be sorted for further analysis to understand the mechanisms of senescence and disease with regards to the mobility or MCHC (mean corpuscular hemoglobin concentration) in a sub-population. Additionally, selective removal of RBCs may improve the outcomes of transfusions after the 14-day threshold (when clinical outcomes diverge from transfusions performed within the first two weeks of blood donation) or possibly recover healthy RBCs beyond the FDA mandated 42-day expiration period [33,34].

3. Materials and Methods

3.1. Sample Preparation and Analysis

RBC samples from healthy donors (6 females and 3 males, ages 21–24) were collected into EDTA coated tubes, and SCD blood was obtained from apheresis waste after routine RBC exchange transfusions, according to protocols approved by the Institutional Review Board of The Ohio State University (IRB no. 2018H0268 and IRB no. 2021H0075). It should be noted that healthy normal RBCs were transfused into the SCD patient, while the patient’s RBCs were simultaneously drawn and collected into an apheresis waste bag. The apheresis device discards patient RBCs into a citrate containing waste bag, while returning plasma and white cells to the patient. The final product contains a mixture of healthy RBCs and native RBCs containing sickle Hb (HbS). RBCs were washed in AS-3 (1300× g for 5 min) and stored at 2–8 °C. Immediately prior to the separation, the RBCs were once again washed and placed into the pressure driven flow system. Following separation with PEG, cells were washed and the refractive index (RI) of the supernatant was measured using an Atago 3850 PAL-RI refractometer to determine the concentration of PEG in the two outlet streams. Coulter Counter (CC) RBC size distribution and concentration was performed using a Beckman Multisizer 4e and oxygen saturation curves were obtained with a Loligo Systems Blood Oxygen Binding System (BOBS) at 37 °C with a pH of 7.4. From the oxygen saturation curves, the oxygen partial pressure at 50% saturation (p50) and Hill coefficient (n) for cooperative oxygen binding to Hb were regressed from the data. CTV was performed on oxygenated (oxyRBCs), deoxygenated (deoxyRBCs, prepared using sodium dithionite), and oxidized (metRBCs, prepared using sodium nitrite) RBC samples and relevant hematological indices, such as the mean corpuscular hemoglobin (MCH), was calculated as previously described in the literature [35]. In the case of post-separation CTV results, velocity was expressed as “u” when characterizing the two fractions from one another, as opposed to the trajectory during a cell’s migration through the magnet, “v”. Mann–Whitney U-Tests were performed on CTV results to determine if the mobilities between separation outlets were statistically significant, since the histograms fail normality tests.

3.2. Pressure Driven Flow System

The pressure driven flow system uses three pairs of Fluigent Flow EZ pressure controllers and flow sensors. The pressure controllers were fed a compressed gas (~1500 mbar air in this case, although nitrogen may be chosen to reversibly deoxygenate the erythrocytes without the use of chemicals, although this method requires a continuous airtight seal) and each controller feeds the air into the head space of a sealed Falcon tube (Figure 1). The downregulated pressure displaces the fluid through PEEK tubing that exits through the top of the sealed tube. The fluids pass through their respective flow sensors (which are calibrated for phosphate buffered saline (PBS), additive solution formula 3 (AS-3) and polyethylene glycol with molecular weight of 8000 (PEG 8000) dissolved into each) and communicate with the pressure controllers to achieve the desired setpoint. Prior to separation, the system was primed with deionized DI water in the opposite direction of the separation, so that water traveled upwards through the QMS to remove bubbles in the manifolds. Then, the system was run forward with RBCs and buffer until RBCs were collected in the outlet tubes for 5 min. This changeover sample was removed from the collection tubes and the separation continued until the feed RBCs were depleted. This method of sample delivery has several advantages. Primarily, it can process much more sample volume than syringe pumps due to both the size of the sample containers and the ability to quickly change feed/product containers while maintaining steady state. Additionally, concentrated RBC mixtures can remain suspended in solution with a magnetic stir bar, something that is not possible with syringe pumps. While peristaltic pumps introduce oscillations into the streams, and syringe pumps use a powerful motor to feed without a feedback loop (and may rupture if the system is obstructed), the compressed air system utilizes a feedback loop to gradually change the head pressure. Therefore, the stream itself is quite consistent and the variability in the reported flow rate is most likely due to measurement errors due to eddies within the sensor.

3.3. Euler Method Crossover Model

RBC crossover through the QMS was calculated using the Euler method. In time steps of 0.05 s, the net magnetic and axial velocities were iteratively calculated, and a new position was determined. The magnetic velocity in the radial direction was calculated with Equations (26) and (27); as the cell moved across the annulus, the magnetic force increased linearly with respect to position due to the increased B-field while the lift force also increased (proportional to uz2) as the cell approached the center of the channel. The cell’s axial velocity was determined with Equation (20) or Equation (21) (depending if the cell is in the non-enriched stream containing PBS or the enriched buffer stream containing PBS and PEG) and Equation (24) until it passed the entire length of the magnet.

4. Results

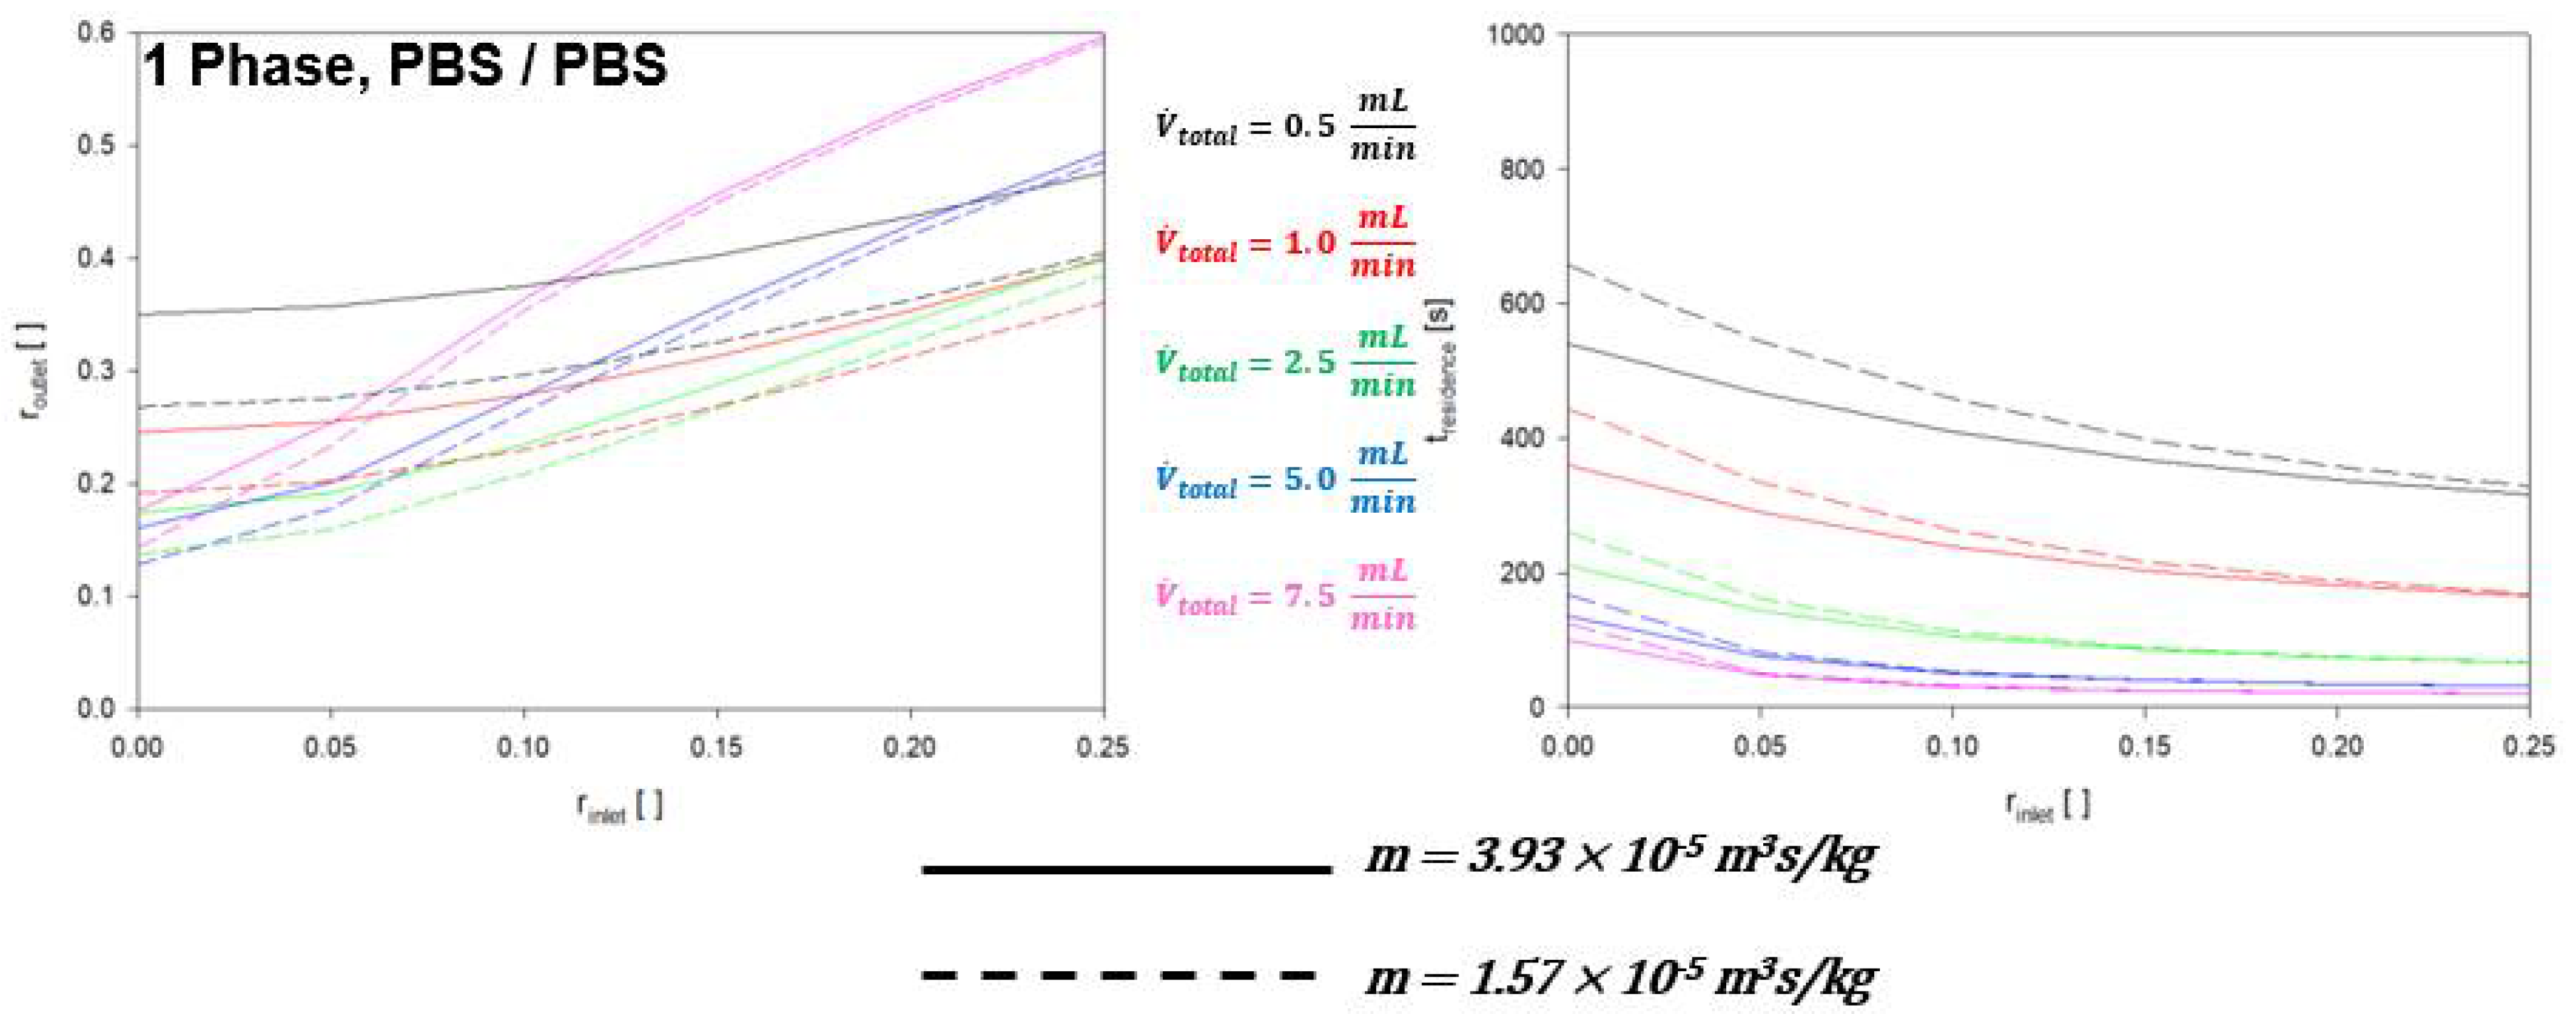
4.1. Single Phase RBC Crossover

The expected radial coordinates and residence times of passaged metRBCs in PBS using the Euler method are displayed in Figure 2. The crossover of two theoretical cells, with mobilities of 3.93 × 10⁻⁵ and 1.57 × 10⁻⁵ m3s/kg, are considered to represent Hb rich (solid lines) and Hb depleted (dashed lines) RBCs while still inside the main cluster of RBCs measured via CTV (approximately the 25th and 75th percentiles). These results reveal an inherent problem with a high throughput device such as the QMS; the feed stream does not enter the channel in a focused, single file line. Rather, some RBCs in a mixed, diluted stream have a “head start”. For example, a high mobility RBC that enters the channel at r ^ = 0 (along the inner wall) will exit at ~ r ^ = 0.26. A low mobility RBC in the same stream that enters the channel at r ^ = 0.20 exits at ~ r ^ = 0.30. Not only will the purity of the enriched outlet suffer due to the heterogenous feed, but the magnetic and inertial forces will act more strongly on RBCs that inherit a starting position closer to the interface. The vertical offset between high and low mobility RBCs decreases as the total flow rate increases due to stronger indiscriminate lift forces, and the curves themselves become steeper at higher flow rates as the lift forces dominate and guide RBCs to their inertial equilibria.
The residence times decrease as the entrance radius, flow rate, and mobility increase. Although B is weakest at the inner wall, κ = 0.79 meaning that the field and, therefore, the magnetic force, is still 79% of the maximum. Therefore, low mobility RBCs that start along the inner wall and close to the no-slip boundary can still migrate into the channel quite easily and have residence times within the same order of magnitude as other RBCs within the feed stream.
Figure 3 shows the nonspecific crossover of healthy, diamagnetic oxyRBCs for two cutoff conditions; the inlet flow rate has V ˙ a / V ˙ Tot = 0.50 in each case, and the outlet has either V ˙ a / V ˙ Tot = 0.50 (red) or 0.55 (blue). The crossover data demonstrate the (i) crossover reproducibility (triplicate measurements performed); (ii) low intra-run flow rate standard deviation (within 5% of setpoint); and (iii) effect that small changes to the outlet transport lamina have on crossover at the lower limits of sensitivity. Because the overall flow rates are low, the lift force has a small effect on this range of flow rates. Because these RBCs have mobilities less than zero, the only force inducing crossover is the lift force. The data confirm this expectation as well as the expected results from an outlet cutoff that favors less crossover.
The crossover of healthy metHb RBCs is also considered in Figure 3 (right panel); rather than changing only the outlet transport boundaries, the thickness of the boundary is varied while keeping the inlet and outlet conditions the same. The results in this case are surprising; in the far boundary (green) dataset, the absolute crossover is much greater than for diamagnetic RBCs (left), but the trend shows decreasing crossover with increasing V ˙ Total . This is primarily due to decreased residence time for paramagnetic migration, which overcomes the increasing strength of lift forces that are expected to assist crossover. In the near boundary (green) dataset, nearly all RBCs cross into the enriched outlet due to both a short migration distance and stronger lift forces than the far boundary (black) dataset. Because these RBCs have an entrance distribution that is both more uniform and closer to the inner wall, the lift force is stronger. Interestingly, the black dataset is nearly identical to the results obtained by Moore et al. for metRBCs under the same conditions [18].
Unfortunately, the enriched and nonenriched fractions have nearly identical magnetic and size characteristics when studied in CTV. Although the crossover results have high reproducibility and small changes in the operating conditions have a clear and predictable effect on the number of RBCs that cross into the enriched outlet, the fractions have identical magnetophoretic mobility distributions in the CTV. Figure 4 shows CTV results for V ˙ a / V ˙ Tot = V ˙ a / V ˙ Tot = 0.5 at the three throughputs (0.25, 0.50, and 0.75 mL/min). At least 500 individual RBCs were tracked for each sample and it is noteworthy that there is a large amount of variability in fully oxidized RBCs; however, this variability is less than an order of magnitude (unlike separations of paramagnetic and diamagnetic entities). A healthy mean corpuscular Hb (MCH) range is 27–32 pgHb per cell; however, this represents the average of all RBCs while the intra-sample variation can be much greater [13]. The same operating conditions that completely separate magnetic and nonmagnetic objects do not produce any differences in the mobility (related to mean corpuscular Hb, or MCH) between outlets and the wide histograms overlap almost completely [35]. Mann–Whitney U-tests yield p-values of 0.078, 0.246, and 0.269 for the pairs shown in Figure 4 with total flow rates of 0.25, 0.50, and 0.75 mL/min, respectively, and the two populations are not significantly different.
A second set of transport boundary setpoints for healthy metRBCs is reported in Figure 5. In this case, increasing the outlet cutoff radius increases selectivity and decreases crossover. Additionally, the crossovers (61% and 75%) lie below an extrapolated green curve, with similar entry conditions in Figure 3. Inspection of the histogram’s cumulative curve along the um axis reveals a noticeable rightward shift of the enriched outlet. In these datasets, p-values are 0.001 and 0.023 in Figure 5 a and b, indicating a significant enrichment. Although the results suggest progress, the large standard deviations cause much of the scatter plots to overlap. At the expense of a large fraction of RBCs, the MCH of the enriched outlets is 1.36 and 0.16 higher than the non-enriched outlets for the two inlet and outlet conditions shown in Figure 5. Due to lift forces that influence all magnetic mobilities indiscriminately, rouleaux, entrance effects into the channel, RBC tumbling/Magnus forces, or any number of interfering phenomena, only modest magnetic enrichment is achieved with a single pass in a one-phase annulus.

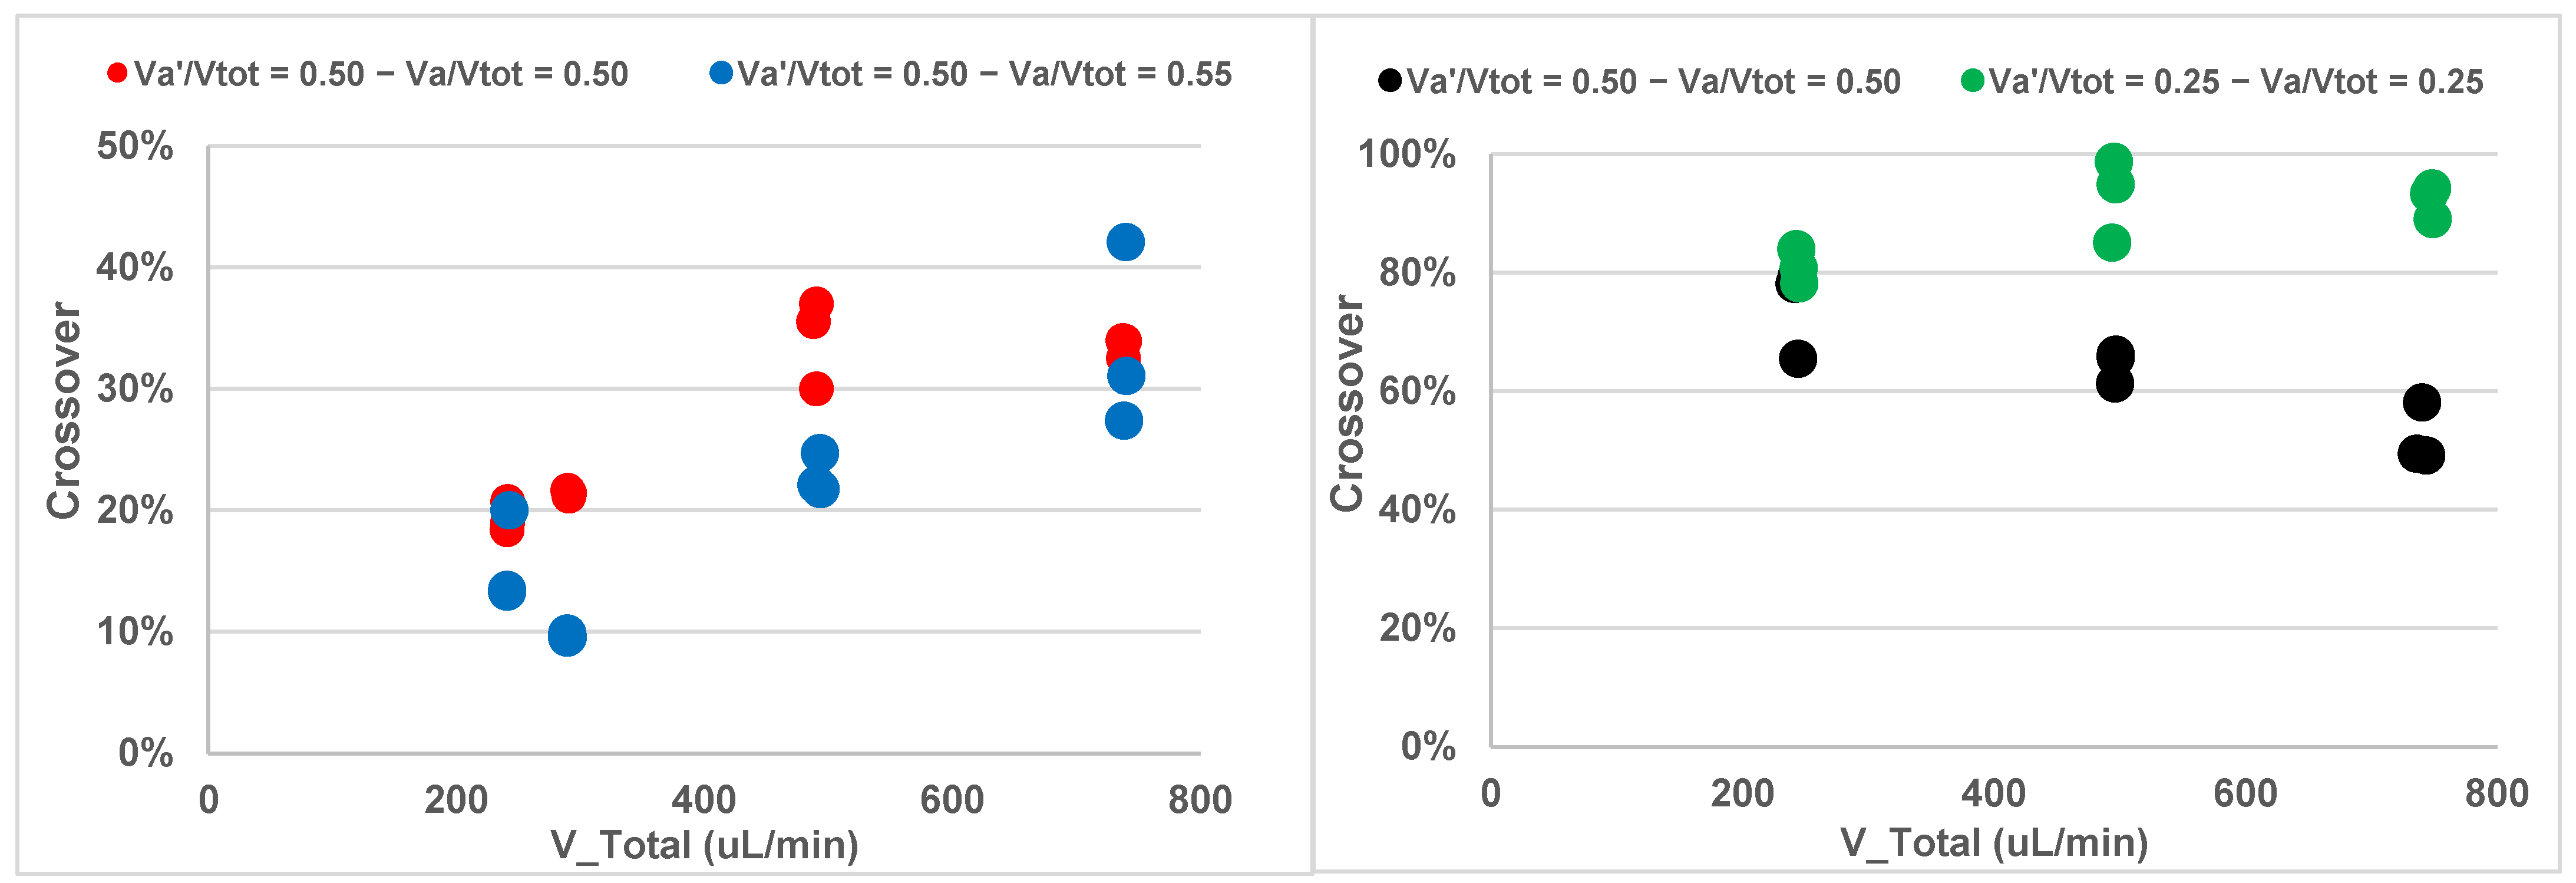
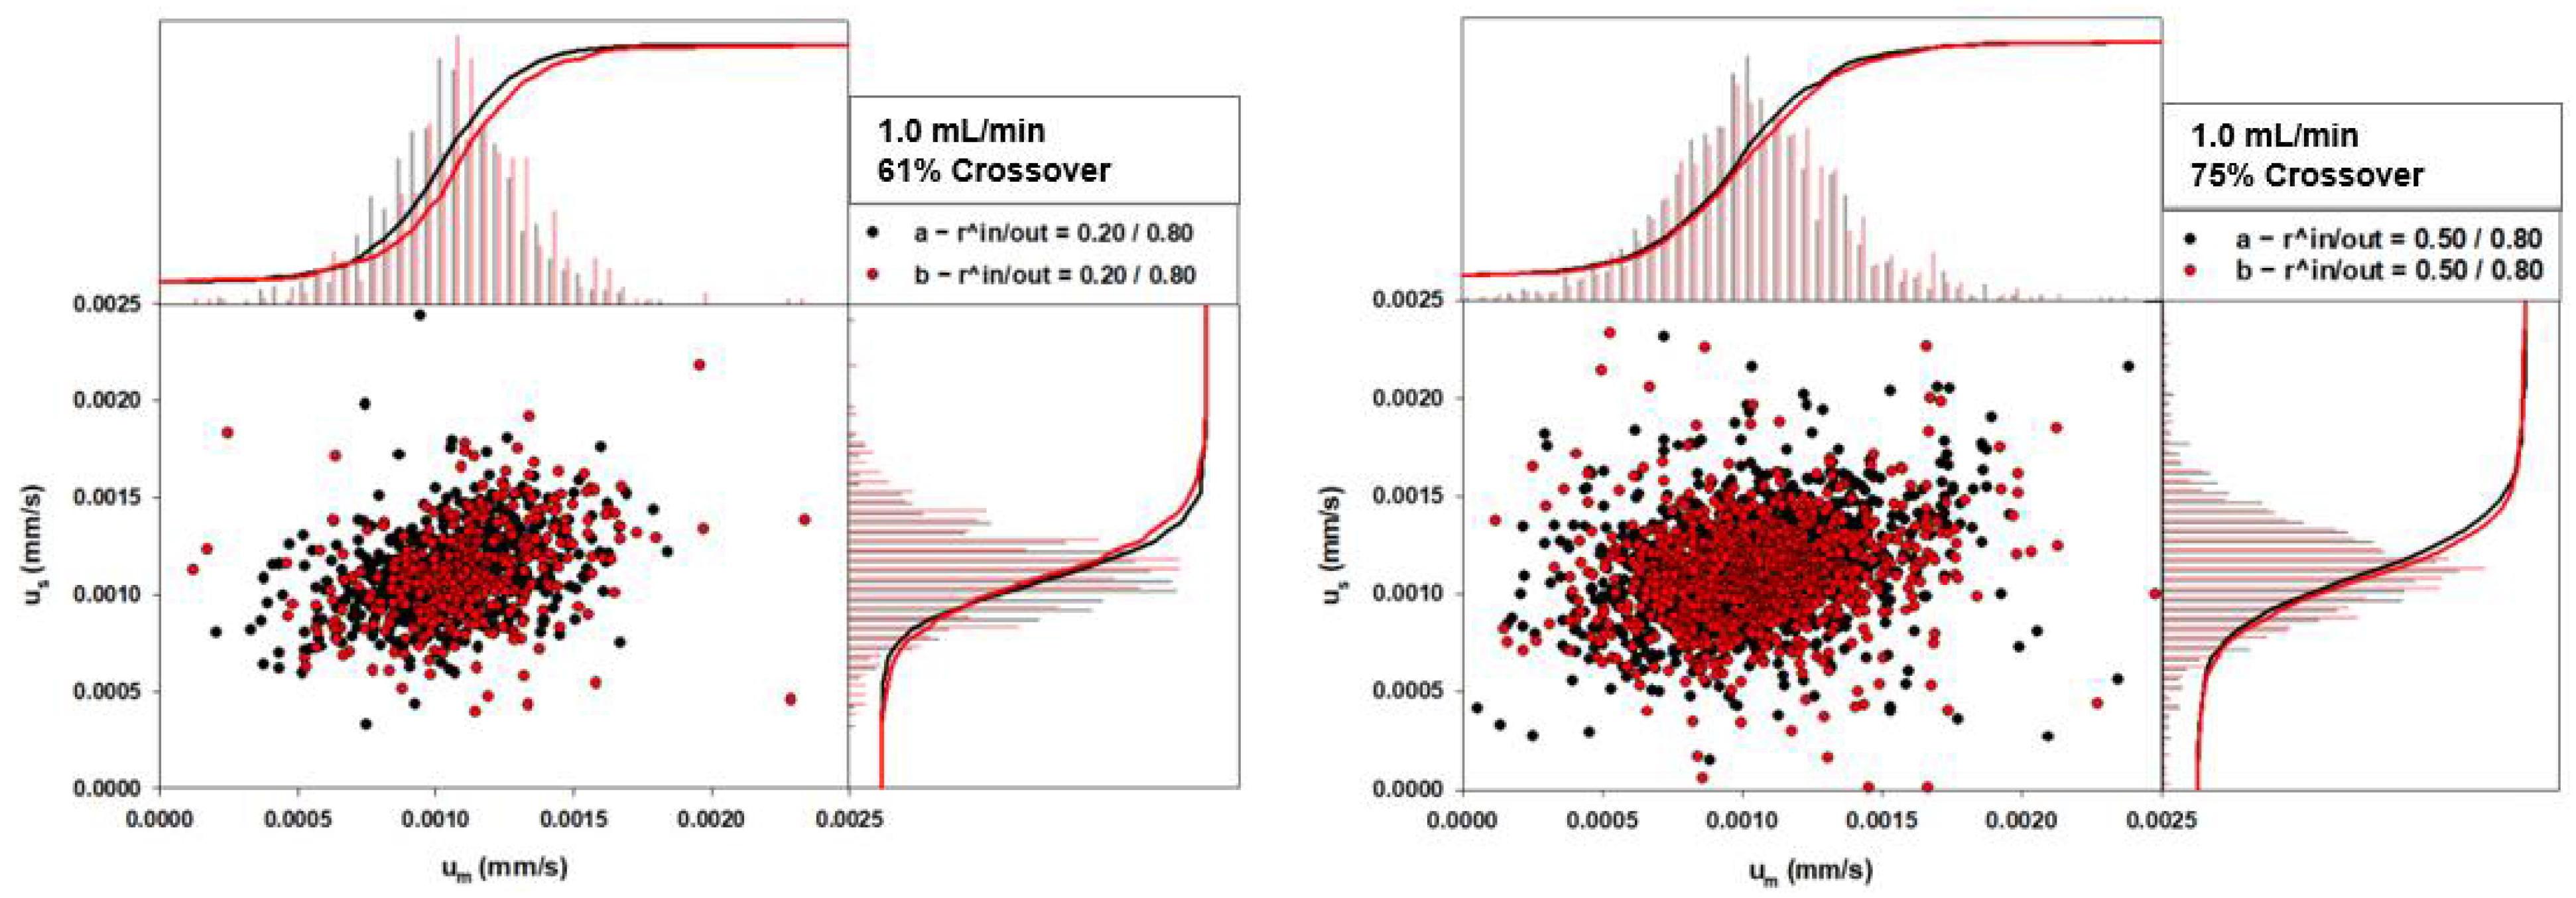
4.2. Two Phase RBC Crossover

Adding PEG to the PBS in the b’ inlet has several effects; it acts as a second aqueous phase to oppose nonspecific mixing; it is more viscous (2.94 mPa*s at 6.0 wt% compared to 0.97 mPa*s for AS-3 at room temp). Inspection of Equation (24) reveals that, when R << 1.0 m and α (the interface radius) is <1.0, V ˙ b has a natural log dependence on the interface radius, α, and an inverse relationship with μ2. Therefore, as viscosity increases, the interface radius must decrease as a result; meaning a smaller radius for the entrance transport lamina and therefore a more uniform entrance for RBCs. Additionally, no lysis is observed. Furthermore, the (a) and (b) outlets have PEG concentrations of 5.35% and 5.67%, respectively, suggesting 84% crossover from (b’) to (a). This matches quite closely with an expected result of 85% (by dividing V ˙ a by V ˙ b ) if the PEG were well-mixed at the outlet. This does not suggest, however, that the two-phase annular flow is not sustained at the beginning or end of the channel (since V ˙ a > V ˙ b in the outlet) because the crossover of both components strongly indicate that the magnetic forces act selectively on RBCs and not on the buffer.
Figure 6 plots the predicted exit positions and residence time for RBCs of different mobilities and flow rates. The mobilities chosen for this plot cover a wide range from 0 (diamagnetic RBCs, only lift forces present), weakly paramagnetic (resembling either oxygenated aged RBCs with some metHb, or an irreversibly sickled RBCs with some deoxyHb), medium, and highly (approximately the center and edge in paramagnetic scatter plots, respectively) paramagnetic RBCs around 5.40 × 10⁻¹⁵ m3s/kg. Above 1.0 mL/min, lift forces begin to overpower the magnetic body forces on the RBCs and all RBCs, regardless of mobility and starting position, focus toward an inertial equilibrium. High flow rate conditions reveal an inflection at 0.25 in the r ^ outlet (y) axis. Most of the radial travel occurs in the AS-3 phase, without PEG. The PEG phase slows the motion of RBCs quite effectively so that the property of interest may be isolated among the RBCs being treated. It is noteworthy that this model assumed (i) equal RBC size, morphology, drag coefficient, and relative buoyancy, and (ii) that these are the same after they cross into the PEG phase, while there is large heterogeneity in SCD RBCs and hyperosmotic PEG that may alter these inputs.
In addition to the effects on healthy RBCs, oxygenated SCD RBCs from apheresis waste were studied. The RBCs were washed with AS-3, diluted to 230 million cells/mL while exposed to ambient oxygen conditions and passed through the QMS with V ˙ Total = 0.50 mL/min with 6.0 wt% PEG in the AS-3 buffer with inlet conditions r ^ inlet = 0.25, r ^ outlet = 0.70. The crossover is only 30% in this case, a notable decrease from similar conditions in Figure 5 due to a thicker transport lamina selection in the outlet. In this scenario, all Hb is believed to be oxygenated, with exception of only a few RBCs, which are irreversibly deoxygenated (and therefore paramagnetic, or at least partially so) and cross into the enriched outlet. While the RBCs are separated in an oxygenated chemical state, Figure 7 illustrates the CTV scatterplots and an oxygen equilibrium curve comparing the feed and outlets under three chemical states (oxyRBCs, deoxyRBCs, and metRBCs) to compare their various behaviors. Interestingly, CTV scatter plots of oxyRBCs confirms that the enriched outlet does, indeed, contain a higher fraction of RBCs that exhibit stronger paramagnetism at ambient conditions than the non-enriched product does (p = 0.001). Similarly, the RBCs that migrate into the (b) outlet while oxygenated RBCs have greater mobility under post-separation deoxygenation treatment (p = 0.001) but similar mobility when oxidized in metRBCs afterwards (p = 0.629). These complex, and seemingly contradicting outcomes, highlight the differing effects of oxygen tension and oxidation on SCD RBCs; the metRBC histograms are markedly more monodisperse than the others. The wide variance in deoxyRBCs may be attributed to the polymerization of HbS at low oxygen tension and the subsequent morphological changes and ensuring influence on the RBC drag force. Additionally, complications with the mixture of healthy and SCD blood in the transfusion waste as well as effects of the RBC storage lesion on the cellular response to chemical treatments leave several questions regarding how MCH can be calculated for SCD blood from trajectories.
The products from this experiment are washed in PBS and triplicate measurements of the oxygen equilibrium curve are sown in Figure 8. While this experiment aimed to remove RBCs with lower oxygen saturations while fully oxygenated, the oxygen equilibrium curve confirms that the RBCs collected in the (b) outlet have lower saturation at all partial pressures across the spectrum. In fact, the enriched outlet has a p50 13.1 mm Hg greater than the feed, and nonenriched outlets has a p50 that is 3.81 mmHg lower than the feed stream. This also suggests that the enriched outlet contains a higher concentration of HbS, and fewer donated RBCs. Further examination of the curves reveals that the differences in saturation, which is proportional to magnetic mobility, is small at ambient conditions (7.2% at 136 mm Hg). However, this difference is over 19% between 40 and 45 mm Hg. Careful control of the RBC buffer’s oxygenation may increase the specificity of the magnetic forces applied to different RBCs, as identifying a “target” cell for negative depletion is difficult in a SCD exchange transfusion. The mobility of all exogenous and native RBCs will increase, and some healthy RBCs will cross as a result. However, the easy control of the inlet and outlet conditions may be chosen based on the predicted crossover of RBCs with a predicted mobility at a chosen pO2. Controlling the oxygenation could either increase the purity, or offset lift forces if higher throughput is desired.

5. Conclusions

The present work shows magnetic enrichment of unlabeled healthy and sickle cell erythrocytes in a pressure driven, high throughput sorting apparatus. The effects of total flow rate, inlet and outlet setpoint flowrates to control the cutoffs, medium of the carrier fluids, and chemical state of the RBCs are studied, and the influence these variables have on MCH and oxygen equilibrium of the outlet streams as well as the crossover. The permanent magnet described is quite versatile; the separation cutoffs can be determined by the flowrates, oxygenated or deoxygenated samples can be used, it can process samples in the range of 108 cells/mL, the feed and exit streams can be seamlessly changed to maintain a continuous process, and the system can still be solved with more layers of immiscible, isotonic carrier fluids. However, the design’s tradeoff between throughput and purity is discussed and the need to maintain Reynolds numbers on the order of 1.0 to mitigate lift forces. Future experiments with more than two phases may further alleviate high crossover while having to maximize throughput at nominally low flow rate. For example, residence times for some diamagnetic cells are quite large.
Although significant shifts in mobility are observed between the outlets of processed metRBC samples, an increase of 0.065 μm/s corresponds to 1.35 pg per cell. Sacrificing 40% of RBCs over a 5-h (300 mL in an RBC unit at 1.0 mL/min) pre-transfusion treatment shown in Figure 5 is not prudent, but a scaled process with multiple passes for recycle streams (similar to a distillation column network) may improve the purity of MCH above a desired threshold. Such an improvement could make magnetic enrichment more practical on older blood units (approaching the 42-day shelf life of stored RBCs) or when resources are scarce and transfusion protocols are changed and blood products are re-purposed. Encouraging results are obtained for untreated SCD blood as well; 30% of cells are removed, achieving a difference of 16.9 mm Hg in p50 between the two outlets in a single pass.

Author Contributions

Conceptualization, M.W.; formal analysis, M.W. and J.G.-P.; funding acquisition, J.C. and A.P.; investigation, M.W. and J.G.-P.; methodology, M.Z. and P.D.; project administration, J.C.; software, J.G.-P.; supervision, J.C. and P.D.; validation, A.P.; visualization, M.W.; writing—original draft, M.W. and J.G.-P.; writing—review and editing, J.C. All authors have read and agreed to the published version of the manuscript.

Funding

This research was funded by National Heart, Lung, and Blood Institute grant number 1R01HL131720-01A1 and DARPA grant number BAA07-21.

Institutional Review Board Statement

IRB#2018H0268 and IRB#2021H0075.

Informed Consent Statement

Informed consent was obtained from all subjects involved in the study.

Conflicts of Interest

The authors declare no conflict of interest. The funders had no role in the design of the study; in the collection, analyses, or interpretation of data; in the writing of the manuscript, or in the decision to publish the results.

References

  1. American Red Cross. US Blood Supply Facts. Available online: https://www.redcrossblood.org/donate-blood/how-to-donate/how-blood-donations-help/blood-needs-blood-supply.html (accessed on 8 April 2022).
  2. McCullough, J. Transfusion Medicine, 3rd ed.; John Wiley & Sons, Inc.: New Jersey, NJ, USA, 2011. [Google Scholar]
  3. World Health Organization. Blood Safety and Availability. Available online: https://www.who.int/news-room/fact-sheets/detail/blood-safety-and-availability (accessed on 8 April 2022).
  4. Muteb, P.B.; Mamba, J.F.J.K.; Pfutila, P.M.; Bilo, V.; Mulefu, J.D.P.; Diallo, D.A. Effectiveness, safety, and cost of partial exchange transfusions in patients with sickle-cell anemia at a sickle cell disease center in sub-Saharan Africa. Med. Sante Trop. 2017, 27, 387–391. [Google Scholar]
  5. Luten, M.; Roerdinkholder-Stoelwinder, B.; Schaap, N.P.M.; de Grip, W.J.; Bos, H.J.; Bosman, G.J.C.G.M. Survival of red blood cells after transfusion: A comparison between red cells concentrates of different storage periods. Transfusion 2008, 48, 1478–1485. [Google Scholar] [PubMed]
  6. Piety, N.Z.; Gifford, S.C.; Yang, X.; Shevkoplyas, S.S. Quantifying Morphological Heterogeneity: A Study of More than 1,000,000 Individual Stored Red Blood Cells. Vox Sang. 2015, 109, 221–230. [Google Scholar]
  7. Eaton, W.A.; Bunn, H.F. Treating Sickle Cell Disease by Targeting HbS Polymerization. Blood 2017, 129, 2719–2726. [Google Scholar] [PubMed] [Green Version]
  8. Jacobs, J.W.; Booth, G.S. Blood Shortages and Changes to Massive Transfusion Protocols: Survey of Hospital Practices during the COVID-19 Pandemic. Transfus. Apher. Sci. 2022, 61, 103297. [Google Scholar] [CrossRef] [PubMed]
  9. Ware, R.E.; de Montalembert, M.; Tshilolo, L.; Abboud, M.R. Sickle Cell Disease. Lancet 2017, 390, 311–323. [Google Scholar] [PubMed]
  10. Gómez-Pastora, J.; Bringas, E.; Lázaro-Díez, M.; Ramos-Vivas, J.; Ortiz, I. The reverse of controlled release: Controlled sequestration of species and biotoxins into nanoparticles (NPs). In Drug Delivery Systems; Stroeve, P., Mahmoudi, M., Eds.; World Scientific: Hackensack, NJ, USA, 2017; pp. 207–244. [Google Scholar]
  11. González Fernández, C.; Gómez-Pastora, J.; Basauri, A.; Fallanza, M.; Bringas, E.; Chalmers, J.J.; Ortiz, I. Continuous-flow separation of magnetic particles from biofluids: How does the microdevice geometry determine the separation performance? Sensors 2020, 20, 3030. [Google Scholar]
  12. Roodan, V.A.; Gómez-Pastora, J.; Karampelas, I.H.; González-Fernández, C.; Bringas, E.; Ortiz, I.; Chalmers, J.J.; Furlani, E.P.; Swihart, M.T. Formation and manipulation of ferrofluid droplets with magnetic fields in a microdevice: A numerical parametric study. Soft Matter 2020, 16, 9506–9518. [Google Scholar]
  13. Chalmers, J.J.; Jin, X.; Palmer, A.F.; Yazer, M.H.; Moore, L.; Amaya, P.; Park, K.; Pan, X.; Zborowski, M. Femtogram Resolution of Iron Content on a per Cell Basis: Ex Vivo Storage of Human Red Blood Cells Leads to Loss of Hemoglobin. Anal. Chem. 2017, 89, 3702–3709. [Google Scholar] [CrossRef] [Green Version]
  14. Kim, J.; Weigand, M.; Palmer, A.F.; Zborowski, M.; Yazer, M.H.; Chalmers, J.J. Single Cell Analysis of Aged RBCs: Quantitative Analysis of the Aged Cells and Byproducts. Analyst 2019, 144, 935–942. [Google Scholar]
  15. Eldeniz, C.; Binkley, M.M.; Fields, M.; Guilliams, K.; Ragan, D.K.; Chen, Y.; Lee, J.M.; Ford, A.L.; An, H. Bulk volume susceptibility difference between deoxyhemoglobin and oxyhemoglobin for HbA and HbS: A comparative study. Magn. Reson. Med. 2021, 85, 3383–3393. [Google Scholar] [CrossRef] [PubMed]
  16. Weigand, M.; Gómez-Pastora, J.; Strayer, J.; Wu, X.; Choe, H.; Lu, S.; Plencner, E.; Landes, K.; Palmer, A.; Zborowski, M.; et al. The Unique Magnetic Signature of Sickle Red Blood Cells: A Comparison Between the Red Blood Cells of Transfused and Non-Transfused Sickle Cell Disease Patients and Healthy Donors. IEEE Trans. Biomed. Eng. 2022; under review. [Google Scholar]
  17. Scrima, R.; Fugetto, S.; Capitanio, N.; Gatti, D.L. Hemoglobin Non-equilibrium Oxygen Dissociation Curve. bioRxiv 2019. [Google Scholar] [CrossRef]
  18. Moore, L.R.; Mizutani, D.; Tanaka, T.; Buck, A.; Yazer, M.; Zborowski, M.; Chalmers, J.J. Continuous, Intrinsic Magnetic Depletion of Erythrocytes from Whole Blood with a Quadrupole Magnet and Annular Flow Channel; Pilot Scale Study. Biotechnol. Bioeng. 2018, 115, 1521–1530. [Google Scholar] [CrossRef]
  19. Park, K.J.J.; Kim, J.; Testoff, T.; Adams, J.; Poklar, M.; Zborowski, M.; Venere, M.; Chalmers, J.J. Quantitative Characterization of the Regulation of Iron Metabolism in Glioblastoma Stem-like Cells Using Magnetophoresis. Biotechnol. Bioeng. 2019, 116, 1644–1655. [Google Scholar] [CrossRef]
  20. Moore, L.R.; Rodriguez, A.R.; Williams, P.S.; McCloskey, K.; Bolwell, B.J.; Nakamura, M.; Chalmers, J.J.; Zborowski, M. Progenitor Cell Isolation with a High-Capacity Quadrupole Magnetic Flow Sorter. J. Mag. Mag. Mater. 2001, 225, 277–284. [Google Scholar] [CrossRef]
  21. Williams, P.S.; Decker, K.; Nakamura, M.; Chalmers, J.J.; Moore, L.R.; Zborowski, M. Splitter Imperfections in Annular Split-Flow Thin Separation Channels: Experimental Study of Nonspecific Crossover. Anal. Chem. 2003, 75, 6687–6695. [Google Scholar] [CrossRef]
  22. Wu, X.; Gómez-Pastora, J.; Zborowski, M.; Chalmers, J. SPIONs Self-Assembly and Magnetic Sedimentation in Quadrupole Magnets: Gaining Insight into the Separation Mechanisms. Sep. Purif. Technol. 2022, 280, 119786. [Google Scholar] [CrossRef]
  23. Gómez-Pastora, J.; Wu, X.; Sundar, N.; Alawi, J.; Nabar, G.; Winter, J.O.; Zborowski, M.; Chalmers, J. Self-assembly and sedimentation of 5 nm SPIONs using horizontal, high magnetic fields and gradients. Sep. Purif. Technol. 2020, 248, 117012. [Google Scholar] [CrossRef]
  24. Bird, R.B.; Stewart, W.E.; Lightfoot, E.N.; Klingenberg, D.J. Shell Momentum Balances and Velocity Distributions in Laminar Flow. In Introductory Transport Phenomena; Sayre, D., Ed.; Wiley: Hoboken, NJ, USA, 2014; pp. 57–58. [Google Scholar]
  25. Nam, K.H.; Chang, W.J.; Hong, H.; Lim, S.M.; Kim, D.I.; Koo, Y.M. Continuous-flow fractionation of animal cells in microfluidic device using aqueous two-phase extraction. Biomed. Microdevices 2005, 7, 189–195. [Google Scholar] [CrossRef]
  26. Zhbanov, A.; Yang, S. Effects of Aggregation on Blood Sedimentation and Conductivity. PLoS ONE 2015, 10, e0129337. [Google Scholar] [CrossRef] [PubMed] [Green Version]
  27. González-Fernández, C.; Gómez-Pastora, J.; Bringas, E.; Zborowski, M.; Chalmers, J.J.; Ortiz, I. Recovery of Magnetic Catalysts: Advanced Design for Process Intensification. Ind. Eng. Chem. Res. 2022, 60, 16780–16790. [Google Scholar] [CrossRef]
  28. Kim, J.; Gómez-Pastora, J.; Weigand, M.; Potgieter, M.; Walters, N.A.; Reátegui, E.; Palmer, A.F.; Yazer, M.; Zborowski, M.; Chalmers, J.J. A Subpopulation of Monocytes in Normal Human Blood Has Significant Magnetic Susceptibility: Quantification and Potential Implications. Cytometry A 2019, 95, 478–487. [Google Scholar] [CrossRef] [PubMed]
  29. Gómez-Pastora, J.; Kim, J.; Multanen, V.; Weigand, M.; Walters, N.A.; Reátegui, E.; Palmer, A.F.; Yazer, M.H.; Zborowski, M.; Chalmers, J.J. Intrinsically magnetic susceptibility in human blood and its potential impact on cell separation: Non-classical and intermediate monocytes have the strongest magnetic behavior in fresh human blood. Exp. Hematol. 2021, 99, 21–31. [Google Scholar] [CrossRef] [PubMed]
  30. Weigand, M.R.H.; Gómez-Pastora, J.; Kim, J.; Kurek, M.T.; Hickey, R.J.; Irwin, D.C.; Buehler, P.W.; Zborowski, M.; Palmer, A.F.; Chalmers, J.J. Magnetophoretic and spectral characterization of oxyhemoglobin and deoxyhemoglobin: Chemical versus enzymatic processes. PLoS ONE 2021, 16, e0257061. [Google Scholar] [CrossRef]
  31. Kim, J.; Gómez-Pastora, J.; Gilbert, C.J.; Weigand, M.; Walters, N.A.; Reátegui, E.; Palmer, A.F.; Yazer, M.; Zborowski, M.; Chalmers, J.J. Quantification of the mean and distribution of hemoglobin content in normal human blood using cell tracking velocimetry. Anal. Chem. 2020, 92, 1956–1962. [Google Scholar] [CrossRef]
  32. Zhang, J.; Yan, S.; Yuan, D.; Alici, G.; Nguyen, N.T.; Warkiani, M.E.; Li, W. Fundamentals and Applications of Inertial Microfluidics: A Review. Lab Chip 2016, 16, 10–34. [Google Scholar] [CrossRef] [Green Version]
  33. Franco, R.S.; Puchulu-Campanella, M.E.; Barber, L.A.; Palascak, M.B.; Joiner, C.H.; Low, P.S.; Cohen, R.M. Changes in the Properties of Normal Human Red Blood Cells during in Vivo Aging. Am. J. Hematol. 2013, 88, 44–51. [Google Scholar] [CrossRef] [Green Version]
  34. Maruyama, T.; Fukata, M.; Fujino, T. Physiological and Pathophysiological Significance of Erythrocyte Senescence, Density and Deformability: Important but Unnoticed Trinity. J. Biorheol. 2020, 34, 61–70. [Google Scholar] [CrossRef]
  35. Gómez-Pastora, J.; Weigand, M.; Kim, J.; Palmer, A.F.; Yazer, M.; Desai, P.C.; Zborowski, M.; Chalmers, J.J. Potential of Cell Tracking Velocimetry as an Economical and Portable Hematology Analyzer. Sci. Rep. 2022, 12, 1–12. [Google Scholar] [CrossRef]
Figure 1. A schematic of the pressure driven flow system (left) shows that pressurized air/N2 (green) exits the pressure control units (blue), pressurizes the headspace in the sample tubes through a port on the side of the airtight lid, and the cell suspension travels through PEEK tubing that exists the top of the container. The RBC-rich (a’) and buffer (b’) feed streams enter the annulus embedded in the bore of the QMS permanent magnet, pass though, and exit as the nonenriched (a) and enriched (b) outlets. Downstream of the magnet, these streams pass through flow sensors and data lines (dotted) provide feedback to the corresponding pressure controller. The pressure controller on the (b) stream provides backpressure into the QMS to achieve the desired outlet setpoints and (a) is left uncontrolled and open to atmosphere. The unitless radius, r ^ , is illustrated (right) with the inner wall (κR) and interface (αR) coordinates, and resulting axial velocity profile induced on a RBC inside the QMS.
Processes 10 00927 g001
Figure 2. Simulated crossover for paramagnetic healthy RBCs and their expected residence times. Five throughputs are graphed with two mobilities each; the high (solid line) and low (dashed line) mobilities correlate to the 75th and 25th percentile for a typical healthy RBC sample. As RBCs age during ex vivo storage, they lose Hb through microvesiculation and exhibit lower mobility when converted into the deoxy or met state while some RBCs remain fully paramagnetic.
Processes 10 00927 g002
Figure 3. Nonspecific crossover of healthy, oxyRBCs as a function of total flow rate (left). The inlet streams remain constant between the two transport lamina conditions, but the blue dataset slightly resists flow in the enriched (b) outlet. This condition has, on average, 7% less crossover than the red dataset with an outlet cutoff closer to the center of the rod. The crossover of healthy, paramagnetic metRBCs as a function of total flow rate is also shown (right). Both experiments have inlet and outlet streams with the same cutoffs but compare different interfacial radii. The far boundary (black) dataset has decreasing crossover while the near boundary (green) dataset has more crossover with greater V ˙ Total . The reasons for this short distance of radial travel have to do with the inertial equilibrium that the lift force guides the RBCs to, as well as short residence times that the paramagnetic RBCs spend inside the magnet.
Processes 10 00927 g003
Figure 4. CTV results for the nonenriched (a, black) and enriched (b, red) streams that exit the QMS annulus for transport lamina conditions V ˙ a / V ˙ Tot = V ˙ a / V ˙ Tot = 0.5. After separation in the QMS, RBCs’ magnetic and sedimentation trajectories are measured in the region with constant Sm. The results are shown in an offset histogram and accompanying cumulative curve. Non-parametric Mann–Whitney U-tests confirm the (a) and (b) outlets are similar for all three scatter plots.
Processes 10 00927 g004
Figure 5. CTV results for the nonenriched (a, black) and enriched (b, red) streams that exit the QMS annulus for transport lamina conditions with V ˙ a > V ˙ a , resulting in a significant increase in magnetic mobility in the (b) outlet. However, this increase amounts to only 1.36 and 0.16 pgHb in MCH between the two plots.
Processes 10 00927 g005
Figure 6. Predicted RBC crossover (left) and residence times (right) using the Euler method for four different mobilities (represented by differing curve patterns) and five flow rates (different colors) for a chosen entrance boundary (and therefore interface) at r ^ = 0.25.
Processes 10 00927 g006
Figure 7. CTV data between outlets for oxygenated, SCD RBCs passing through the QMS while PEG is in the buffer. After separation, the RBCs are oxygenated (left), deoxygenated (center), and oxidized (right), and scatter plots of the trajectories are shown. There is significant shift in magnetic mobility in the x-axis for the oxygenated and deoxygenated states, but the metRBCs from both outlets have the same mobility. This leaves several questions about the effects of density, shape and Fe oxidation state in post-transfusion SCD blood.
Processes 10 00927 g007
Figure 8. Oxygenation saturation curves for a single pass of SCD blood through the magnetic sorter. The oxygen partial pressure at 50% saturation (p50) and Hill coefficient (n) for cooperative oxygen binding to Hb are included in the plot. The enriched (green) curve shows a much lower saturation than the feed (black), particularly at low pO2. This indicates the presence of irreversibly polymerized and deoxygenated RBCs containing HbS. The CTV scatter plots only show small shifts in mobility and sedimentation but reflect the high and low extremes of pO2. Characterizing the outlet fractions throughout the intermediate saturations reveal that some RBCs in heterogenous apheresis waste have very low oxygen uptake (and, therefore, quite paramagnetic) at intermediate oxygen tension.
Processes 10 00927 g008
Publisher’s Note: MDPI stays neutral with regard to jurisdictional claims in published maps and institutional affiliations.

