Article

Economic Optimization Dispatch Model of a Micro-Network with a Solar-Assisted Compressed Air Energy Storage Hub, with Consideration of Its Operationally Feasible Region

1
School of Electrical Engineering, Shenyang University of Technology, Shenyang 110870, China
2
Clean Energy Development Institute, State Grid Qinghai Electric Power Company, Xining 810008, China
3
Qinghai Key Laboratory of Efficient Utilization of Clean Energy, Qinghai University, Xining 810016, China
*
Author to whom correspondence should be addressed.
Processes 2022, 10(5), 963; https://doi.org/10.3390/pr10050963
Submission received: 26 April 2022 / Revised: 8 May 2022 / Accepted: 10 May 2022 / Published: 11 May 2022
(This article belongs to the Special Issue Modeling and Optimization of Hybrid Energy Systems)

Abstract

:
Using a variety of renewable energy sources can significantly improve energy system flexibility and efficiency. Energy hubs, which have the function of generating, converting, and storing energy in various forms, are vital facilities in micro-energy networks (MENs). In this paper, we present a Solar-Assisted Compressed Air Energy Storage (SA-CAES) hub which can accommodate and flexibly supply multi-energy by being connected to a power distribution network (PDN) and a district heating network (DHN). We formulate economic dispatch models of the SA-CAES hub, the PDN, and the DHN, respectively. The economic dispatch model is formulated as a mixed-integer linear programming problem (MILP) that can be solved by commercial solvers. Further, the operationally feasible region of the SA-CAES hub is explored by thermodynamic analysis. The results indicate that the operation costs have been reduced by 4.5% in comparison with conventional MENs.

1. Introduction

1.1. Background and Motivation

With the still current pandemic COVID-19 pandemic and the military conflict between Ukraine and Russia, energy supply shortages and surging prices have greatly impacted the cost of living for residents at the beginning of 2022 [1,2]. To address the issue of energy shortages and soaring costs, many governments are dedicated to developing distributed renewable energy sources (RESs). Compared with separated energy generation and supply modes, combined heating and power (CHP) systems are designed to supply heating and power with high operational and economic efficiency and low carbon dioxide emissions and have been widely deployed in modern buildings. CHP coupling with energy storage facilities, which can accommodate fluctuating and intermittent energy such as solar and wind power and provide continuous and stable energy to meet user demands, has speeded up development of the concept of the multi-carrier energy hub. Therefore, the energy hub concept has been proposed by the Swiss Federal Institute of Technology in Zurich [3,4].

1.2. Literature Review

The term “energy hub” refers to comprehensive facilities with multiple energy inputs and outputs of energy into energy conversion and storage units [5]. Current research mainly focuses on energy hub design and operations based on various compressed air energy storage system (CAES) architectures and participating in the energy market.
From the perspective of energy hub design, various CHP-type systems based on advanced adiabatic compressed air energy storage systems (AA-CAESs) or CAESs with flexible heat and power operating modes already exist, e.g., the hybrid cycle system composed of a CAES and a gas turbine [6], the hybrid system composed of an AA-CAES and solar thermal trough collectors [7], a wind–solar CAES complementary system [8], the high-temperature hybrid CAES system composed of resistance wires and an AA-CAES [9,10], and a CAES coupled with a refrigeration cycle system [11]. In fact, AA-CAES is a natural energy hub [12] which can accommodate and store surplus electricity and compression heat by means of compressors and a thermal energy storage system (TES). Moreover, it can also co-generate cooling–heating and electric power in response to load demand [13]. An overall design scheme based on AA-CAESs for clean energy hubs with renewable energy coordination and comprehensive utilization has been put forward in [14]. Energy hubs, including wind, photovoltaic power (PV), and solar irradiance inputs, are discussed in [15]. To improve the efficiency and economy of the AA-CAES, the design schemes and key parameters for the tri-generation performance of the AA-CAES has been studied in [16]. A novel CCHP system based on a hybrid tri-generative CAES was proposed and an assessment for system cooling–heating and power capacity analyzed in [17]. The authors of [18] proposed the design principles of a smart micro-energy grid which adopts a hybrid CAES to act as a clean energy hub to provide multi-energy for users.
From an operational perspective, AA-CAES systems to power network dispatch operations were modeled and performed in [19,20] respectively. Optimal and stochastic performances of an energy hub based on a hybrid CAES are presented in [21]. A combined dispatch energy hub model was established in [22] based on the actual thermodynamic process of an AA-CAES plant. On the energy economic dispatching view, a low-carbon economic dispatch energy hub model of CAES has been proposed in [23] for a multi-energy grid. An architecture for an energy hub based on the AA-CAES along with a bi-level optimization model is established in [24]. Optimized operation strategies to absorb PV power have been formulated in [25]. The scheduling problem of CHP and the co-optimization of the PDN and DHN transmission constraint problem are studied in [26,27], respectively.
From the energy hub participating in the energy market perspective, to determine the interactions between heat and power markets, strategic behavior in multi-resource energy markets has been investigated in Denmark [28]. An equilibrium constraints (MPEC) model has been modeled in [29] to analyze the strategic behaviors of a profit-driven energy hub in the electricity and heating market. In [30], a bi-level programming model for energy hub optimization was proposed, which serves as an intermediary agent between power and natural gas holders. Additionally, [31] studied the optimal bidding strategy of energy hubs in the power market and considered uncertain market prices with a stochastic method.

1.3. Novelty and Contributions

The main contributions of this article are: (1) the proposition of a novel schematic of a SA-CAES acting as an energy hub for supplying heat and power; (2) a linearization dispatch model of the SA-CAES hub is built by considering the feasible operating region for a SA-CAES hub based on thermodynamic characteristics; and (3) a distributed energy model of a radial PDN and DHN is depicted and optimized to minimize operation costs compared with conventional MENs.
The rest of paper is organized as follows. Section 2 describes the design scheme of the SA-CAES that acts as energy hub in a DES. Section 3 elaborates the optimal operation of the SA-CAES hub incorporating a PDN and a DHN, modeled to reduce operation costs and PV curtailment. The operationally feasible region based on thermodynamic analysis and a dispatch model is verified through MENs composed of a SA-CAES hub, an 8-node DHN, and a 10-bus PDN in Section 4, followed by conclusions in Section 5.

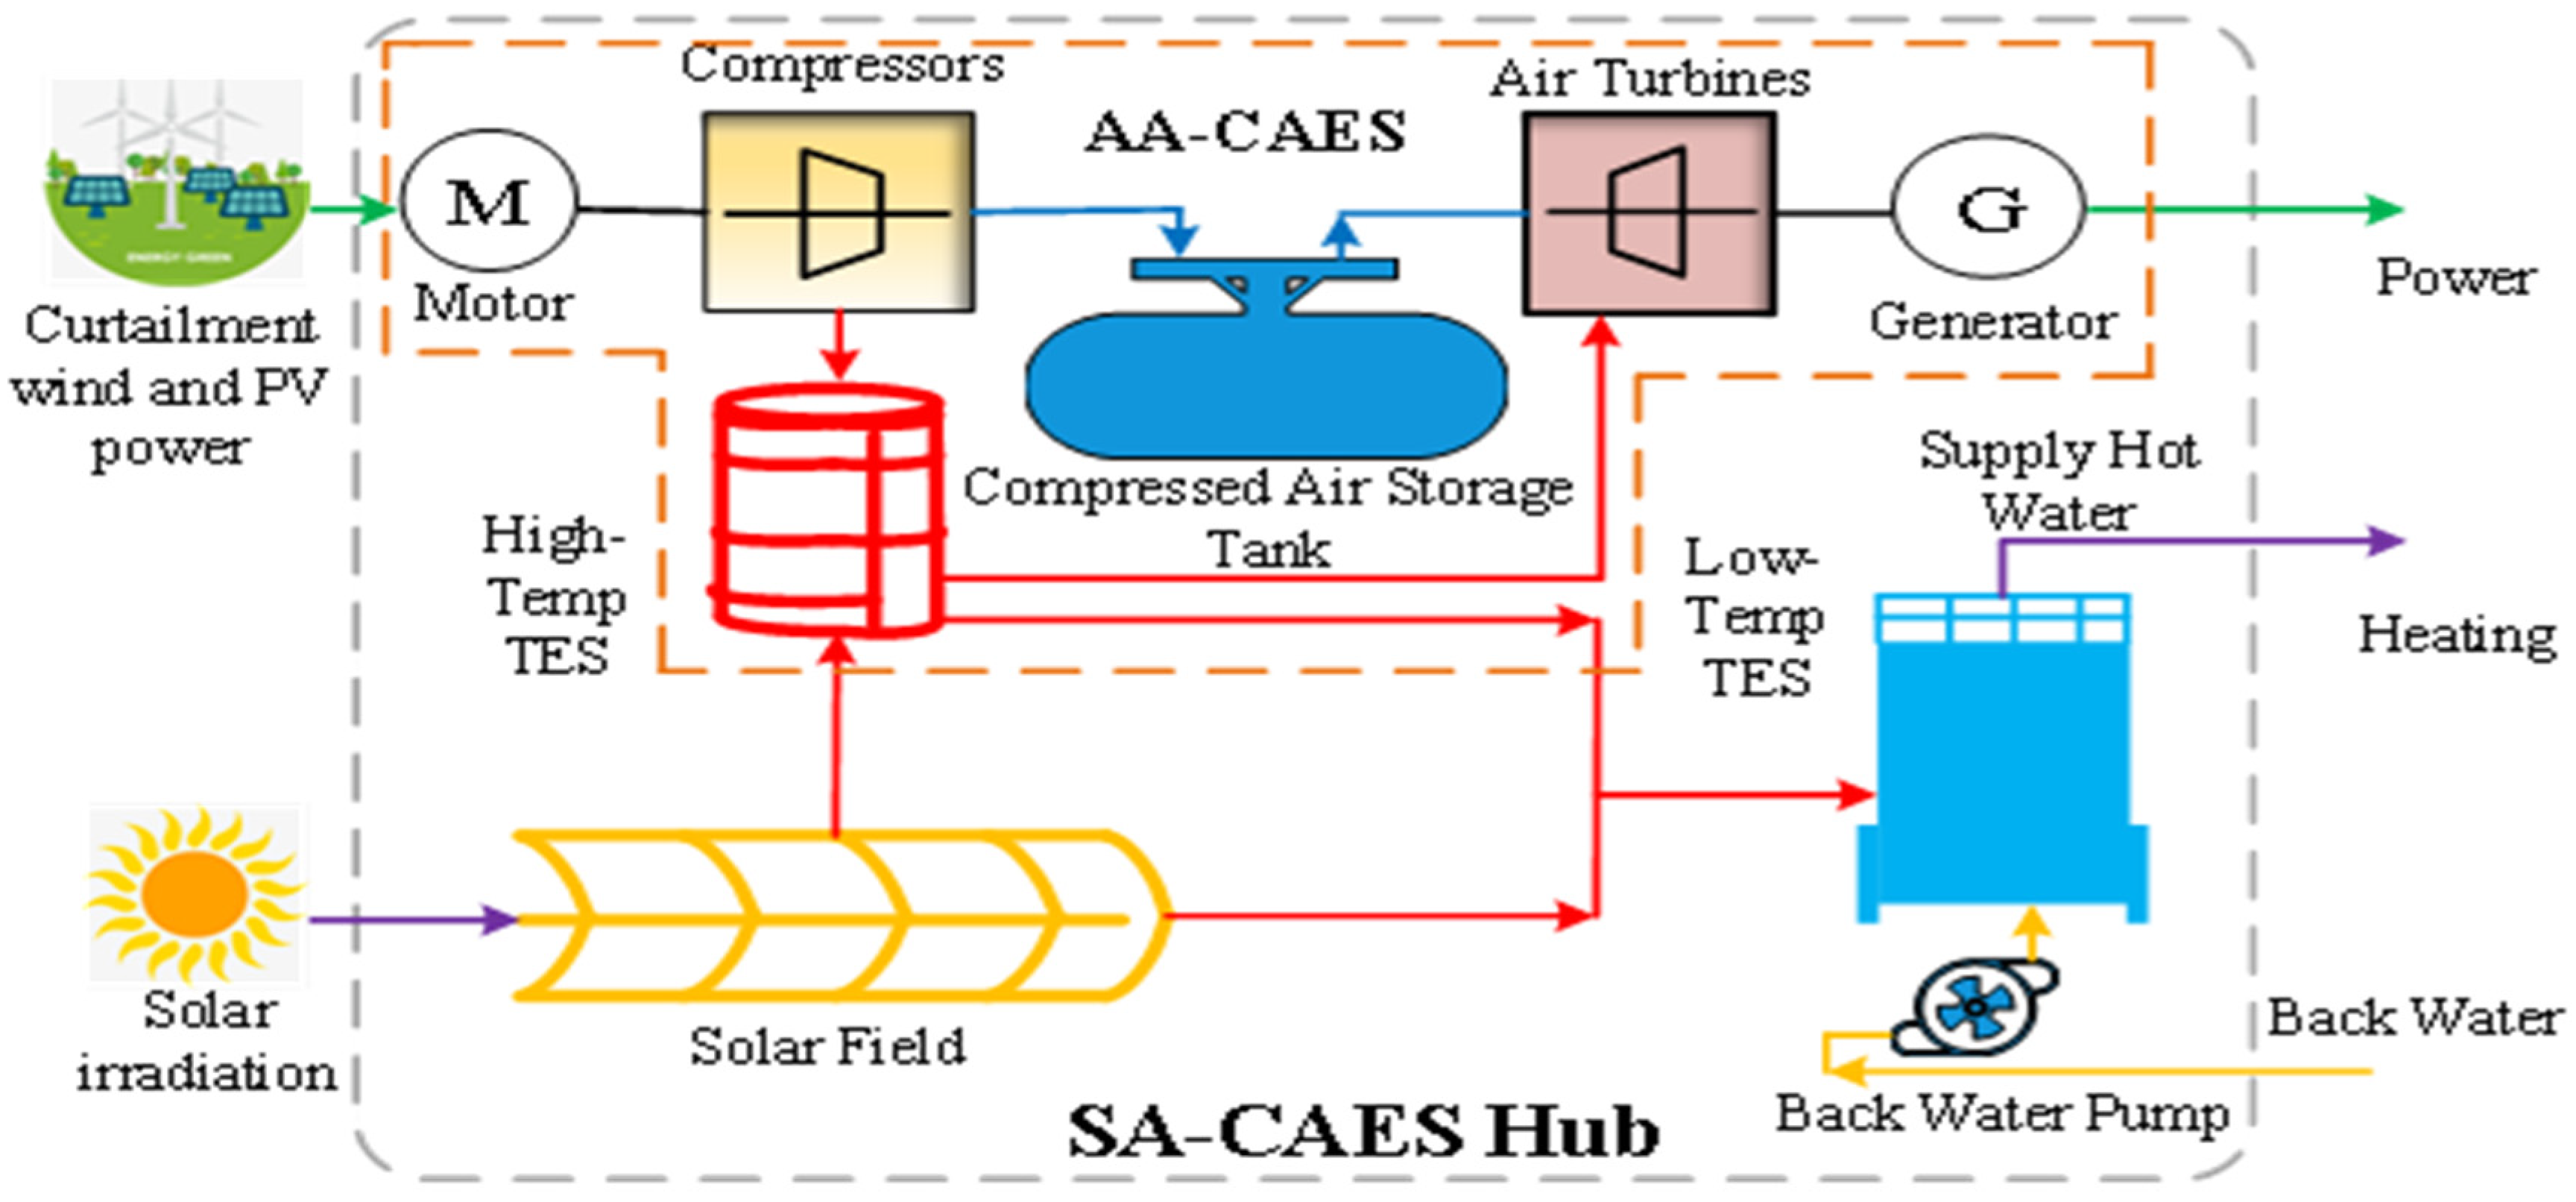
2. The Design Scheme of the SA-CAES Hub

For areas with limited natural gas and abundant solar energy resources, such as the northwestern villages of China, we can utilize solar energy and design efficient and flexible SA-CAES energy hubs. Figure 1 presents the design flow chart of the proposed SA-CAES hub which adopts the solar thermal collectors and storage tanks to provide additional heat supply to the energy flow hub, thus enabling flexible thermal electric supply with thermoelectric storage.
The SA-CAES consists of three main subsystems: the parabolic trough collectors field, the thermal energy storage tank (TES), and the AA-CAES. The compressors can accommodate photovoltaic power (PV) and convert it to high-pressured air stored in an air storage tank. Meanwhile, direct normal irradiation is reflected by the parabolic trough collectors and concentrated on evacuated tubes to convert heat into TES. The collected solar thermal energy can either be stored in the TES tank or directly enhance the power capacity of compressed air to drive the turbo-generator to supply electricity.

3. Economic Dispatch Model of a MEN

3.1. SA-CAES Hub Formulation

The SA-CAES hub has the capability to accommodate and provide heat and electricity power; therefore, the model of the SA-CAES hub is similar to the AA-CAES except for its solar field. The SA-CAES hub model in the charging process at period τ and with the accommodation of electric power W τ c is described by the following equation:
w τ c = N c κ κ 1 T a c , i i n η c , i   m ˙ a c , τ R g [ ( P c a , i o u t P c a , i i n ) κ 1 κ 1 ] ,
where N c is the stage number of compressors, m ˙ a c , τ is the compressor mass flow rate at time τ, T a c , i i n is the inlet temperature of each compressor stage, and κ and R g are the adiabatic coefficient and gas constant, respectively.
The electric power W τ e generated by the SA-CAES in the discharging process is given by Equation (2):
w τ e = N e κ κ 1 T a t , i i n η c , i   m ˙ a t , τ R g [ 1 ( P a t , i i n P a t , i o u t ) κ 1 κ ] ,
where N e is the stage number of air turbines, m ˙ a t is the turbines’ mass flow rate, and T a t , i i n is the inlet temperature of the turbines at each stage.
The air storage subsystem of a SA-CAES hub generally adopts pressured vessels and the temperatures of pressured vessels are kept constant through insulation measures. Therefore, the constant volume isothermal (VT) model can be adopted for the air storage model and the storage pressure of the air storage at time τ can be described as:
p τ + 1 a s = p τ a s + 1 V a s R g T τ a s ( u τ c m ˙ a c u τ e m ˙ a t ) ,   τ
p m i n a s p τ a s p m a x a s ,   τ
where p τ a s is the air storage pressure level, T τ a s is the temperature in the air storage tank, and u τ c and u τ e are Boolean quantities indicating the operating state of compression energy storage and expansion energy release, respectively. Rg is the gas constant and Vas is the volume of the pressured vessel. The formulation of heat storage can be reduced from [17] to:
H τ T E S = H τ 1 T E S ( 1 γ H ) + u τ c q a c u τ e q a t h τ s ,   τ
H m i n T E S H τ T E S H m a x T E S ,   τ ,
where q a c and q a t represent heat production power in the compression energy storage stage and heat consumption in the discharging process, respectively, and h τ s is the supply heating power of the SA-CAES hub.
According to the linearization method of the SA-CAES hub, the air pressure p and mass flow rate m ˙ a c , τ are the adjustable variables of the hub. It is difficult to adjust them simultaneously owing to the complexity of hydraulic thermal dynamics. Fortunately, a practical SA-CAES hub often operates in a constant pressure and constant temperature mode (CP-CT). Thus, Equations (1) and (2) reduce to:
w τ c = N c κ κ 1 T a c , i i n η c , i   m ˙ a c , τ R g [ ( β ) κ 1 κ 1 ] ,
w τ e = N e κ κ 1 T a t , i i n η c , i   m ˙ a t , τ R g [ 1 ( π ) κ 1 κ ] ,
respectively. β and π represent the compression and expansion ratios, which are constant values, under the CP-CT operation mode. The solar field model with TES in the dispatch period can also be regarded as linear model.

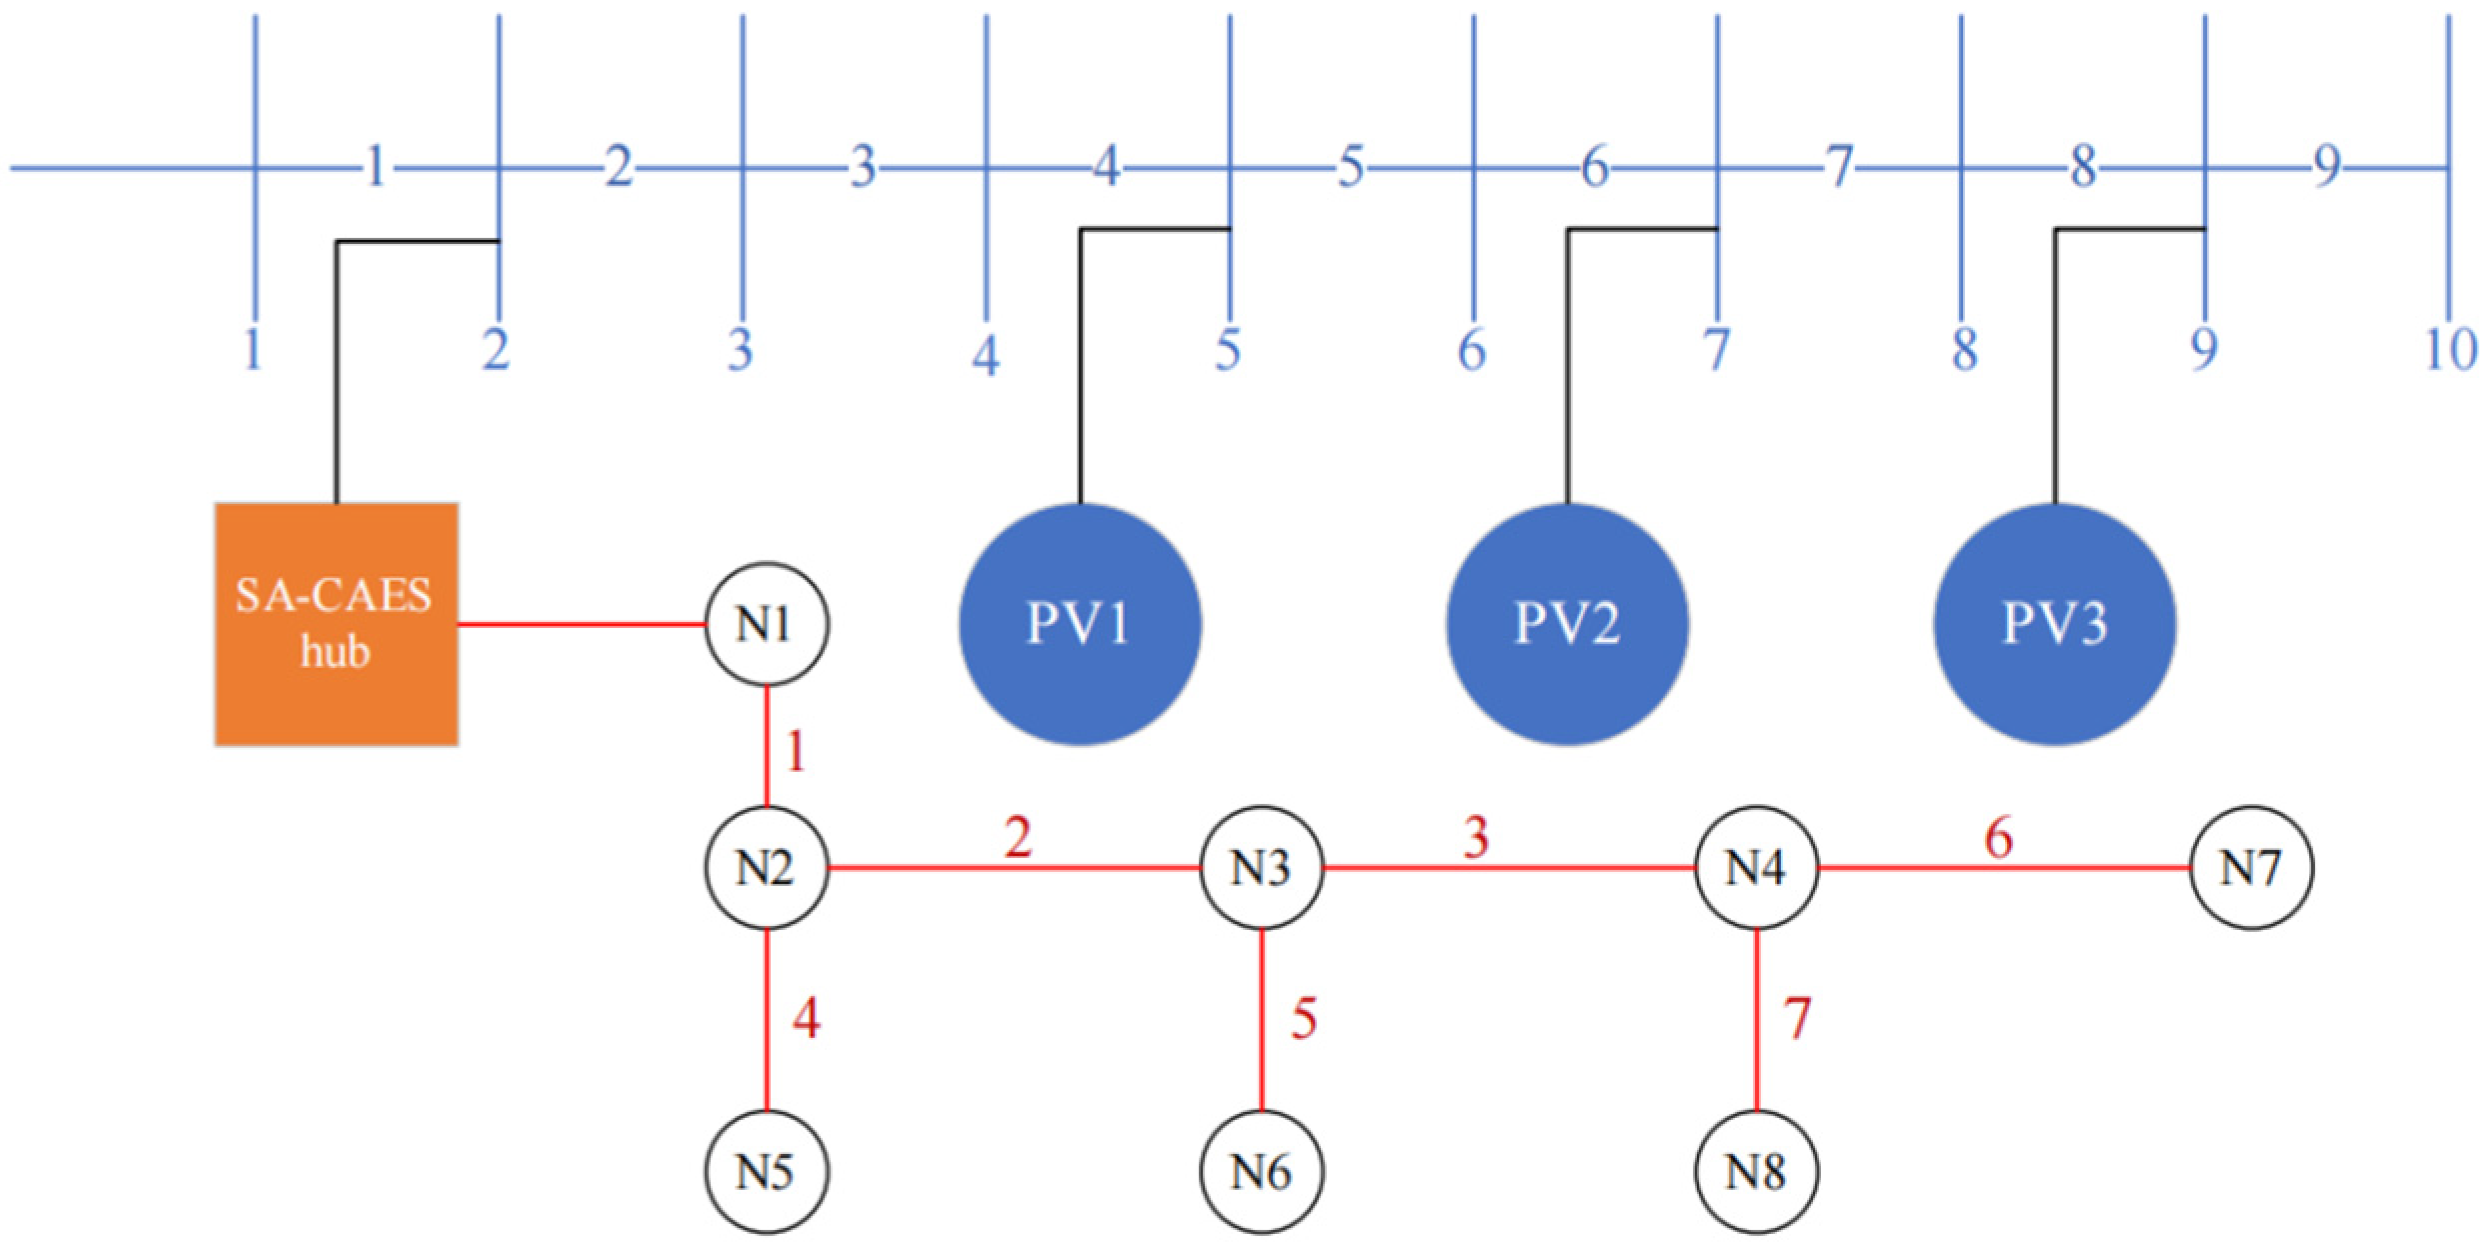
3.2. PDN Formulation

The power distribution network commonly features radial topology; therefore, the power supply section in the distributed energy system can be presented in terms of the Branch Flow model described in [32]:
P i j , τ + P j , τ g + W τ e = k π ( j ) P j k , τ + P j , τ d + W τ c + P j , τ b p , l ( i , j ) , τ
Q i j , τ + Q j , τ g = k π ( j ) Q j k , τ + Q j , τ d , l ( i , j ) , τ
U j , τ = U i , τ + ( r i j P i j , τ + x i j Q i j , τ ) / U 0 ,   l ( i , j ) , τ
U i f U i , τ U i r , i , τ , U 0 = V s l 2
P i f P i , τ G , g P i r ,   0 P V i , τ g   P V i , τ g , u   i , τ
Q i f Q i , τ G , g Q i r ,   Q j , τ V , l Q j , τ V , g   Q j , τ V , u   j , τ
Equations (9) and (10) present the balances between active and reactive power, respectively. The square of nodal voltage loss along the line l ( i , j ) is described in Equation (11). The limits on the square of voltage are indicated in Equation (12). Moreover, Equations (13) and (14) depict the physical limits on active power and reactive power.
The PDN model (9)–(14) describes the (electric power) power flow distribution in a combined heat and power energy system. The advantage of the PDN model is that it can provide detailed operational information in a distribution network, such as node voltage and line reactive power. Meanwhile, this model can be solved efficiently by linearization or convex relaxation.

3.3. DHN Formulation

The DHN in combined heat–power distribution networks also has a radical form. Here, we present the thermal flow steady-state model based on [25,26] and formulate the model of the DHN as follows:
h i , τ g = c m ˙ i , τ g ( T i , τ S T i , τ R ) ,   h i , τ d = c m ˙ i , τ d ( T i , τ S T i , τ R ) i , τ
T i R , l T i , τ R T i R , u , T i S , l T i , τ S T i S , u , τ
b T ( i ) ( T b , τ S , o u t m ˙ b , τ S ) = T i , τ S b T ( i ) m ˙ b , τ S , i , τ
b F ( i ) ( T b , τ R , o u t m ˙ b , τ R ) = T i , τ R b T ( i ) m ˙ b , τ R , i , τ
  T b , τ S , i n = T i , t S , T b , τ R , i n = T i , t R , i , b , τ
T b , τ S , o u t = ( T b , τ S , i n T τ a m ) e λ b l b / c m ˙ b , τ s + T τ a m ,   b , τ
T b , τ R , o u t = ( T b , τ R , i n T τ a m ) e λ b l b / c m ˙ b , τ R + T τ a m ,   b , τ
We present the nodal heat balance equation between the sources and loads in Equation (15). The advantage of the proposed SA-CAES hub is that both compression heat and solar thermal collected energy can provide various grades of heat sources to meet user demand. Heat source h g is a vector with compression heat and the solar field as its elements. Equation (16) presents the temperature range of the supply and return water. Equations (17) and (18) depict the temperature mixing (energy conservation) equations of nodes on the water supply and back side of the pipe. Equation (19) represents the nodal temperature as being equal to the pipe inlet temperature. Equations (20) and (21) formulate the supply and back side temperatures of each pipe based on Fourier’s heat conduction equation.
The mass flow rates m ˙ of each pipe in the above DHN model can be determined by:
b F ( i ) m ˙ b , τ S + m ˙ i , τ d = m ˙ i , τ g + b T ( i ) m b , τ S i , τ
b F ( i ) m ˙ b , τ R + m ˙ i , τ g = m ˙ i , τ d + b T ( i ) m b , τ R i , τ
0 m ˙ b , τ S m ˙ b u , 0 m ˙ b , τ R m ˙ b u b , τ
Equations (22) and (23) show the mass conservation law for each node. The mass flow operation range in each pipe is described in Equation (24).

3.4. Objective

In the centralized operation mode, we assume that the power demand of the integrated energy system is supplied by the PVs SA-CAES hub and a superior power grid and that the heat is provided by the SA-CAES hub. The scheduling objective of the system is to minimize the operation cost, which is formulated as:
min τ T λ τ P 0 , t g
s , t   SA - CAES   Hub   constraints   ( 1 ) ( 8 )
PDN   constraints   ( 9 ) ( 14 )
DHN   constraints   ( 15 ) ( 21 )   and   ( 22 ) ( 24 )
P V i g , l P V i , t g P V i g , u ,   i , τ
where λ τ is the electricity price, P 0 , t g stands for the electricity purchased from the up-level power grid, P V i , t g is the actual output of PV, and P V i g , l and P V i g , u are the minimum and predicted values for the photovoltaic power output, respectively.
The carbon-free scheduling model in Equations (25)–(29) are a nonlinear optimization problem whose nonlinearity is mainly derived from the SA-CAES hub. In [33], corresponding linearization methods were described that can transform the MINLP into a MILP problem. A similar problem can be effectively solved by commercial optimization solvers.

4. Case Studies

The topology of the tested SA-CAES hub integrated with a PDN and a DHN is shown in Figure 2. The components of the system include an 8-node DHN, a 10-bus PDN, a SA-CAES hub and three PVs. The SA-CAES hub, PVs, and the power grid company mainly supply the electric power to meet demand. The heat demand is provided by the SA-CAES. The SA-CAES hub is coupled with the PDN and DHN at power bus P2 (also heat node N1). The SA-CAES hub injects heat and electricity into the DHN and PDN, while the electric heat pump provides the heat load by consuming the electricity from the PDN. We assume that the PV power and thermal energy of the SA-CAES hub are dispatchable sources and ignore the errors between real-time situations and day-ahead forecasts. Moreover, PV power is considered to be free and thus is used as much as possible.
The price fluctuation of Qinghai Power Company is shown in Figure 3. The data comes from official policy of Qinghai Development and Reform Commission [34]. Figure 4 shows the demand of the heat and power as well as the available solar power.

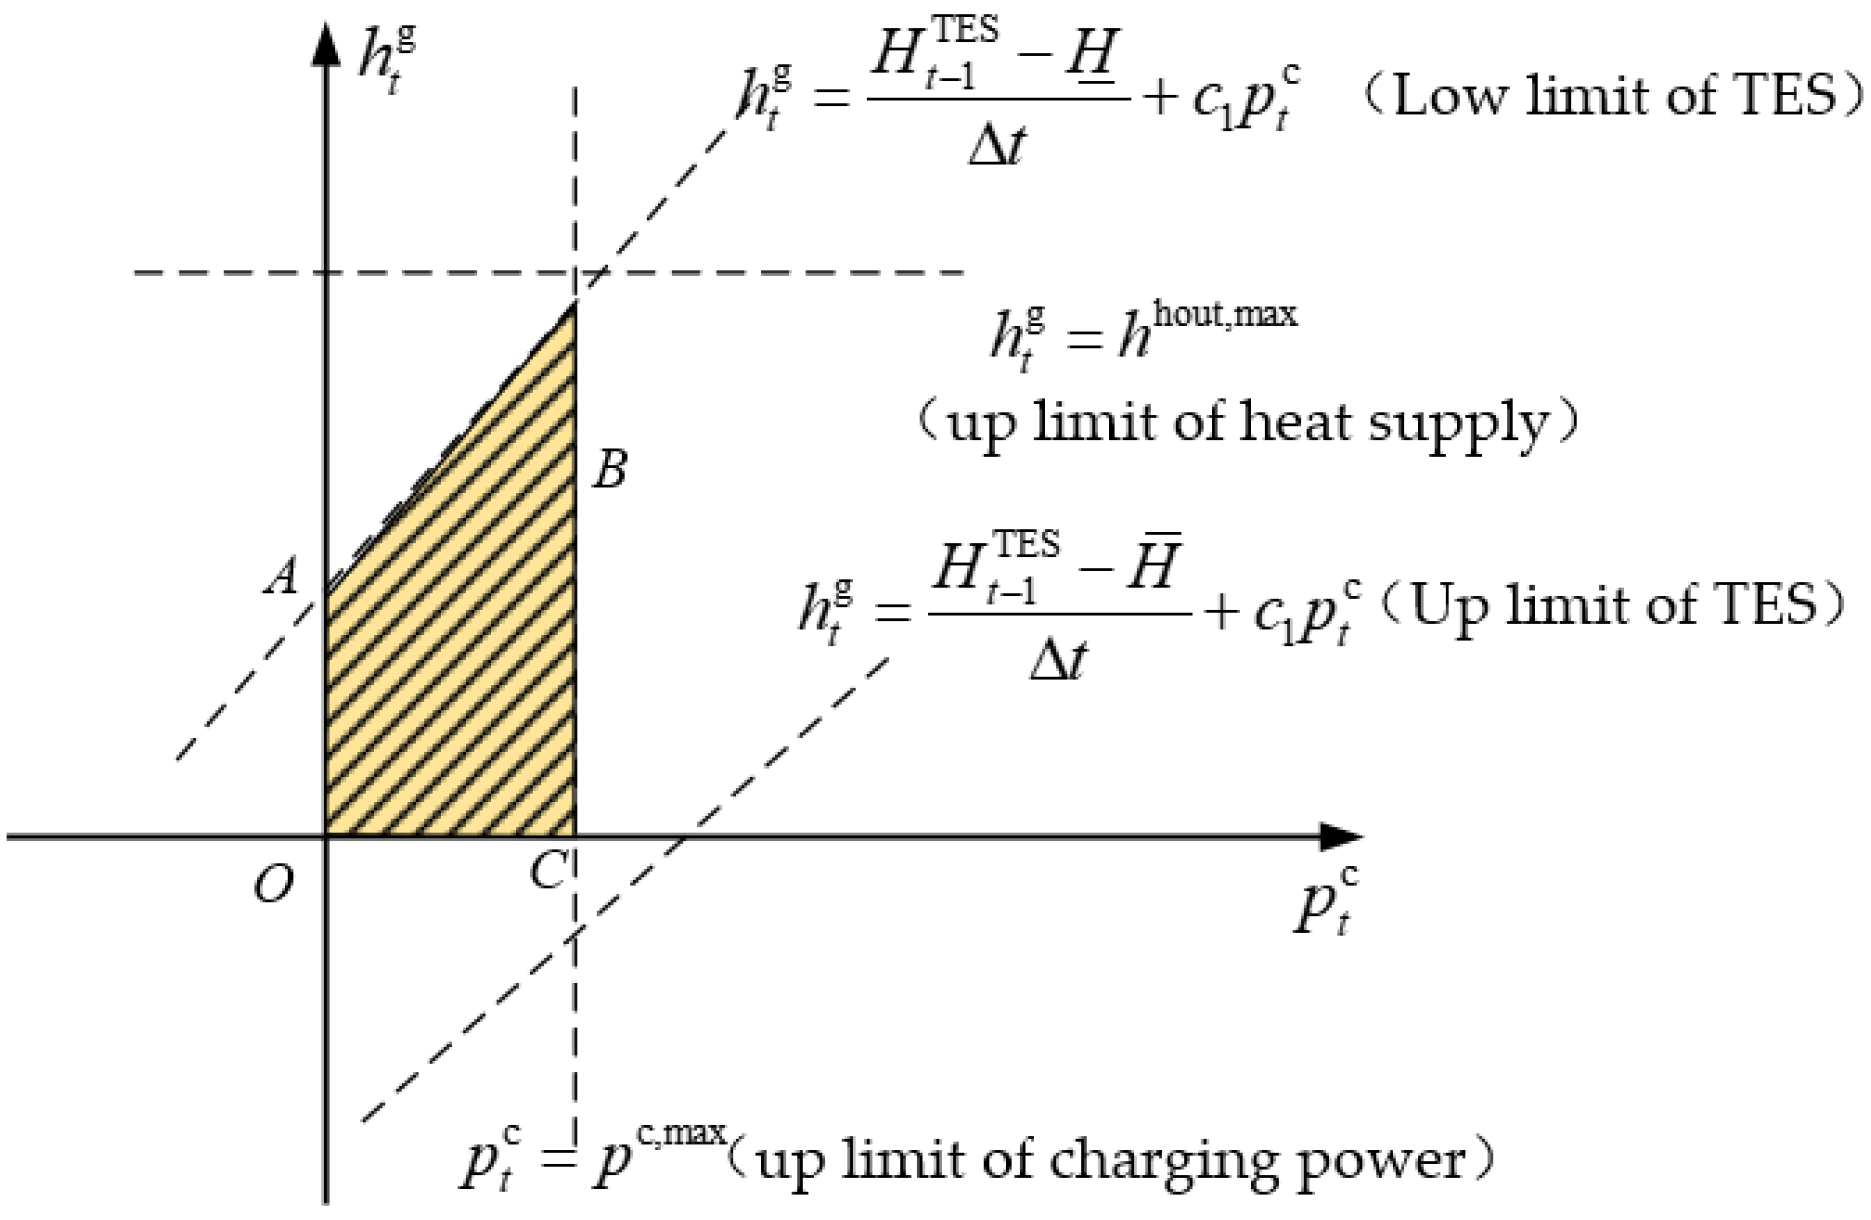
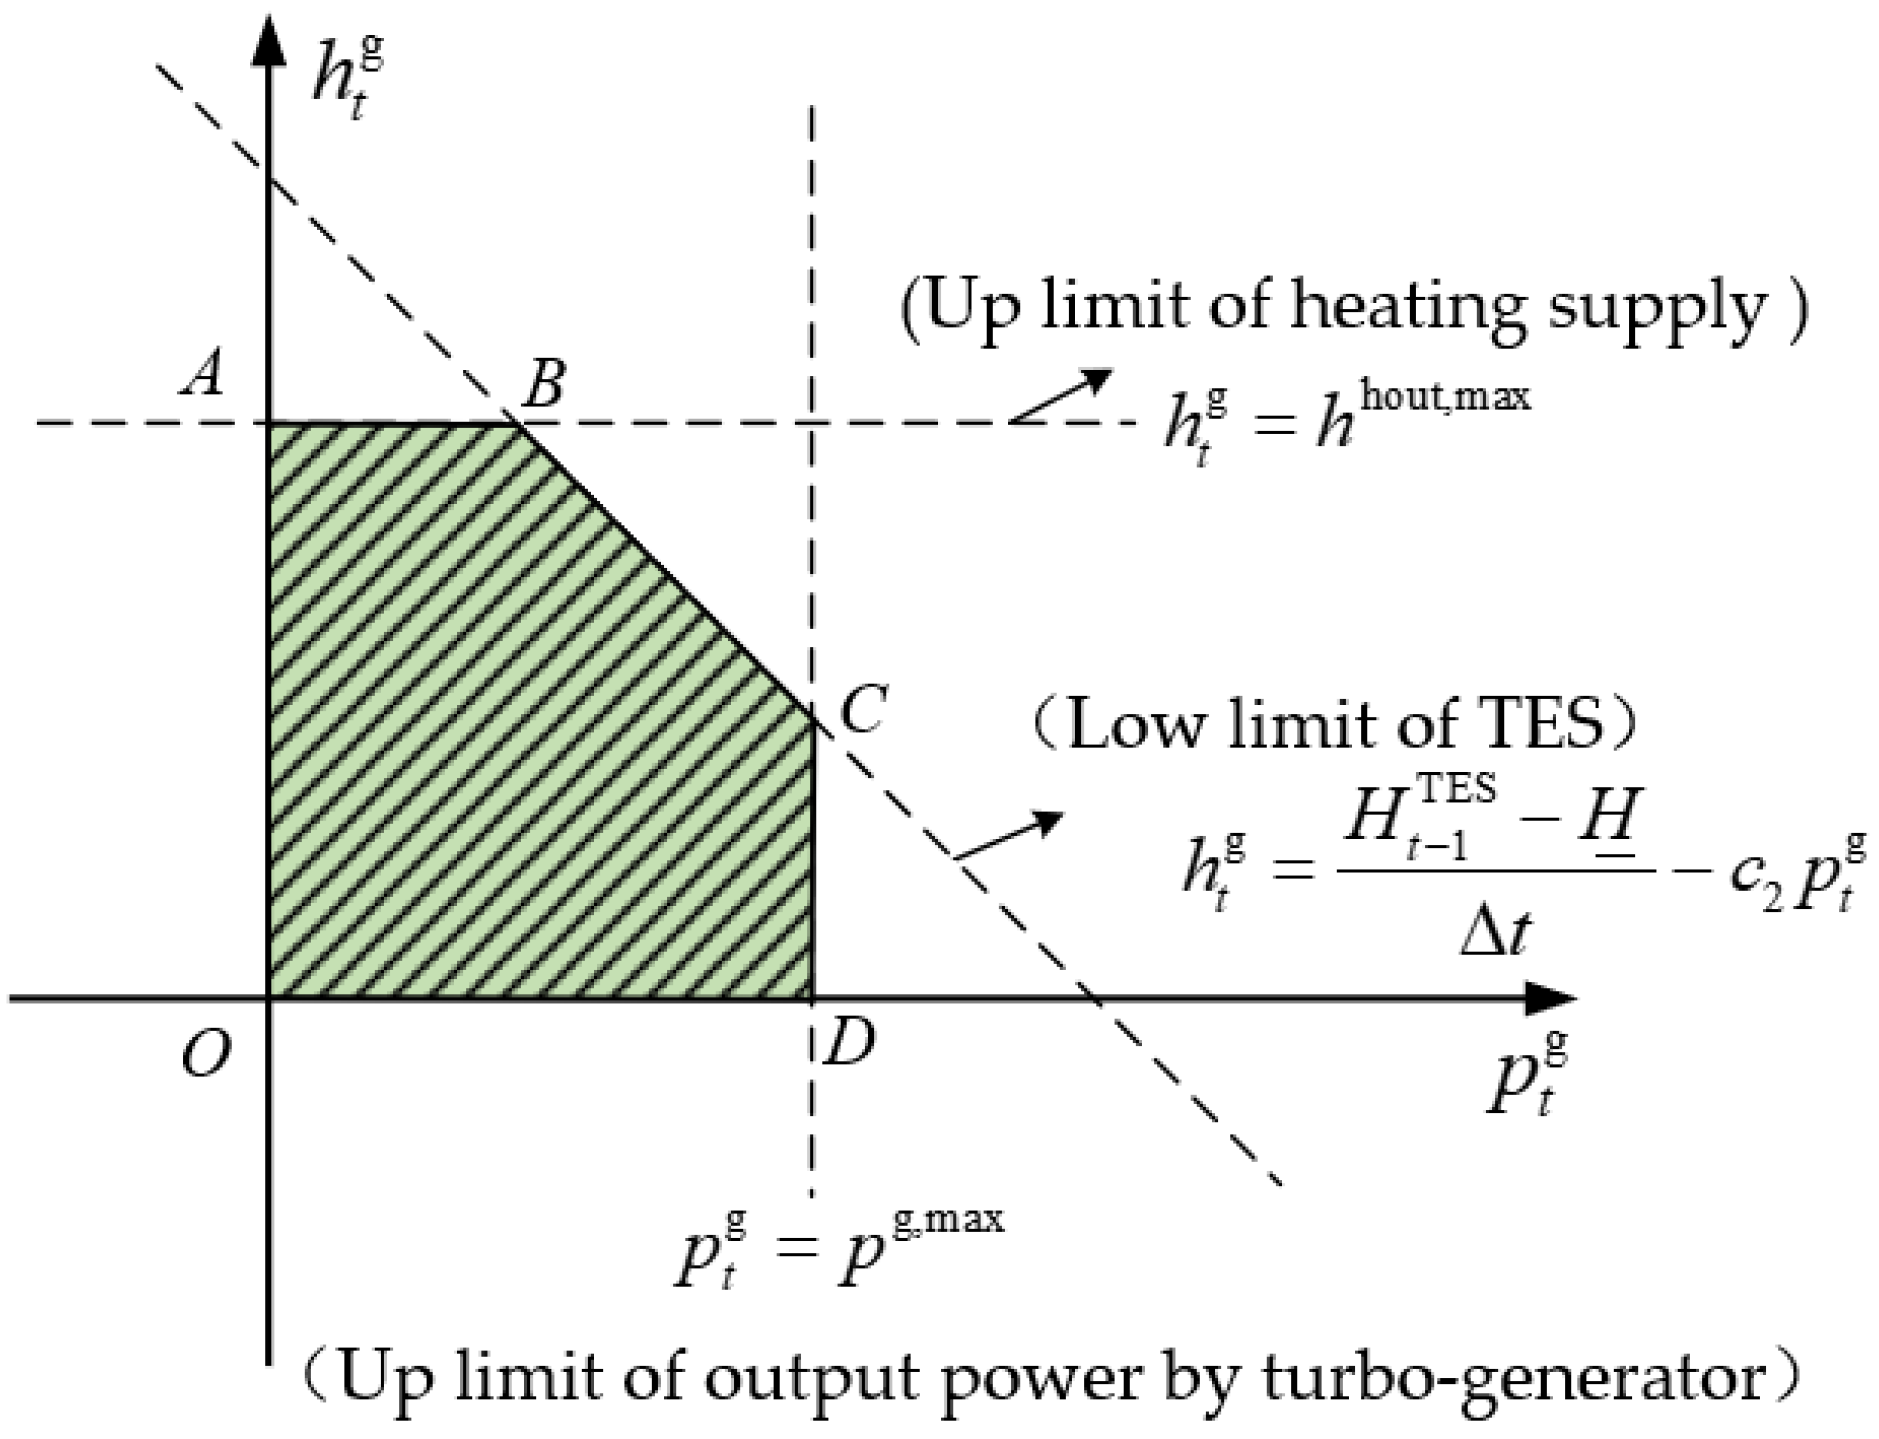
4.1. Operationally Feasible Region Based on Thermodynamic Analysis

To validate the model and depict the operationally feasible region based on thermodynamic analysis, we configure the main parameters in [7]. To simplify the analysis, the following assumptions are made:
  • The compressed air in the system is treated as the ideal gas;
  • The SA-CAES operates in a steady-state condition;
  • The pressure drop of each heat exchanger is 2%, and heat loss is ignored;
  • The adiabatic efficiency of the compressors and air turbine is constant;
  • The heat loss in the TES is ignored.
The operation of a 400 kW SA-CAES hub is simulated to verify the effectiveness of the proposed formulation. The rated parameters of the stage compressors and turbine are depicted in Table 1 and Table 2, respectively. The rated irradiation of the solar field is 838.2 W/m2 and the charging and discharging time are 5 and 1.4 h, respectively. Through thermodynamic simulation, we obtained the following key performance indicators for the proposed SA-CAES hub. The E-E energy efficiency is 57.8% and the round-trip efficiency is 65%; the energy flow chart of the designed SA-CAES is illustrated in Figure 5.
Compared with the efficiency of TICC-500 in [35], the comprehensive energy efficiency of the SA-CAES has been significantly improved; this can be ascribed to the coupling with the solar thermal collector field.
Table 2 and Table 3 illustrate the parameters of the selected four-stage compressor and the three-stage turbine under the design operation.
Based on the above key parameters, we can depict the operationally feasible region, illustrated in Figure 6 and Figure 7. Further, the operationally feasible region is convex set, and the Equation (7) is a convex optimization problem.
Compared with the AA-CAES hub, which can supply intermittent heat only in the charging process, the advance represented by the SA-CAES hub is that it not only provides continuous and stable thermal energy but also expands its storage capacity by means of the integration of the solar field and the TES unit. Therefore, it can inject flexible and schedulable heat into the DHN. However, the SA-CAES has its own potential limitations, such as occupying a large area and needing high-performance insulation material to keep the temperature at the intended level during extreme weather.

4.2. Simulation Results

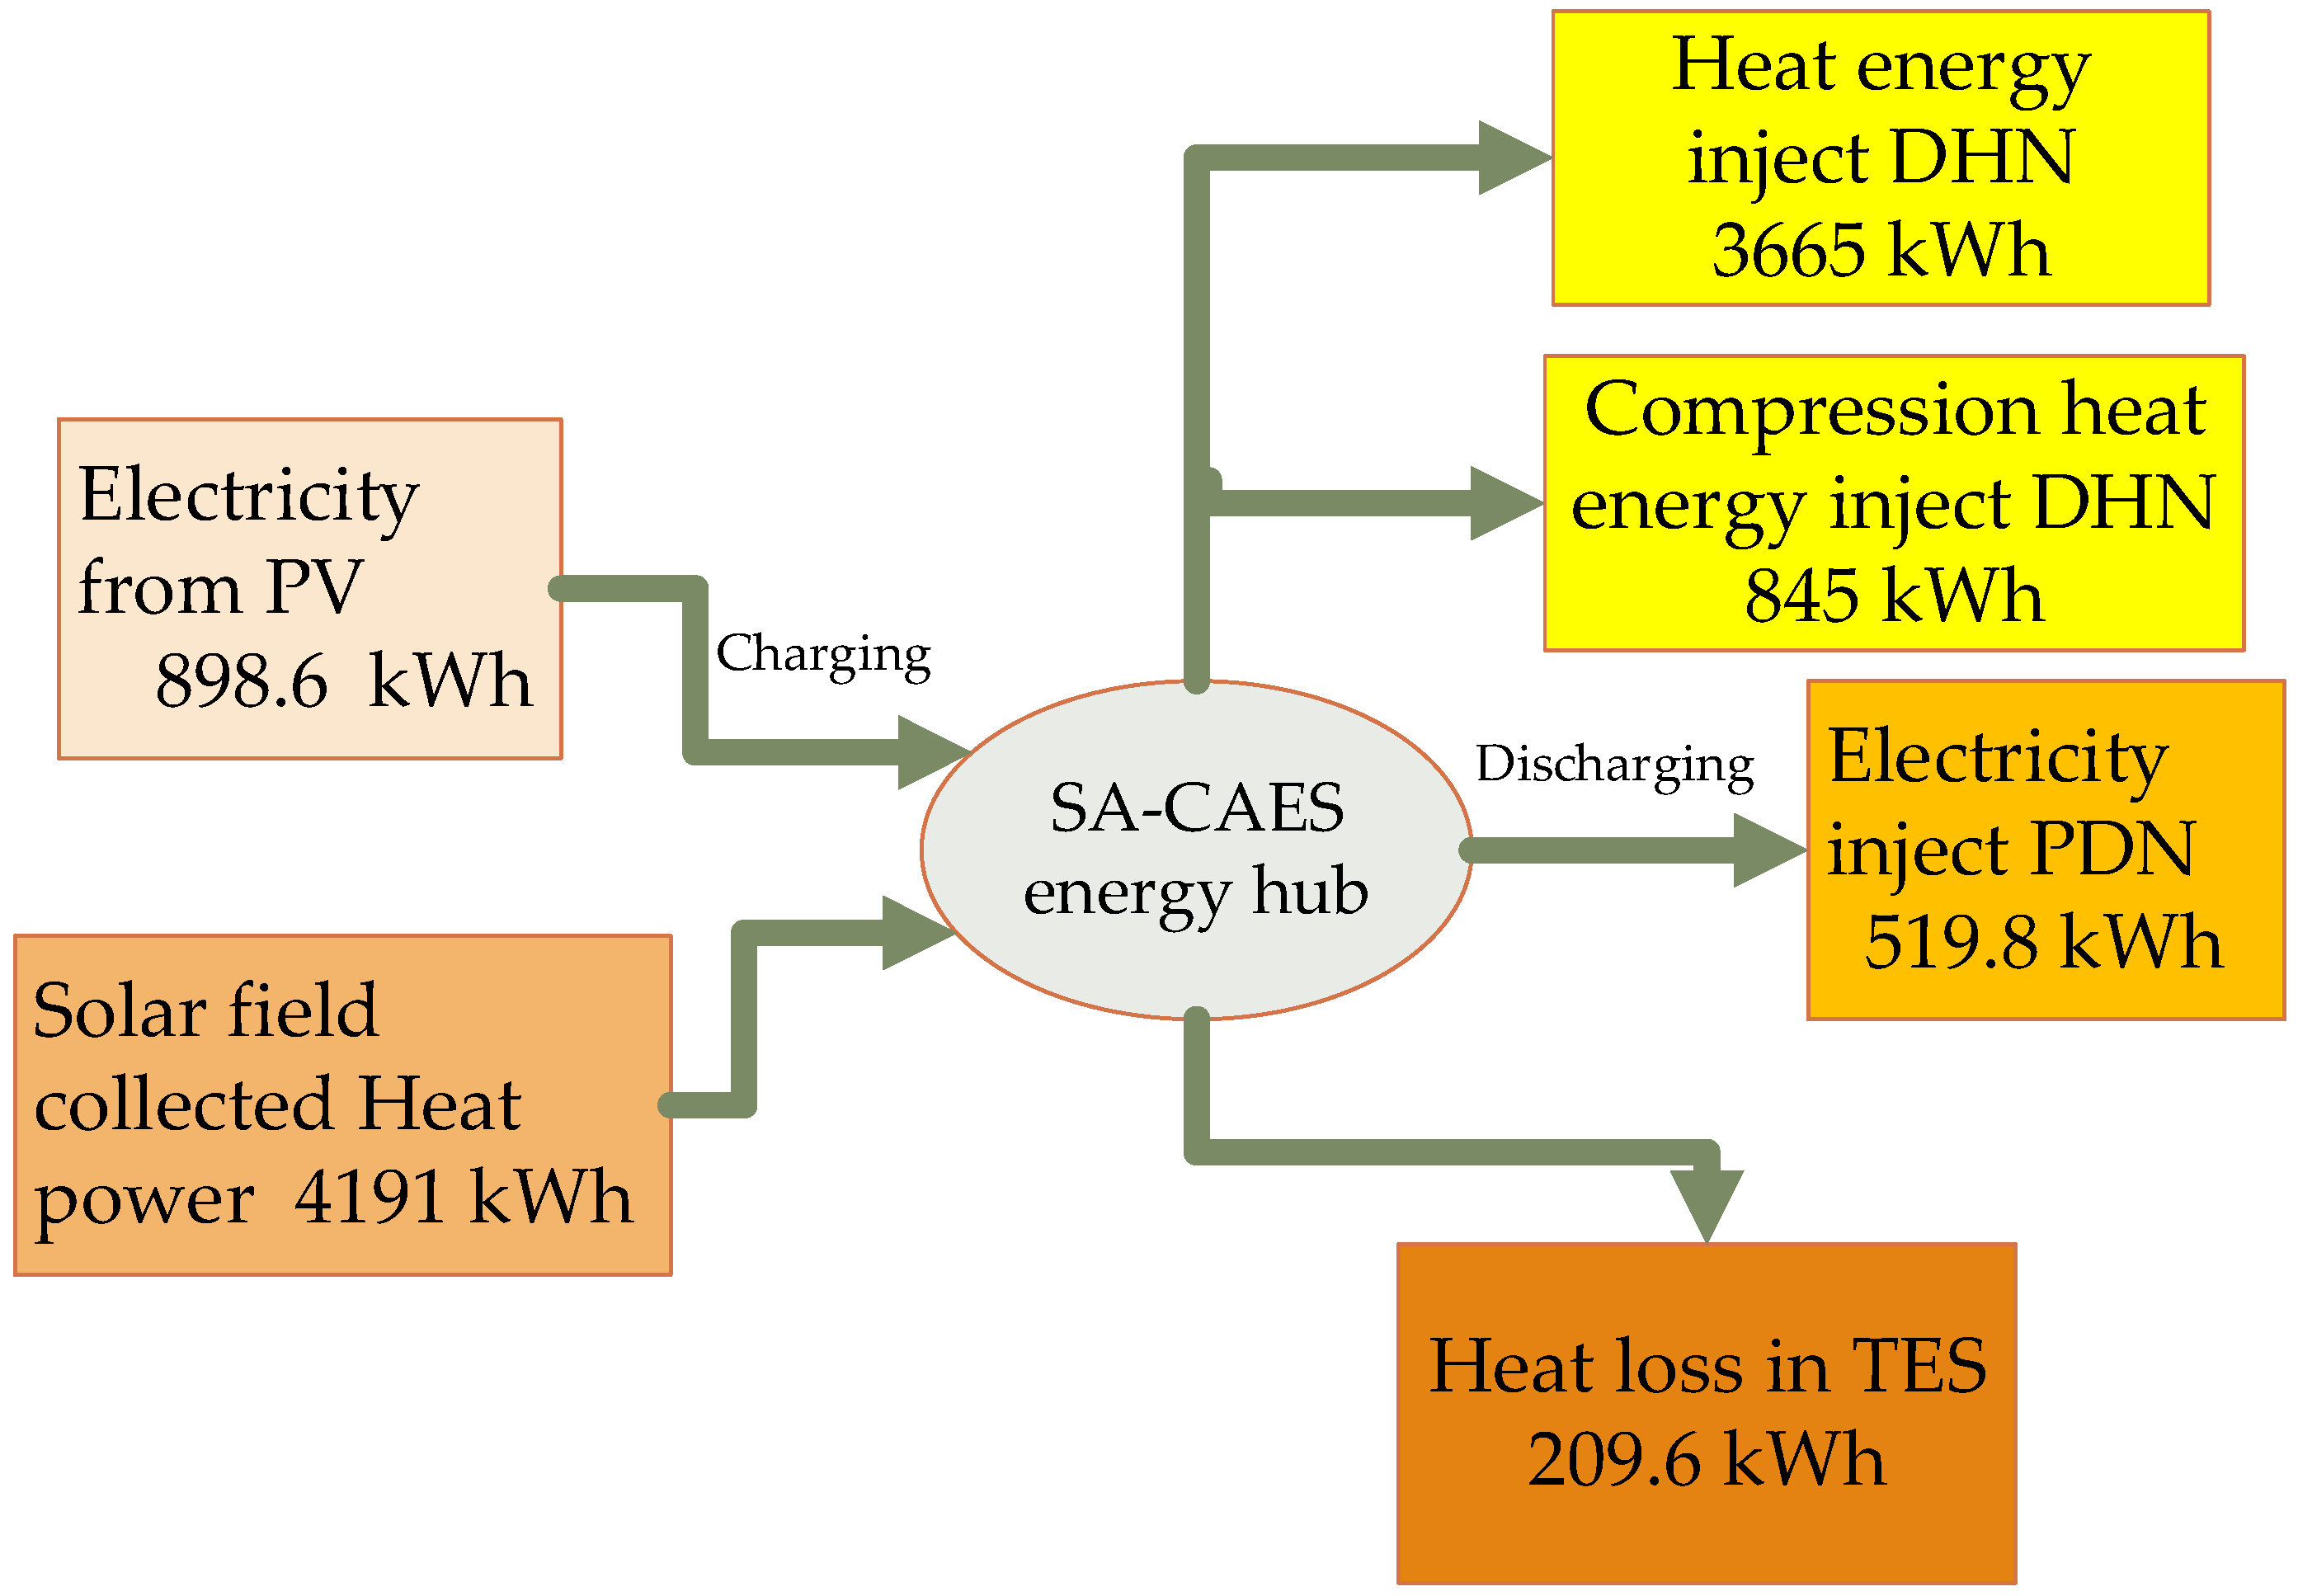
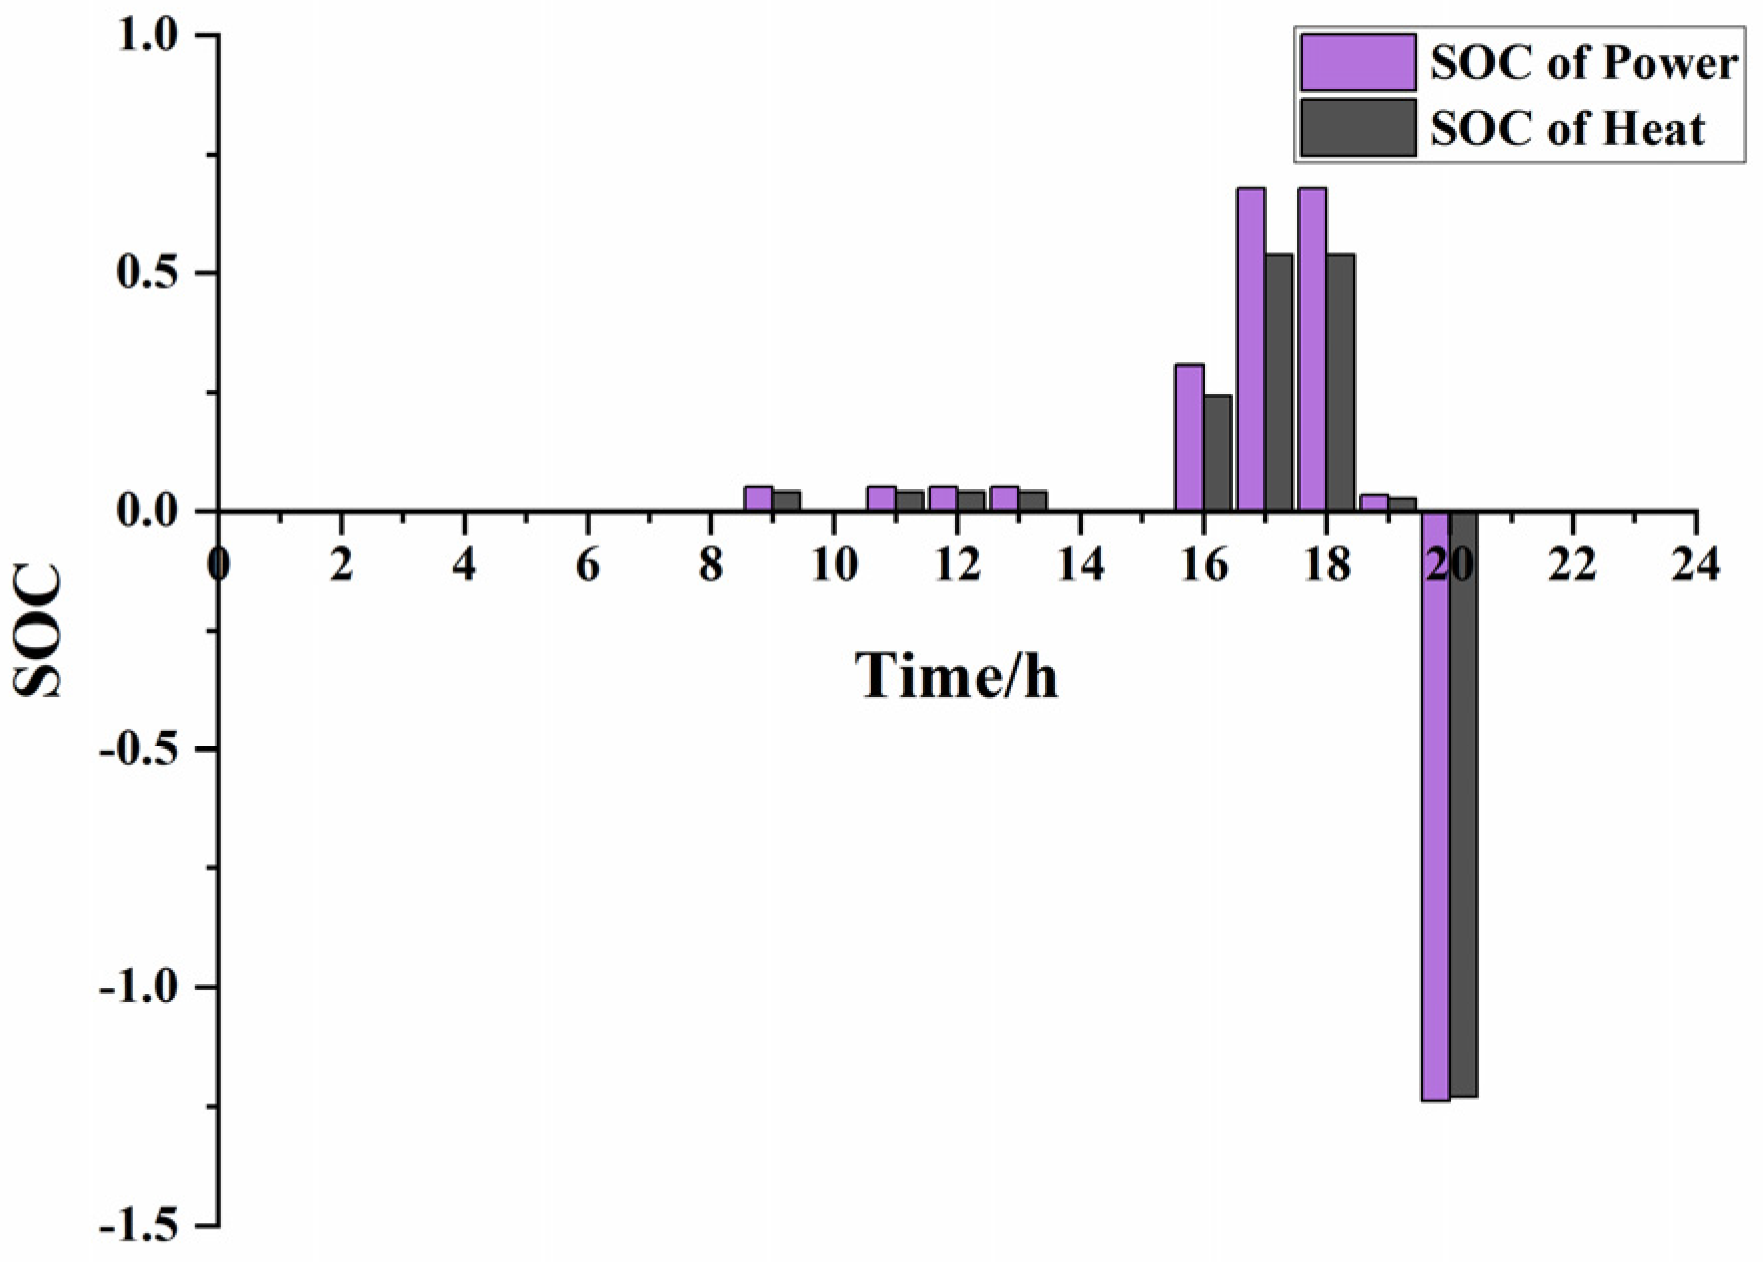
4.2.1. Operation of the SA-CAES

The charging or discharging status of the SA-CAES hub is shown in Figure 8. The state in charging process is indicated by the time vector t = (9 11 13 17 18). We can make the most of free solar power and cheap electricity to convert redundant power into high-pressured air and compression heat. During blackouts or electricity price at peak times, for example, periods in which t = 20, SA-CAES hub is in discharging process. The TES supplies thermal energy combined with compressed air to generate electrical power by means of the turbo-generator or directly provides heat for local residents.
Figure 9 shows the supplied thermal energy profile by the STC, the SA-CAES hub, and the heat pump. Hstc stands for the heat provided by solar thermal collectors and Hd and Hhp represent heat demand and heat supplied by the heat pump, respectively. The rural zones, especially agricultural areas, in northwest China are greatly reliant on heat rather than electricity. Actually, the heat provided by the heat pump is quite limited for the DHN node. The SA-CAES can provide two kinds of thermal energy sources of high and medium grade by the STC and the compressors. It can be concluded from Figure 9 that the heat demand has been reduced at the heat pump, due to most of the heat demand being provided by the STC, thus saving on pump capacity costs.

4.2.2. Operation Costs

Table 4 elaborates the operation cost of the SA-CAES hub by comparing the MEN with SA-CAES and the conventional MEN. Though the SA-CAES hubs is optimized jointly by the PDN and DHN, the results show that the operation cost has been reduced noticeably. Compared with the MEN with SA-CAES and Conventional MEN, the operation cost of MEN with SA-CAES has been reduced by 4.78% during the winter season. Moreover, we also analyzed spring/fall and summer seasons to evaluate the costs of the MEN with the SA-CAES hub. We adopt MATLAB and CPLEX to solve the economic dispatch model Equations (25)–(29) and the results are shown in Table 4. We can learn from Table 4 that in the spring/fall season the cost of the MEN with the SA-CAES hub declined to USD 4672.4 due to energy demand reduction. Moreover, the cost of the MEN with the SA-CAES hub is lowest in the summer and the sum cost was reduced to USD 4028.4 due to solar energy reaching peak levels. Hence, heat and power needs can be well met by the PV and the STC.
The comparison results show that the SA-CAES enhanced the heat supply capacity and that it can meet heat demands while being guaranteed to provide reliable and quality electricity for users. It also decreased the consumption power of the heat pumps. Therefore, it not only saves on operation costs for the system but also improves the utilization level of solar energy.
It is worth noting that the cost of the system mainly depends on the price of electricity and the amount of energy demand by users, as described by Equations (25)–(29). Actually, it also relies on the capacity of the CAES, the solar field area, and the site of solar irradiation. We refer here to the discussion of cost parameters and evaluation methods in [36,37].

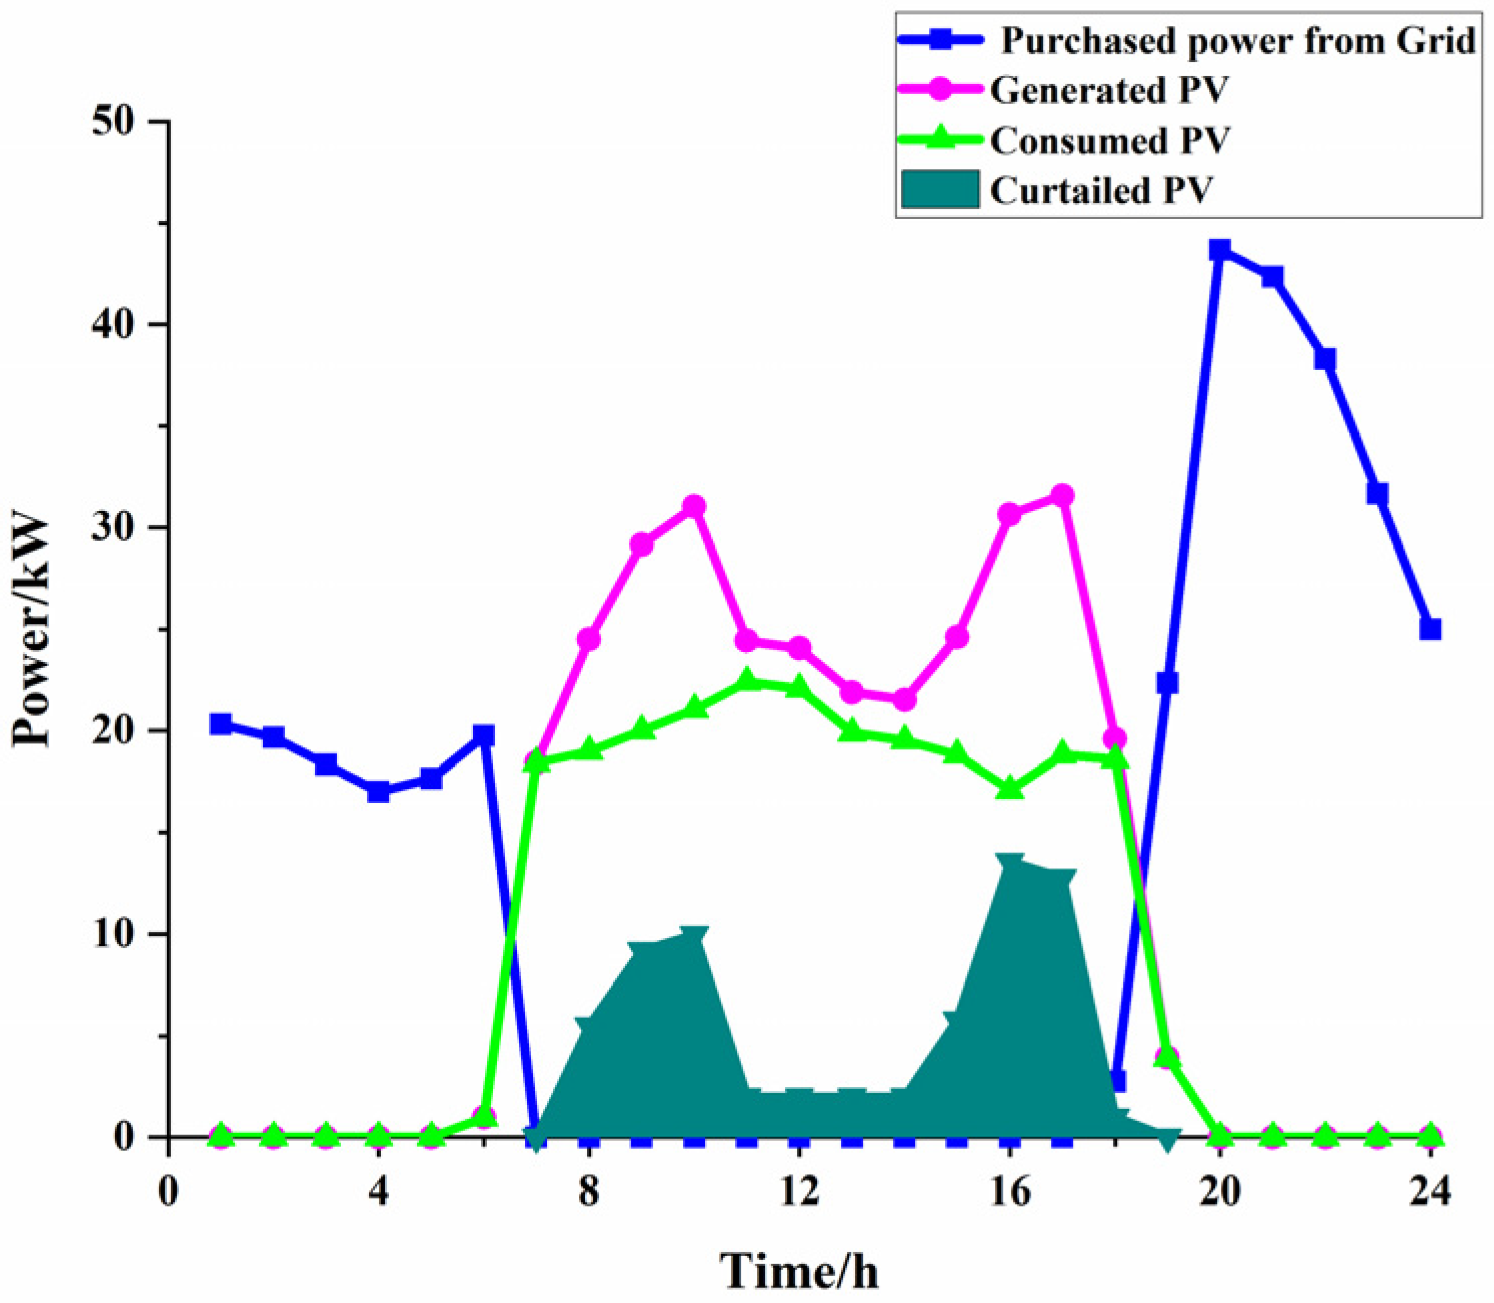
4.2.3. Solar Power Curtailment

Figure 10 and Figure 11 show the purchased power from the grid and the generated and curtailed PV with and without the SA-CAES.
Comparing Figure 10 and Figure 11, we can draw the following conclusion: that by deploying the SA-CAES hub with the PDN and the DHN, PV curtailment can be reduced by storing free PV during off-peak times and utilizing stored high-pressured air energy to supply power or heat demands during peak time frames, such as t = 20 to t = 23. Figure 8 and Figure 9 indicate that curtailed PV rates have been greatly reduced from 60.866 kWh to 32.432 kWh, as shown with the green shading. Consequently, we can reduce the cost of electricity purchased from the grid.

4.2.4. Optimal Temperature Distribution in the DHN

Figure 12 and Figure 13 illustrate the optimized temperature of the heat load for each pipe number on-peak (time period is t =15) and off-peak (time period is t = 5). We can learn from the figures below that the water temperatures of supply (SP) are much higher than those of return (RT). Meanwhile, regarding the same supply water temperature, the lower the return temperature is, the more heat can be provided. This provides an effective guarantee for local residents of hot water supply. It is worth mentioning that we ignore the temperature drop between the SA-CAES and the heat node 1 connection pipe.

5. Conclusions

In this paper, we have proposed the SA-CAES as an energy hub that integrates a PDN and a DHN. The advancement of the proposed SA-CAES is that both compression heat and solar thermal energy can be utilized to increase the value of compressed air enthalpy to improve the system’s performance. Moreover, the system can adjust the inlet temperature of the turbine by using compression heat or solar thermal storage energy with different energy grades to meet varying power demands. A typical 400 kW SA-CAES hub has been designed to show the effectiveness of the proposed SA-CAES formulation, which has a high efficiency. The E-E and round-trip efficiency can reach 57.8% and 65% in the designed condition (winter season scenario). The detailed model of the PDN and DHN coupled with the SA-CAES combined node 2 of the PDN and node 1 of the DHN was formulated with linearization for the SA-CAES and consider its operationally feasible region. Compared with the independent MEN, the proposed system has economic advantages and the average daily operation costs were reduced by 4.78% in the winter season. The system also reduced operation costs by 8.39% and 5.54% in the spring/fall and summer scenarios, respectively.
It should be noted that the charging and discharging process parameters were assumed to have fixed values, and parametric uncertainty as well as errors were not considered. Additionally, the stored thermal energy collected by the solar field was treated as the specific daily average energy. Therefore, the dispatch model proposed in this paper is not suitable for handling the uncertainties of actual operational scenarios. We will be adopting robust optimization methods to settle such problems in future research.

Author Contributions

Conceptualization, L.Y. and M.Z.; formal analysis, L.Y.; funding acquisition, S.M. and L.C.; methodology, L.Y., M.Z. and X.C.; project administration, S.M.; software, L.Y. and Y.S.; supervision, M.Z.; validation, X.C., Y.S. and Y.G.; writing—original draft preparation, L.Y. and M.Z.; writing—review and editing, L.Y., M.Z. and X.C. All authors have read and agreed to the published version of the manuscript.

Funding

This research was funded by the Qinghai Province Key Laboratory of Photovoltaic Grid Connected Power Generation Technology (grant no. 106000004816) and the Scientific and Technological Project of Qinghai Province (grant no. 2018-GX-A6).

Data Availability Statement

The data that support the findings of this study are available from the corresponding author (M.Z.) upon reasonable request.

Acknowledgments

The authors would like to thank Rui Li and Qiwei Jia for very helpful discussions on the power distribution network (PDN) and the district heating network (DHN) modeling, Xiaodai Xue and Tong Zhang for discussions on the SA-CAES model, and Ming Zong for discussions on the reviewer’s comments.

Conflicts of Interest

The authors declare no conflict of interest.

Nomenclature

Abbreviations
SA-CAESSolar-Assisted Compressed Air Energy Storage System
PDNPower distribution network
DHNDistrict heating network
RESRenewable energy source
DGDistributed generator
DESDistributed energy system
MENMicro-energy network
CHPCooling–Heating and Power
AA-CAESAdvanced Adiabatic Compressed Air Energy Storage
RESRenewable energy source
DGDistributed generation
ST-CAESHybrid external solar thermal energy and CAES
CAESCompressed air energy storage
TESThermal energy storage
PV Photovoltaic power
MINLPMixed integer nonlinear programming
MILPMixed integer linear programming
Symbols
WWork (kWh)
Nc and NeThe stage number of compressors and the turbine
m ˙ a c , τ The mass flow rate of the compressor at time τ (kg/s)
hSpecific enthalpy (kJ/kg)
pPressure (MPa)
u τ c   and  u τ e Boolean quantities indicating the operating state
UVoltage (kV)
PActive Power (kW)
QReactive power (kVar)
τTime (h)

References

  1. Li, G.; Li, Q.; Liu, Y.; Liu, H.; Song, W.; Ding, R. A cooperative Stackelberg game based energy management considering price discrimination and risk assessment. Int. J. Electr. Power Energy Syst. 2021, 135, 107461. [Google Scholar] [CrossRef]
  2. Coronavirus and Climate Change-C-CHANGE Harvard, T.H. Chan School of Public Health. Available online: https://www.hsph.harvard.edu/c-change/subtopics/coronavirus-and-climate-change/ (accessed on 1 January 2021).
  3. Geidl, M.; Andersson, G. Optimal power flow of multiple energy carriers. IEEE Trans. Power Syst. 2007, 22, 145–155. [Google Scholar] [CrossRef]
  4. Geidl, M.; Koeppel, G.; Favre-Perrod, P.; Klockl, B.; Andersson, G.; Frohlich, K. Energy hubs for the future. IEEE Power Energy Mag. 2006, 5, 24–30. [Google Scholar] [CrossRef]
  5. Mohammadi, M.; Noorollahi, Y.; Mohammadi-Ivatloo, B.; Yousefi, H. Energy hub: From a model to a concept—A review. Renew. Sustain. Energy Rev. 2017, 80, 1512–1527. [Google Scholar] [CrossRef]
  6. Nakhamkin, M.; Daniel, C. Available compressed air energy storage (CAES) plant concepts. Energy 2010, 4100, 81. [Google Scholar]
  7. Chen, X.; Zhang, T.; Xue, X.; Chen, L.; Li, Q.; Mei, S. A Solar–Thermal-Assisted Adiabatic Compressed Air Energy Storage System and Its Efficiency Analysis. Appl. Sci. 2018, 8, 1390. [Google Scholar] [CrossRef] [Green Version]
  8. Ji, W.; Zhou, Y.; Sun, Y.; Zhang, W.; An, B.; Wang, J. Thermodynamic analysis of a novel hybrid wind-solar-compressed air energy storage system. Energy Convers. Manag. 2017, 142, 176–187. [Google Scholar] [CrossRef]
  9. Yang, Z.; Wang, Z.; Ran, P.; Li, Z.; Ni, W. Thermodynamic analysis of a hybrid thermal-compressed air energy storage system for the integration of wind power. Appl. Therm. Eng. 2014, 66, 519–527. [Google Scholar] [CrossRef]
  10. Houssainy, S.; Janbozorgi, M.; Ip, P.; Kavehpour, P. Thermodynamic analysis of a high temperature hybrid compressed air energy storage (HTH-CAES) system. Renew Energy 2018, 115, 1043–1054. [Google Scholar] [CrossRef]
  11. Wang, S.; Chen, G.; Fang, M.; Fang, M.; Wang, Q. A new compressed air energy storage refrigeration system. Energy Convers. Manag. 2006, 47, 3408–3416. [Google Scholar] [CrossRef]
  12. Lund, H.; Salgi, G. The role of compressed air energy storage (CAES) in future sustainable energy systems. Energy Convers. Manag. 2009, 50, 1172–1179. [Google Scholar] [CrossRef]
  13. Bai, J.; Chen, L.; Liu, F.; Mei, S. Interdependence of electricity and heat distribution systems coupled by an AA-CAES-based energy hub. IET Renew. Power Gener. 2019, 14, 399–407. [Google Scholar] [CrossRef]
  14. Ni, C.; Xue, X.; Mei, S.; Zhang, X.-P.; Chen, X. Technological Research of a Clean Energy Router Based on Advanced Adiabatic Compressed Air Energy Storage System. Entropy 2020, 22, 1440. [Google Scholar] [CrossRef] [PubMed]
  15. Wu, D.; Wei, W.; Shengwei, M. Efficiency Analysis of AA-CAES Based Energy Hub Considering Combined Cooling, Heating and Power. In Proceedings of the 2021 IEEE 5th Conference on Energy Internet and Energy System Integration (EI2), Taiwun, China, 22–24 October 2021; pp. 131–136. [Google Scholar]
  16. Han, Z.; Sun, Y.; Li, P.; Hu, Q. Thermo-Economic Analysis of Trigeneration System Based on Aa-CaeS. Acta Energ. Sol. Sin. 2022, 43, 97. [Google Scholar]
  17. Chen, X.; Xue, X.; Si, Y.; Liu, C.; Chen, L.; Guo, Y.; Mei, S. Thermodynamic analysis of a hybrid trigenerative compressed air energy storage system with solar thermal energy. Entropy 2020, 22, 764. [Google Scholar] [CrossRef]
  18. Mei, S.; Li, R.; Xue, X.; Chen, Y.; Lu, Q.; Chen, X.; Ahrens, C.D.; Li, R.; Chen, L. Paving the way to smart micro energy grid: Concepts, design principles, and engineering practices. CSEE J. Power Energy Syst. 2017, 3, 440–449. [Google Scholar] [CrossRef]
  19. Daneshi, H.; Srivastava, A.K.; Daneshi, A. Generation scheduling with integration of wind power and compressed air energy storage. In Proceedings of the 2010 IEEE PES Trans and Distribution Conference and Exposit, New Orleans, LA, USA, 19–22 April 2010; pp. 19–22. [Google Scholar]
  20. Liu, B.; Chen, L.J.; Zhang, Y.; Chen, L.; Zhang, Y.; Fang, C.; Mei, S.; Zhou, Y. Modeling and analysis of unit commitment considering RCAES system. In Proceedings of the 33rd Hinese Control Conference (CCC’14), Nanjing, China, 28–30 July 2014; pp. 7478–7482. [Google Scholar]
  21. Wen, P.; Xie, Y.; Huo, L.; Tohidi, A. Optimal and stochastic performance of an energy hub-based microgrid consisting of a solar-powered compressed-air energy storage system and cooling storage system by modified grasshopper optimization algorithm. Int. J. Hydrogen Energy 2022, 47, 13351–13370. [Google Scholar] [CrossRef]
  22. Yaowang, L.I.; Shihong, M.I.A.O.; Binxin, Y.I.N.; Shixu Zhang, S.Z. Optimal Dispatch Model for Micro Integrated Energy System Considering Multi-carrier Energy Generation Characteristic of Advanced Adiabatic Compressed Air Energy Storage. Power Gener. Technol. 2020, 41, 41–49. [Google Scholar]
  23. Liu, B.; Lin, Q.; Zheng, T.; Chen, L.; Mei, S. Low carbon economic dispatch for multi-energy distribution network with compressed air energy storage system as energy hub. In Proceedings of the 36th Chinese Control Conference (CCC), Dalian, China, 26 July 2017; pp. 3083–3088. [Google Scholar]
  24. Wu, D.; Bai, J.; Wei, W.; Chen, L.; Mei, S. Optimal bidding and scheduling of AA-CAES based energy hub considering cascaded consumption of heat. Energy 2021, 233, 121133. [Google Scholar] [CrossRef]
  25. Li, J.; Fang, J.; Zeng, Q.; Chen, Z. Optimal operation of the integrated electrical and heating systems to accommodate the intermittent renewable sources. Appl. Energy 2016, 167, 244–254. [Google Scholar] [CrossRef]
  26. Li, Z.; Wu, W.; Shahidehpour, M.; Wang, J.; Zhang, B. Combined Heat and Power Dispatch Considering Pipeline Energy Storage of District Heating Network. IEEE Trans. Sustain. Energy 2016, 7, 12–22. [Google Scholar] [CrossRef]
  27. Li, Z.; Wu, W.; Wang, J.; Zhang, B.; Zheng, T. Transmission-Constrained Unit Commitment Considering Combined Electricity and District Heating Networks. IEEE Trans. Sustain. Energy 2015, 7, 480–492. [Google Scholar] [CrossRef]
  28. Arabkoohsar, A.; Andresen, G.B. Dynamic energy, exergy and market modeling of a High Temperature Heat and Power Storage System. Energy 2017, 126, 430–443. [Google Scholar] [CrossRef]
  29. Li, R.; Wei, W.; Mei, S.; Hu, Q.; Wu, Q. Participation of an energy hub in electricity and heat distribution markets: An MPEC approach. IEEE Trans. Smart Grid 2018, 10, 3641–3653. [Google Scholar] [CrossRef]
  30. Najafi, A.; Falaghi, H.; Contreras, J.; Ramezani, M. A Stochastic Bilevel Model for the Energy Hub Manager Problem. IEEE Trans. Smart Grid 2017, 8, 2394–2404. [Google Scholar] [CrossRef]
  31. Davatgaran, V.; Saniei, M.; Mortazavi, S.S. Optimal bidding strategy for an energy hub in energy market. Energy 2018, 148, 482–493. [Google Scholar] [CrossRef]
  32. Farivar, M.; Low, S.H. Branch flow model: Relaxations and convexification—Part I. IEEE Trans. Power Syst 2013, 28, 2554–2564. [Google Scholar] [CrossRef]
  33. Li, R.; Chen, L.; Yuan, T.; Li, C. Optimal dispatch of zero-carbon-emission micro Energy Internet integrated with non-supplementary fired compressed air energy storage system. J. Mod. Power Syst. Clean Energy 2016, 4, 566–580. [Google Scholar] [CrossRef] [Green Version]
  34. Zhang, D. Qinghai Development and Reform Commission. 2020. Available online: http://fgw.qinghai.gov.cn/zfxxgk/sdzdgknr/fgwwj/202012/t20201218_76157.html (accessed on 26 April 2022).
  35. Mei, S.; Wang, J.; Tian, F.; Chen, L.; Xue, X.; Lu, Q.; Zhou, Y.; Zhou, X. Design and engineering implementation of non-supplementary fired compressed air energy storage system: TICC-500. Sci. China Technol. Sci. 2015, 58, 600–611. [Google Scholar] [CrossRef]
  36. Cheayb, M.; Gallego, M.M.; Tazerout, M.; Poncet, S. A techno-economic analysis of small-scale trigenerative compressed air energy storage system. Energy 2020, 239, 121842. [Google Scholar] [CrossRef]
  37. Yu, M.; Li, S.; Zhang, X.; Zhao, Y. Techno-economic analysis of air source heat pump combined with latent thermal energy storage applied for space heating in China. Appl. Therm. Eng. 2021, 185, 116434. [Google Scholar] [CrossRef]
Figure 1. Flowchart of the SA-CAES hub.
Processes 10 00963 g001
Figure 2. Configuration of the studied integrated PDN and DHN.
Processes 10 00963 g002
Figure 3. Profile of price fluctuations.
Processes 10 00963 g003
Figure 4. Power and heat demand, as well as available solar power.
Processes 10 00963 g004
Figure 5. Energy flow of the designed 400 kW SA-CAES.
Processes 10 00963 g005
Figure 6. The operationally feasible region of the SA-CAES under the charging–heating mode.
Processes 10 00963 g006
Figure 7. The operationally feasible region of the SA-CAES under discharging–heating mode.
Processes 10 00963 g007
Figure 8. SOC of power and heat in the SA-CAES hub.
Processes 10 00963 g008
Figure 9. Heat output of the solar thermal energy collection field module, the heat pump, and the SA-CAES.
Processes 10 00963 g009
Figure 10. The power balance of PDN with the SA-CAES hub.
Processes 10 00963 g010
Figure 11. The power balance of the conventional PDN.
Processes 10 00963 g011
Figure 12. The temperatures of the supply and return system at on-peak times.
Processes 10 00963 g012
Figure 13. The temperatures of the supply and return system at off-peak times.
Processes 10 00963 g013
Table 1. The designed parameters of the SA-CAES system.
ParametersValue
Mass flow of compressor air, kg/s0.33
Mass flow of turbine air, kg/s1.167
Air adiabatic exponent 1.4
The stage of compressor and turbine4 and 3
Air storage tank volume, m 3 100
Ambient temperature, °C20
Ambient pressure, MPa0.1
The temperature of the hot, HTF °C250
The store thermal energy capacity, MJ447.4
The temperature of the cold HTF, °C150
The inlet compressed air temperature of the air turbine, °C200
The area of the solar thermal energy collection field, m 2 2200
The average solar irradiance in winter spring/fall and summer, W / m 2 838.2 / 991.4 / 1105.5
The duration time of the collection, h5
Efficiency of the solar thermal energy collection field64.2%
Charging time, h5
Discharging time, h1.4
Typical Solar hours/day, h in winter scenario12/20 (20 January)
Typical Solar hours/day, h in spring/fall scenarios3/20 and 9/23 (March and September)
Table 2. The parameters of the compressor under the design operation.
Compressor p r i n (MPa) p r o u t (MPa) τ i n   ( ° C ) τ o u t   ( ° C ) P (kW) η a d i a b t i c e f f
1-stage0.10130.30920143.741.6788.43%
2-stage0.3030.92445178.846.1188.44%
3-stage0.912.7345177.345.5788.46%
4-stage2.688.1645179.646.3788.25%
Table 3. The parameters of the turbine under design operation.
Turbine p r i n   (MPa) p r o u t   (MPa) τ i n   ( ° C ) τ o u t   ( ° C ) P (kW) η a d i a b t i c e f f
1-stage2.8460.9520090123.986.95%
2-stage0.930.3120090123.786.92%
3-stage0.3040.01320090123.686.92%
Table 4. Operation costs under the MEN with and without the SA-CAES for different seasonal scenarios.
Scenarios
Season
ModePDN (USD)DHN (USD)SUM (USD)
WinterMEN with SA-CAES2282.24690.26972.4
Conventional MEN 2688.54616.97305.4
Spring and FallMEN with SA-CAES1982.22690.24672.4
Conventional MEN 2186.42760.34946.7
SummerMEN with SA-CAES1893.22135.24028.4
Conventional MEN 2065.32332.44397.7
Publisher’s Note: MDPI stays neutral with regard to jurisdictional claims in published maps and institutional affiliations.

