
Evaluation of Centrifugal Force, Erosion, Strain Rate, and Wall Shear in a Stairmand Cyclone

 ,
,  , and
, and
Abstract
:1. Introduction
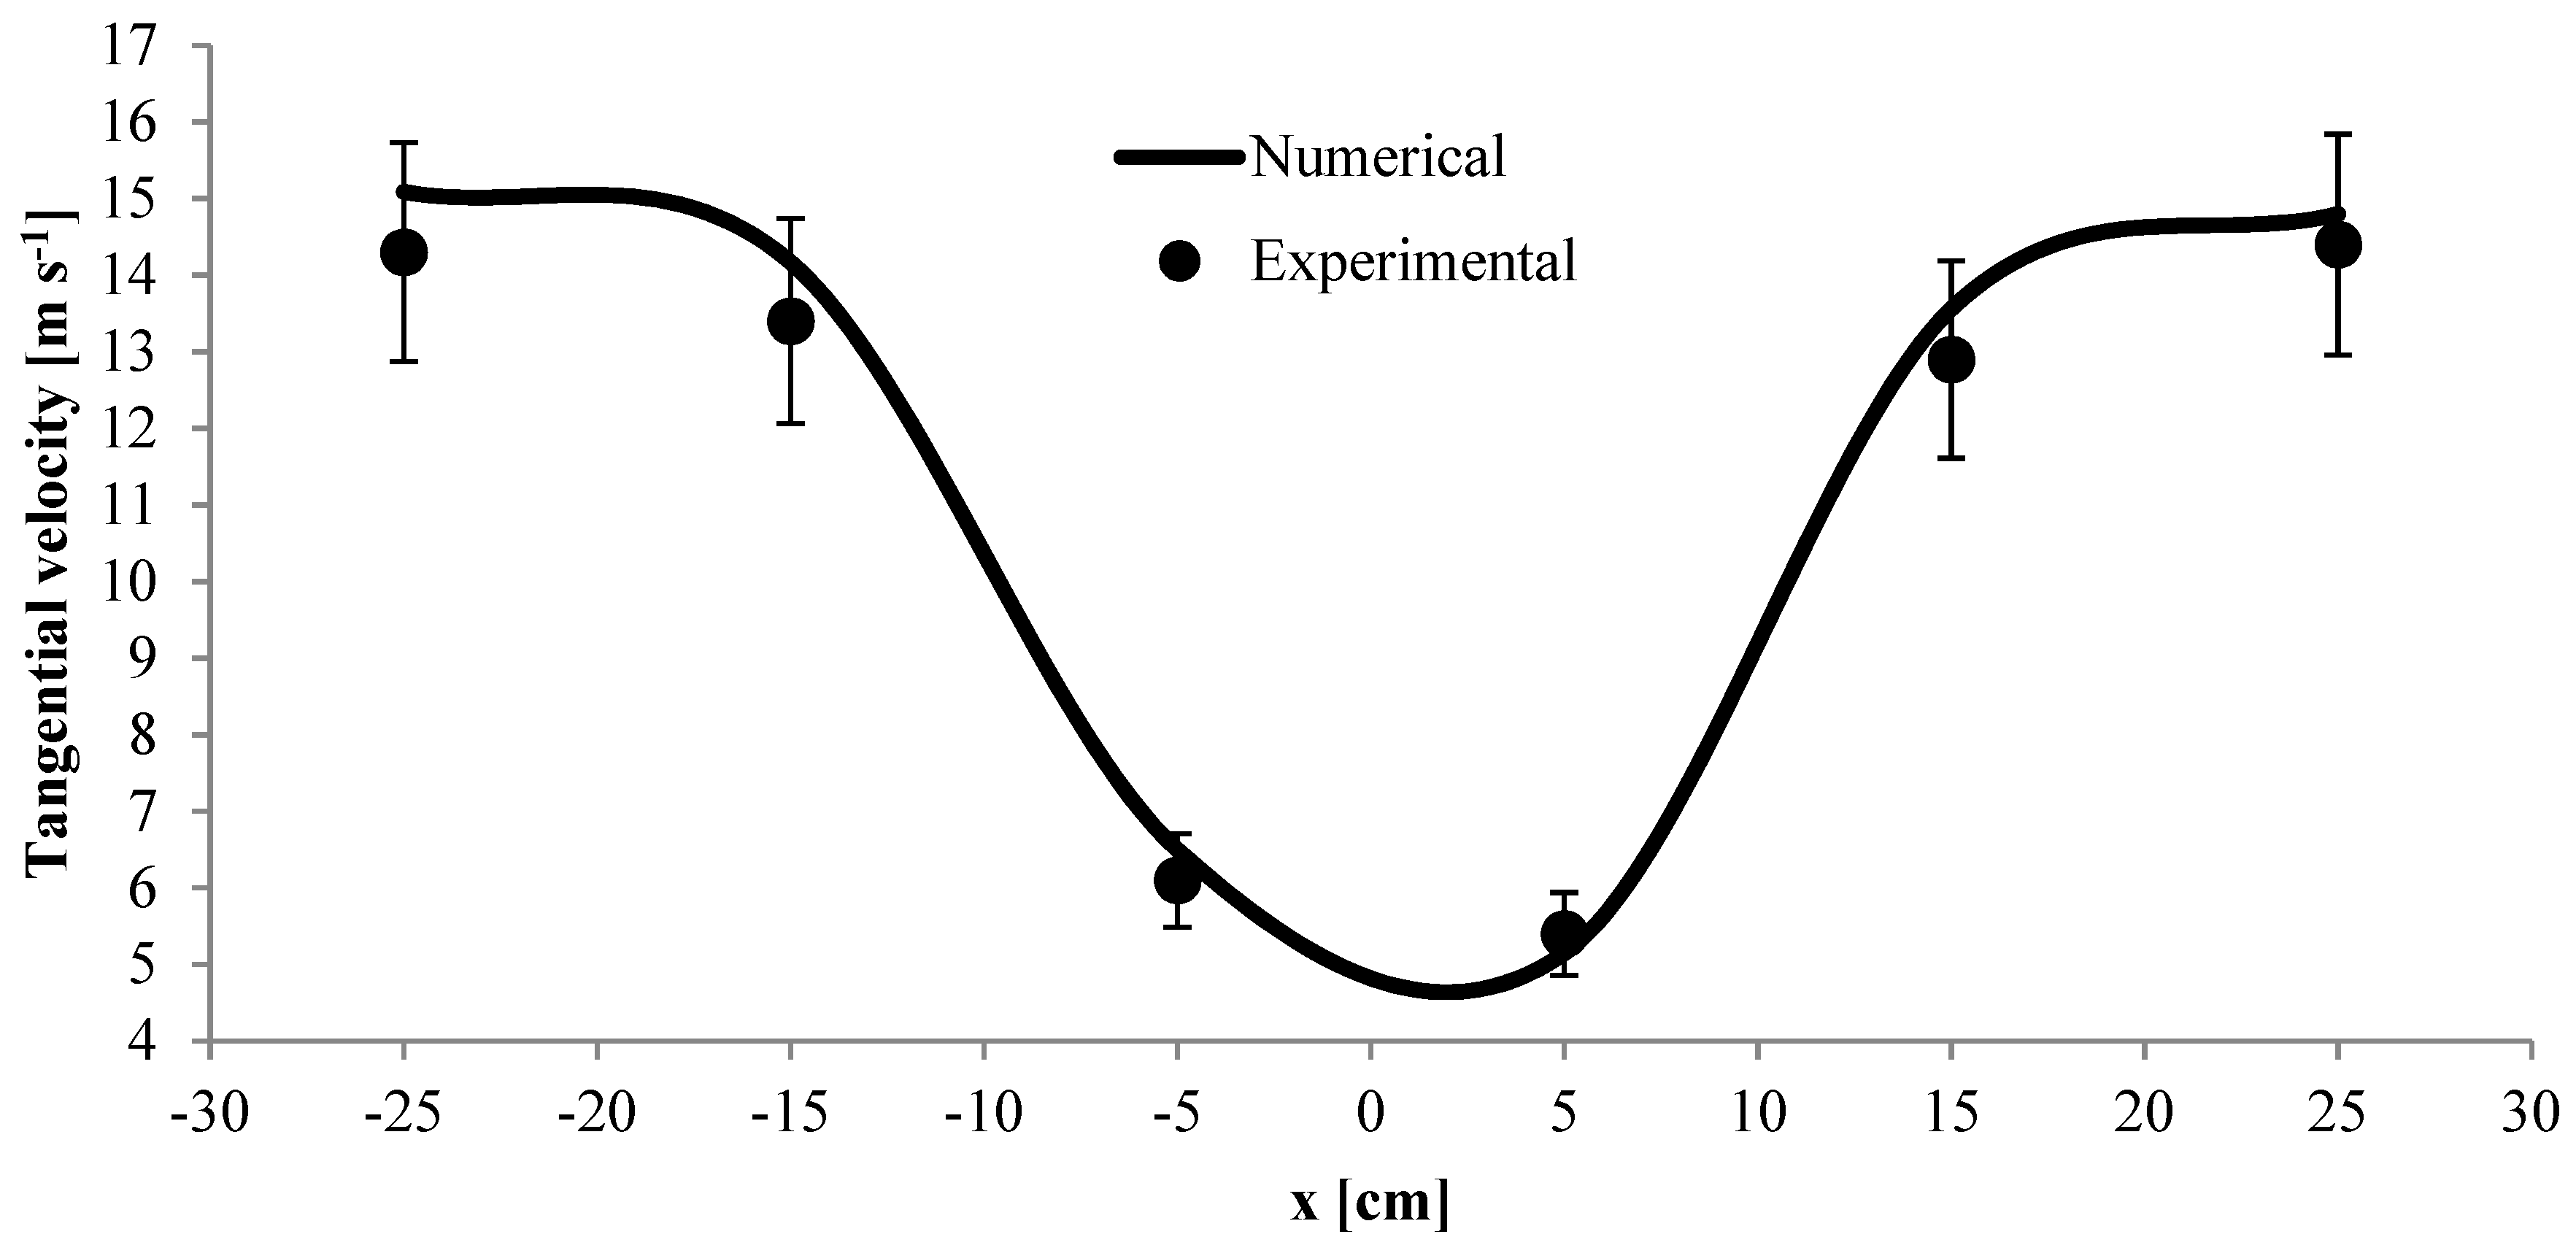
- Validation of numerical simulation by comparison of numerical results and experimental data using pressure drop and tangential velocity.
- A thorough compromise between pressure drop and separation efficiency to select the best situation.
- Assessment of centrifugal force in various inlet velocities, and mass flow rates as a mandatory parameter in cyclone analysis.
- A full evaluation of Euler and Stokes number along with streamline contour to identify the flow movement within the cyclone separator.
- Assessment of erosion, strain rate, and wall shear to elucidate their relation with inlet velocity and mass flow rate.
2. Methodology
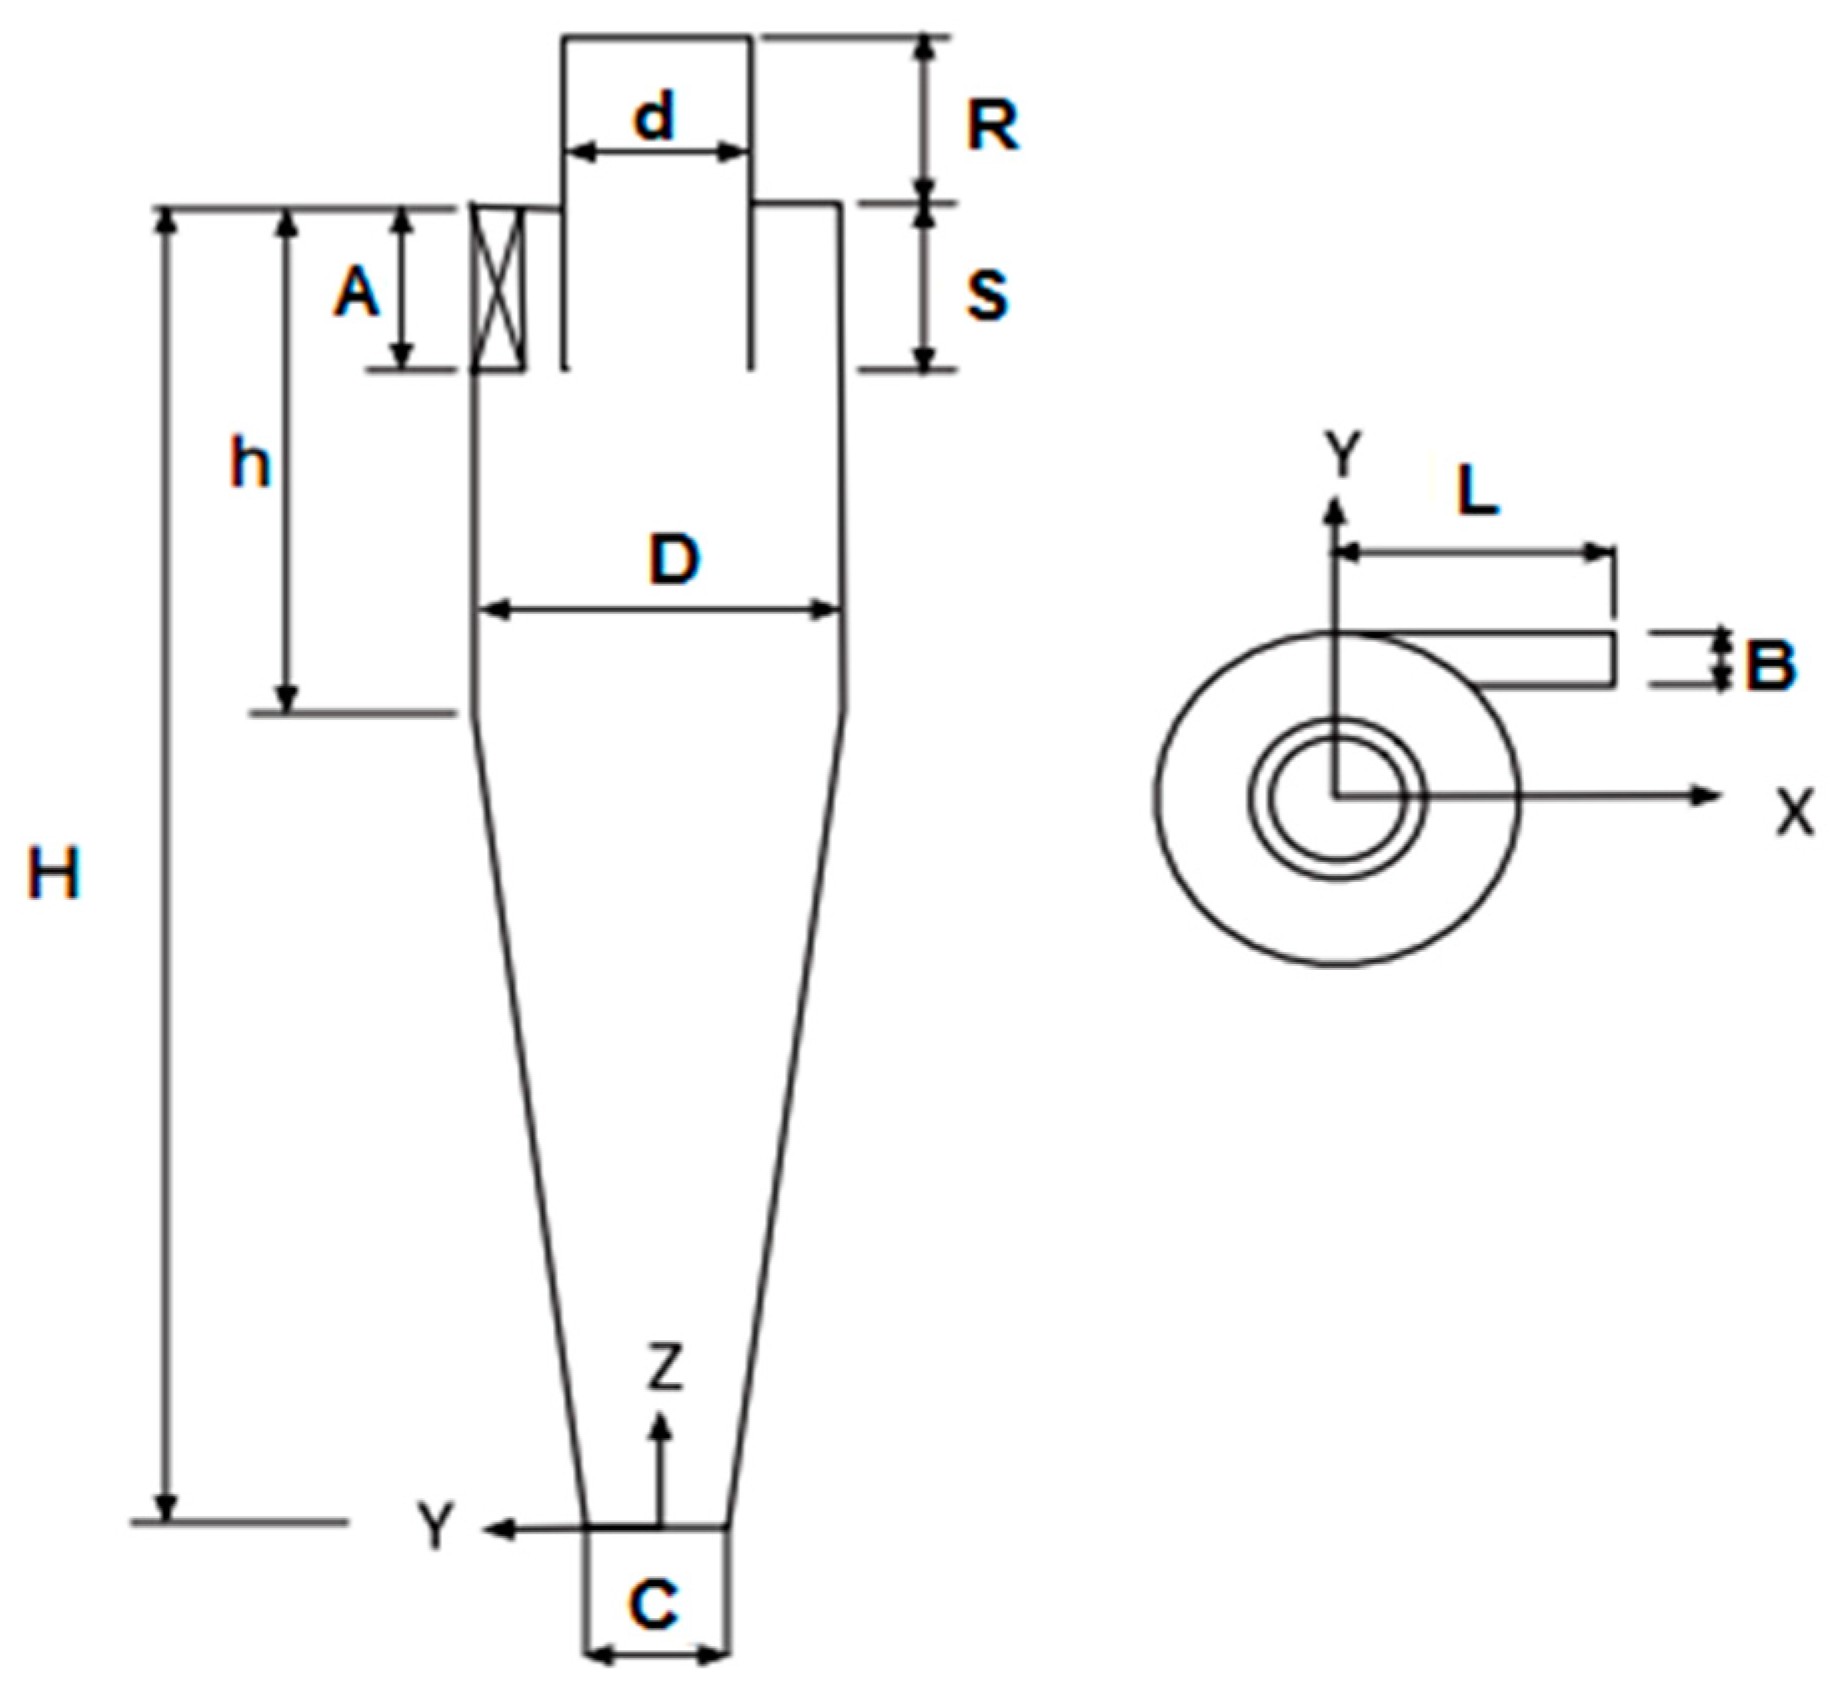
2.1. Cyclone Geometry
2.2. Euler and Stokes Numbers
2.3. Centrifugal Force
2.4. Numerical Procedure
2.5. Boundary Conditions
2.6. Discrete Phase Model (DPM)
2.7. Erosion
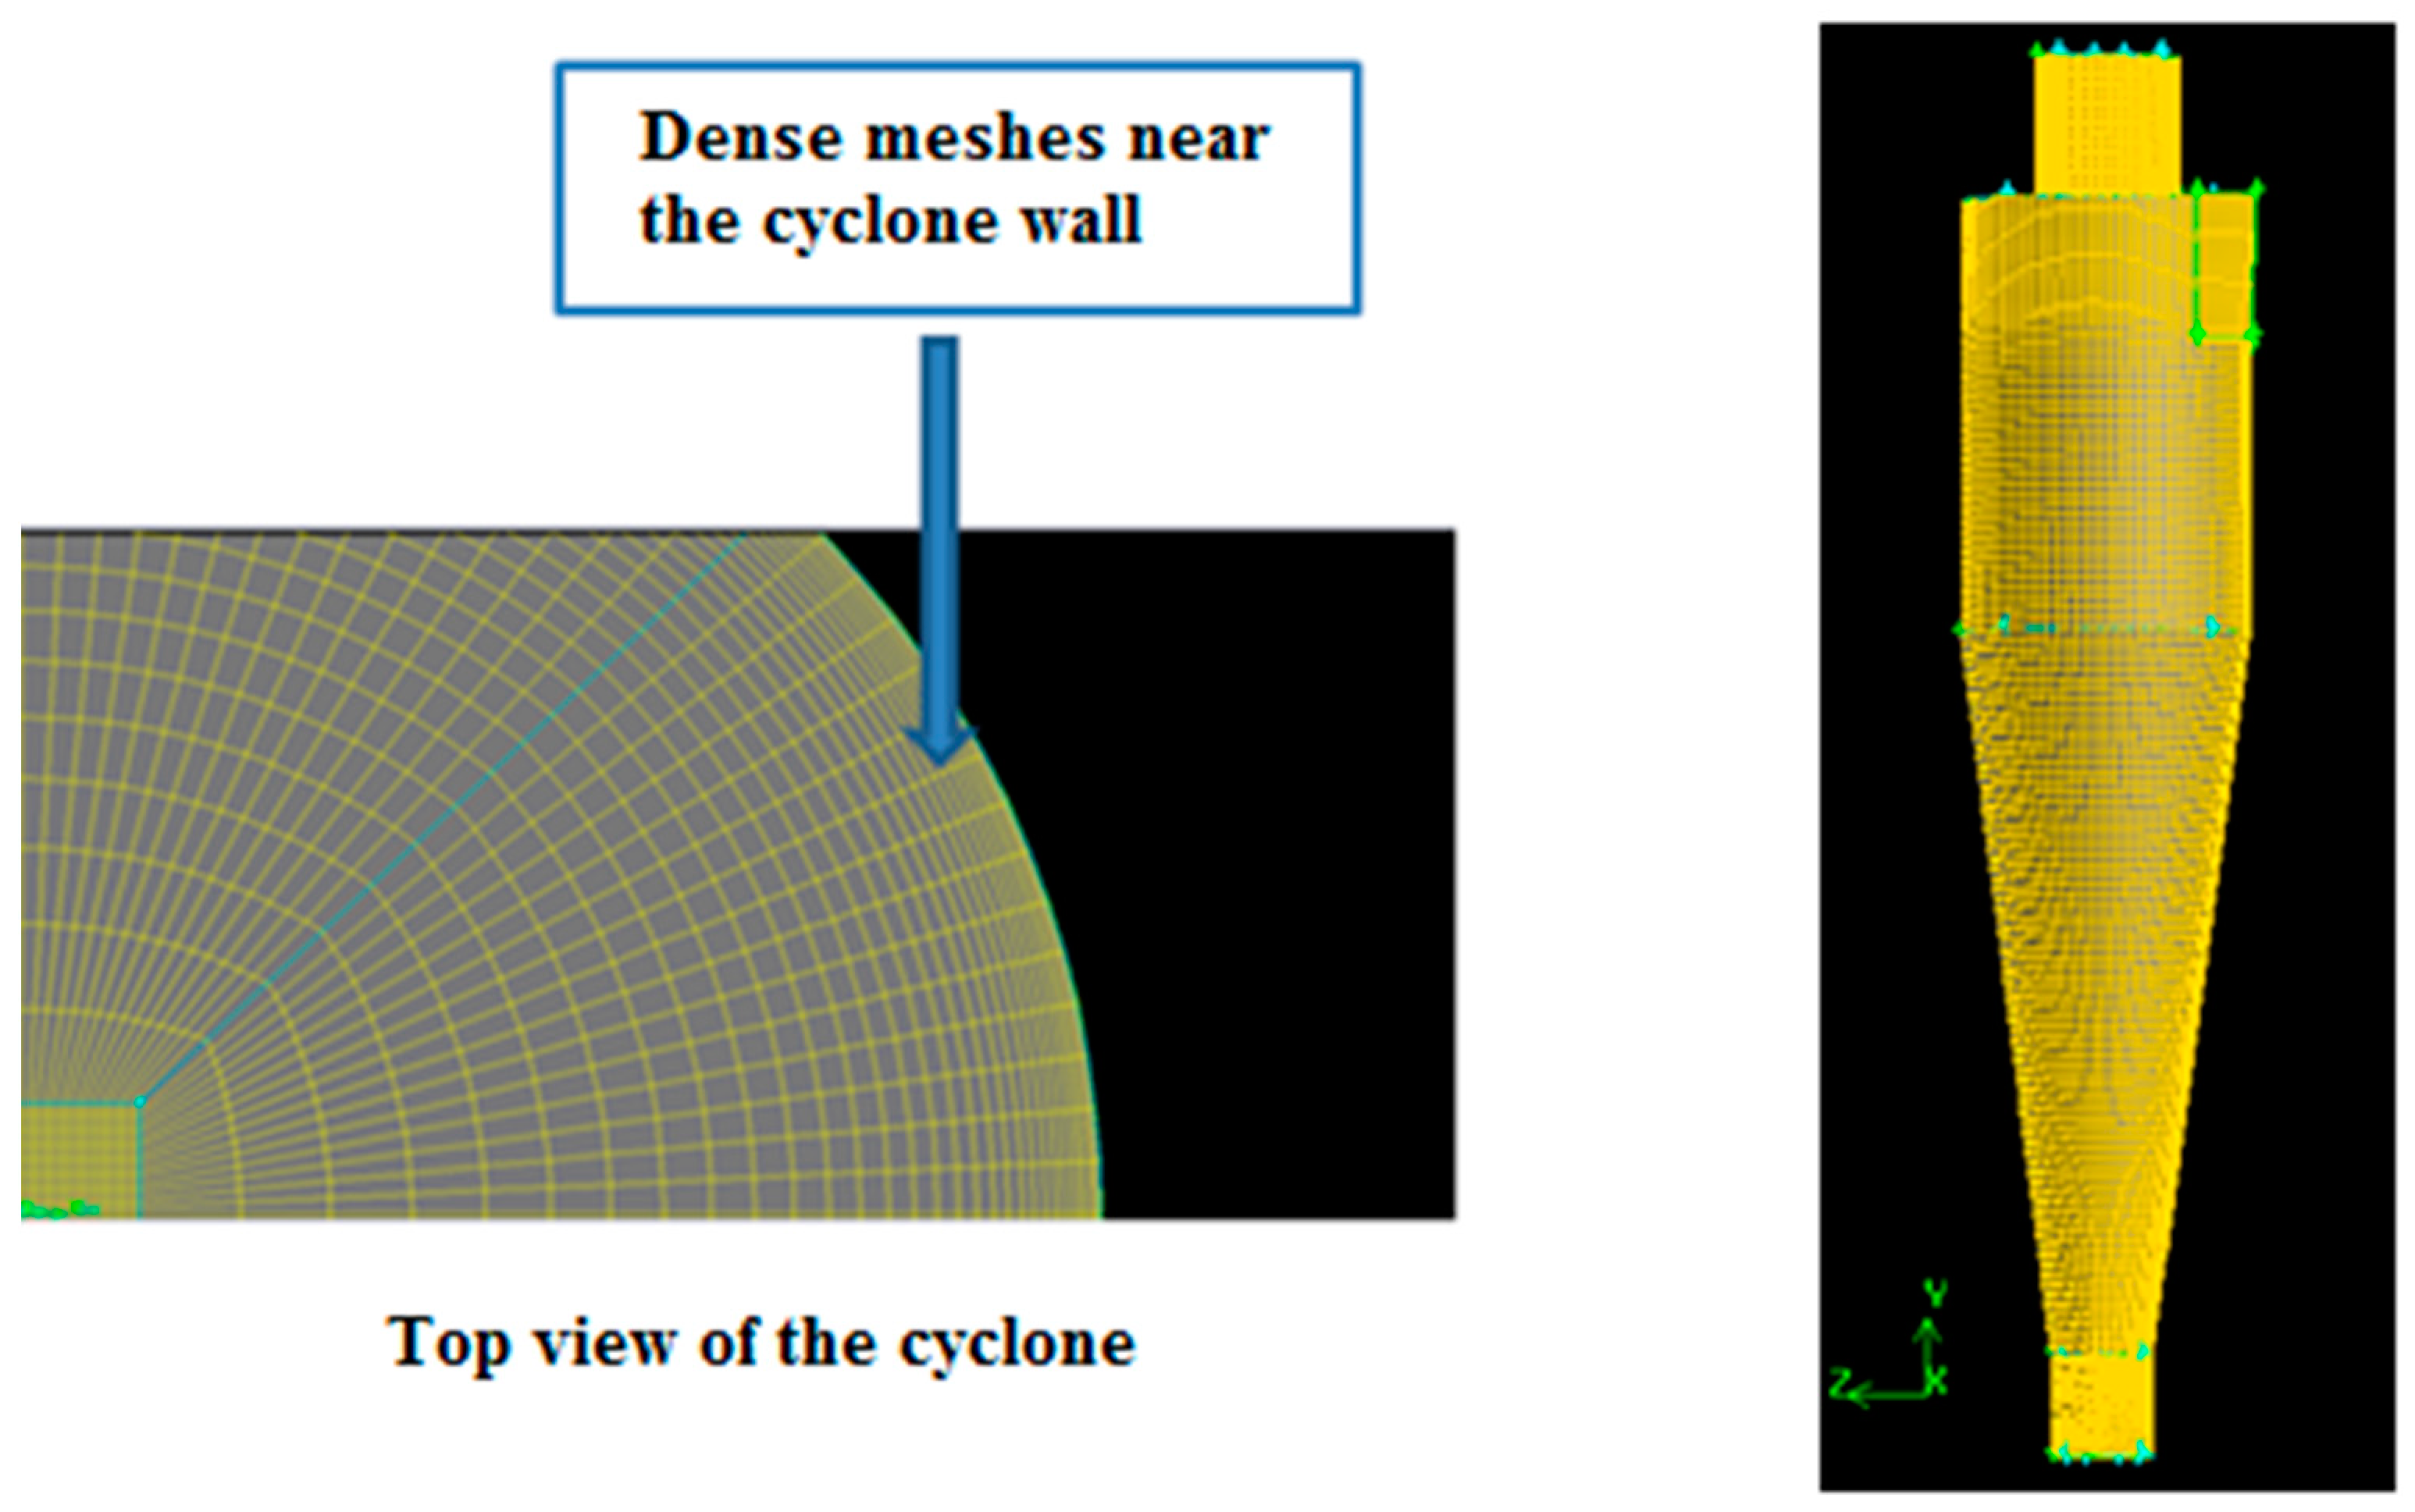
2.8. Meshing Process
3. Results and Discussion
3.1. Validation Procedure
3.2. Cyclone Performance
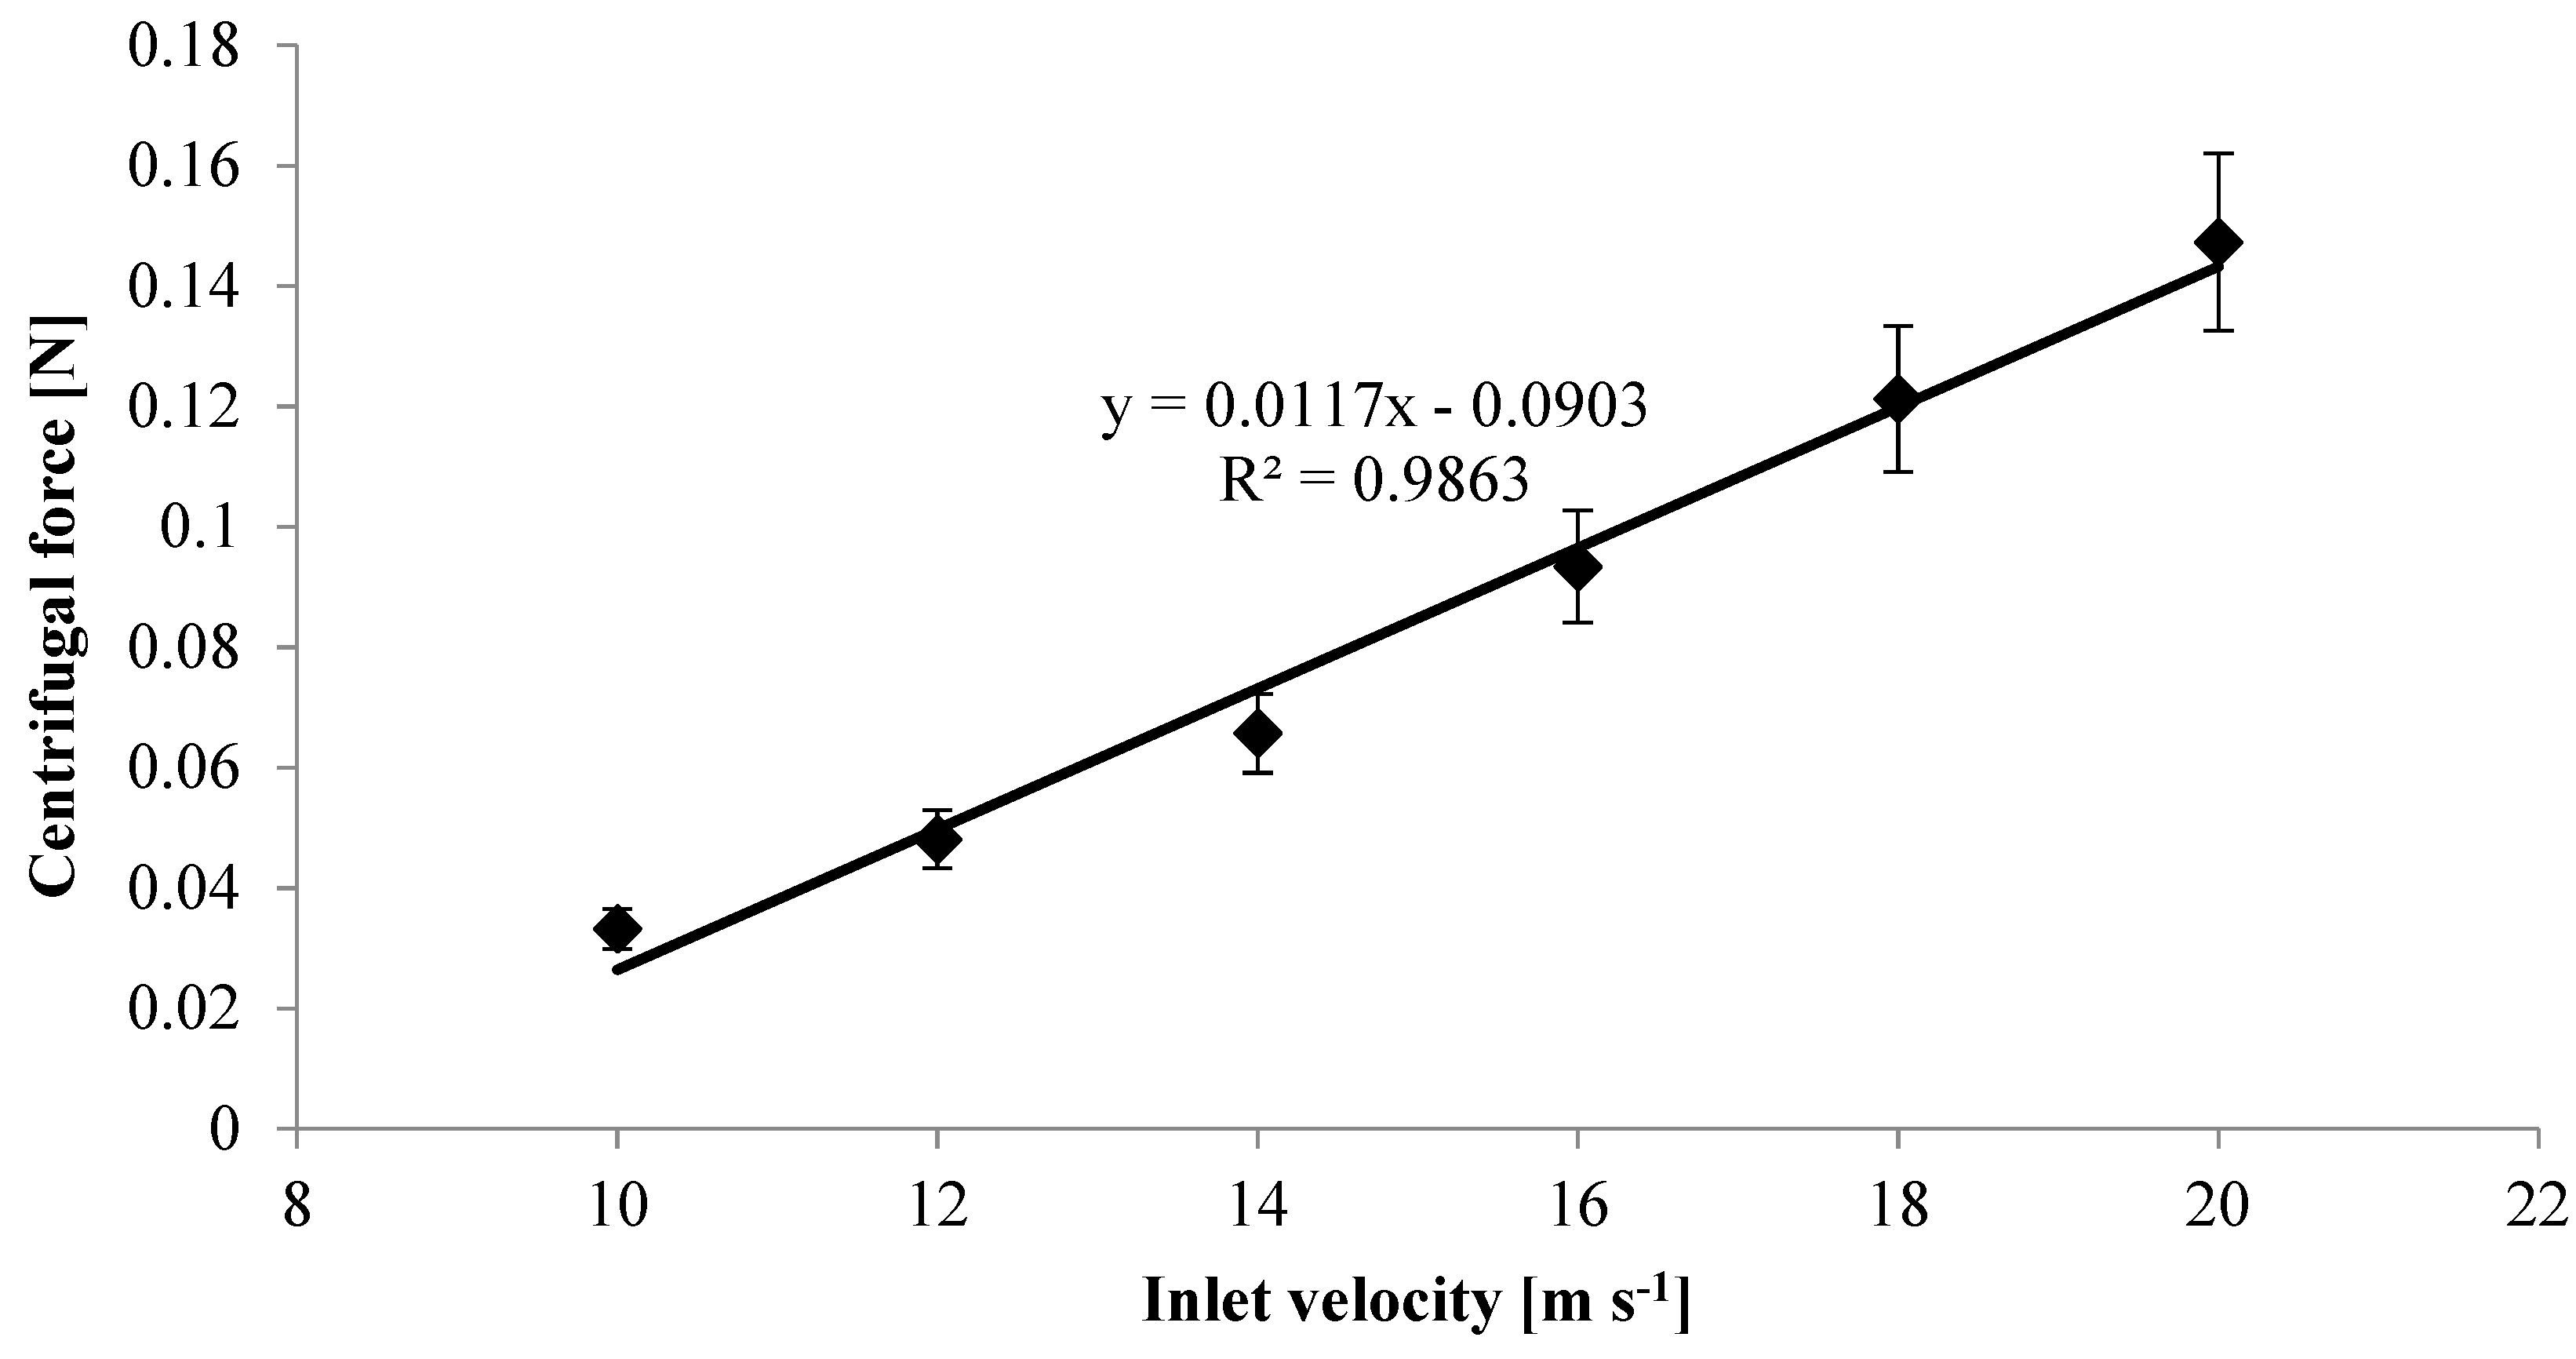
3.3. Centrifugal Force
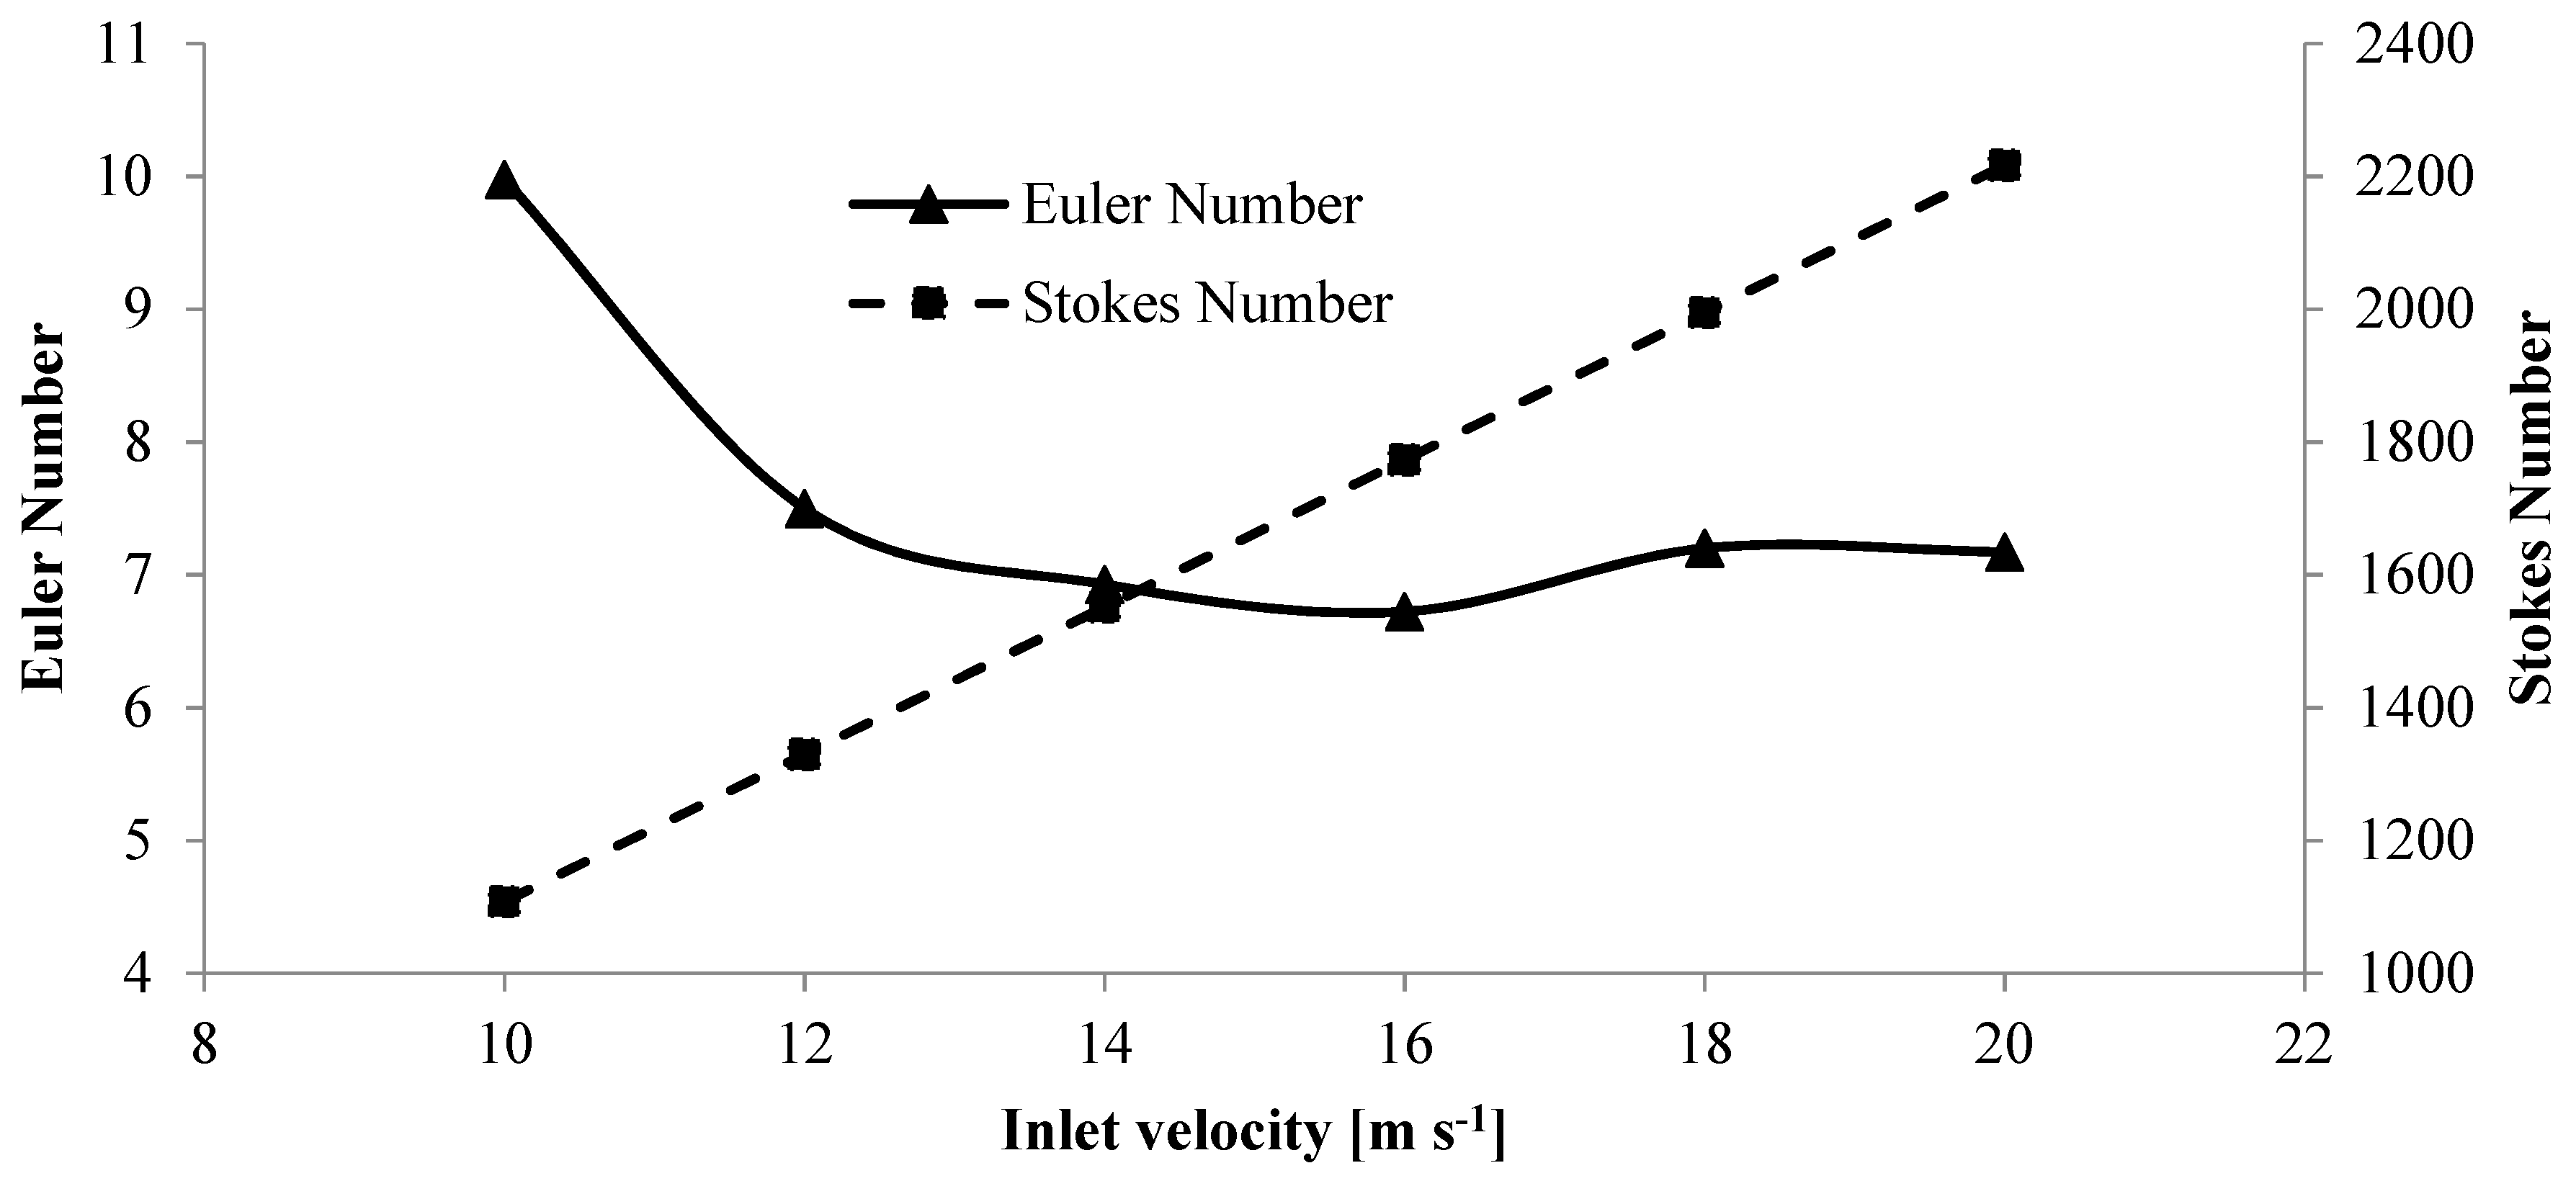
3.4. Euler and Stokes Numbers
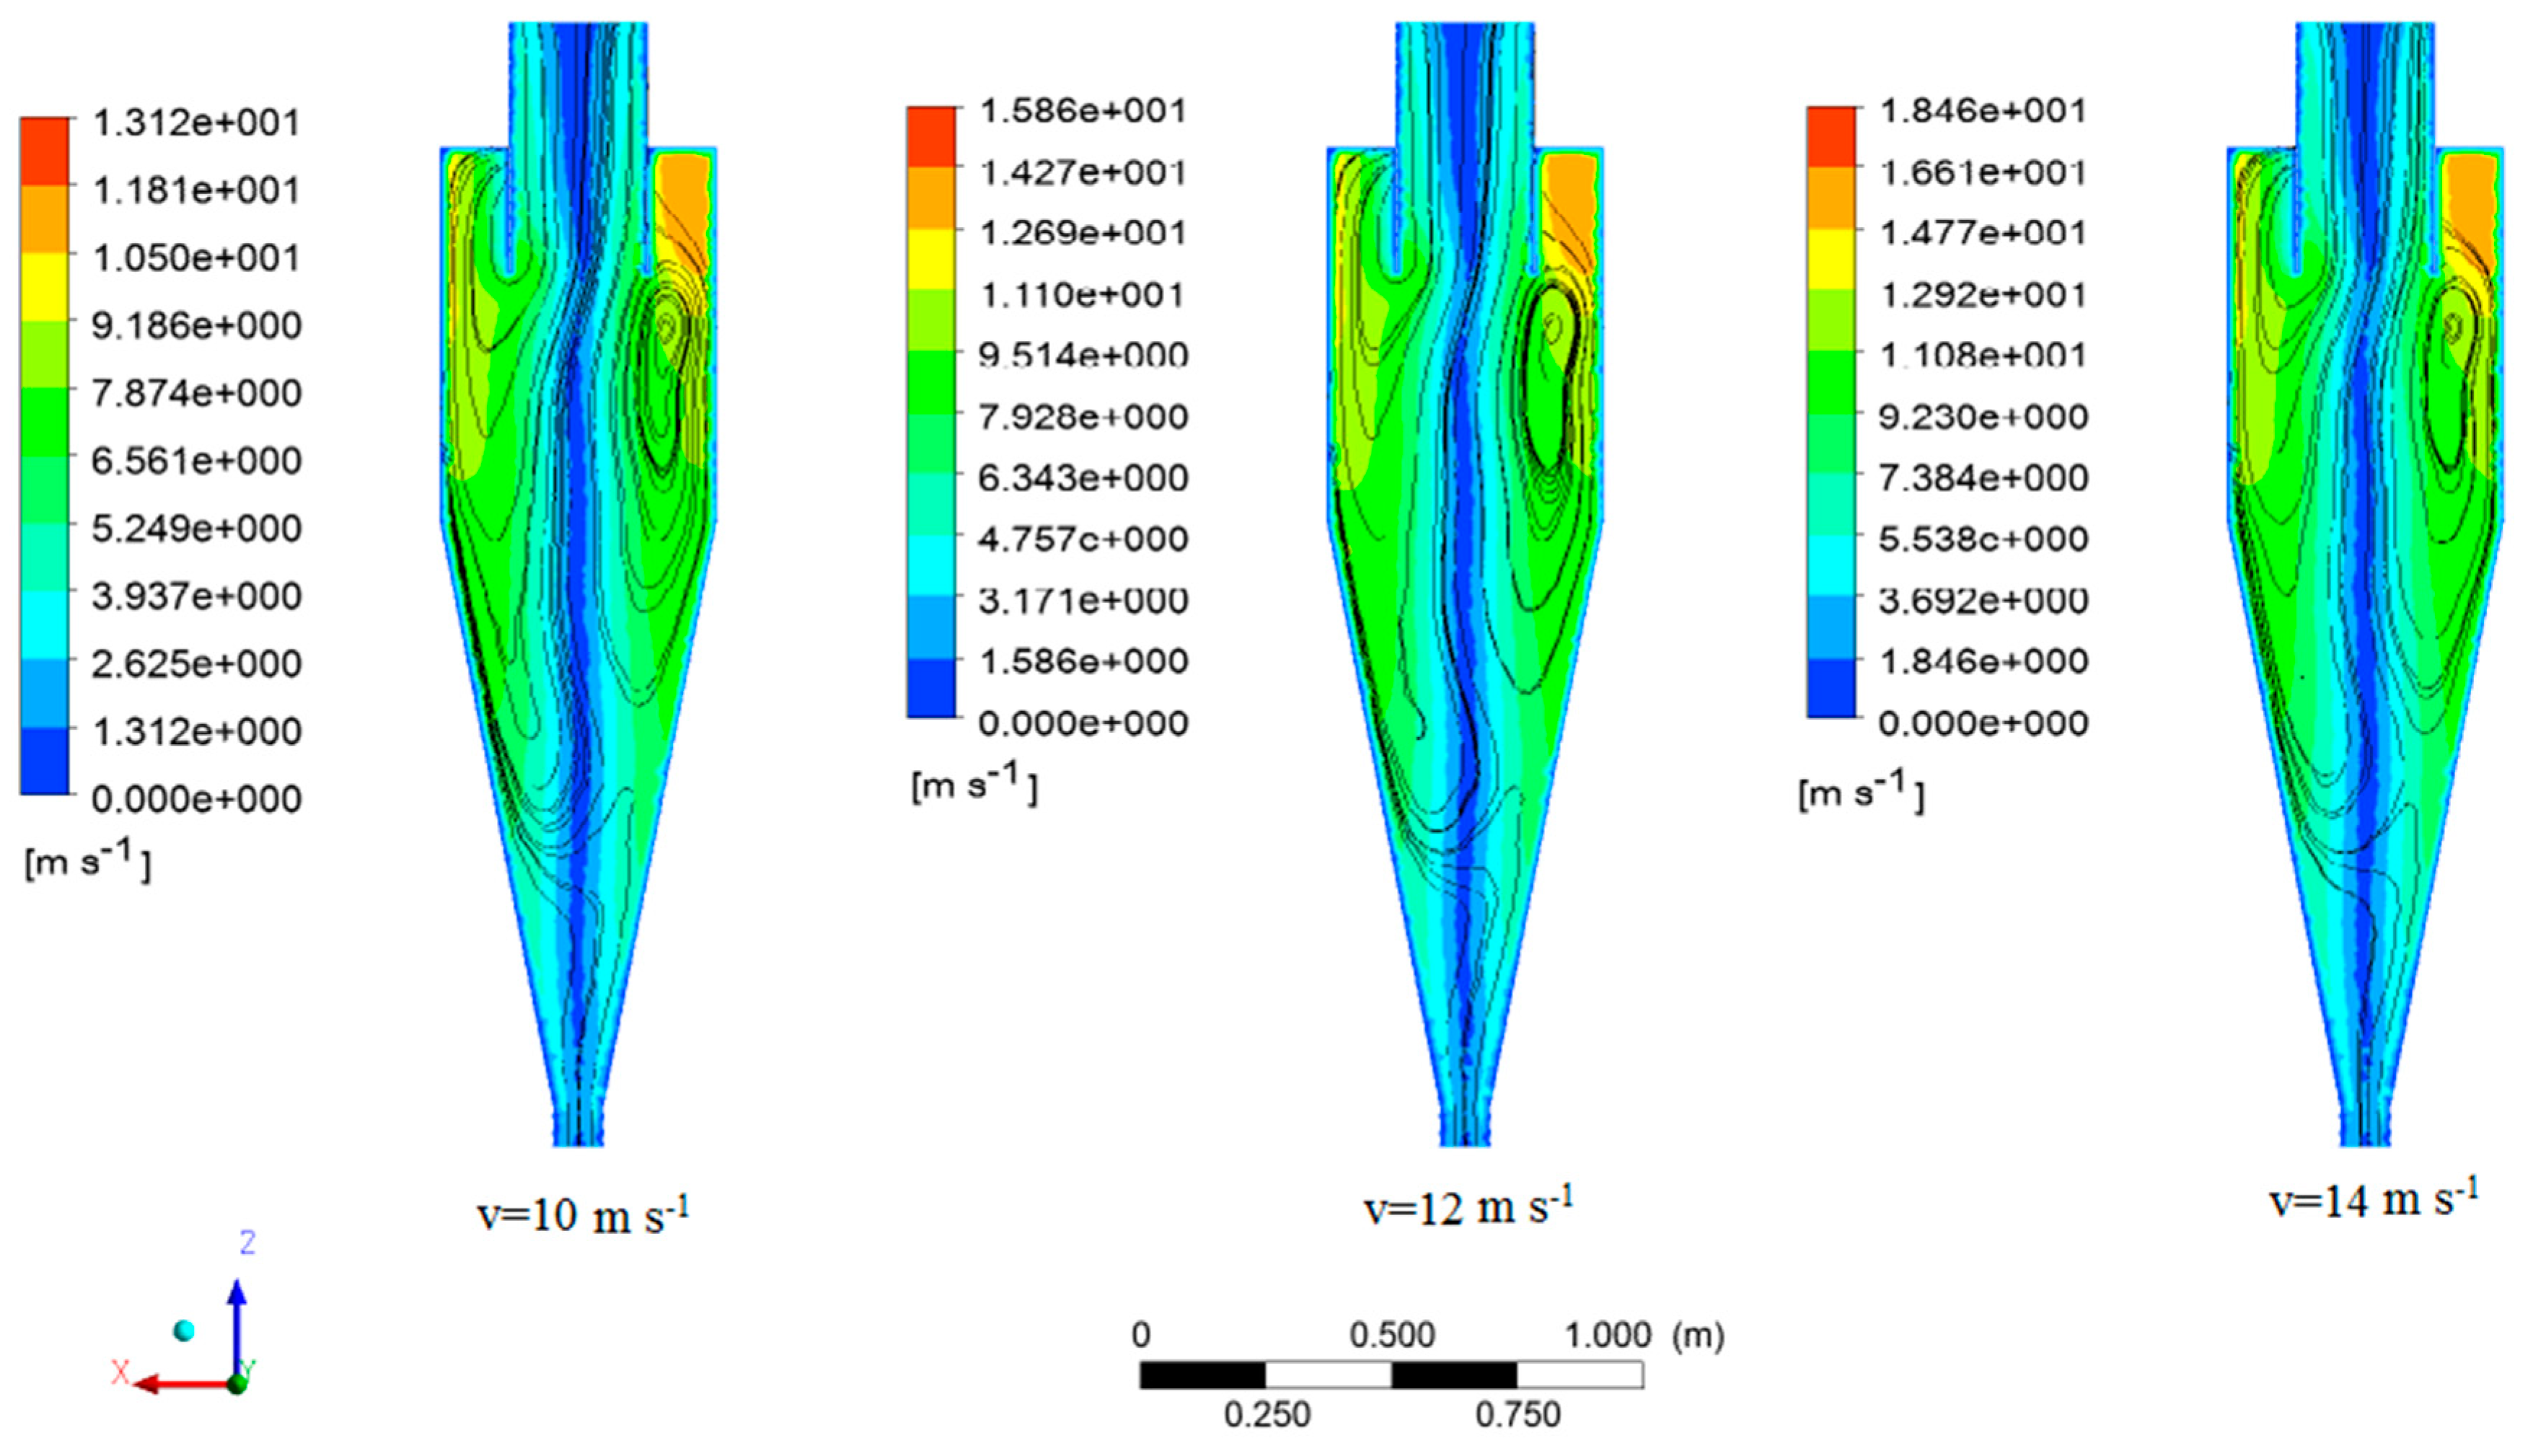
3.5. Streamline
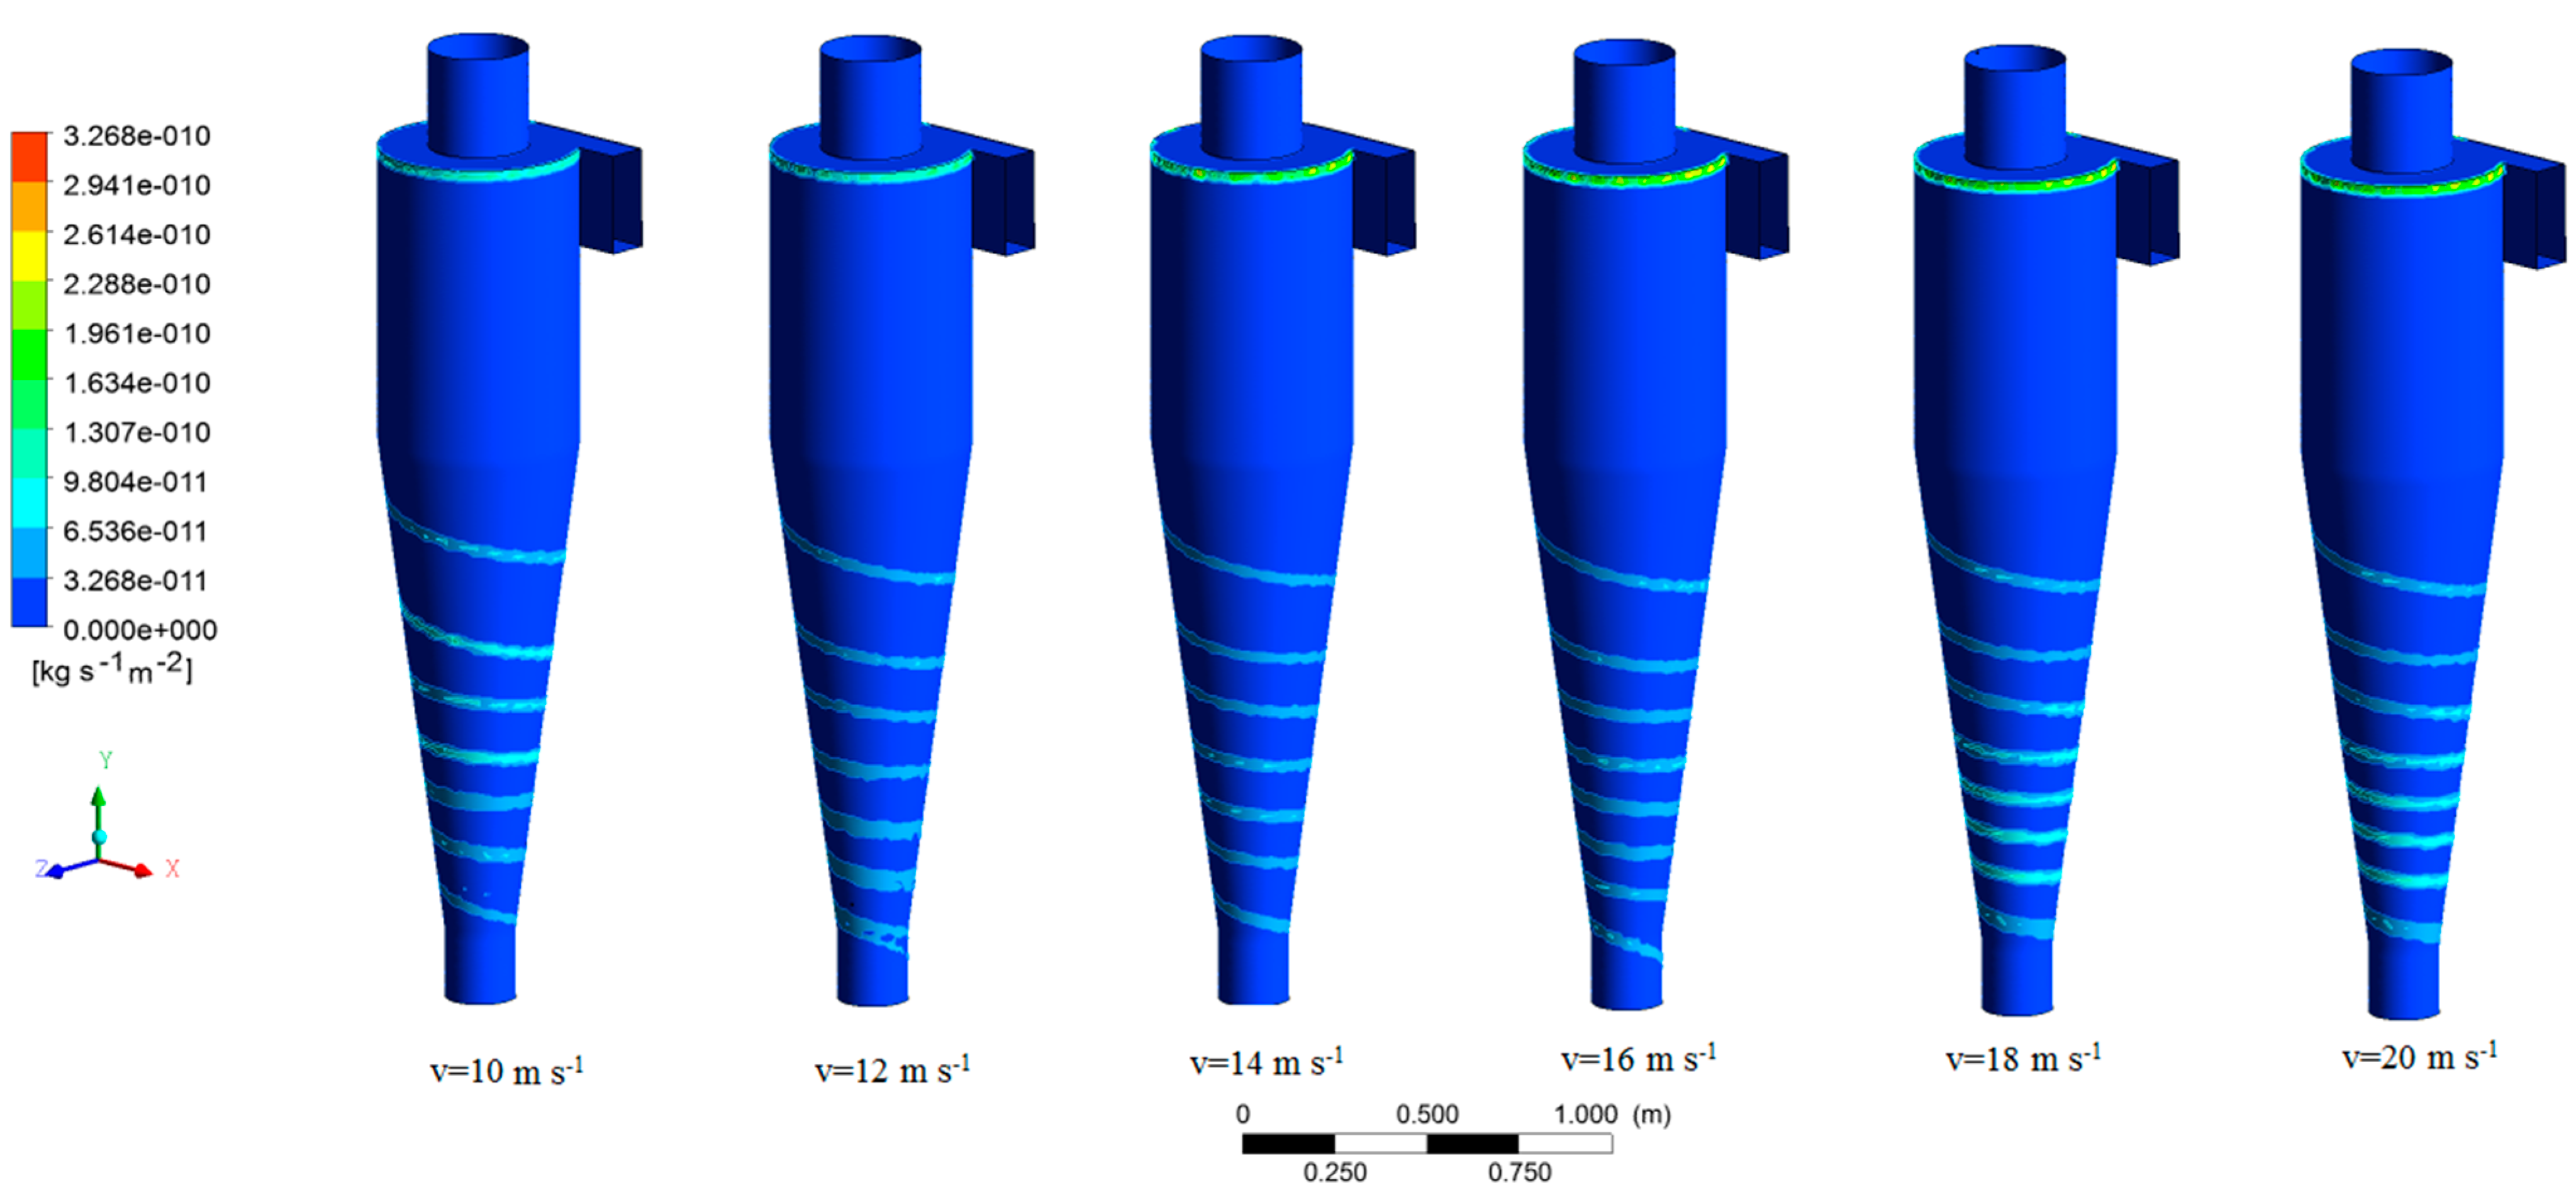
3.6. Erosion
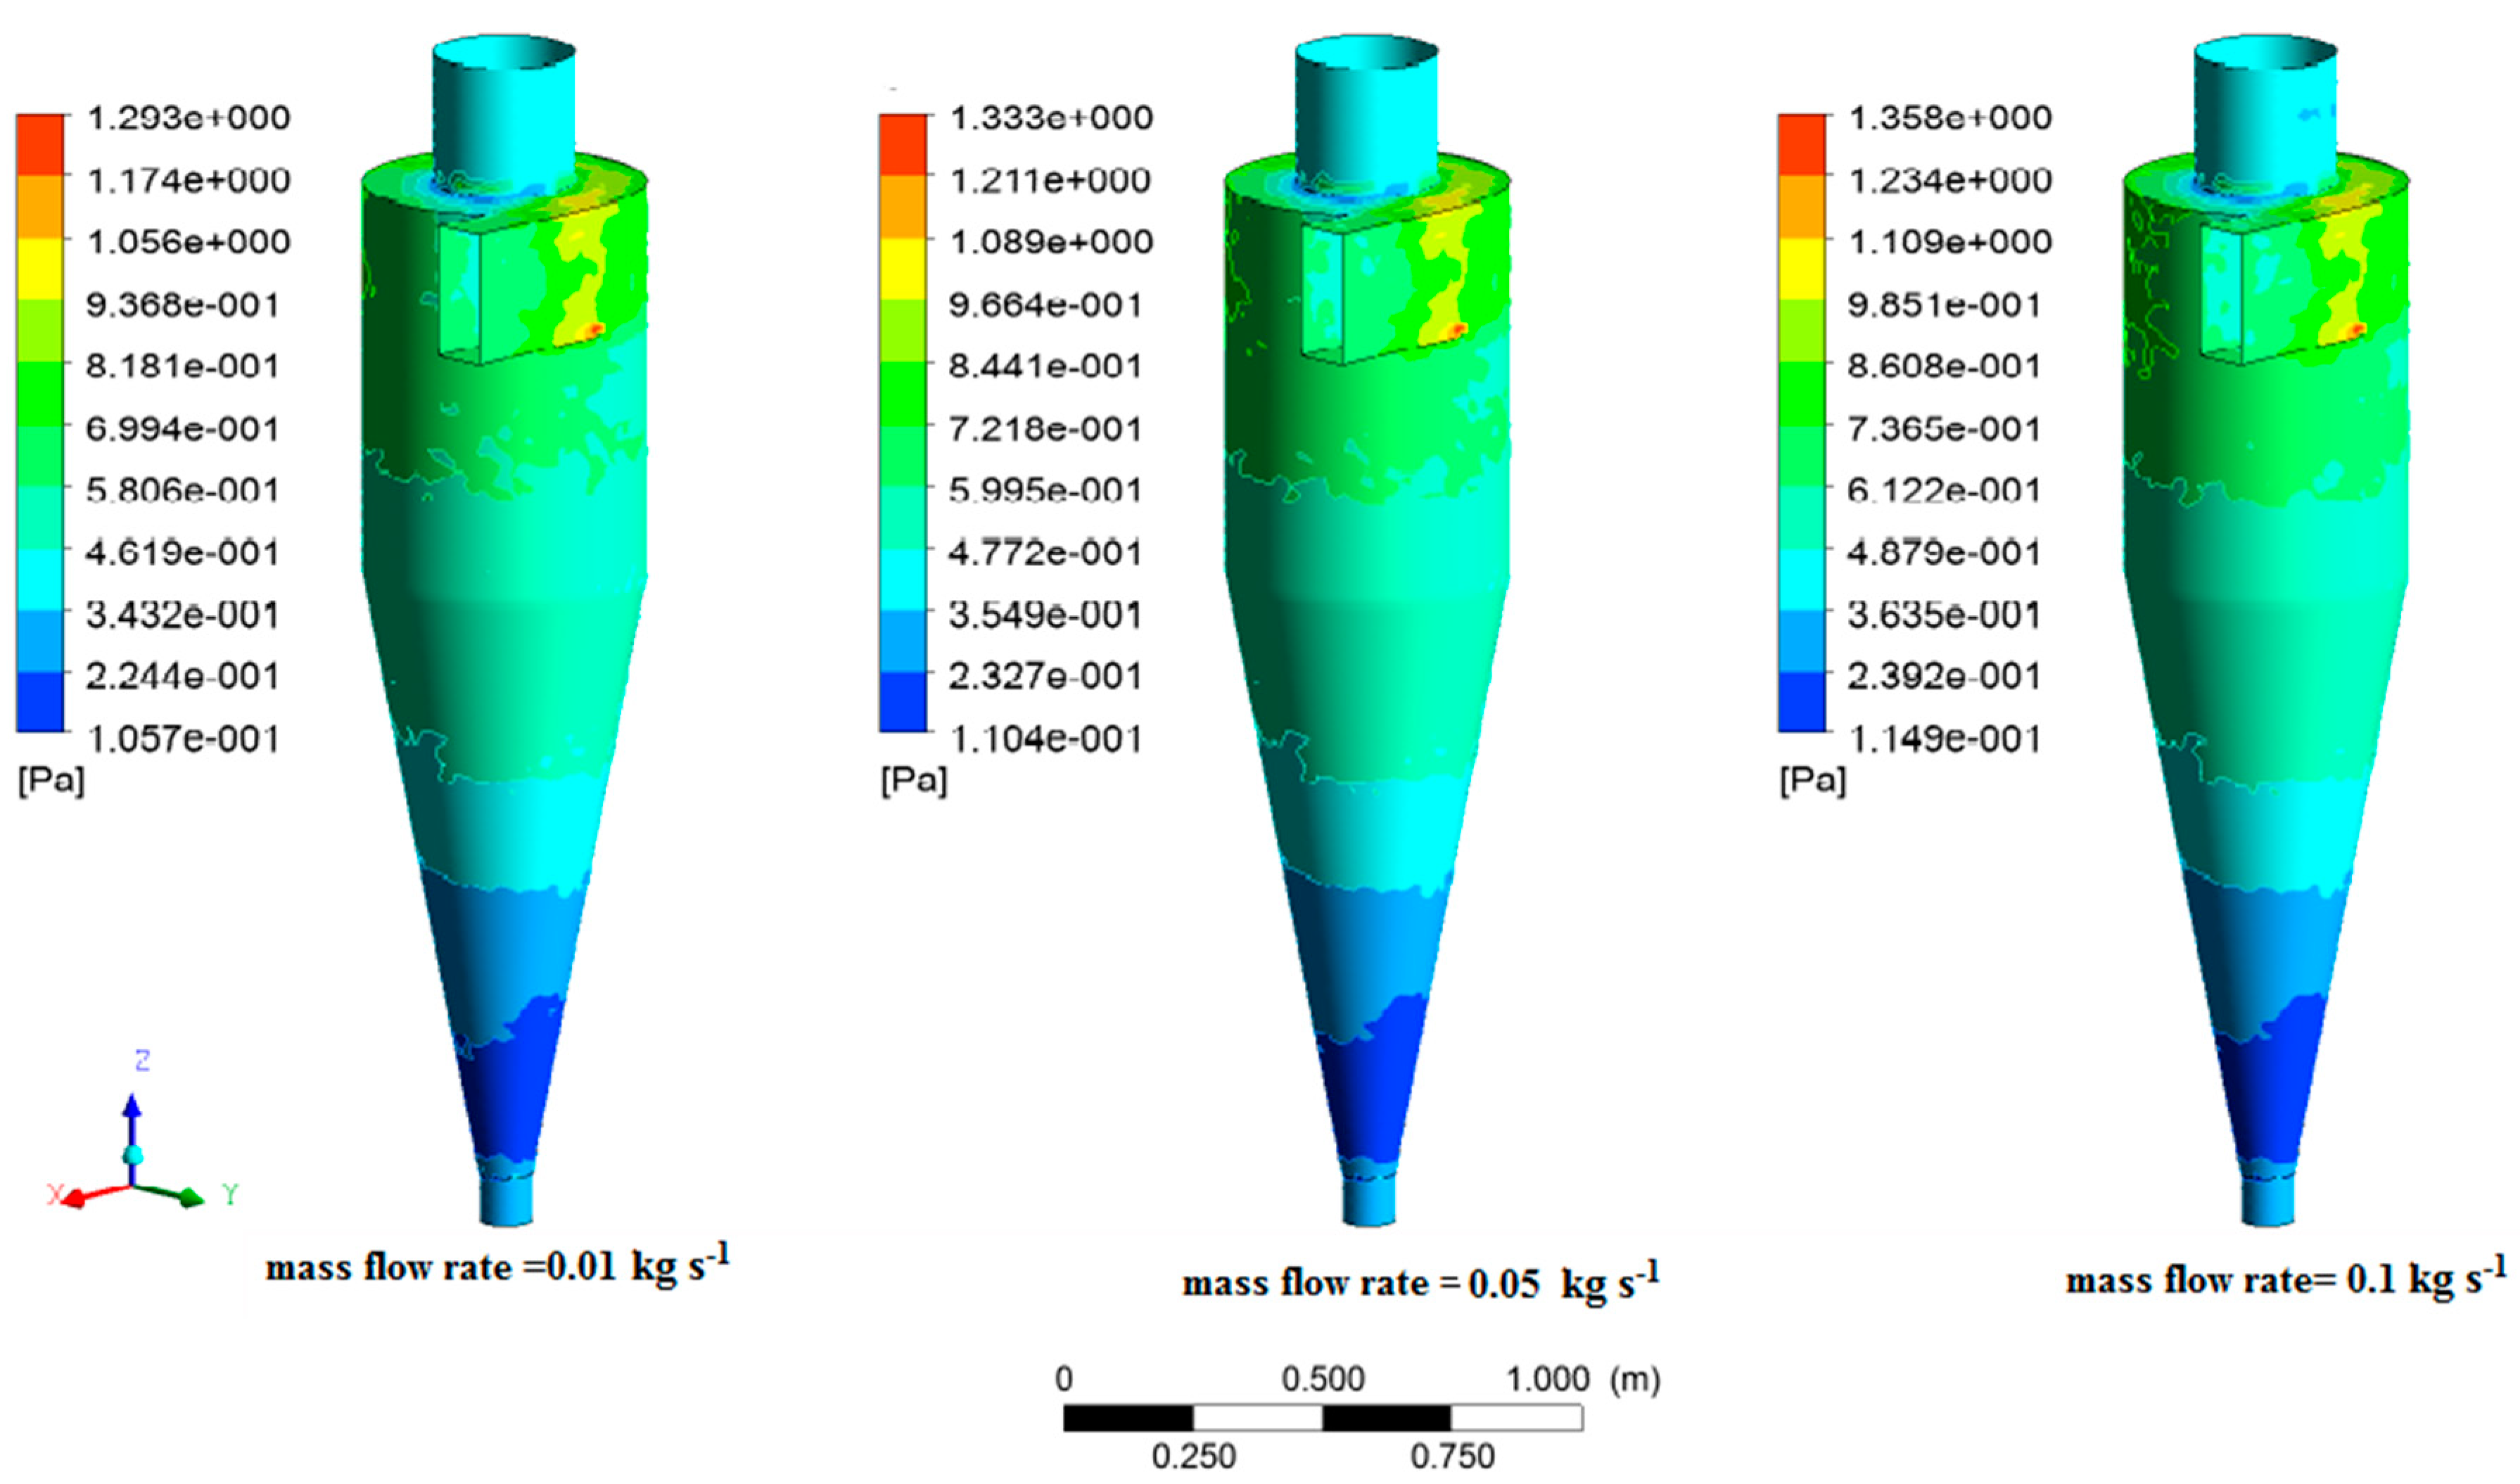
3.7. Strain Rate
3.8. Wall Shear
4. Conclusions
- As a significant result, the centrifugal force applied to wheat particles inside the cyclone was increased by an enhancement in the inlet velocity. Additionally, the variation of the Euler number showed an increasing trend by an enhancement in the inlet velocity. Whereas, the Stokes number showed an increasing trend up to the velocity of 16 m·s−1, and then a slight increase and decrease were shown in this parameter. These momentous results can be used in the operational stages.
- The maximum erosion rate was achieved in the entrance and conical sections of the cyclone. It is noteworthy that the distribution of the erosion on the cyclone wall is analogous to the wheat seeds’ trajectory. Additionally, in Vin = 16 m·s−1 the particles are more influenced by the flow. On the other hand, in Vin = 10 m·s−1 the flow influence on the particles is less than other inlet velocities.
- The strain rate domain was increased by increasing the inlet velocity. Then, it was developed in the adjacent sections in a gradual process. The main impact of increasing the inlet velocity was on the bottom edge of the vortex finder. Additionally, raising the mass flow rate enhanced the strain rate inside the cyclone. It can be argued that this increase was probably due to the cyclone operating at a higher mass flow rate and higher particle collision.
- The maximum wall shear is created at the entrance of the cyclone and the high momentum of flow could be the major cause of it. Additionally, the minimum wall shear was created in the bottom segment of the conical section. The wall shear increased by raising the mass flow rate.
Author Contributions
Funding
Institutional Review Board Statement
Informed Consent Statement
Data Availability Statement
Conflicts of Interest
References
- Funk, P.A.; Elsayed, K.; Yeater, K.M.; Holt, G.A.; Whitelock, D.P. Could cyclone performance improve with reduced inlet velocity? Powder Technol. 2015, 280, 211–218. [Google Scholar] [CrossRef] [Green Version]
- Rezvanivand Fanayi, A.; Nikbakht, A.M. A CFD study of the effects of feed diameter on the pressure drop in acyclone separator. Int. J. Food Eng. 2015, 11, 71–77. [Google Scholar] [CrossRef]
- Miller, B.G. Clean Coal Engineering Technology; Butterworth-Heinemann: Oxford, UK, 2011; ISBN 9780128113653. [Google Scholar]
- Misiulia, D.; Elsayed, K.; Gustav, A. Geometry optimization of a deswirler for cyclone separator in terms of pressure drop using CFD and artificial neural network. Sep. Purif. Technol. 2017, 158, 10–23. [Google Scholar] [CrossRef]
- Huang, A.; Ito, K.; Fukasawa, T.; Yoshida, H.; Kuo, H.; Fukui, K. Classification performance analysis of a novel cyclone with a slit on the conical part by CFD simulation. Sep. Purif. Technol. 2017, 190, 25–32. [Google Scholar] [CrossRef]
- Gimbun, J.; Chuah, T.G.; Fakhru’l-Razi, A.; Choong, T.S.Y. The influence of temperature and inlet velocity on cyclone pressure drop: A CFD study. Chem. Eng. Process. Process Intensif. 2005, 44, 7–12. [Google Scholar] [CrossRef]
- Shalaby, H.; Wozniak, K.; Wozniak, G. Numerical Calculation of Particle-Laden Cyclone Separator Flow Using Les. Eng. Appl. Comput. Fluid Mech. 2008, 2, 382–392. [Google Scholar] [CrossRef] [Green Version]
- Zhao, B. Prediction of gas-particle separation efficiency for cyclones: A time-of-flight model. Sep. Purif. Technol. 2012, 85, 171–177. [Google Scholar] [CrossRef]
- Wan, G.; Sun, G.; Xue, X.; Shi, M. Solids concentration simulation of different size particles in a cyclone separator. Powder Technol. 2008, 183, 94–104. [Google Scholar] [CrossRef]
- Sun, X.; Kim, S.; Yang, S.D.; Kim, H.S.; Yoon, J.Y. Multi-objective optimization of a Stairmand cyclone separator using response surface methodology and computational fluid dynamics. Powder Technol. 2017, 320, 51–65. [Google Scholar] [CrossRef]
- Sun, X.; Yoon, J.Y. Multi-objective optimization of a gas cyclone separator using genetic algorithm and computational fluid dynamics. Powder Technol. 2018, 325, 347–360. [Google Scholar] [CrossRef]
- Park, D.; Cha, J.; Kim, M.; Go, J.S. Multi-objective optimization and comparison of surrogate models for separation performances of cyclone separator based on CFD, RSM, GMDH-neural network, back propagation-ANN and genetic algorithm. Eng. Appl. Comput. Fluid Mech. 2020, 14, 180–201. [Google Scholar] [CrossRef]
- Brar, L.S.; Elsayed, K. Analysis and optimization of cyclone separators with eccentric vortex finders using large eddy simulation and artificial neural network. Sep. Purif. Technol. 2018, 207, 269–283. [Google Scholar] [CrossRef]
- Le, D.K.; Yoon, J.Y. Numerical investigation on the performance and flow pattern of two novel innovative designs of four-inlet cyclone separator. Chem. Eng. Process Process Intensif. 2020, 150, 107867. [Google Scholar] [CrossRef]
- Lim, J.H.; Park, S.I.; Lee, H.J.; Zahir, M.Z.; Yook, S.J. Performance evaluation of a tangential cyclone separator with additional inlets on the cone section. Powder Technol. 2020, 359, 118–125. [Google Scholar] [CrossRef]
- Nassaj, O.R.; Toghraie, D.; Afrand, M. Effects of multi inlet guide channels on the performance of a cyclone separator. Powder Technol. 2019, 356, 353–372. [Google Scholar] [CrossRef]
- Qiang, L.; Qinggong, W.; Weiwei, X.; Zilin, Z.; Konghao, Z. Experimental and computational analysis of a cyclone separator with a novel vortex finder. Powder Technol. 2020, 360, 398–410. [Google Scholar] [CrossRef]
- Gao, Z.; Wang, J.; Wang, J.; Mao, Y.; Wei, Y. Analysis of the effect of vortex on the flow field of a cylindrical cyclone separator. Sep. Purif. Technol. 2018, 211, 438–447. [Google Scholar] [CrossRef]
- Zhou, Y.; Xu, Z.; Xiao, G.; Hu, X.; Chen, H.; Zhang, R.; Luo, X.; Wang, J.; Yang, Y. Monitoring the hydrodynamics and critical variation of separation efficiency of cyclone separator via acoustic emission technique with multiple analysis methods. Powder Technol. 2020, 373, 174–183. [Google Scholar] [CrossRef]
- Gao, W.; Li, J.; Li, Y.; Kong, L. Numerical identification of critical erosion prone areas in tube heat exchangers. Eng. Appl. Comput. Fluid Mech. 2020, 14, 1429–1444. [Google Scholar] [CrossRef]
- Dizajyekan, S.N.; Shahgholi, G.; Fanaei, A.R.; Rostampour, V.; Sharabiani, V.R.; Szymanek, M.; Marczuk, A. A Comprehensive CFD Assessmeant of Wheat Flow in Wheat Experimental Data. Processes 2022, 10, 1. [Google Scholar] [CrossRef]
- Rezvanivand Fanaei, A.; Nikbakht, A.M.; Hassanpour, A. A computational-experimental investigation of thermal vapor compressor as an energy saving tool for the crystallization of sugar in a sugar processing plant. J. Food Process Eng. 2021, 44, e13727. [Google Scholar] [CrossRef]
- Mohammadzadeh, P.; Shahgholi, G.; Fanaei, A.R.; Rostampour, V. Assessment of larvae killing pneumatic conveying system elbow: Screening the pressure drop and numerical simulation. J. Food Process Eng. 2021, 11, e13868. [Google Scholar] [CrossRef]
- Zobeiri, M.; Rostampour, V.; Rezvanivand-fanaei, A.; Nikbakht, A.M. Comparative performance analysis of innovative separation chamber configurations: Numerical and experimental investigations. Span. J. Agric. Res. 2021, 19, e0206. [Google Scholar] [CrossRef]
- Mohammadzadeh, P.; Shahgholi, G.; Rezvanivand Fanaei, A.; Rostampour, V. The effect of pipe development length on flow characteristics in a larvae killing system: Screening the dilute phase by CFD. J. Food Process Eng. 2022, 1, e14035. [Google Scholar] [CrossRef]
- Rezvanivand fanaei, A.; Hasanpour, A.; Nikbakht, A.M. Study of The Vapor Thermo-Compressor to Reduce Energy Consumption in the Sugar Production Line using Computational Fluid Dynamics. J. Agric. Mach. 2020, 10, 241–253. [Google Scholar] [CrossRef]
- Rhodes, M. Introduction to Particle Technology; John Wiley & Sons: Hoboken, NJ, USA, 2008; ISBN 9780470014271. [Google Scholar]
- Inc A. ANSYS FLUENT Theory Guide ANSYS FLUENT Theory Guide. Comput. Commun. 2013, 15317, 373–464. [Google Scholar] [CrossRef]
- Oka, Y.I.; Yoshida, T. Practical estimation of erosion damage caused by solid particle impact: Part 2: Mechanical properties of materials directly associated with erosion damage. In Wear; Elsevier: Amsterdam, The Netherlands, 2005; Volume 259, pp. 102–109. [Google Scholar]
- Zhou, F.; Sun, G.; Zhang, Y.; Ci, H.; Wei, Q. Experimental and CFD study on the effects of surface roughness on cyclone performance. Sep. Purif. Technol. 2018, 193, 175–183. [Google Scholar] [CrossRef]
- Karagoz, I.; Avci, A.; Surmen, A.; Sendogan, O. Design and performance evaluation of a new cyclone separator. J. Aerosol Sci. 2013, 59, 57–64. [Google Scholar] [CrossRef]
- Ji, L.; Chen, J.; Kuang, S.; Qi, Z.; Chu, K.; Yu, A.; Chen, J.; Kuang, S.; Qi, Z.; Chu, K.; et al. Prediction of separation performance of hydrocyclones by a PC-based model. Sep. Purif. Technol. 2018, 121, 141–150. [Google Scholar] [CrossRef]
- Parvaz, F.; Hosseini, S.H.; Elsayed, K.; Ahmadi, G. Influence of the dipleg shape on the performance of gas cyclones. Sep. Purif. Technol. 2020, 233, 116000. [Google Scholar] [CrossRef]
- Parvaz, F.; Hosseini, S.H.; Elsayed, K.; Ahmadi, G. Numerical investigation of effects of inner cone on flow field, performance and erosion rate of cyclone separators. Sep. Purif. Technol. 2018, 201, 223–237. [Google Scholar] [CrossRef]


| Parameters | Values (cm) |
|---|---|
| Body diameter (D) | 55 |
| Gas outlet diameter (d) | 27.5 |
| Inlet height (A) | 27.5 |
| Inlet width (B) | 11 |
| Gas outlet duct length (R) | 27.5 |
| Total height (H) | 220 |
| Cylindrical section height (h) | 82.5 |
| Cone-tip diameter (C) | 19.25 |
| Vortex finder height (S) | 27.5 |
| Inlet length (L) | 35 |
| Boundary Condition Type | Value/Condition |
|---|---|
| Velocity inlet | m⋅s−1 |
| Pressure outlet | Atmospheric pressure |
| Wall | No-slip condition |
| Numerical Setting | Scheme |
|---|---|
| Pressure distribution | PRESTO! |
| Pressure-velocity coupling | SIMPLE |
| Momentum discretization | Second-Order Upwind |
| Turbulent Kinetic Energy | Second-Order Upwind |
| Turbulent Dissipation Rate | Second-Order Upwind |
| Property | Value |
|---|---|
| Density | 790 kg⋅m−3 |
| Minimum diameter | 0.2 cm |
| Maximum diameter | 0.8 cm |
| Mean Diameter | 0.5 cm |
Publisher’s Note: MDPI stays neutral with regard to jurisdictional claims in published maps and institutional affiliations. |
© 2022 by the authors. Licensee MDPI, Basel, Switzerland. This article is an open access article distributed under the terms and conditions of the Creative Commons Attribution (CC BY) license (https://creativecommons.org/licenses/by/4.0/).
Share and Cite
Dizajyekan, S.N.; Shahgholi, G.; Fanaei, A.R.; Rostampour, V.; Sharabiani, V.R.; Szymanek, M.; Kulig, R. Evaluation of Centrifugal Force, Erosion, Strain Rate, and Wall Shear in a Stairmand Cyclone. Processes 2022, 10, 994. https://doi.org/10.3390/pr10050994
Dizajyekan SN, Shahgholi G, Fanaei AR, Rostampour V, Sharabiani VR, Szymanek M, Kulig R. Evaluation of Centrifugal Force, Erosion, Strain Rate, and Wall Shear in a Stairmand Cyclone. Processes. 2022; 10(5):994. https://doi.org/10.3390/pr10050994
Chicago/Turabian StyleDizajyekan, Sajed Naiemi, Gholamhossein Shahgholi, Adel Rezvanivand Fanaei, Vahid Rostampour, Vali Rasooli Sharabiani, Mariusz Szymanek, and Ryszard Kulig. 2022. "Evaluation of Centrifugal Force, Erosion, Strain Rate, and Wall Shear in a Stairmand Cyclone" Processes 10, no. 5: 994. https://doi.org/10.3390/pr10050994