1. Introduction
Chemical accidents are the largest factor that hinders the development of the chemical industry. Various techniques are being applied to minimize damage due to chemical accidents. Issuing an emergency evacuation order is a method of accident response that can effectively reduce human casualties due to chemical accidents. These accident responses, which are made by collecting and analyzing information related to chemical accidents, sometimes take a considerable amount of time due to the complexity of the decision making process.
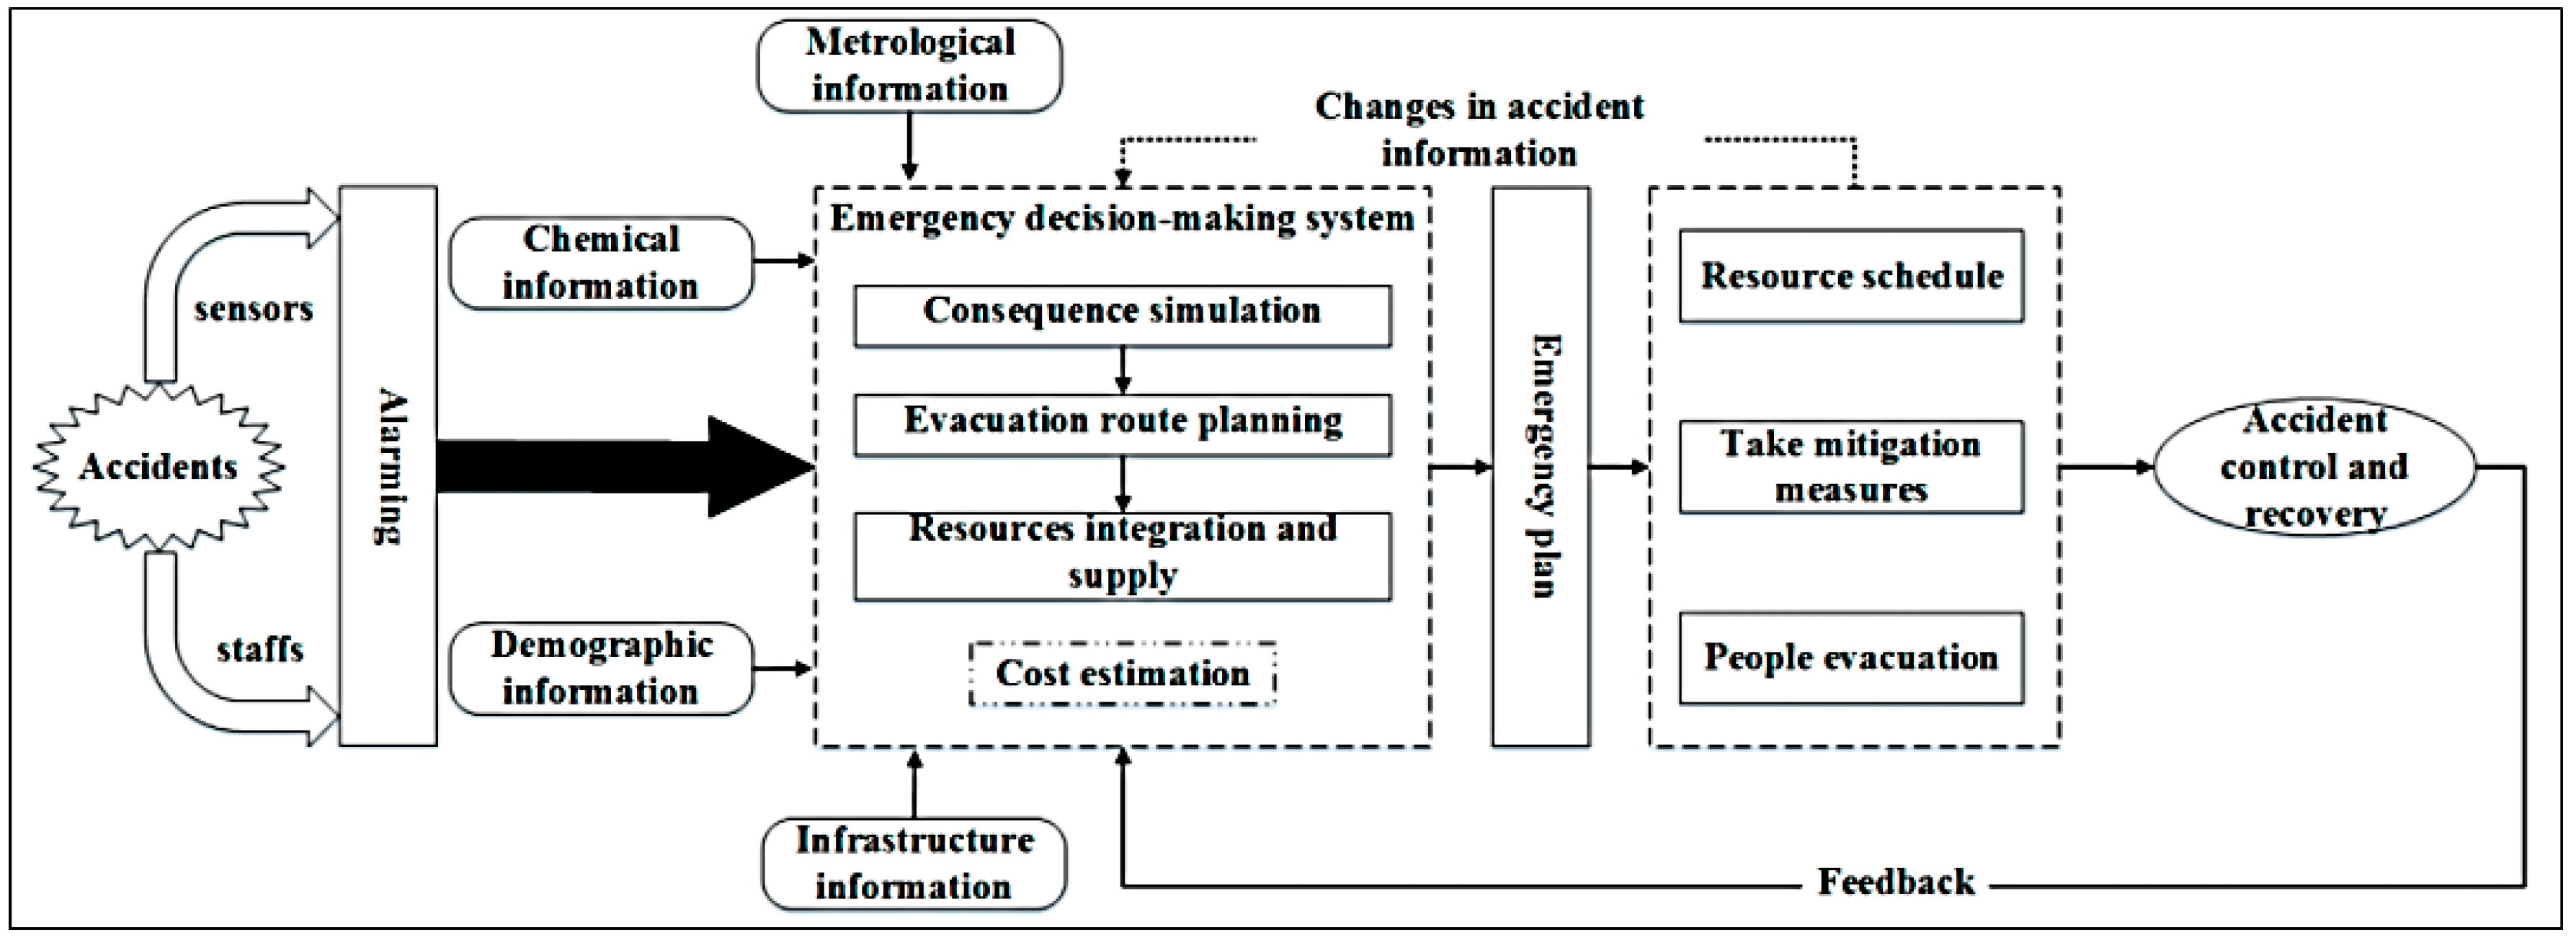
Figure 1 is an example of an emergency response decision making procedure [
1]. When a chemical accident has occurred, an alarm is issued by sensors or staff. Thereafter, the emergency decision making system is driven using chemical information, demographic information such as residential locations, metrological information including wind direction, and infrastructure information. An emergency plan is decided upon through the results of the emergency decision making system, a resource schedule is made, mitigation measures are taken, and people are evacuated.
Although the more the information necessary for the emergency decision making system is collected, the more accurate accident control becomes, the time required to collect or analyze the information increases. That is, a trade-off inevitably occurs between speed and accuracy. However, in order to successfully respond to chemical accidents, both speed and accuracy must be satisfied.
Various studies are currently being conducted in order to facilitate the emergency evacuation carried out when a chemical accident has occurred. Hou J. et al. [
2] evaluated efficiently informing residents when a large-scale evacuation order is deemed necessary as important and presented a regression analysis based mathematical model that can be used to analyze the correlation between the evacuation rate and the delivery of the evacuation order. Hou. J. et al. [
3] alstudied the correlation between chemical accidents and the evacuation of residents by analyzing chemical accidents that occurred from 2009 to 2018 using the China Chemical Information Net. Through database analysis, they identified areas where the incidence of chemical accidents was high, facilities where residents were mainly evacuated, and areas where a large number of casualties occurred due to chemical accidents. Furthermore, based on the results of the statistical analysis as such, they presented the direction of the development of emergency response measures for chemical accidents from the perspective of each part of the LGCETE (law regulation, government supervision, corporate responsibility, emergency management, technical improvement, environmental protection.
Dou. Z. et al. [
4] suggested that evacuating workers from workplaces near the accident site is important for responses to a chemical accident that occurred in an area where facilities using chemical substances are concentrated. They presented a method to effectively select emergency evacuation routes by identifying factors that adversely affect workers’ emergency evacuation and also by combining an artificial neural network model and computational fluid dynamics simulations. Xe. K. et al. [
5] proposed a multi-index emergency risk assessment method that considers individuals’ health and emergency evacuation speeds, because emergency response behaviors and scenarios should be established when selecting emergency evacuation routes. Chen P. et al. [
6] studied a similar topic and regarded that emergency evacuation routes should be optimized due to the characteristics of the Chemical Industrial Park. This study, which began from the limitations of the existing one-way emergency evacuation route calculation, suggested that the efficiency of emergency evacuation can be enhanced through simulations of dynamic interactions between the road network and emergency rescue and emergency evacuation locations. Studies to select the evacuation areas effectively by estimating not only emergency evacuation routes but also accident impact ranges were conducted by Mizuta et al. [
7], Hoscan. O and Getinyokus. S. [
8].
Other than the above approaches, there have been many researchers who have studied the application of artificial neural networks in different fields of engineering, such as in the civil engineering of bridges, roofs, pavements, and water management. Yang et al. [
9] reviewed all the ANN works for civil engineering and mentioned that this research area is currently highly motivated.
Phark C. et al. [
10] presented a system that can effectively predict the issuance of emergency evacuation orders. The foregoing study’s main methodology applied machine learning algorithms using data from chemical accidents that have occurred, and it is said that this methodology can be effectively used in emergency response decision making for chemical accidents that are expected to become more complex thereafter. However, since emergency evacuation orders were predicted in this study, this study has a shortcoming that wrong decisions made previously may be learned, as well as the limitation that decision making is not possible for accidents in which the situations are not sufficiently written in the database.
The present study was conducted to construct a machine learning decision making model to determine the necessity of issuing an emergency evacuation order by solving these limitations.
Machine learning is one of the big data processing techniques and is a method used to optimize the decision boundary that conforms to the purpose of analysis [
11]. Therefore, to implement a model using machine learning, the big data to be analyzed and an algorithm to determine the decision boundary, as well as an indicator to judge the applicability of the model, is necessary. The respective contents of the foregoing will be described in detail in the methodology chapter.
In the present study, the machine learning model was implemented using Python software with Keras, which is a deep learning API (Application Programming Interface) running on top of the machine learning platform Tensorflow. For the data, the NTSIP (National Toxic Substance Incidents Program) and HSEES (Hazardous Substances Emergency Events Surveillance database) of ATSDR (Agency for Toxic Substances and Disease Registry) in the United States were used as data for the learning of the machine learning model and the verification of the accuracy.
2. Methodology
2.1. Database
The databases used in the present study were the HSEES and NTSIP of ATSDR. Chemical accidents that occurred from 1996 to 2009 are recorded in the HSEES, and as the HSEES was revised into the NTSIP in 2010, chemical accidents that occurred from 2010 to 2014 are recorded in the NTSIP. The two databases have almost similar structures, and a total of 115,569 chemical accidents are recorded in the databases. Each chemical accident is described using over 100 qualitative/quantitative attributes.
Table 1 is a summary of the list of attributes used in the HSEES/NTSIP databases and their descriptions.
The attributes can be grouped into four categories to conform to the purpose of the study. Information category (a) is information related to the chemical accident situations, information category (b) is information on the results of decision making, information category (c) is information on leaked chemicals, and information category (d) is information related to victims of chemical accidents.
Among the data in category (a), the addresses of places where chemical accidents occurred, and data related to the reporters, were excluded from the learning data. The NAICS codes were excluded from the learning data because the code assignment method was changed during the data collection period, and the NAICS code descriptions were used instead. Items related to the causes of occurrence of chemical accidents were also excluded from the learning data because those items were identified through investigation in some cases. Categories (b) and (d) were used to identify the necessity of issuing an emergency evacuation order, but direct information on them was excluded from the learning data. Among data in category (c), the types, names, and accident patterns of the leaked chemicals were included in the learning data because it was judged that it would be easy to identify them at the early stage of the chemical accidents, but the amounts of the leaked chemicals were not included.
Table 2 rearranged the attributes used to make the machine learning decision making model learn chemical accident situations.
2.2. Judgement of the Necessity of Emergency Evacuation Orders
Machine learning methodologies are largely divided into supervised learning, unsupervised learning, and reinforcement learning [
12]. Supervised learning is an algorithm used to learn and solve problems for which the correct answers that must be given by the model and the labels have been determined [
13]. On the other hand, unsupervised learning is used to solve the problem of clustering unlabeled data according to the characteristics of the data. Since the present study aims to judge the necessity of an emergency evacuation order when a certain chemical accident situation has been given, supervised learning was carried out in the present study. As examined in the database earlier, the results of issuance of an emergency evacuation order can be identified in the database, but the necessity of the foregoing cannot be identified. That is, the labels necessary for analysis had to be determined and newly assigned to the database through the following procedure.
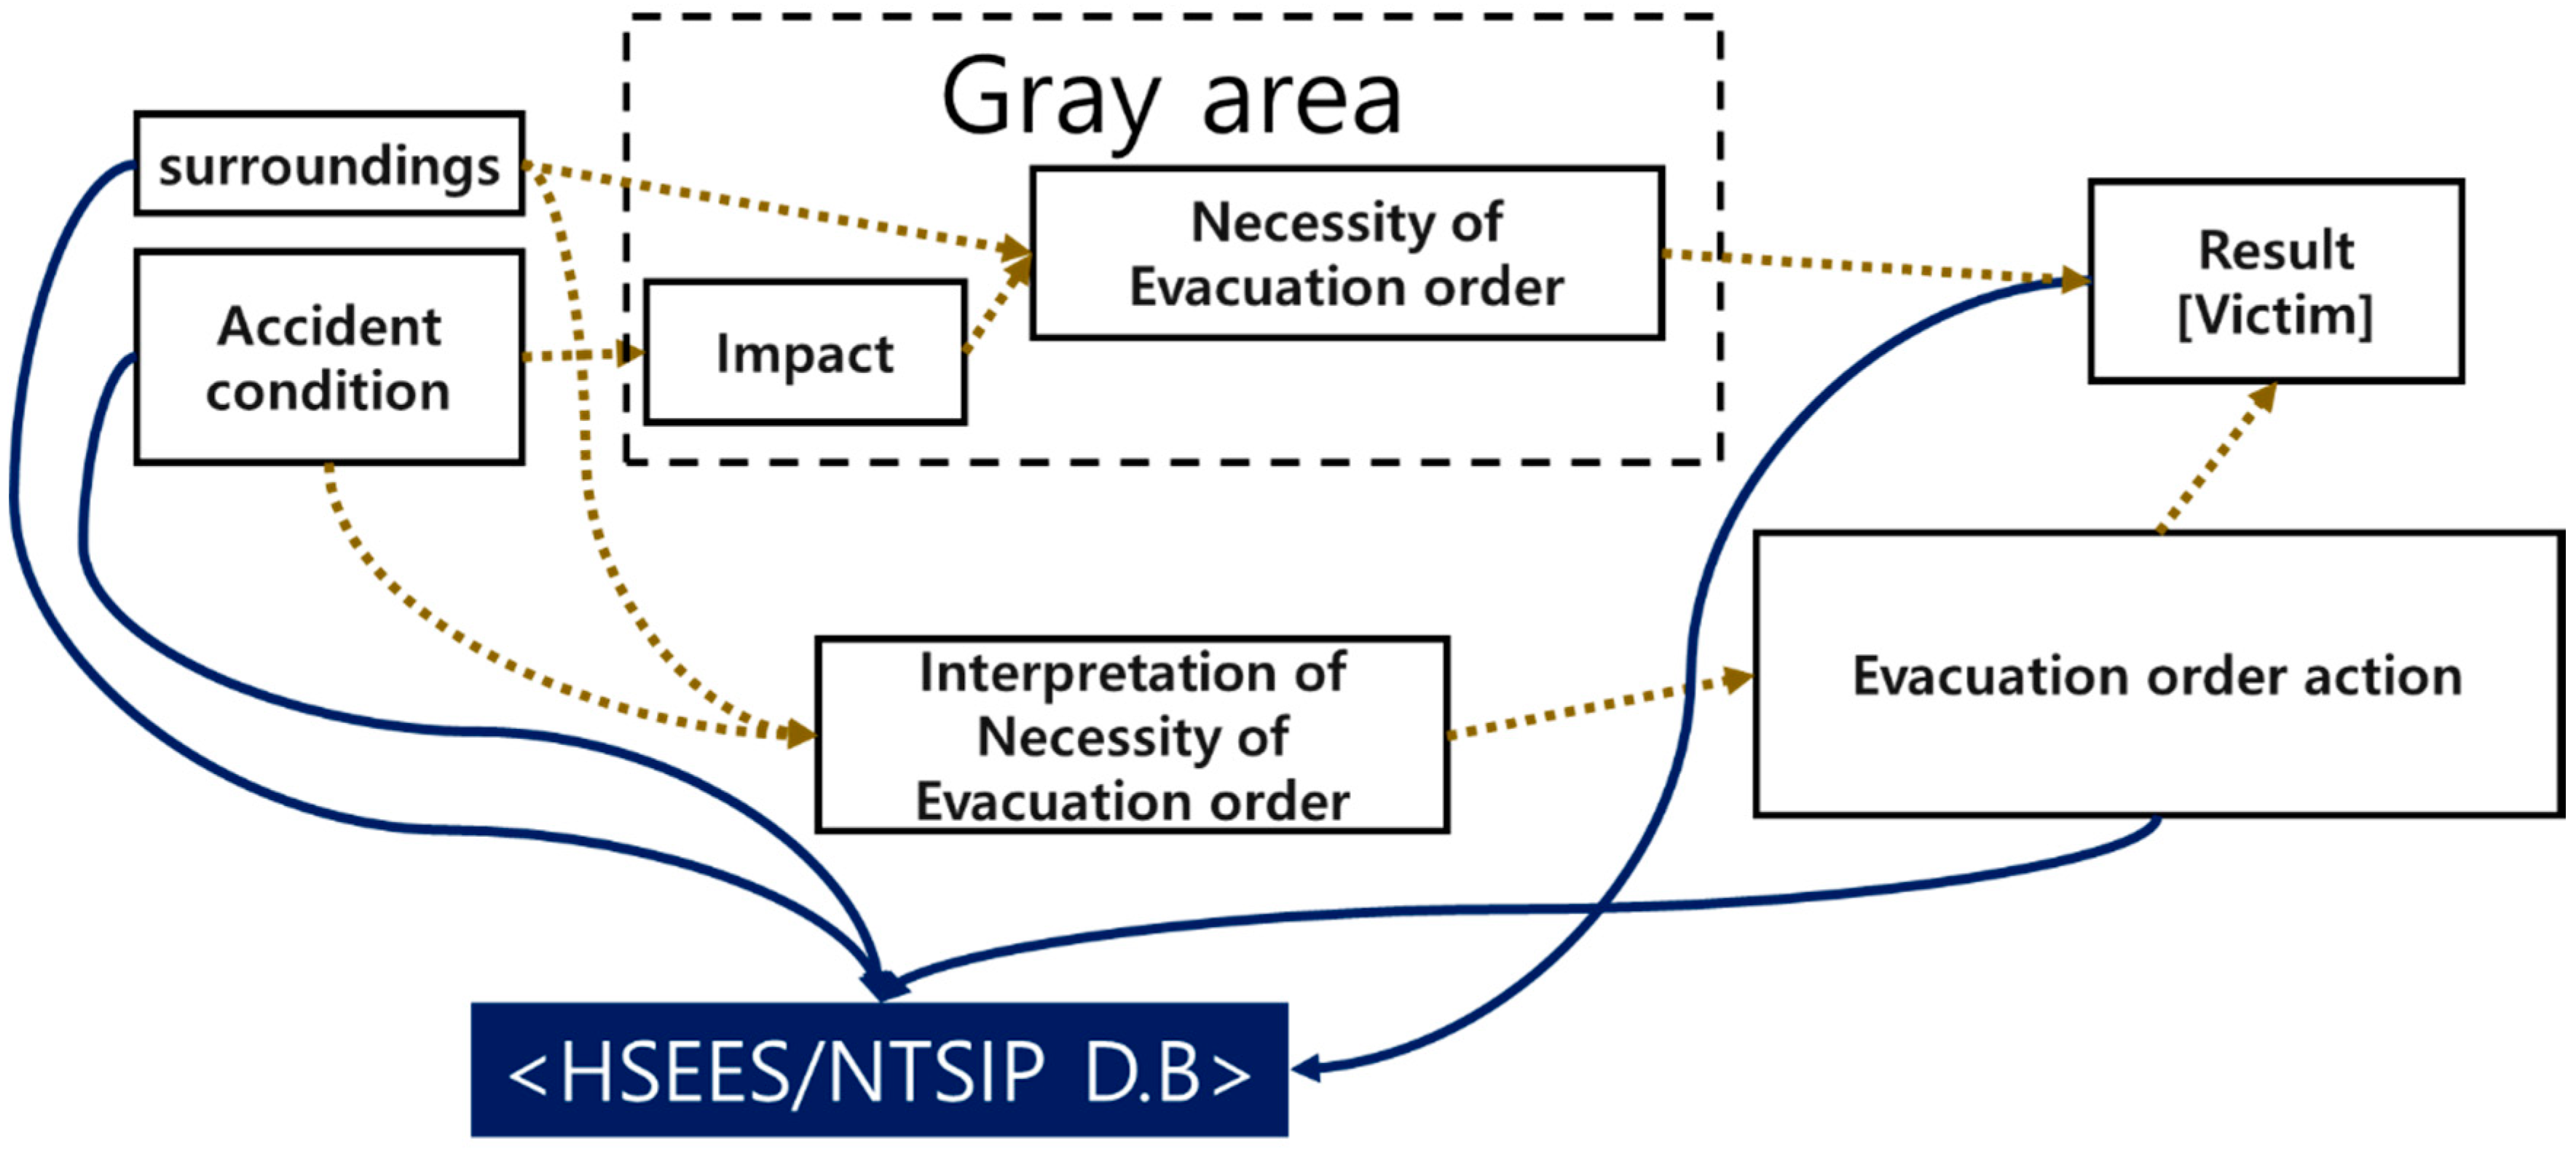
Figure 2 shows the schematization of the development of a chemical accident, the victims, and the information in the database. The condition of the chemical accident causes impacts. The actual necessity of the issuance of an emergency evacuation order is determined according to the correlation between the impact of the chemical accident and the situation in the vicinity of the accident. Separately from the foregoing issue, the decision maker for the chemical accident analyzes the situation of the chemical accident to interpret the necessity of the issuance of an emergency evacuation order and perform accident response actions. The number of victims would be determined from the correlation between the impact of the chemical accident and the decision making for emergency order. The impact of the chemical accident can be accurately known after the chemical accident has ended, and so can the actual necessity of an emergency evacuation order. Since the actual necessity of the issuance of an emergency evacuation order, which should be a label in the database, is in the gray area, the label was determined using information on the surroundings, accident condition, evacuation order action, and victims in HSEES/NTSIP.
Table 3 is an action—victim matrix, which summarized the correlation between the impact of the chemical accident and the decision making process. Here, the victims were limited to the total victims in the database less the workplace workers.
If any victim occurs in the aftermath of the chemical accident, the necessity of an emergency evacuation order arises regardless of the outcome of the decision making regarding the emergency evacuation order (areas (3) and (4) of
Table 3). In the case of an accident in which no victim has occurred and an emergency evacuation order has not been issued either, no emergency evacuation order will be necessary thereafter too ((2) of
Table 3). When an emergency evacuation order has been issued and there is no victim ((1) in
Table 3), it was judged conservatively that the necessity of an emergency evacuation order had occurred. However, when no one has evacuated due to the emergency evacuation order, it was deemed that there was no need of an emergency evacuation order. The necessity of an emergency evacuation order for data from 1997 to 2013 was judged with AVM and according to the result, 98,984 cases of chemical accidents did not require the issuance of an emergency evacuation order, and 11,099 cases of chemical accidents required the issuance of an emergency evacuation order. Since the number of chemical accidents that do not require the issuance of an emergency evacuation order is about 8.9 times larger, it can be seen that the database used for learning is imbalanced.
2.3. Machine Learning Algorithm
A layer in machine learning is the highest-level building block in deep learning which can perform the role of a container that receives weighted input and transforms it with a set of mostly non-linear functions and then passes that to the next layer. Fully-connected layers, which are shown in
Figure 3, are used for data classification and have a limitation in that they cannot maintain the correlations according to the order of the input data.
Therefore, in this study, one-dimensional convolutional neural networks were applied to the front end of fully connected layers to propose an algorithm that can better learn the characteristics of chemical accidents.
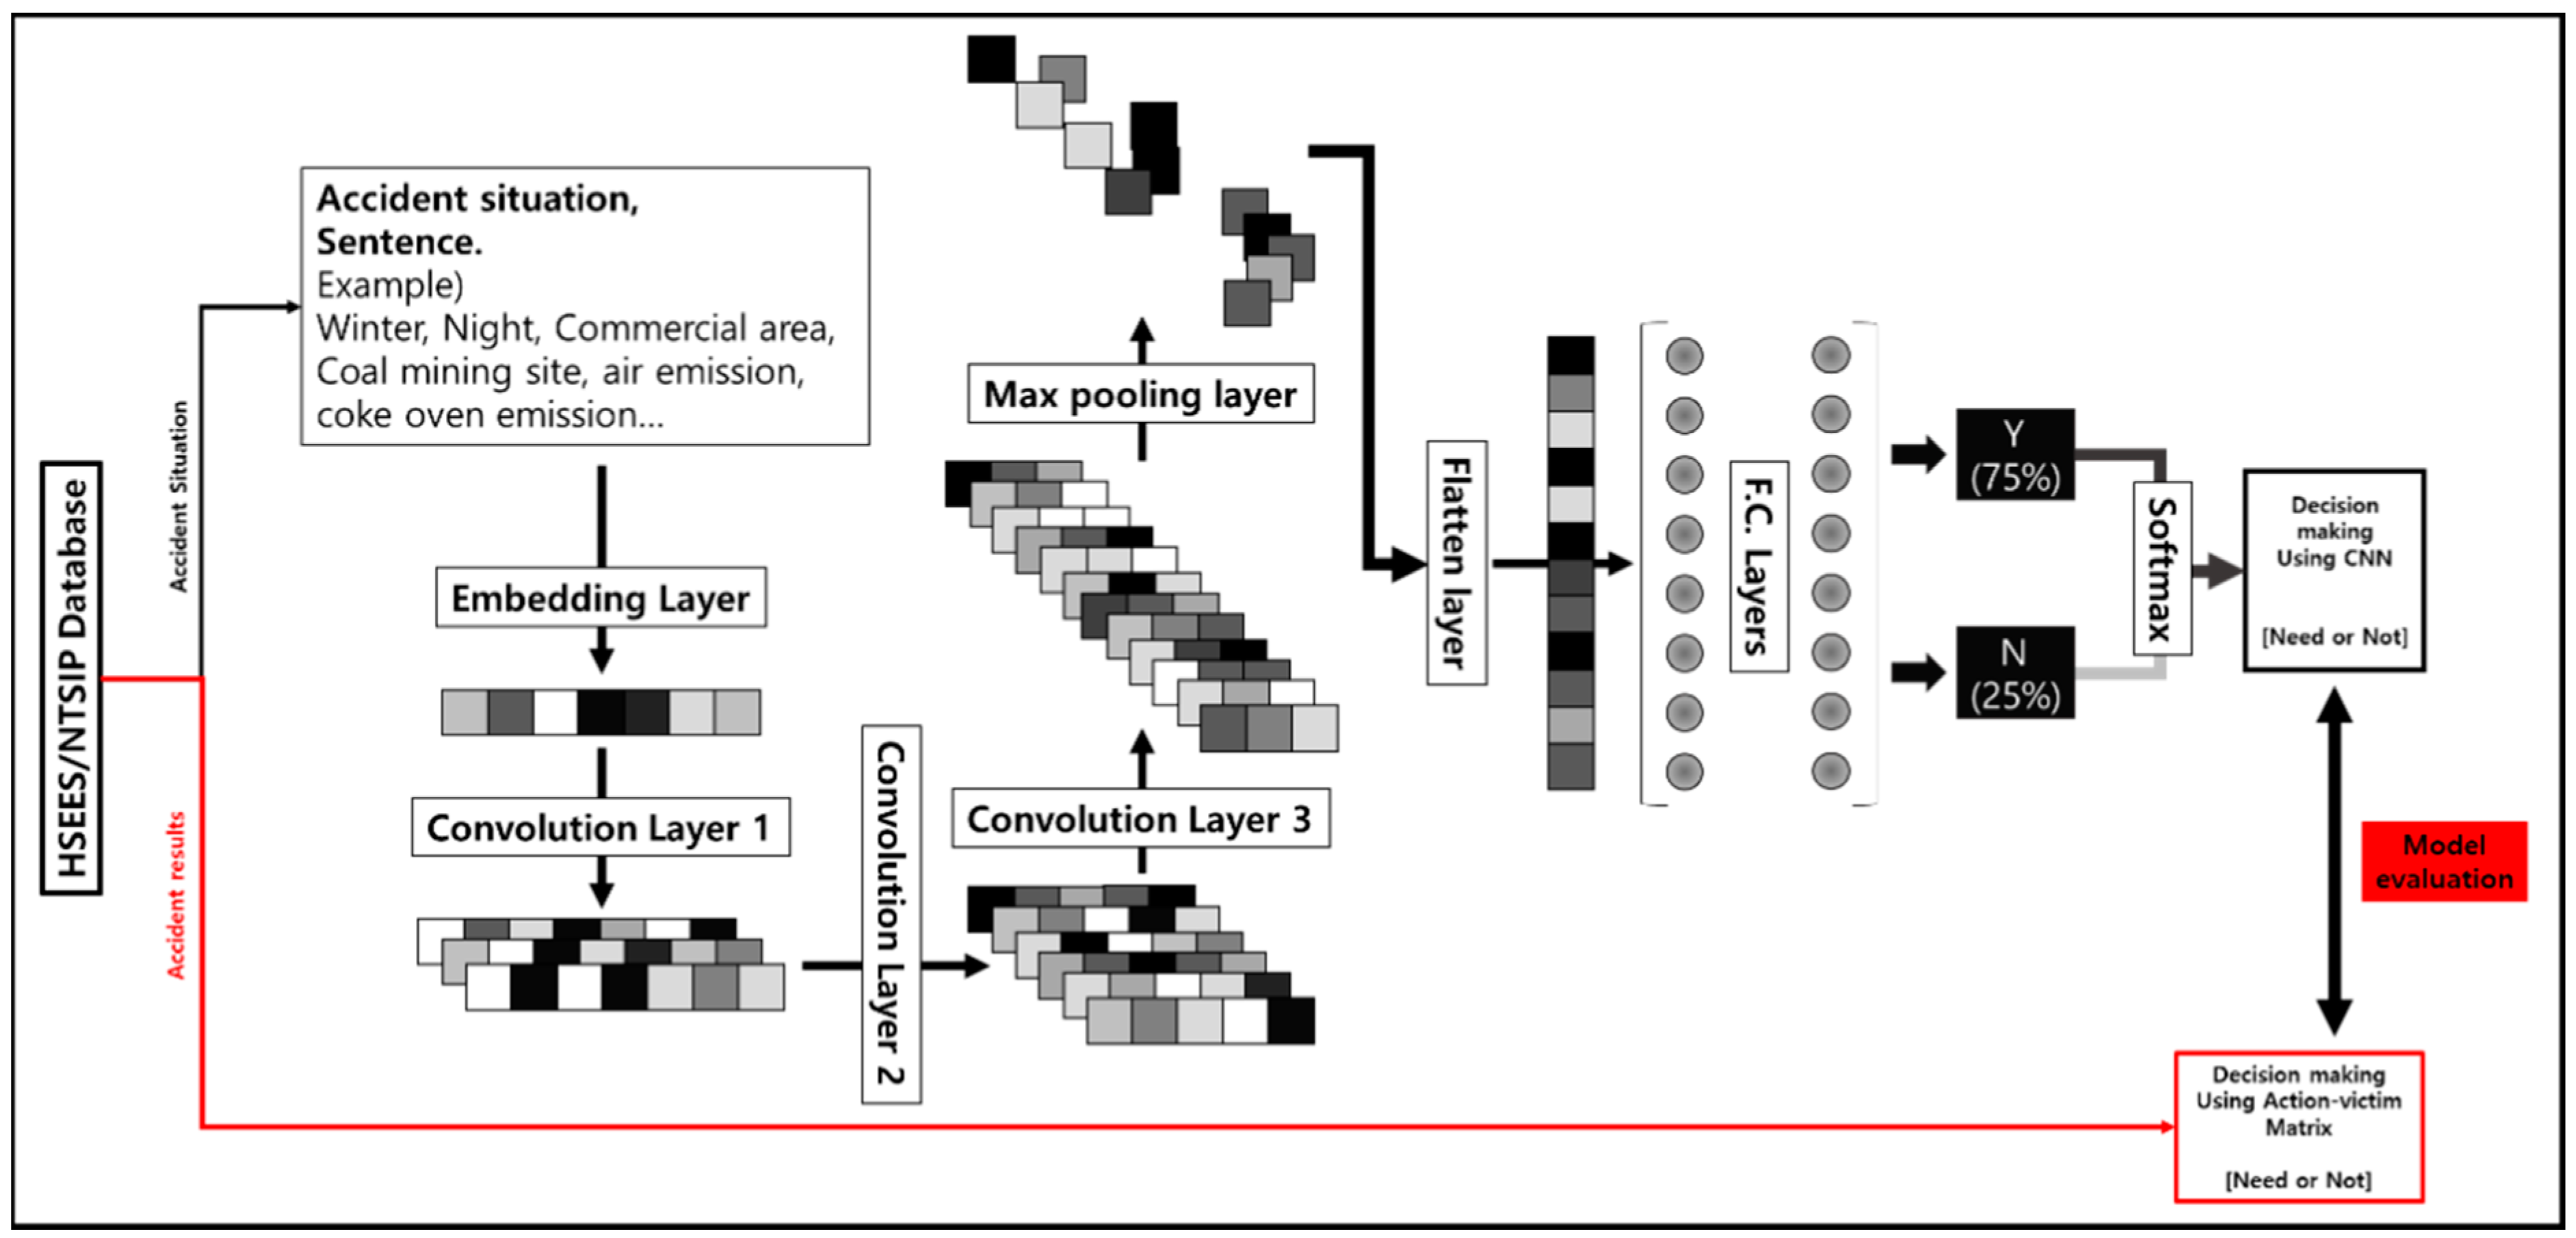
The input values of the model designed in this study were largely composed of an embedding layer, three 1-d convolutional neural network layers (1d-cnn), and two fully connected layers. The data in HSEES/NTSIP that were provided to the machine learning model through the embedding layer are used to determine whether an emergency evacuation order is necessary or not while going through the aforementioned layers sequentially. A batch normalization layer, a pooling layer, a flatten layer, and a dropout layer are inserted between each two layers.
Figure 3 is a schematic diagram of the flow of data, the overall structure of the model, and the identification of model reliability.
2.4. Preprocessing: Embedding
In the embedding layer, chemical accident information in the form of texts is vectorized through preprocessing of the input data. The rearranged attributes in
Table 2 are to be added to initiate the calculation. Most of the data in the database used in the present study are recorded in letters with certain meanings, not numbers. On looking at the data closely, it can be seen that attributes that can be classified into categories, such as seasonal information or chemical equipment types, are recorded in coded texts, and attributes that cannot be easily classified into categories, such as chemical names and North American Industry Classification System (NAICS) code descriptions, are recorded in the form of texts. The chemical names are recorded in mixture of substances that can be clearly distinguished, such as benzene and substances that cannot be specified such as “corrosive liquid acidic organic nos”. The text vectorization was performed using the tokenizer supported by tensorflow to process text—type data by machine learning.
As methods of expressing words as vectors, sparse representation and dense representation techniques are mainly used. When words are vectorized using sparse representation, one word is assigned to each position of the vector, and one is assigned to only the word used, and zero is assigned to the rest of the words. For example, if the number of words used is five and benzene is assigned to the third position of the vector, the vector is represented as follows.
Contrary to the sparse representation, the dense representation selects a certain value for a vector length and converts words into vectors so that the words have values other than zero and one. In the present study, the embedding layer supported by tensorflow was used. In this layer, the initial embedding layer is randomly initialized, and in the process of learning, it is converted into a vector with a meaning through the arrangement of words in the learning data. For example, a workplace that has benzene can be represented as follows.
The characteristic of the chemical accident vectorized as such is a sort of one-dimensional image and is used as an input value of the 1-d convolutional neural network layer.
2.5. Decision Making Model using CNN
The chemical accident information vectorized through the embedding layer goes through the feature extraction process in 1-d cnn layers. 1-d cnn layers are largely composed of convolution layers and pooling layers.
When taking all the considerations together, we made the Python code of 300 lines of which part is shown in
Table 4. The convolution layers play the role of searching for images using a certain filter and extracting the features of the images to form a feature map. In addition, the filter used to form the feature map is modified to best extract features during the learning process, and the number of dimensions increases as much as the number of filters that searched for data. This algorithm can be expressed in pseudo code as follows.
The pooling layer is mainly placed after the convolution layer, and through the foregoing, an operation to reduce the size of the feature map by down sampling it is performed. Unlike the convolution layer, the number of dimensions does not change, and a certain feature is emphasized by extracting the statistical representativeness of the feature map.
During training, internal covariate shifts in which the distribution of neural network activation changes occurs sometimes due to changes in neural network parameters. Since an internal covariate shift generates a saturated regime to cause gradient loss, internal covariate shifts were prevented through batch normalization.
As the input data goes through the convolution layer, the size of the data decreases, but the dimension increases as much as the number of filters. In order to carry out final decision making using the fully connected layer, a flatten layer was placed at the rear end of the 1-d CNN layer to reduce the high-dimensional vector into a one-dimensional vector.
The vectorized chemical accident situation that has undergone feature extraction through the convolution layer and the pooling layer makes a final judgment while going through the fully connected layers (FC). An FC is a neural network in which all the perceptrons of individual layers are connected to the perceptrons of adjacent layers. The value obtained by multiplying the input value of the layer by the synaptic weight and adding the bias is input into the activation function, and when the value is above the threshold, a signal is sent to the layer at the rear. If the features of chemical accident data were extracted in the convolution layer, the FC plays a role in classifying the data based on the extracted features. In this process, a situation where the learning data is completely classified, but the test data cannot be classified at all, occurs and this situation is called overfitting. In the present study, to prevent the foregoing, dropout, which deactivates the perceptrons that generate noises, was applied to the classification of FC [
15].
2.6. Accuracy Index
The yearly decision making results of the model can be organized into a confusion matrix. The confusion matrix is a matrix that separately indicates prediction results and actual values as positive and negative values. Sensitivity, specificity, and precision can be calculated using the confusion matrix. Sensitivity is also called recall and means the ratio of samples predicted to be positive by the model to the samples that are actually positive. Contrary to sensitivity, specificity means the ratio of samples predicted to be negative by the model to the samples that are negative. Precision means the ratio of samples that are actually positive to the samples predicted to be positive by the model.
Table 5 is an example of a confusion matrix, and Equations (1)–(3) are formulas for calculating sensitivity, specificity, and precision.
As described above, simple percentile accuracy cannot verify the reliability of the model because the database used for learning is imbalanced. This is because even if it is judged that no emergency evacuation order is necessary in all situations, an accuracy of about 89% can be secured under this condition. Therefore, in the present study, the reliability of the model was verified using balanced accuracy, skew-normalized f1 score, and AUROC (Area under a Receiver Operator characteristic Curve). AUROC shows a value between 0.5 and 1. In general, the model can be regarded to be an acceptable classifier if the AUROC value is 0.7 to 0.8, an excellent classifier if the value is 0.8 to 0.9, and an outstanding classifier if the value is 0.9 or higher. An ROC curve is a graph created using sensitivity and false positive rates and is a graph that shows the performance at all pf the classification thresholds of the model. AUROC, which means the area below the ROC curve, was used to verify the accuracy of the decision making model derived through the present study. Balanced accuracy means the average value of sensitivity and specificity. The skew-normalized f1 score is the F1 score, which is the harmonic average of precision and sensitivity, corrected using the imbalanced degree of data. The following formula was used to calculate the skew-normalized f1 score [
16].
3. Model Setting
3.1. Database
Supervised learning is generally performed by randomly dividing data into a training set, a validation set, and a test set. The training set is used for decision boundary determination, and the validation set is used for model performance evaluation and model tuning. The machine learning model optimized using the validation set evaluates the ‘final performance’ using the test set. The biggest difference between the validation set and the test set is that the validation set is data involved in training because it is used for model tuning, but the test set is unseen data and is used only to evaluate the accuracy of the model.
It is self-evident that the chemical accidents that occurred in 1997 occurred later than the chemical accidents that occurred in 1996. Therefore, time-series feeding of data is necessary to establish and verify a chemical accident emergency response decision making model. In the present study, training, and validation were performed using data up to year n−1 to construct a decision making model, and the reliability of the model was verified using data in year n. In addition, since the criteria for chemical accidents recorded in the database changed in 2010, the changed criteria were reflected on the CNN model learning data.
3.2. Learning Algorithm
As chemical accident data are accumulated, the bag of words, which means the number of words used in database records, becomes larger. As the number of words in the bags of words increases, the size of the embedding dimension must also increase accordingly. In the present study, an embedding dimension of 1/200 times the size of the bag of words in the training dataset was applied.
To check the effect of the application of the 1d-cnn structure on the accuracy of classification of vectorized data, the following two types of neural networks were constructed, and the degrees of accuracy were compared.
Model #1: After the embedding layer, the fully connected layer is applied through 1-cnn.
Model #2: The fully connected layer is applied immediately after the embedding layer.
The 1d-cnn applied to Model 1 was set as follows: a total of three 1d-cnn layers were placed behind the embedding layer. Relu was used as the activation function of all 1d-cnn layers, stride was set to 1, and padding was set to same. A batch normalization layer and a dropout layer (rate: 0.5) were placed behind the first and second 1d-cnn layers, and a batch normalization layer and a max pooling layer were placed behind the third 1d-cnn layer. The reason for using max pooling among the pooling techniques is that, since only the largest value is extracted from a specific area, unnecessary noise can be ignored by analyzing mainly the strong parameters in the data (that is, the characteristics of the data that stand out). This will allow you to better characterize the data. The first, second, and third 1d-cnn layers were applied with 3, 5, and 7 filters, respectively, in order of precedence, and kernel sizes of 5, 3, and 2, respectively, in order of precedence. After the 1d-cnn layers, a flatten layer was applied to adjust the dimension of the data.
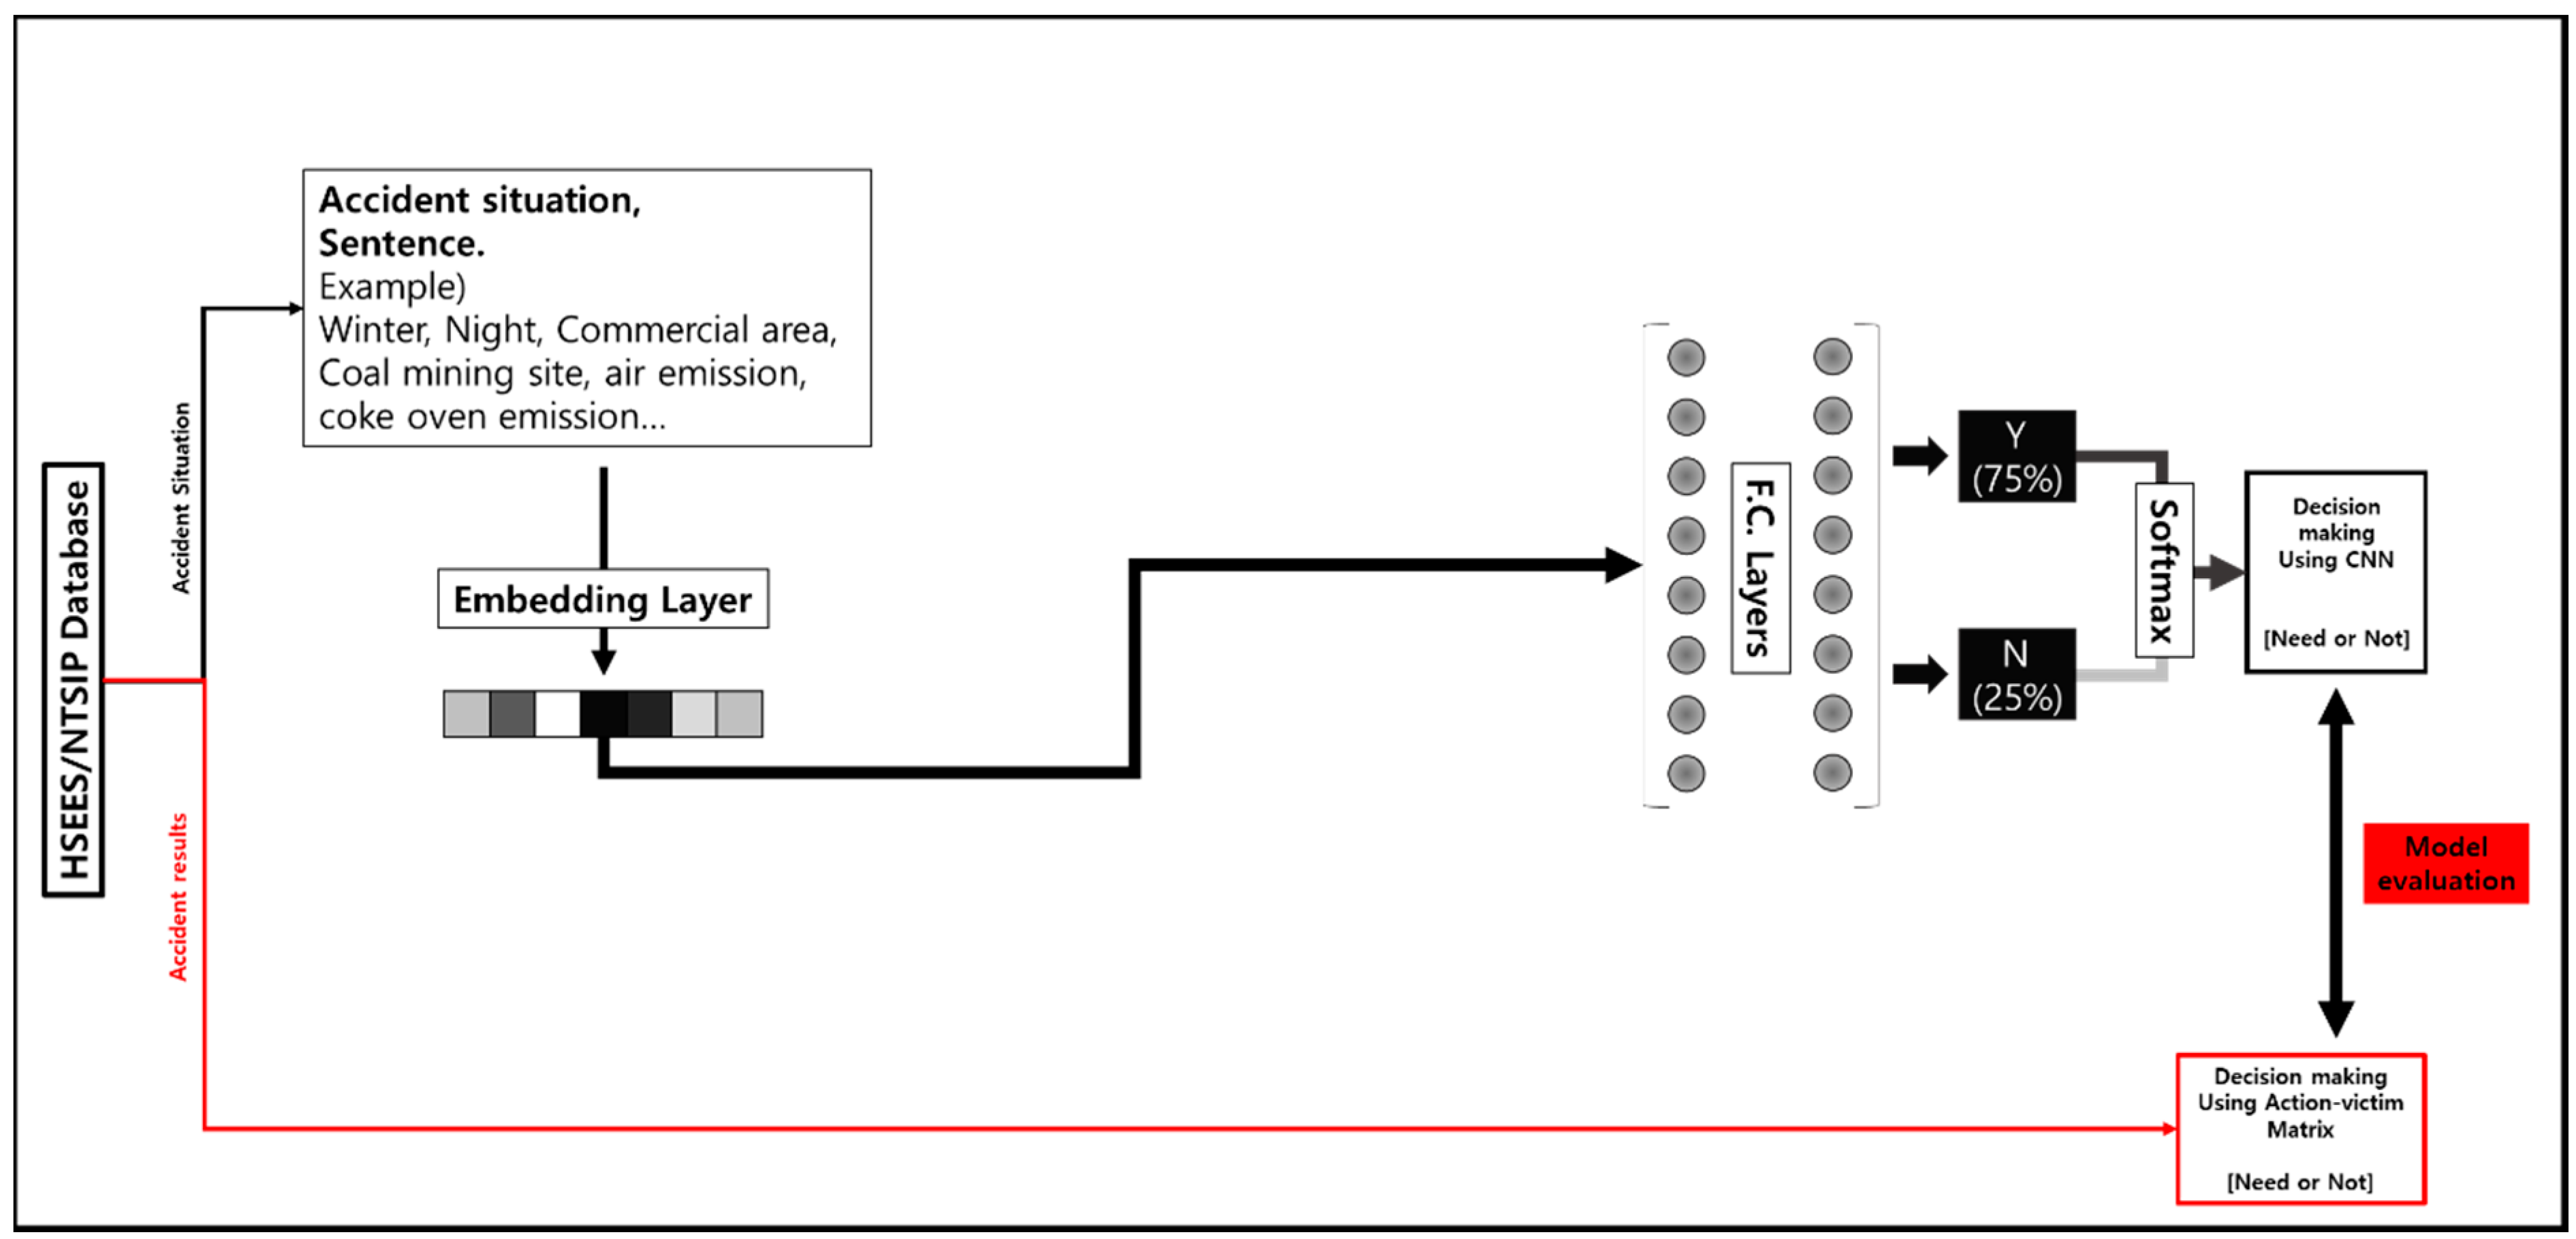
After the 1d-cnn structure, 100 perceptrons with the Relu function as the activation function were set in each of the two fully connected layers, and batch normalization and dropout layers (rate: 0.5) were inserted. Finally, softmax was arranged to output the final result of the decision making model in a binary format. To check the suitability of the 1-d CNN model, the decision making model through model 2 in which the fully connected layer is placed immediately after the embedding layer, has the following structure.
Figure 4 shows the structure of decision making model using FC. ADAM was used as the optimizer to search the decision boundary of the model, and since the training data is imbalanced data, the application of the cross entropy applied with weight was considered when calculating the loss. The weight was calculated as follows using the ratio of those accidents that require the issuance of an evacuation order to those accidents that do not require the issuance of an evacuation order.
4. Results and Discussions
4.1. Database Analysis
Table 6 shows the characteristic of test sample such as years and number of chemical accidents learnt. The average skew value until 2009 was 9.95, and the average skew value from 2010 to 2014 was 5.72. This difference is considered attributable to the fact that chemical accident data, which did not require the issuance of an emergency evacuation order, were not recorded due to the change in database collection standards as of 2010.
On reviewing BoW (Bag of Words), it can be seen that the number of BoWs over the first four years was 1614. On the other hand, there are 3379 words in the data collected for four years after the data collection standard was changed in 2010. Also, the BoW size increase rate during the first four years is much steeper after 2010. This seems to be attributable to the fact that the vocabulary used to describe chemical accident situations has increased as the chemical accident situations becomes more and more complex.
4.2. Time Spent for Decision making through Neural Network Models
For both Model CNN) to which 1-cnn was applied and Model FC) to which the fully connected layer was applied immediately after the embedding layer, models in which weights were reflected when the loss was calculated and models in which weights were reflected when the loss was calculated were constructed, respectively, to evaluate the accuracy of a total of four models. Whether or not the weights are reflected when the loss is calculated does not affect the overall structure of the model, and the following is a summary of the foregoing.
(CNN_W) 1d-cnn was applied, weights were reflected when the loss was calculated
(CNN_WO) 1d-cnn was applied, weights were not reflected when the loss was calculated
(FC_W) 1d-cnn was not applied, weights were reflected when the loss was calculated
(FC_WO) 1d-cnn was not applied, weights were not reflected when the loss was calculated
The PC used to drive the models is an Intel core i7-5930, NVIDIA GeForce GTX970, and the hardware memory is 64 GB. The average/maximum/minimum/total time required for decision making in each test data year are as follows.
CNN_W: 89.34 s/17.84 s/204.28 sec/1608.16 s
CNN_WO: 97.48 s/20.86 s/237.95 s/1754.76 s
FC_W: 35.89 s/8.96 s/86.22 s/645.93 s
FC_WO: 35.66 s/8.26 s/87.09 s/641.96 s
The decision making of the 1d-cnn model took about 2.6 times the time taken by fc model. This is the sum of both the time to learn the data and the time to make a decision, but the time taken to make a decision for the entire test data was about 1 sec. If the model is to carry out re-learning every time a chemical accident occurs, up to 237 s can be taken to make a decision on one chemical accident. On the other hand, if the neural network information of the decision making model that completed learning is stored, the learning process can be skipped, so that about 1 sec will be taken to make a decision on an emergency evacuation order. The ability to make “quick decision,” which was the initial purpose of the study, seems to have been satisfied.
4.3. Model Accuracy
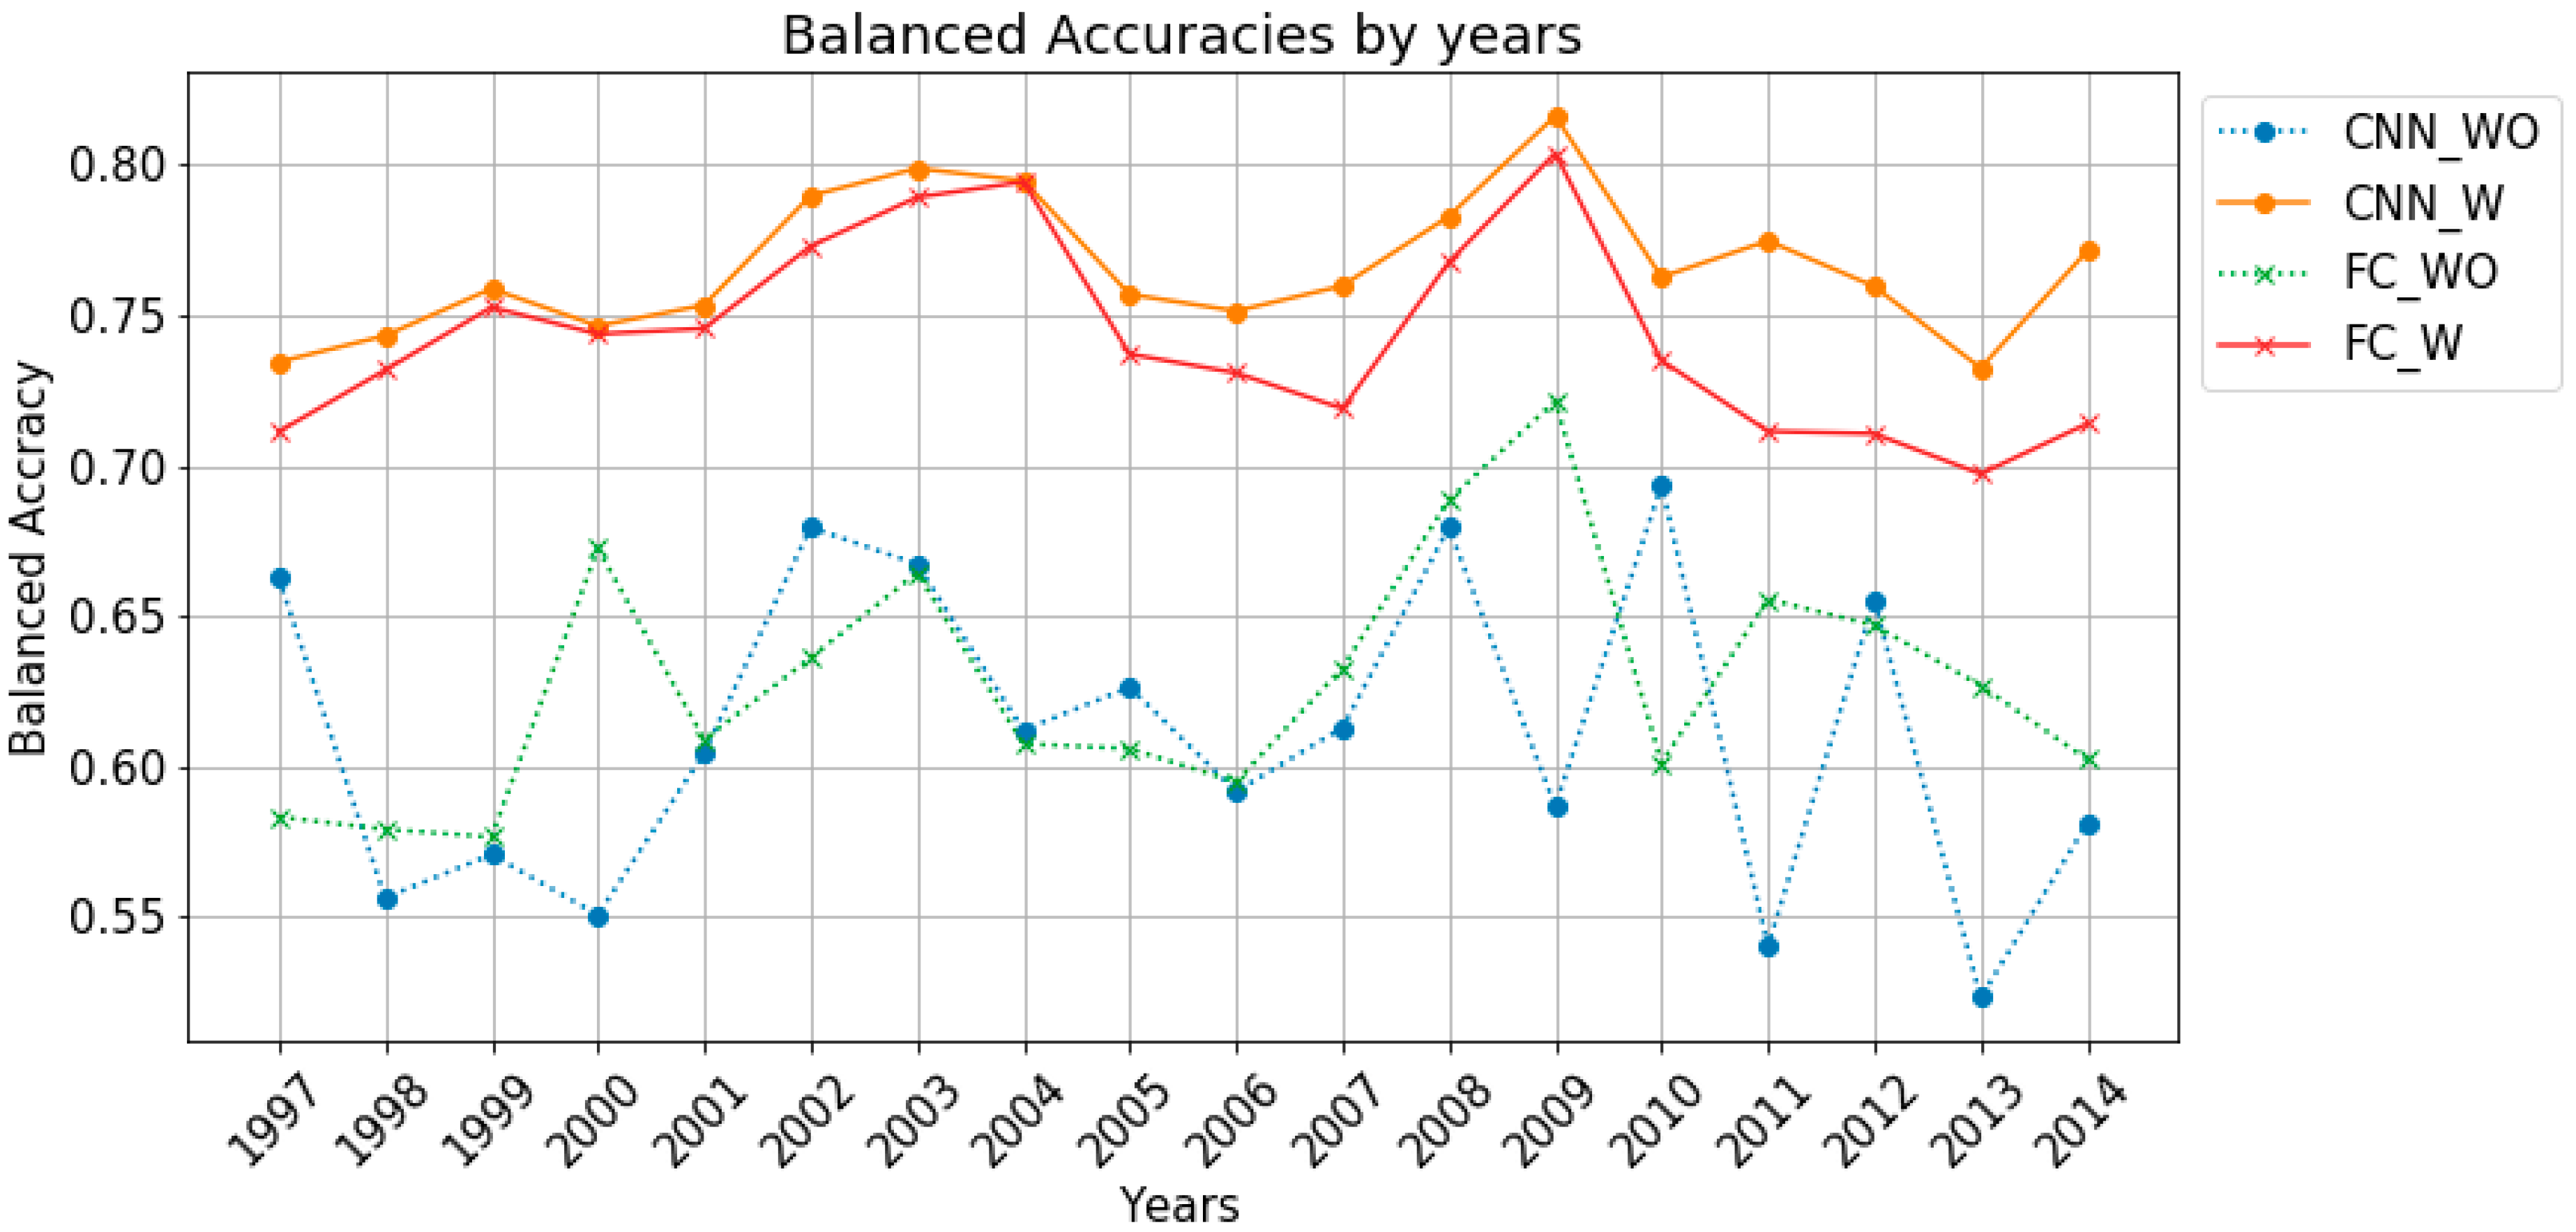
4.3.1. Balanced Accuracy
The
Figure 5 plots the degrees of balanced accuracy of the test data by year. It can be seen that when models of the same structure are used, the balanced accuracy is high in cases where weights are considered in the calculation of losses. In cases where weights are considered, the balanced accuracy of the 1d-cnn model is slightly higher than that of the fc model in all years, and the gap becomes larger after 2010 when the data collection standard was changed.
The average values of the balanced accuracy of CNN_WO, CNN_W, FC_WO, and FC_W are 0.61, 0.77, 0.63, and 0.74, respectively, in order of precedence, and the standard deviations are 0.051, 0.022, 0.039, and 0.031, respectively, in order of precedence. It can be seen that the average value of the balanced accuracy of the model considering weights is higher and the deviation is smaller.
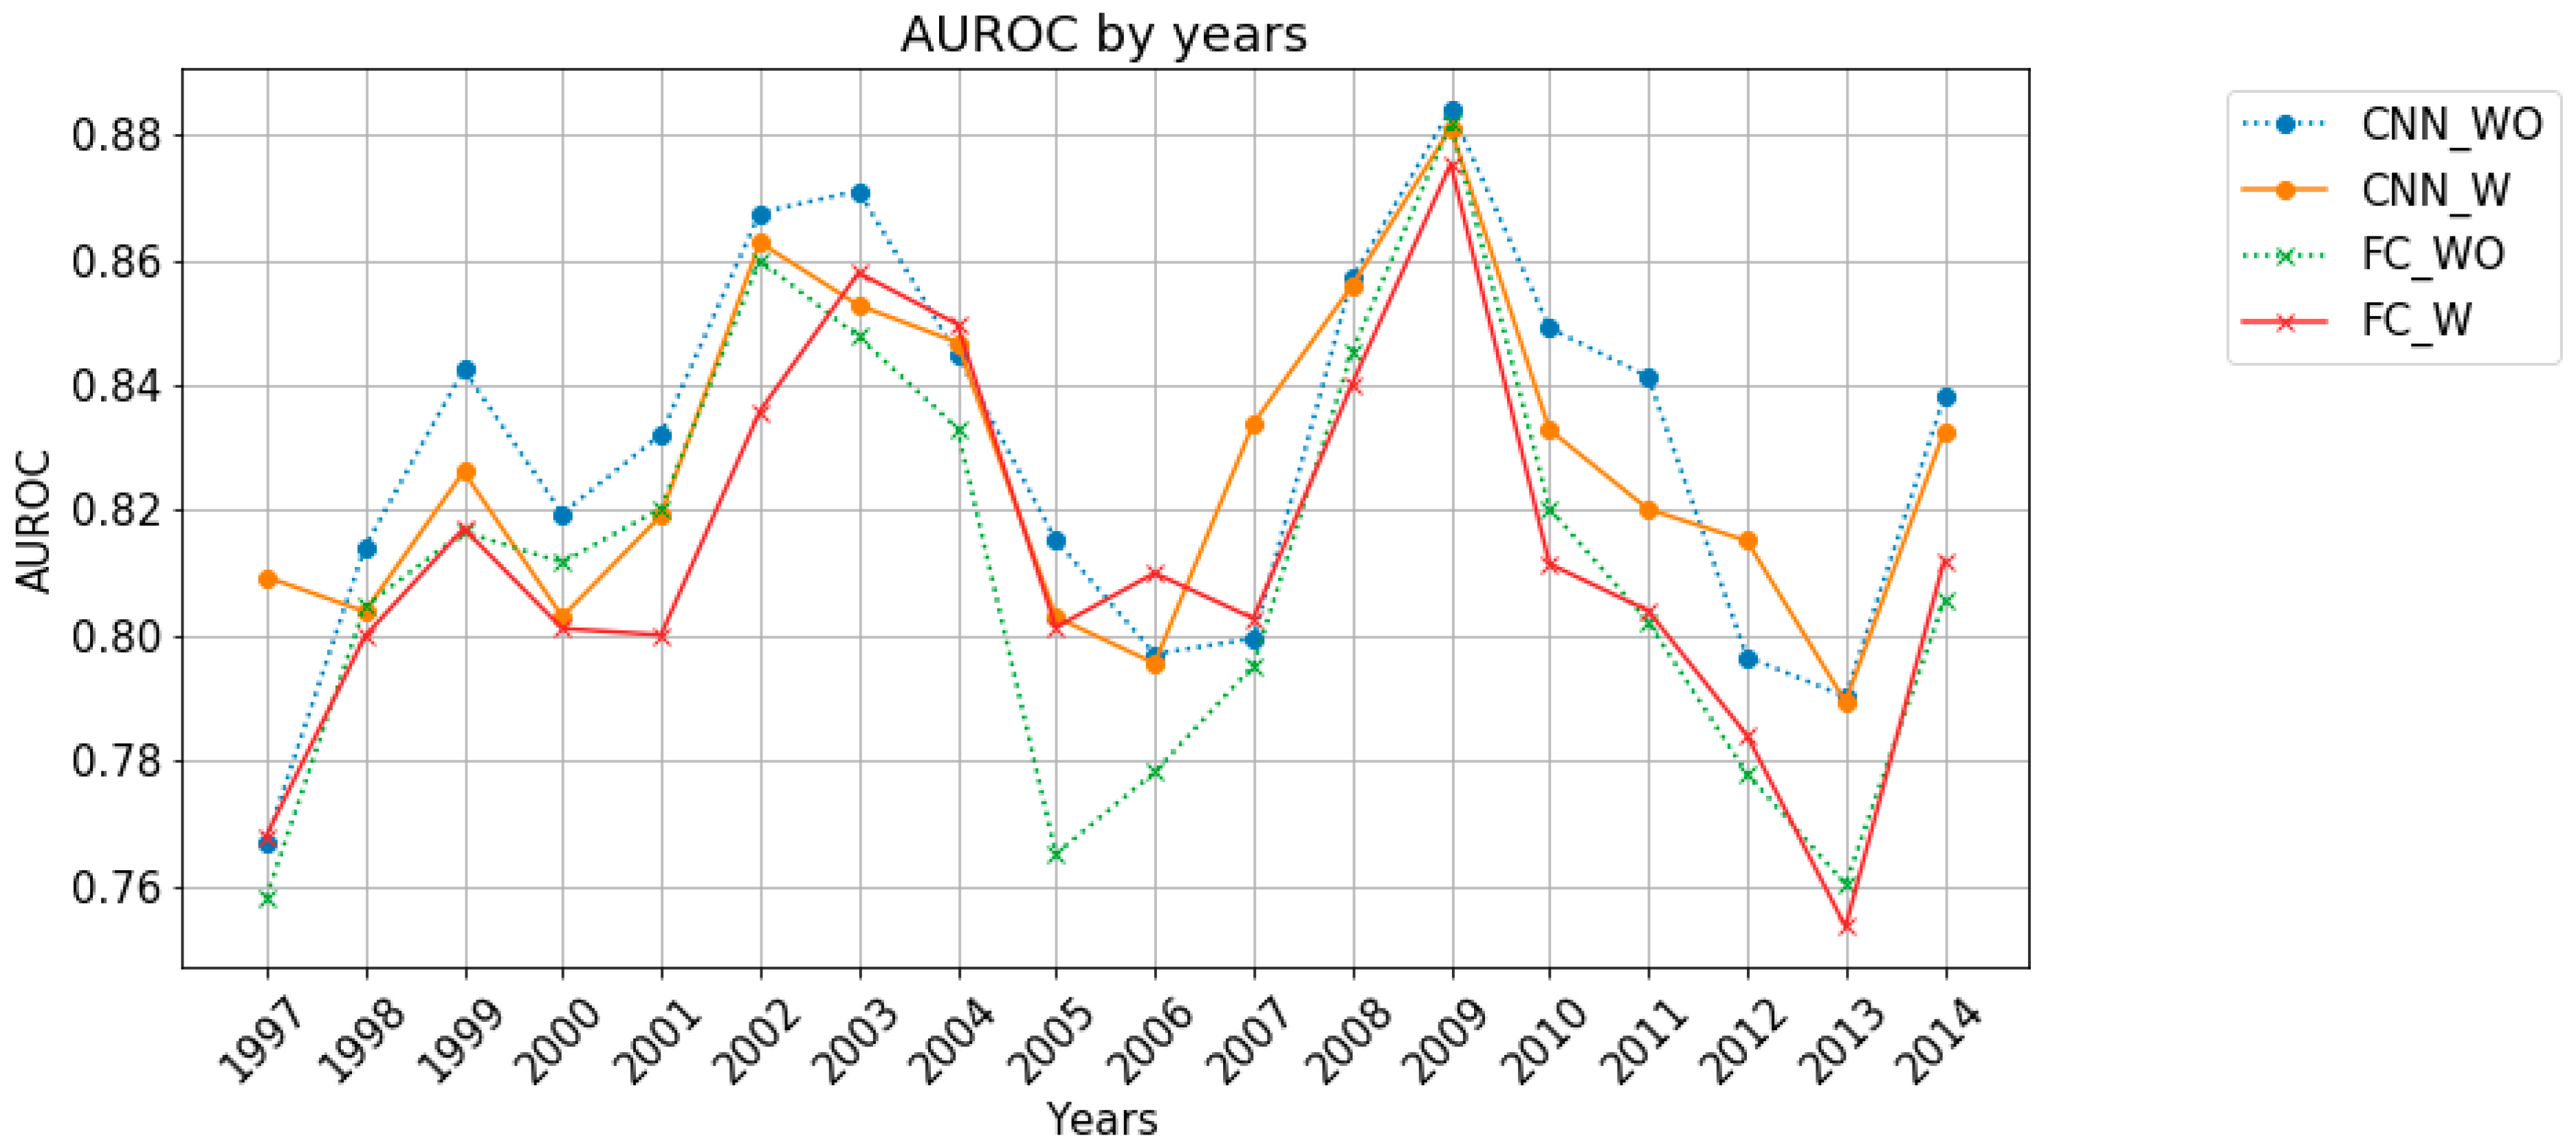
4.3.2. AUROC
Figure 6 plots the AUROCs of the test data by year. The average AUROC values of CNN_WO, CNN_W, FC_WO, and FC_W are 0.83, 0.83, 0.81, and 0.81, respectively, in order of precedence, and the standard deviations are 0.031, 0.025, 0.034, and 0.030, respectively, in order of precedence. The AUROC values of the 1d-cnn model are slightly higher than those of the FC model, but the differences are not large. However, CNN_W’s AUROC values exceed 0.8 except for 2006 and 2013, and the AUROC values for the relevant years are 0.797 and 0.789, which are close to 0.8. Therefore, CNN_W seems to be the most stable model.
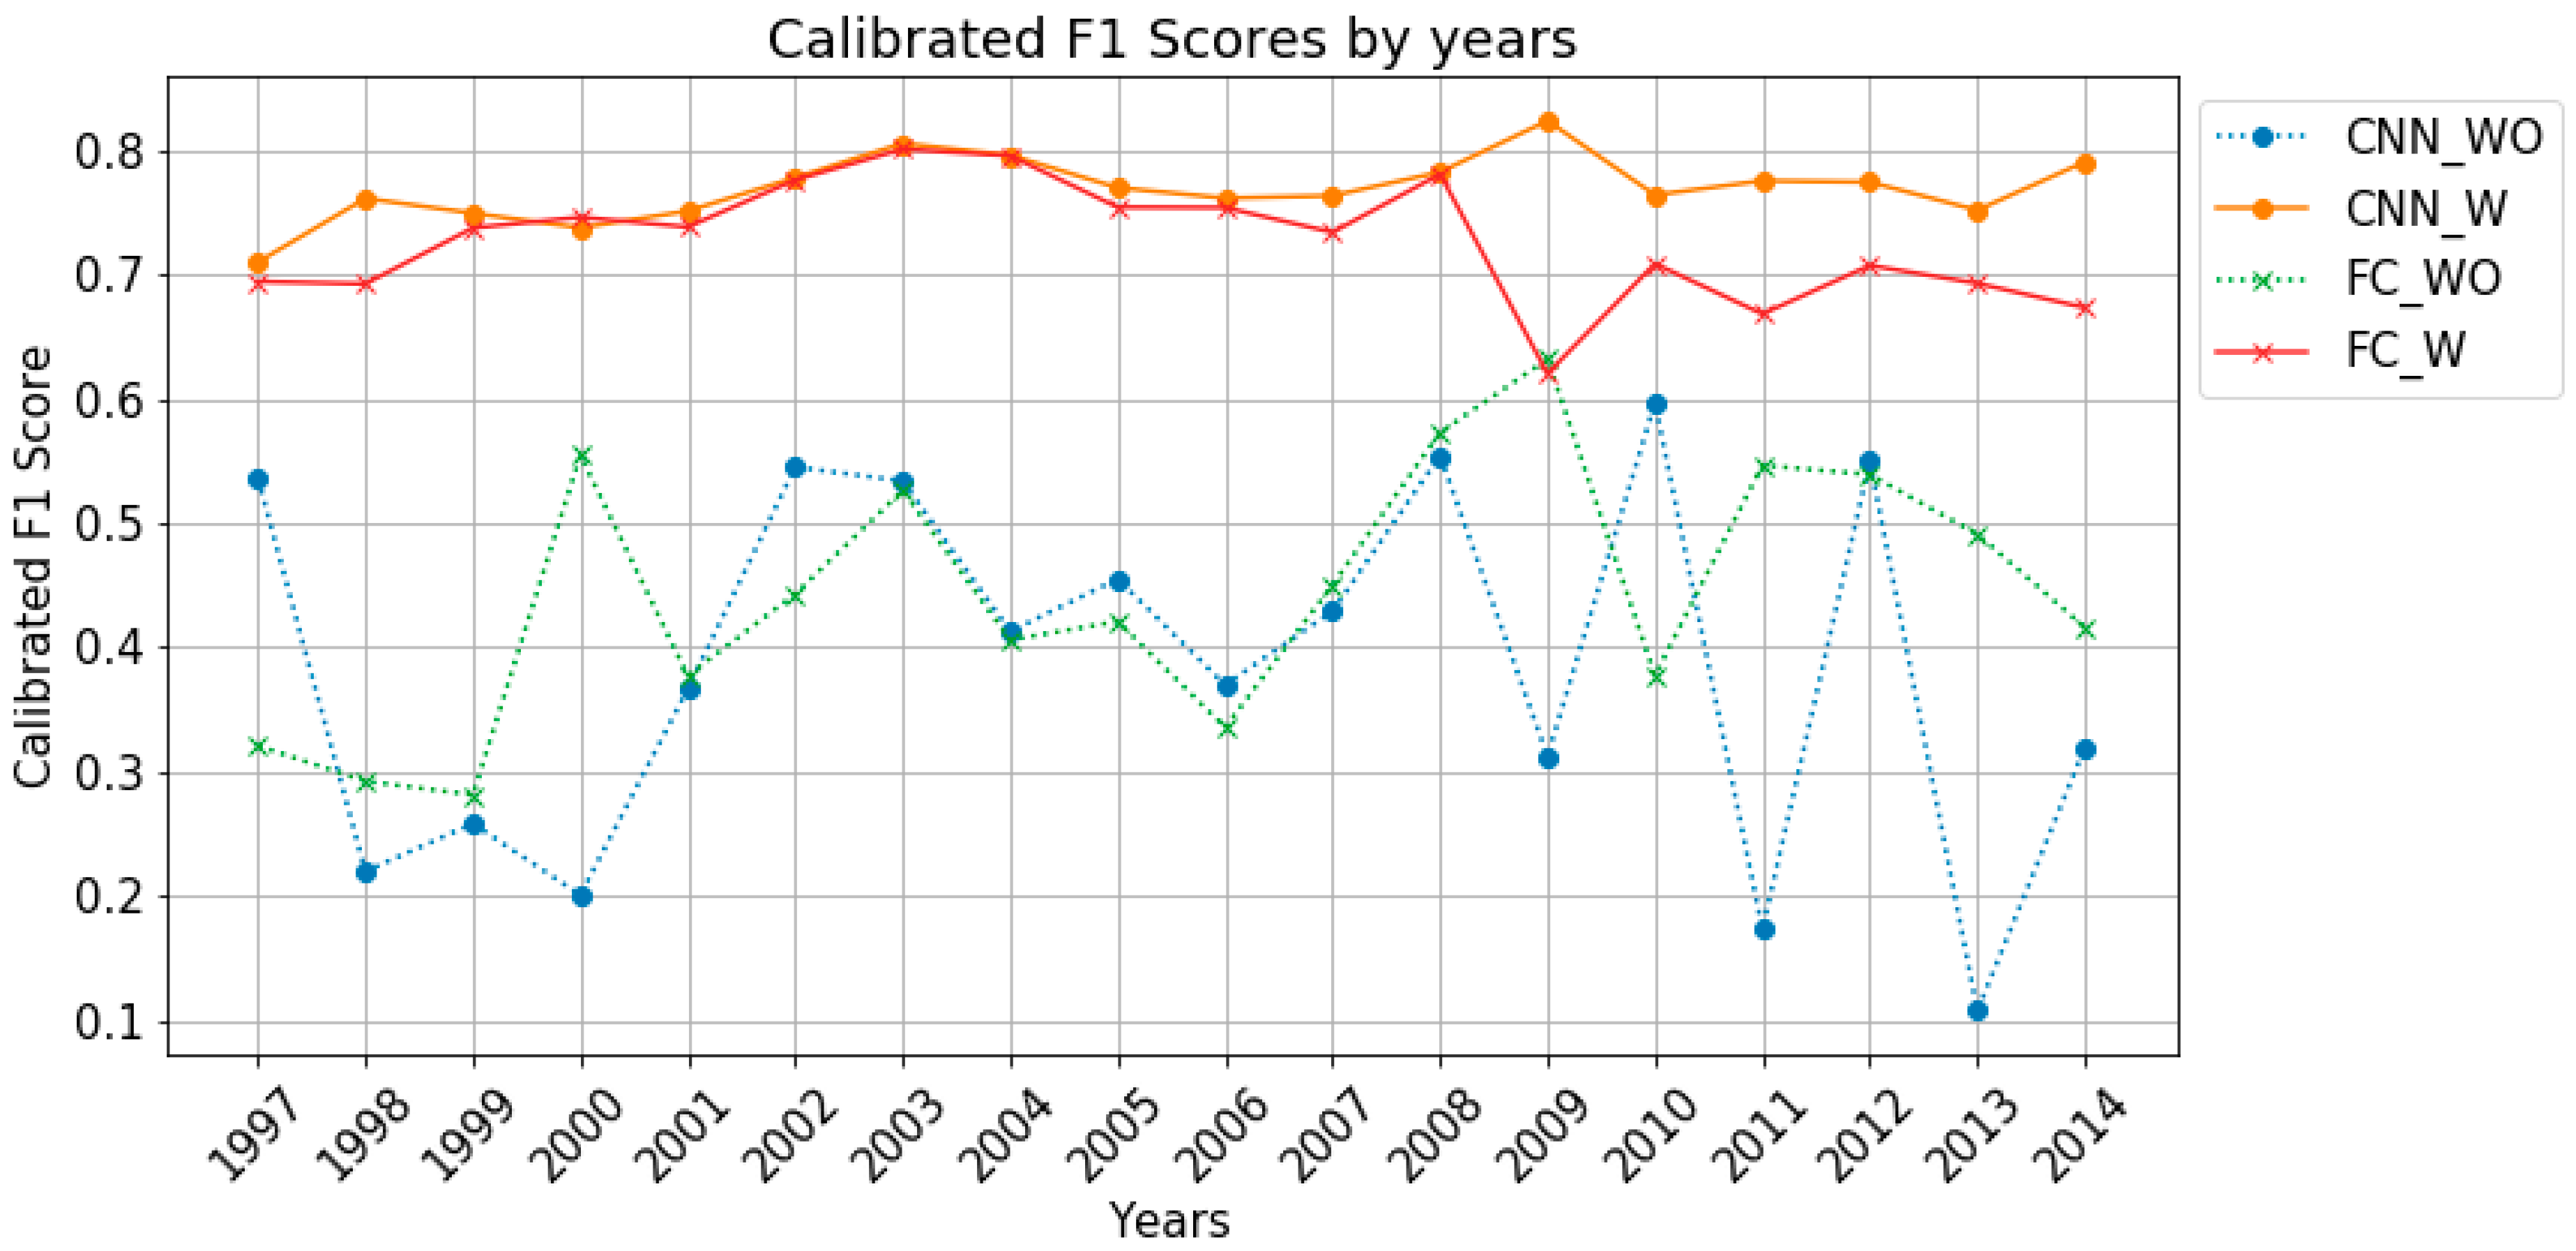
4.3.3. Calibrated F1 Score
Figure 7 plots the calibrated F1 scores of the test data by year. It can be seen that in cases where the models have the same neural network structure, the calibrated F1 scores of the models considering weights when calculating the loss are higher and their deviations are smaller.
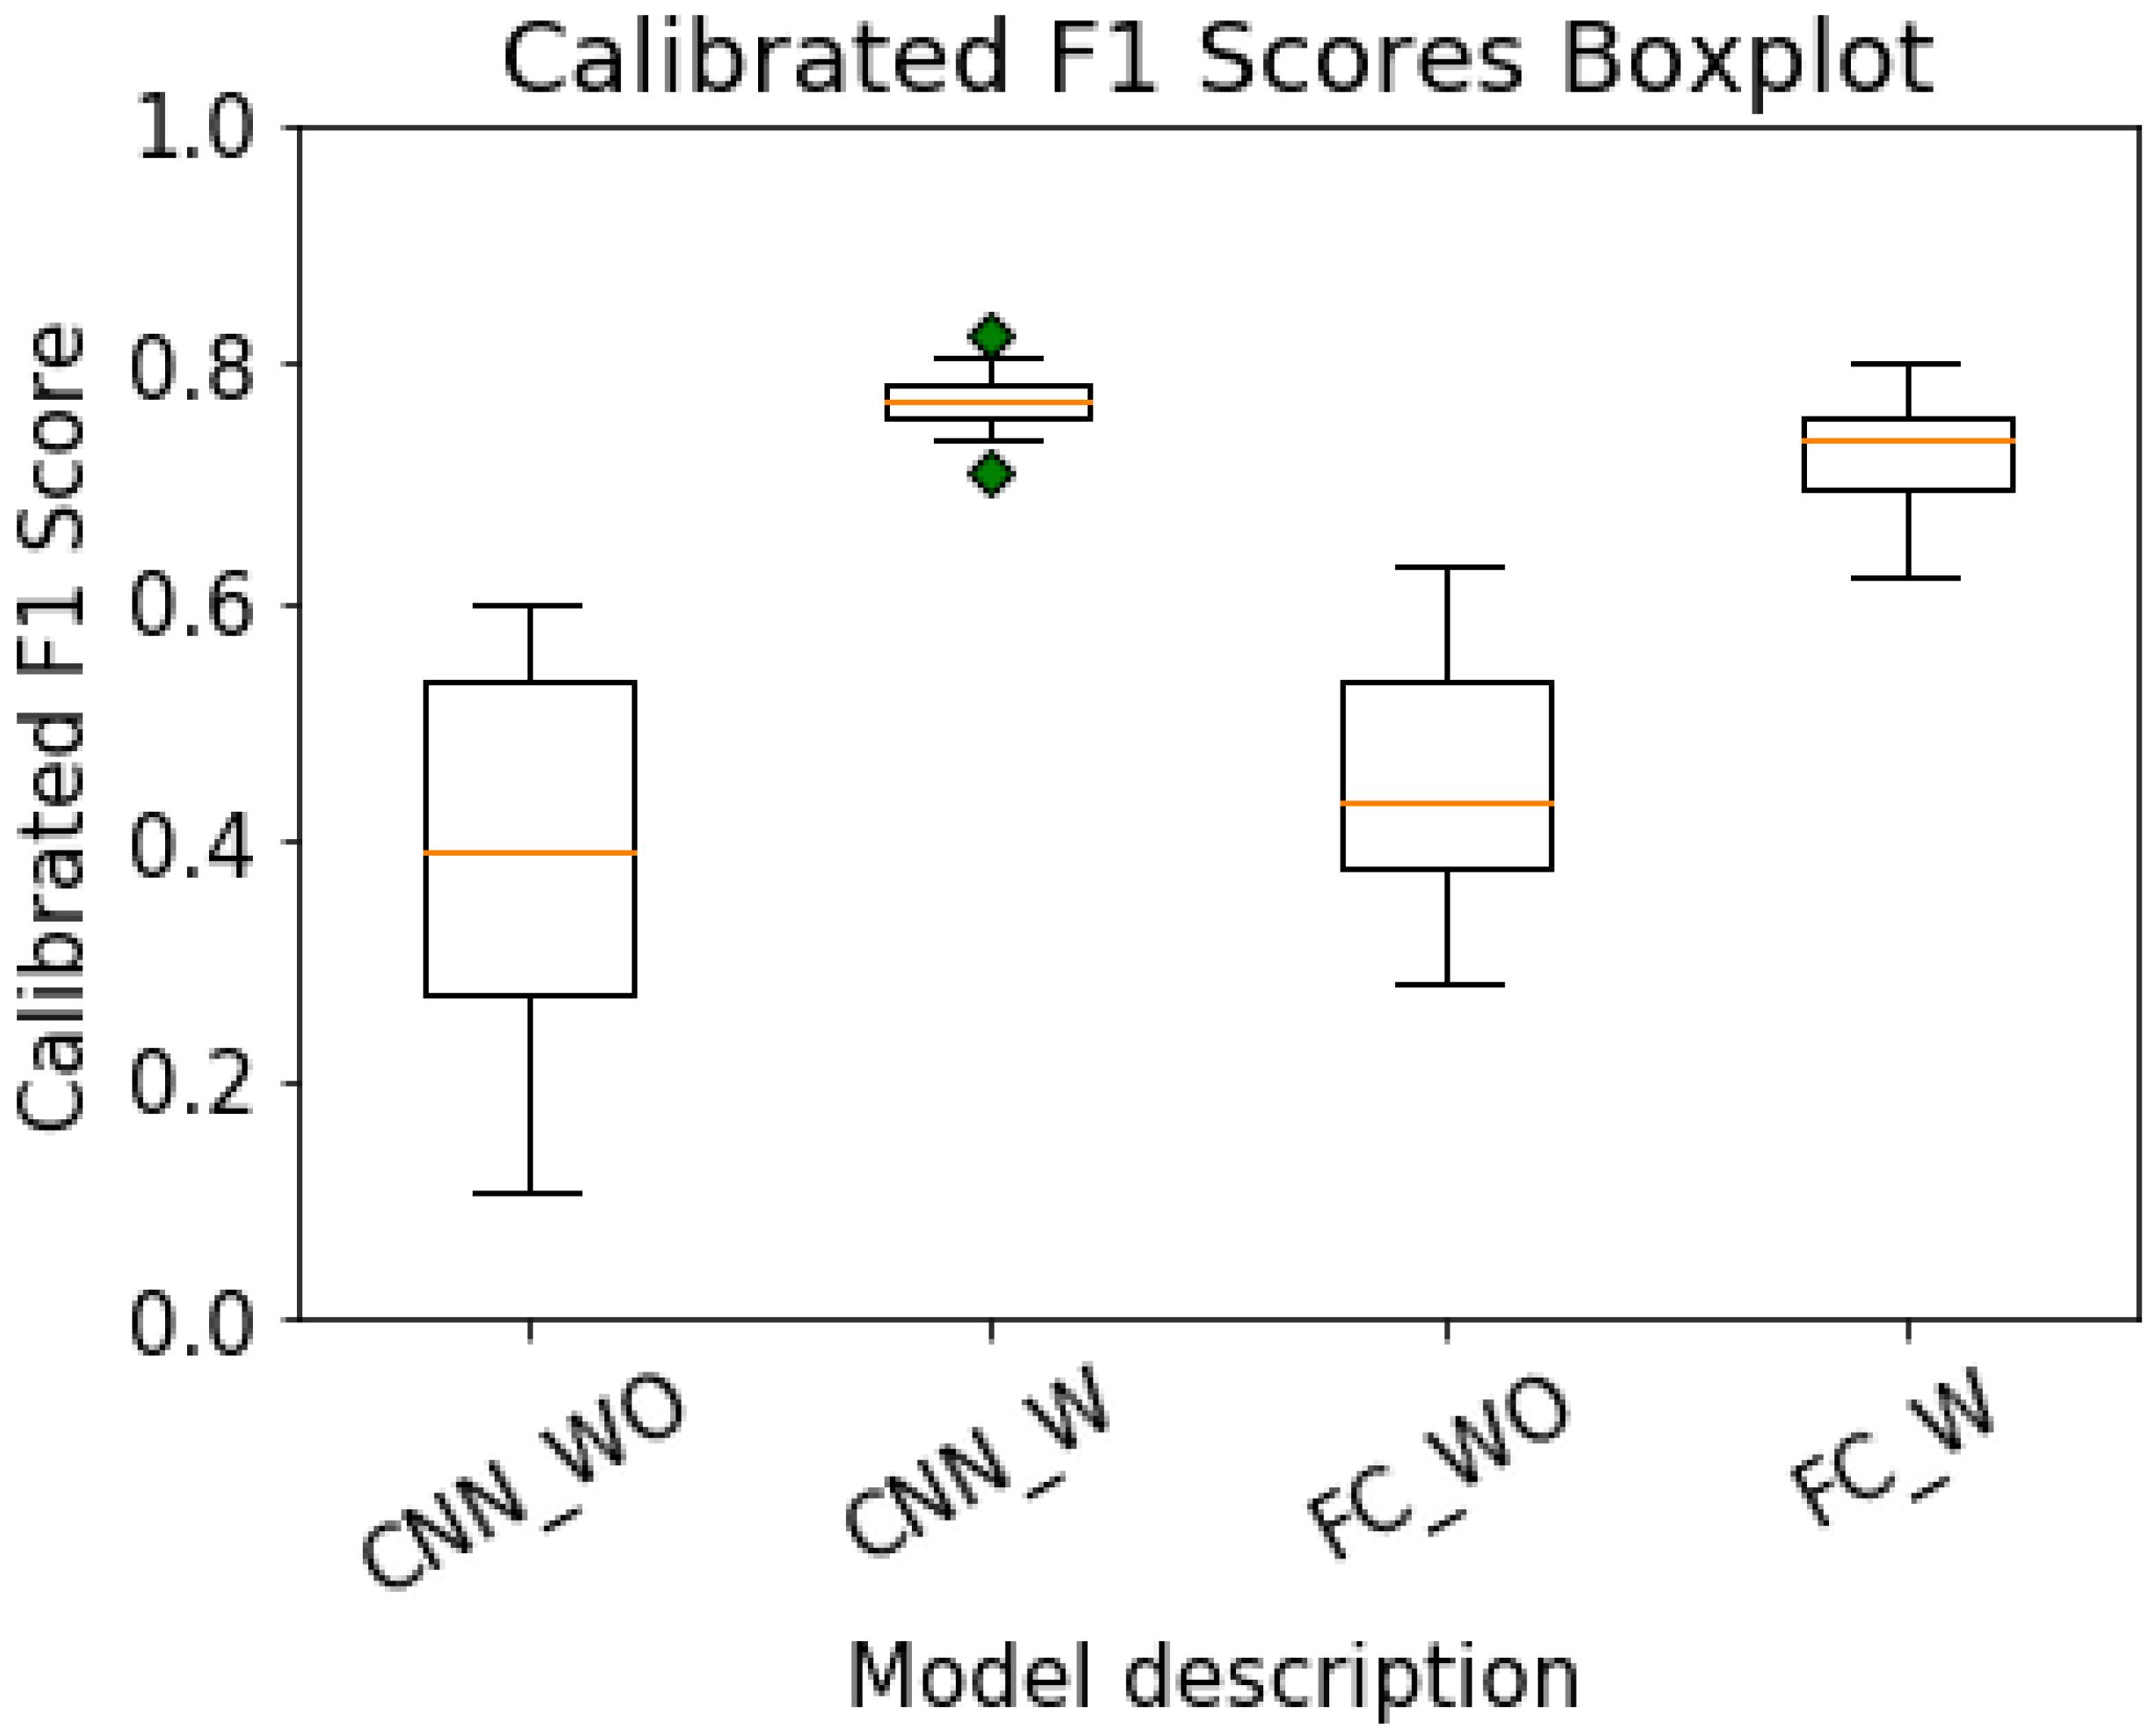
The
Figure 8 shows the calibrated F1 scores of the test data by year as box plots. The average AUROC values of CNN_WO, CNN_W, FC_WO, and FC_W are 0.39, 0.77, 0.44, and 0.73, respectively, in order of precedence, and the standard deviations are 0.147, 0.025, 0.100, and 0.047, respectively, in order of precedence. In the case of CNN_W model, the minimum calibrated F1 score is 0.71, and outliers occur, but it can be seen that the minimum value is higher than the minimum values of other models in which outliers do not occur. Green dots in the graph are just outliers.
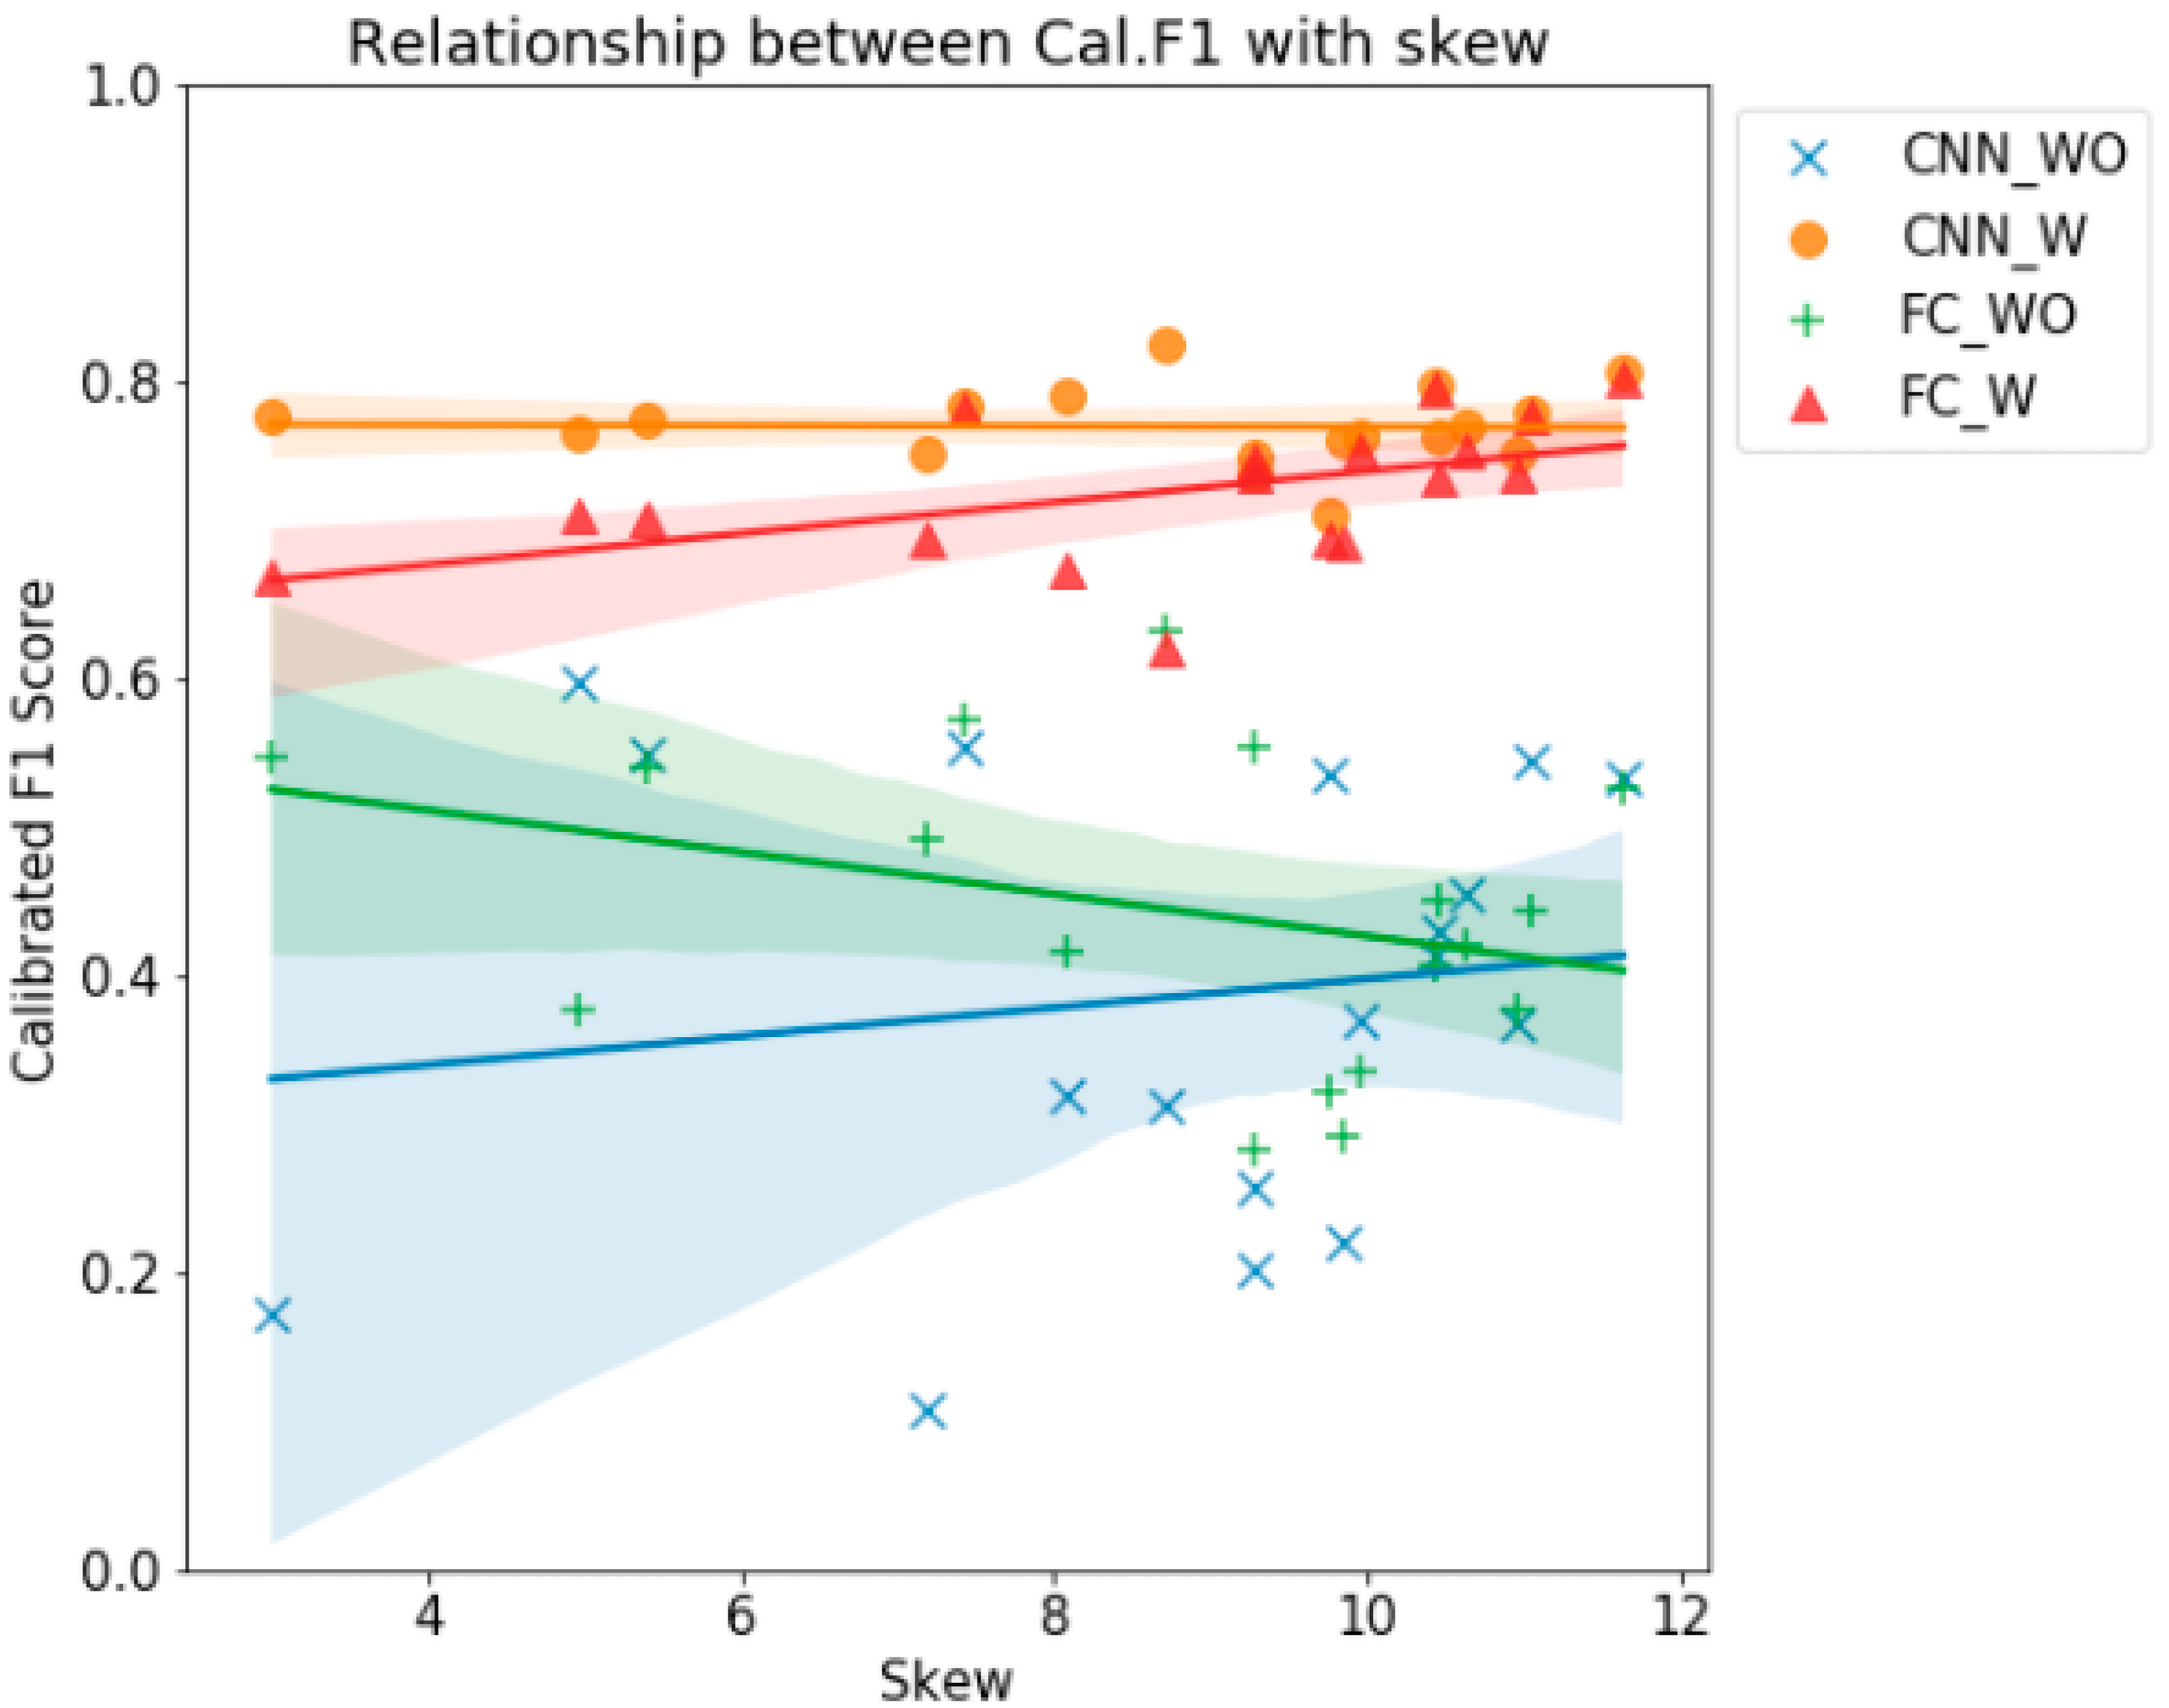
Figure 9 plots the calibrated F1 scores and the degrees of data imbalance by year. The calibrated F1 scores of the models considering weights are less affected by skew, but in cases of the models that do not consider weights, the deviations of the calibrated F1 scores tend to decrease as the data imbalance increases.
4.3.4. Cumulative Data
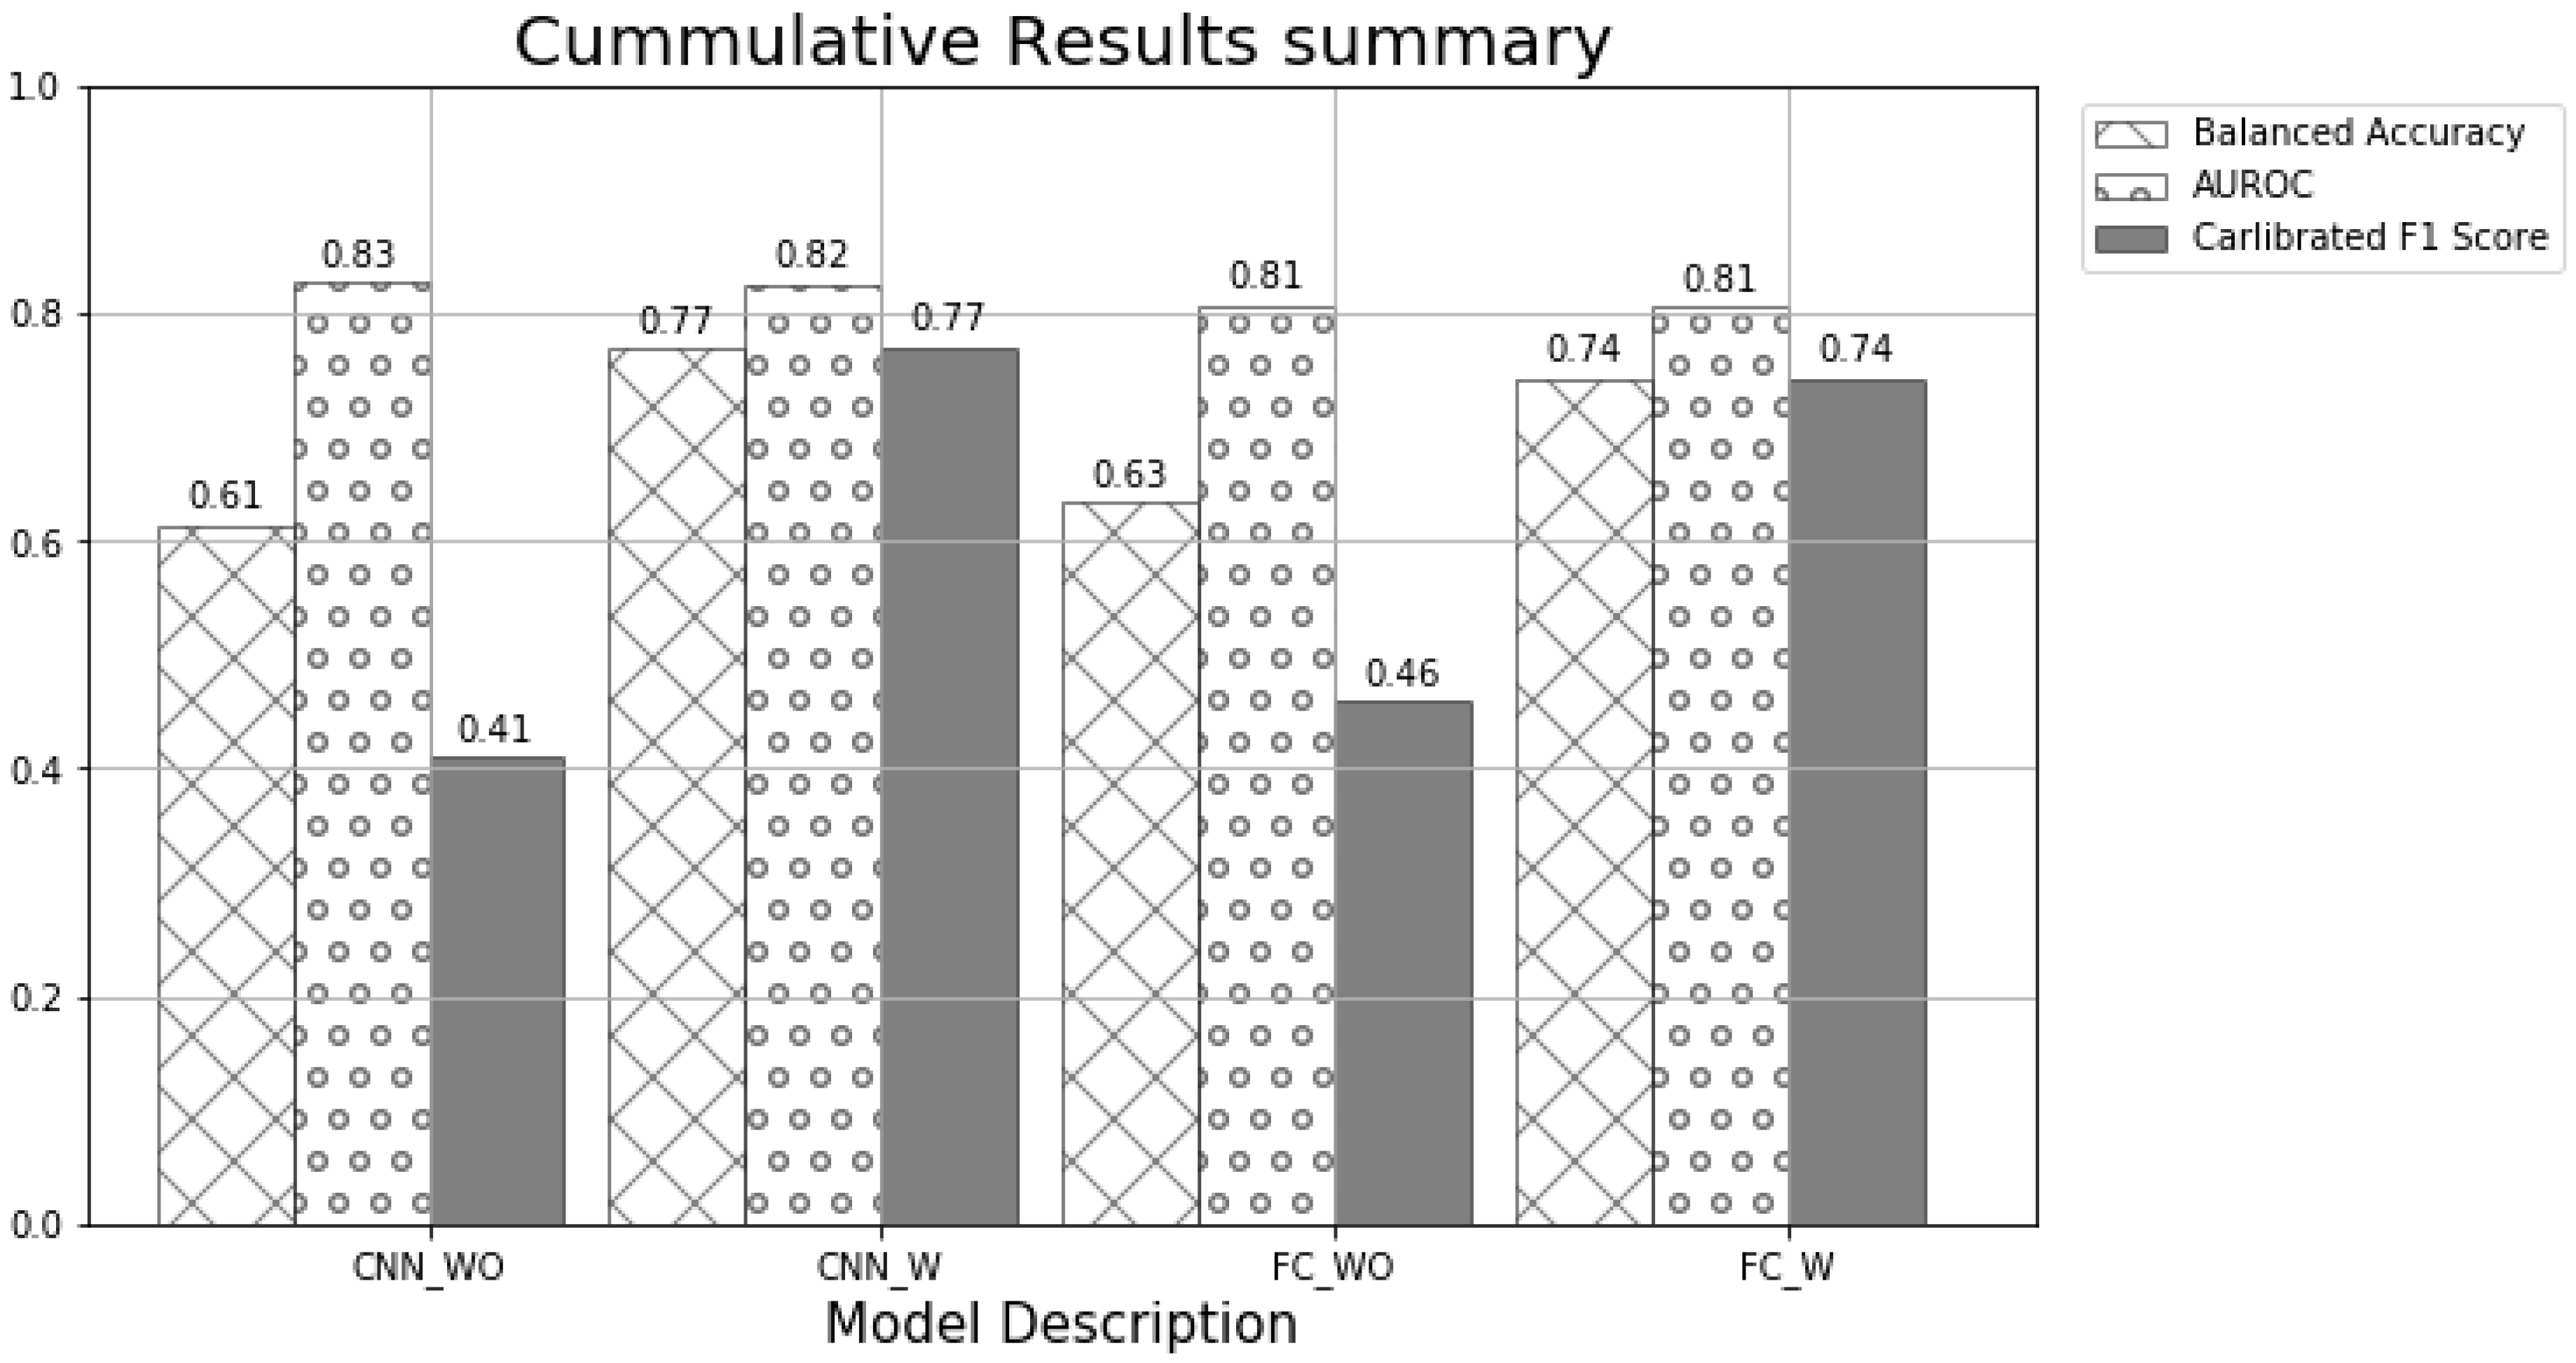
Since the numbers of test data by year are different, test results by year were accumulated to recalculate the balanced accuracy, AUROC, and calibrated F1 scores, and
Figure 10 plots the foregoing values. Since the cumulative AUROC values of the four types of models exceed 0.8, reliable results can be derived no matter which model is used to make a decision on an emergency evacuation order. However, when the balanced accuracy and calibrated F1 scores are considered, the CNN_W model seems to be the most reliable.
4.3.5. Case Study
In order to help readers’ understanding of the methodology, a case study is presented to show how to use artificial neural networks method to predict emergency evacuation orders for ammonia accidents case: an accident occurred in a food manufacturing facility using ammonia in the afternoon of Monday. It was summer and within a quarter mile of the site, there was a residential area. It was a real case, and the evacuation order was executed in reality. The code predicts the order correct, which means “yes” or “no” binary answer was predicted for “yes” as it was ordered for the actual accident case.
4.4. Limitations and Recommendations
In order to avoid the learning of emergency evacuation order already issued wrongfully, the action—victim matrix was used when determining the necessity of an emergency evacuation order. An emergency evacuation order was issued when an emergency evacuation order was judged to be necessary through the action—victim matrix, some people evacuated according to the evacuation order, and it was judged that the emergency evacuation order was appropriate for an accident with no casualties. Although this setting was made for a conservative approach, the possibility that there were no casualties because residents evacuated despite that an unnecessary evacuation order was issued cannot be ruled out. Therefore, in order to use the methodology presented in the present study as an emergency response decision making tool hereafter, it seems that the effectiveness of evacuation orders should be added when constructing the database.
From the perspective of the model presented in the present study, if the decision making model is evaluated based on AUROC, the following can be identified. The cumulative AUROC values of all four models exceeded 0.8, indicating that the models have the levels of reliability considered to be ‘excellent’. However, since AUROC deviations occur depending on the test data, using the CNN_W model with the highest minimum AUROC for test data seems to be the most appropriate.
However, although the reliability of the emergency evacuation decision making models presented in this study is ‘excellent’, there may be machine learning algorithms or CNN structures that show higher reliability within this database. Furthermore, the development of Committee of Emergency decision making models that derive various decision making models and make a final decision by synthesizing the decision making results of individual models can be considered.
5. Conclusions
The present study developed a neural network model that can satisfy both the speed and accuracy of emergency response decision making in the event of a chemical accident using the HSEES and NTSIP databases collected by ATSDR in the United States. Through the present study, which derived two machine learning decision making structures and divided the structures with whether the degrees of imbalance of learning data were reflected or not to derive a total of four decision making models, the following could be confirmed.
The necessity of an emergency evacuation order was determined using the decision making information and victim information in the chemical accident database and the action-victim matrix. Even if only the chemical accident situation is taught to the neural network model, the decision making result through the action-victim matrix can be estimated.
Data consisting of strings can be processed using the embedding layer. Also, since the number of words used varies according to the size of data used for machine learning, it should be reflected on the size of the embedding dimension. When developing a machine learning model using a database that grows in size over time, as with the database used in the present study, it seems useful to use an algorithm that normalizes according to the size of the bag of words.
The cumulative number of chemical accidents learned through the study was 775,155, and emergency evacuation order decision making was performed for 110,083 chemical accidents through a machine learning model. The most time-consuming case was when the CNN_WO model was used, and it took a total of 1755 sec to make decisions for all test data. Since the time required for data learning is almost all of the time taken for decision making, it can be further shortened by storing the neural network information that has been learned. That is, ‘quick decision making’ using the neural network model seems to be possible.
The accuracy of a total of four types of decision making models, CNN_WO, CNN_W, FC_WO, FC_W, was evaluated using a total of three types of accuracy indicators, balanced accuracy, AUROC, and calibrated F1 scores.
On reviewing based on balanced accuracy and calibrated F1 scores, the following can be identified. Reflecting the weights calculated through the degrees of disparity in the data on learning greatly improves the accuracy of the decision making model. On the other hand, the structure of the decision making model seems to affect the stability of the model. The cumulative accuracy of the test data has is slightly different between the CNN models and the FC models, but when 1d-cnn is applied, it can be seen that the standard deviation of the accuracy of each test year is reduced. Therefore, when seen from the viewpoint of applicability to unusual types of chemical accidents, the application of the CNN model is appropriate for emergency response decision making.
Establishing such an emergency response decision making model using the method proposed in the present study in the mitigation stage will help the process. Among the chemical accident emergency management stages, constructing a database for the model, and using the model as a tool for quick decision making for an emergency evacuation order is also thought to be helpful in the establishment and implementation of emergency response plans for chemical accidents.


