Abstract
We report the upper and lower bounds for the levelized cost of high-temperature industrial process heat, supplied from electricity generated with solar-photovoltaic (PV) and wind turbines in combination with either thermal or electric battery storage using hourly typical meteorological year (TMY) data, in systems sized to supply between 80% and 100% of continuous thermal demand at a site in the northern part of Western Australia. The system is chosen to supply high-temperature air as the heat transfer media at temperatures of 1000 °C, which is a typical temperature for an alumina or a lime calcination plant. A simplified model of the electrical energy plant has been developed using performance characteristics of real PV and wind systems and TMY data of renewable energy resources. This was used to simulate a large sample of possible system configurations and find the optimal combination of the renewable resources and storage systems, sized to provide renewable shares (RES) of between 80% and 100% of the yearly demand. This allowed the upper and lower bounds to be determined for the cost of heat based on two scenarios in which the excess energy is either dumped (upper bound) or exported to the electricity grid (lower bound) at the average generating cost. The lower bound of the levelized cost of energy (), which occurs for the system employing thermal storage, was estimated to range from USD 10/GJ to USD 24/GJ for RES from 80 to 100%. The corresponding upper bound ), also estimated for the system using thermal storage, are between USD 16/GJ and USD 31/GJ, for RES between 80% and 100%. The utilization of electric battery storage instead of thermal storage was found to increase the LCOE values by a factor of two to four depending on the share of renewable energy. Compared with current Australian natural gas cost, none of the systems assessed configurations is economical without either a cost for CO2 emissions or a premium for low-carbon products. The estimated cost for CO2 emission that is needed to reach parity with current natural gas prices in Australia is also presented.
1. Introduction
The latest IPCC report [1] emphasizes the urgent need to develop technologies suitable for decarbonizing high temperature chemical industrial processes. Currently, the majority of processes that produce products such as steel, alumina, cement and lime rely on fossil fuel combustion for their heat input at a temperature above 1000 °C. The main alternative sources of net-zero-CO2 high temperature process heat are the combustion of hydrogen, the use of concentrated solar thermal technologies or electrification [2]. The International Energy Agency (IEA) sees the electrification of industrial heating as a cornerstone of a sustainable development scenario [3]. The continued cost reduction of renewable electric power sources is expected to fuel this trend [4]. The success of the transformation of industrial heating depends on a lower cost of electricity [5] as well as major investments into renewable power generation [6]. The International Renewable Energy Agency (IRENA) forecasts that electricity will provide 86% of the world’s energy supply by 2050 [7]. However, few detailed assessments are available of the actual anticipated costs of electrification of such high temperature industrial processes under specific scenarios, or of the potential of plausible options to lower these costs.
The cost of electricity in a future grid with a 100% renewable supply is expected to be lower than that from traditional electricity supplies [8,9,10], although such estimates require extrapolation given that current electrical grids operate with significantly lower renewable energy penetration. For a demand following grid, the variable nature of renewable resources and energy requires that storage systems will be an important part of such systems. This is particularly important for those sources of energy demand that are difficult to turn down, such as high-temperature thermal processes, whose high thermal inertia makes it unrealistic to modulate at the time scales of renewable energy variation. The cost of thermal storage at high temperatures is far lower than that of electric battery storage systems [11,12]. For these reasons, we aim to explore the economic viability of high temperature thermal energy storage systems driven by electric heating from intermittent renewable sources and compare this with the utilization of electric battery storage.
The high-temperature process chosen as reference with which to evaluate the economics of thermal storage for industrial processes is the calcination of alumina because this process requires only heat. This is unlike reduction processes, such as that occurring in iron making, where a direct chemical interaction occurs between the fuel and the ore, in addition to the need for heat, to drive the reduction process. We further assume that the technology needed to electrify the process is already available, although some development of technology is needed to either adapt or replace the prevailing methods of flash, gas-solid suspension and circulating fluidized bed calcination driven by fuels such as natural gas [13]. That is, we aim to evaluate the economics of replacing the fuel, based on natural gas, with electric heating from renewable sources incorporating thermal or electric battery storage.
The renewable energy for the system is assumed to be driven by a hybrid renewable system of PV panels and wind turbines, owing to the growing dominance of these two technologies as broadly complementary low-cost generators [14]. Here, we also limit the evaluation to the case where the energy is sourced locally and the variability is managed only with the storage, although it is recognized that further benefits may also be derived from long-distance transmission lines, such as high voltage DC [9]. While various estimates of the anticipated future costs for renewable electricity have been proposed [8,9,10], to the best of our knowledge no equivalent estimates of the future cost of heat from renewable electricity and thermal storage for high-temperature processes has yet been reported. In this context, it is necessary to build understanding of these costs in stages. For these reasons, the aim of the present investigation is to estimate the upper and lower bounds of the cost of the supply of electricity from a hybrid wind/PV plant with thermal storage, which can provide continuous heat for a calcination plant with a given level of autarchy. Two scenarios are assessed to find these upper and lower bounds for cost. The upper bound for the levelized cost of energy () is obtained by ignoring the value of any surplus electricity from the thermal or electric storage systems. The upper bound for the levelized cost of energy () is obtained by assuming that all surplus energy can be sold to the grid at a fixed price. The real cost for renewable heat from intermittent electricity will therefore fall between these two limits, providing valuable insight into the economic viability of electrification of high temperature industrial processes. We also aim to compare the upper and lower limits with current prices for natural gas and hydrogen cost projections, to understand the relative cost difference between the traditional, fossil heating and a CO2 emission free alternative.
2. Methodology
2.1. Defining the Heat Demand
We assume that the electrical energy is converted to useful heat by two resistive heaters, using air as the heat transfer medium. Resistive heaters are chosen because they are the electrical heating technology that is most advanced commercially [2]. It is further assumed that the storage system can be heated independently, also by resistive heating. The heat is then transferred to the reactor via the heated air to drive the endothermic reaction of the alumina calcination. The main reaction in the calcination process is the transformation from gibbsite into smelted grade alumina (SGA), which occurs at temperatures of approximately 1000 °C.
Assuming that the new process has a similar efficiency of 60% as the traditional route [15], the total specific energy per alumina produced is about . Further assuming an alumina production of about 140 ton per hour in each calciner will consume approximately 100 MWth, which needs to be provided electrically. Since alumina calcination plants typically operate multiple calciners we designed an energy system to feed 6 calciners, resulting in a total continuous power demand of 600 MWth. The total annual thermal energy consumed by the process is 5256 GWh.
2.2. Defining the Solar and Wind “Base” Systems
Wind and solar PV generators were chosen as the sources of power since these are typically the type of low carbon technology with the lowest cost for installation and energy production in most parts of the world [16]. The solar and wind energy systems were simulated using the DLR software Greenius [17] using hourly TMY data obtained with Polysun™ [18] for the location of Learmonth in the northwest of Western Australia. For each technology, a “base” system was simulated in detail, from which a bigger system was constructed by adding up the results of the single systems. For the wind system, a “base” system with a nominal power output of 100 MWe was simulated, which consisted of 50 single turbines with a nominal output of 2 MWe at a hub height of 80 m. Similarly, the “base” PV system also had a nominal output of 100 MWe. The output for both systems was calculated on an hourly basis and cross-checked with data from Global Solar Atlas [19], Global Wind Atlas [20] and PVGIS [21]. The results of this comparison are shown in Table 1.

Table 1.
Comparison of the annual base cases simulated with the weather data from Learmonth Airport [18] with web databases from energydata.info [19,20] and PVGIS [21].
The types of technology that were chosen to simulate the power production for two “base” units of the electricity plant are listed in Table 2 for the wind turbines and Table 3 for the PV plants, respectively. While slight differences in the output from each unit in a system would occur in practice, due to slight differences in location, these were ignored for the present analysis. A more detailed analysis is beyond the scope of the present investigation, since it is not expected to influence the upper and lower bounds significantly.
Table 2.
Technical details of the technology employed for the “base” wind turbine system [17].
Table 3.
Technical details of the technology employed for the “base” PV system [17].
2.3. Capacity Factor for the Solar and Wind Installations
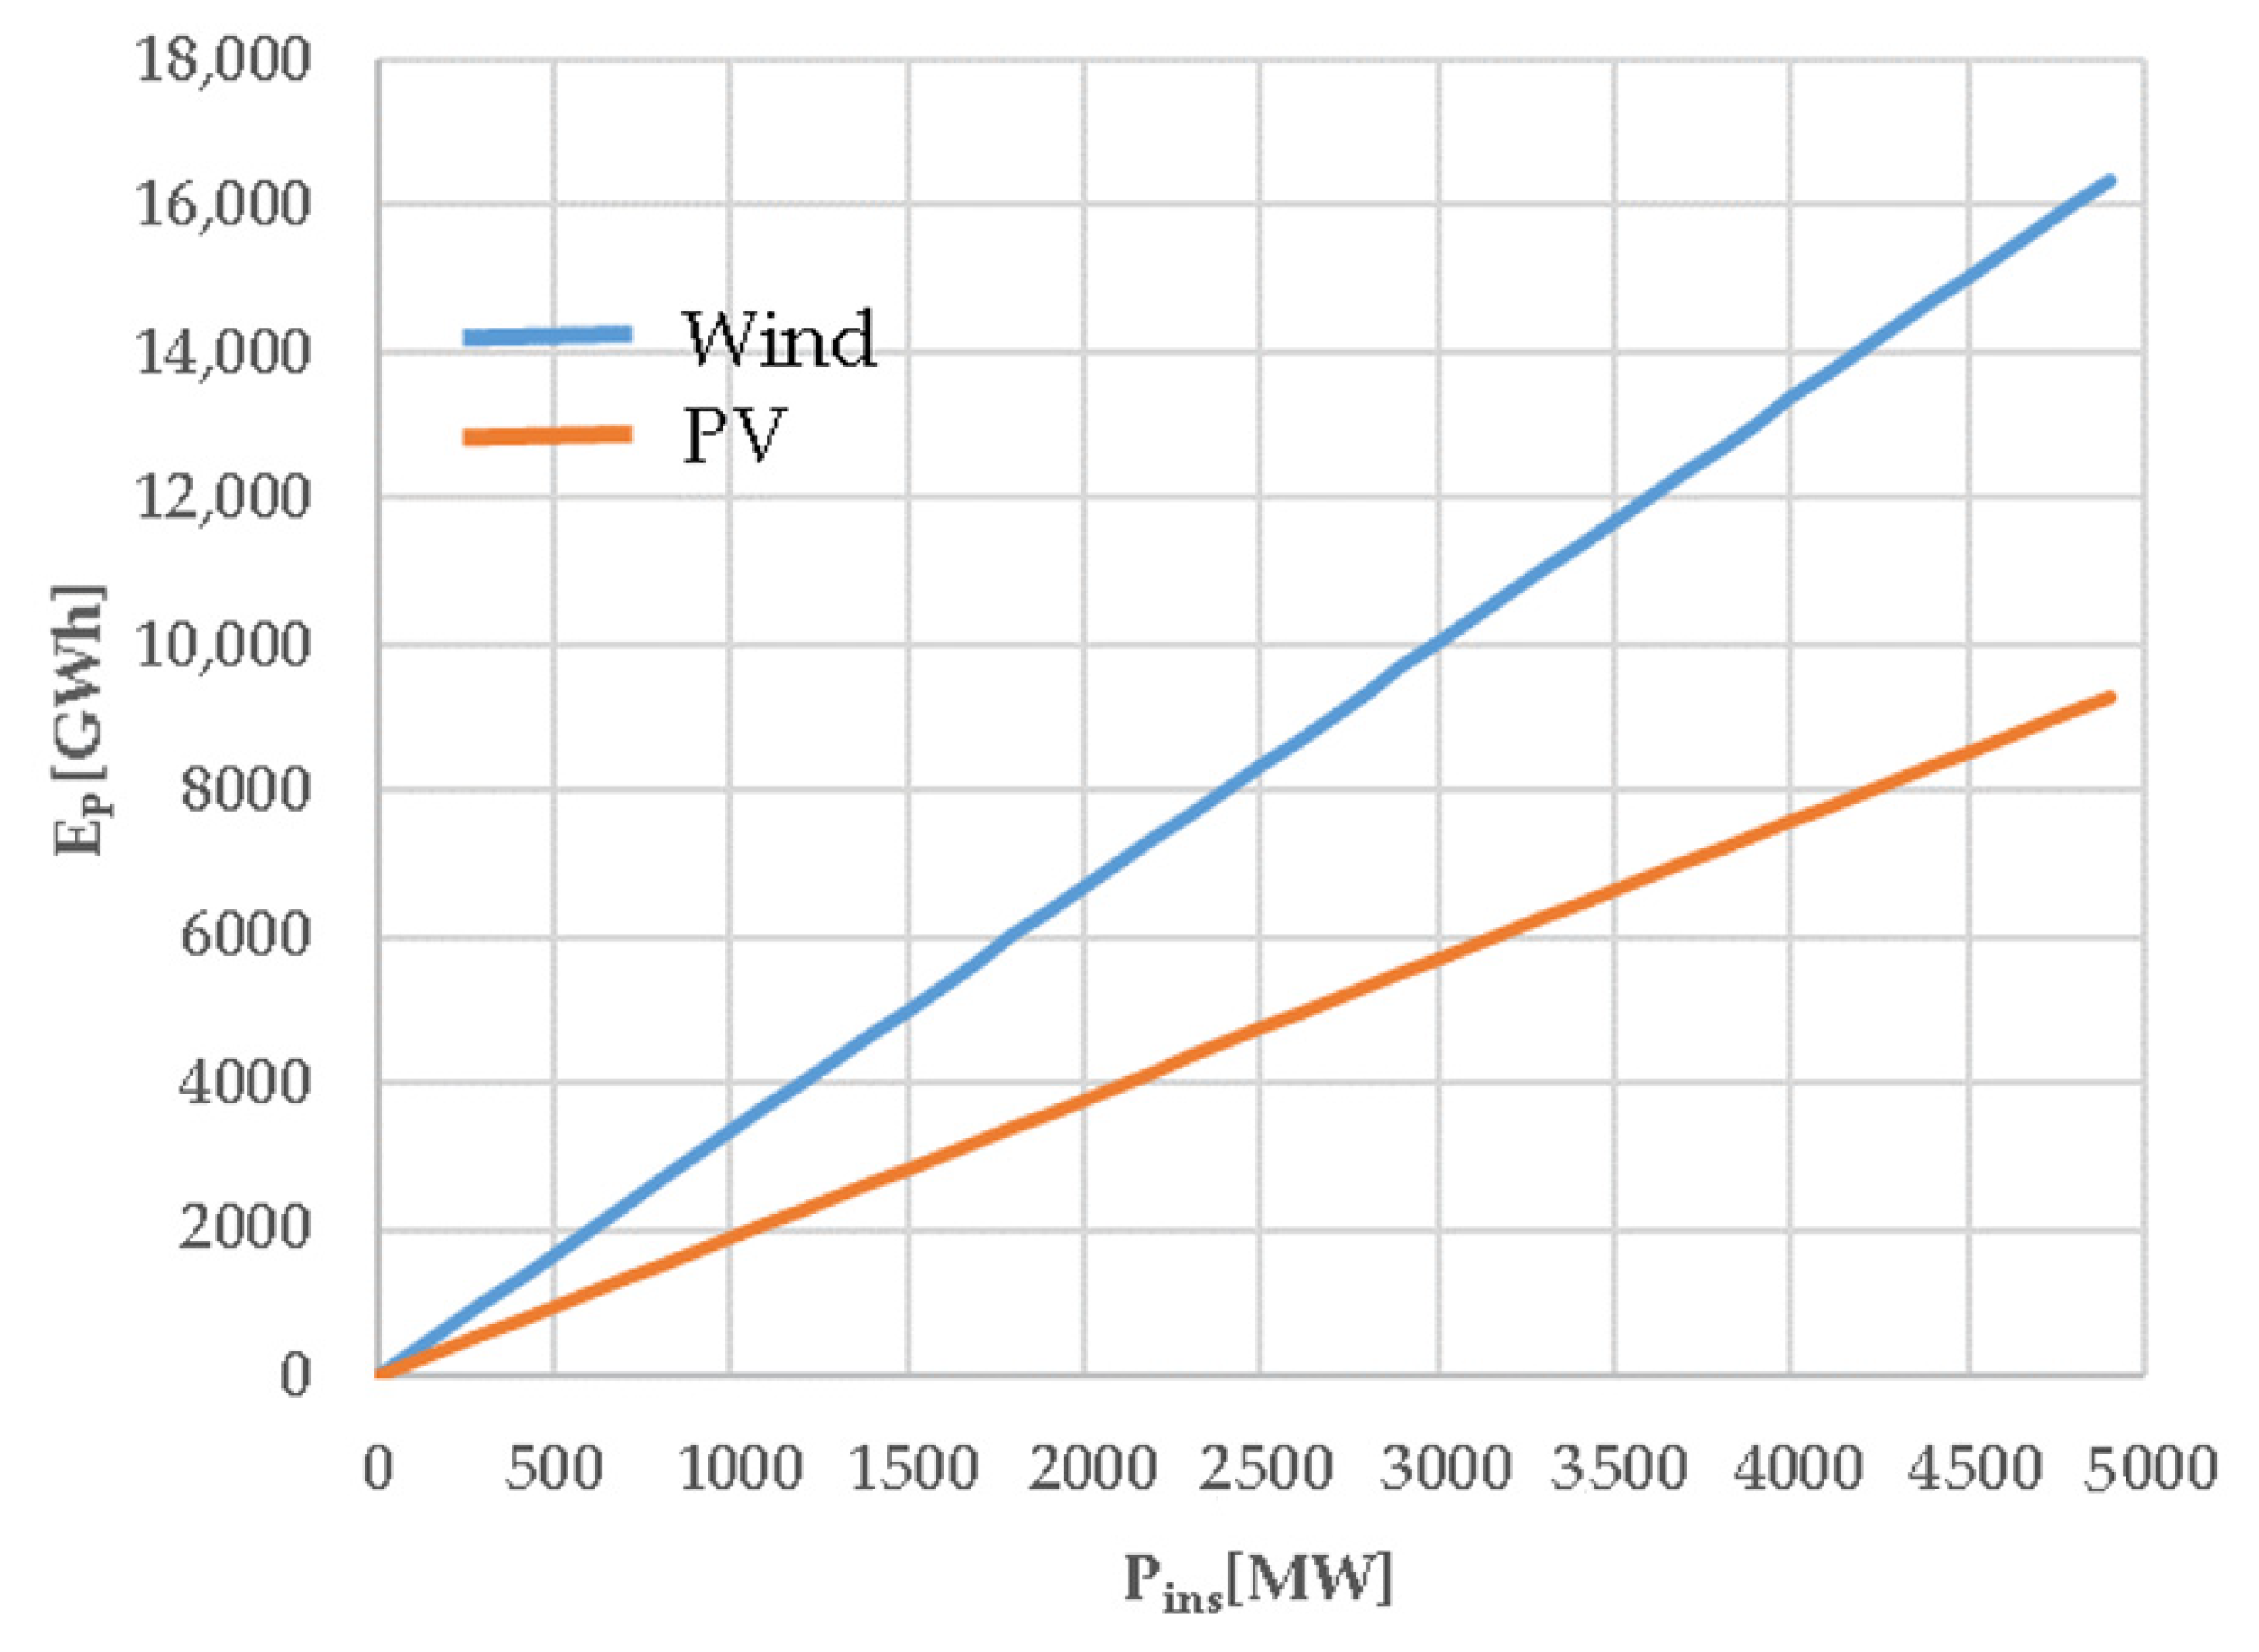
The yearly energy output for the wind and PV system were analyzed for their capacity factor. This is important to understand the viability of an installation at a certain location. Learmonth in Western Australia (WA) was chosen, as it has very good solar resources as well as excellent wind resources. If installed on their own for simple grid supply, it is important to understand the capacity factor, which is dependent on the location of the system. It was computed for the base systems and is defined as
where is the annual capacity factor, is the annual produced energy by the PV or wind system is the installed power capacity, and is the time frame in which the capacity factor is analyzed, typically one year. Figure 1 presents the relationship between installed power and energy produced for both technologies in Learmonth, WA. The calculated capacity factor was found to be 38% which is above the average capacity factor of 30–35% in Australia [22], while the calculated capacity factor of was found to be 22%, which lies in the upper range of the typical capacity factor of 10–25% [23]. These values show that the same installed power of wind generates almost twice the amount of electric energy as the same amount of installed PV in Learmonth. While the capacity factor is of limited direct relevance to the aim of supplying heat continuously for 80% to 100% of the time, in combination with thermal or electric battery storage systems, it can nevertheless be used as a guide in the understanding of the optimized system.
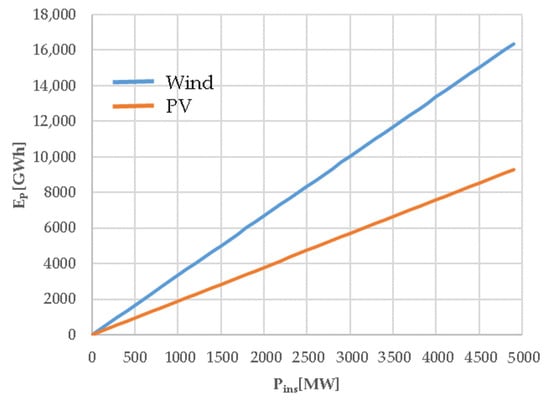
Figure 1.
Annual energy output for the two base systems as a function of installed power at Learmonth, Western Australia.
2.4. Storage Technology and Model
A packed bed storage system of ceramic particles as the heat storage media was chosen for the thermal energy in this industrial heating system with air as the heat transfer media. This is because this type of storage system is well-established commercially at temperatures of >1300 °C as regenerative air heaters for processes, such as glass furnaces and coke-ovens in iron making [24,25]. As commercially established, the cost of this type of storage system can also be below USD 40/kWh [11]. To reduce the computational cost, a simplified model is chosen, in which the charging and discharging of the storage device are both assumed to have a 90% efficiency [26,27]. The storage is modelled using only three key parameters, the charging and discharging efficiency and the storage size, as was demonstrated previously [28]. The simplified model was chosen to make the evaluation of a large number of configurations computationally tractable. The storage system is sized to utilize the excess power generated by the wind and PV plants during periods of high supply, and its capacity is systematically varied as described in the following section. For each configuration, the annual output was modelled for multiple storage sizes iteratively until the minimum required storage was found to match a given target for RES of 80%, 90%, 95% and 100%.
The performance of the thermal storage was compared with an equivalent electric battery system with the same efficiency. For the present analysis, the same model was used, so that the component cost is the only difference between the two types of storage systems.
2.5. System Model and Storage Sizing
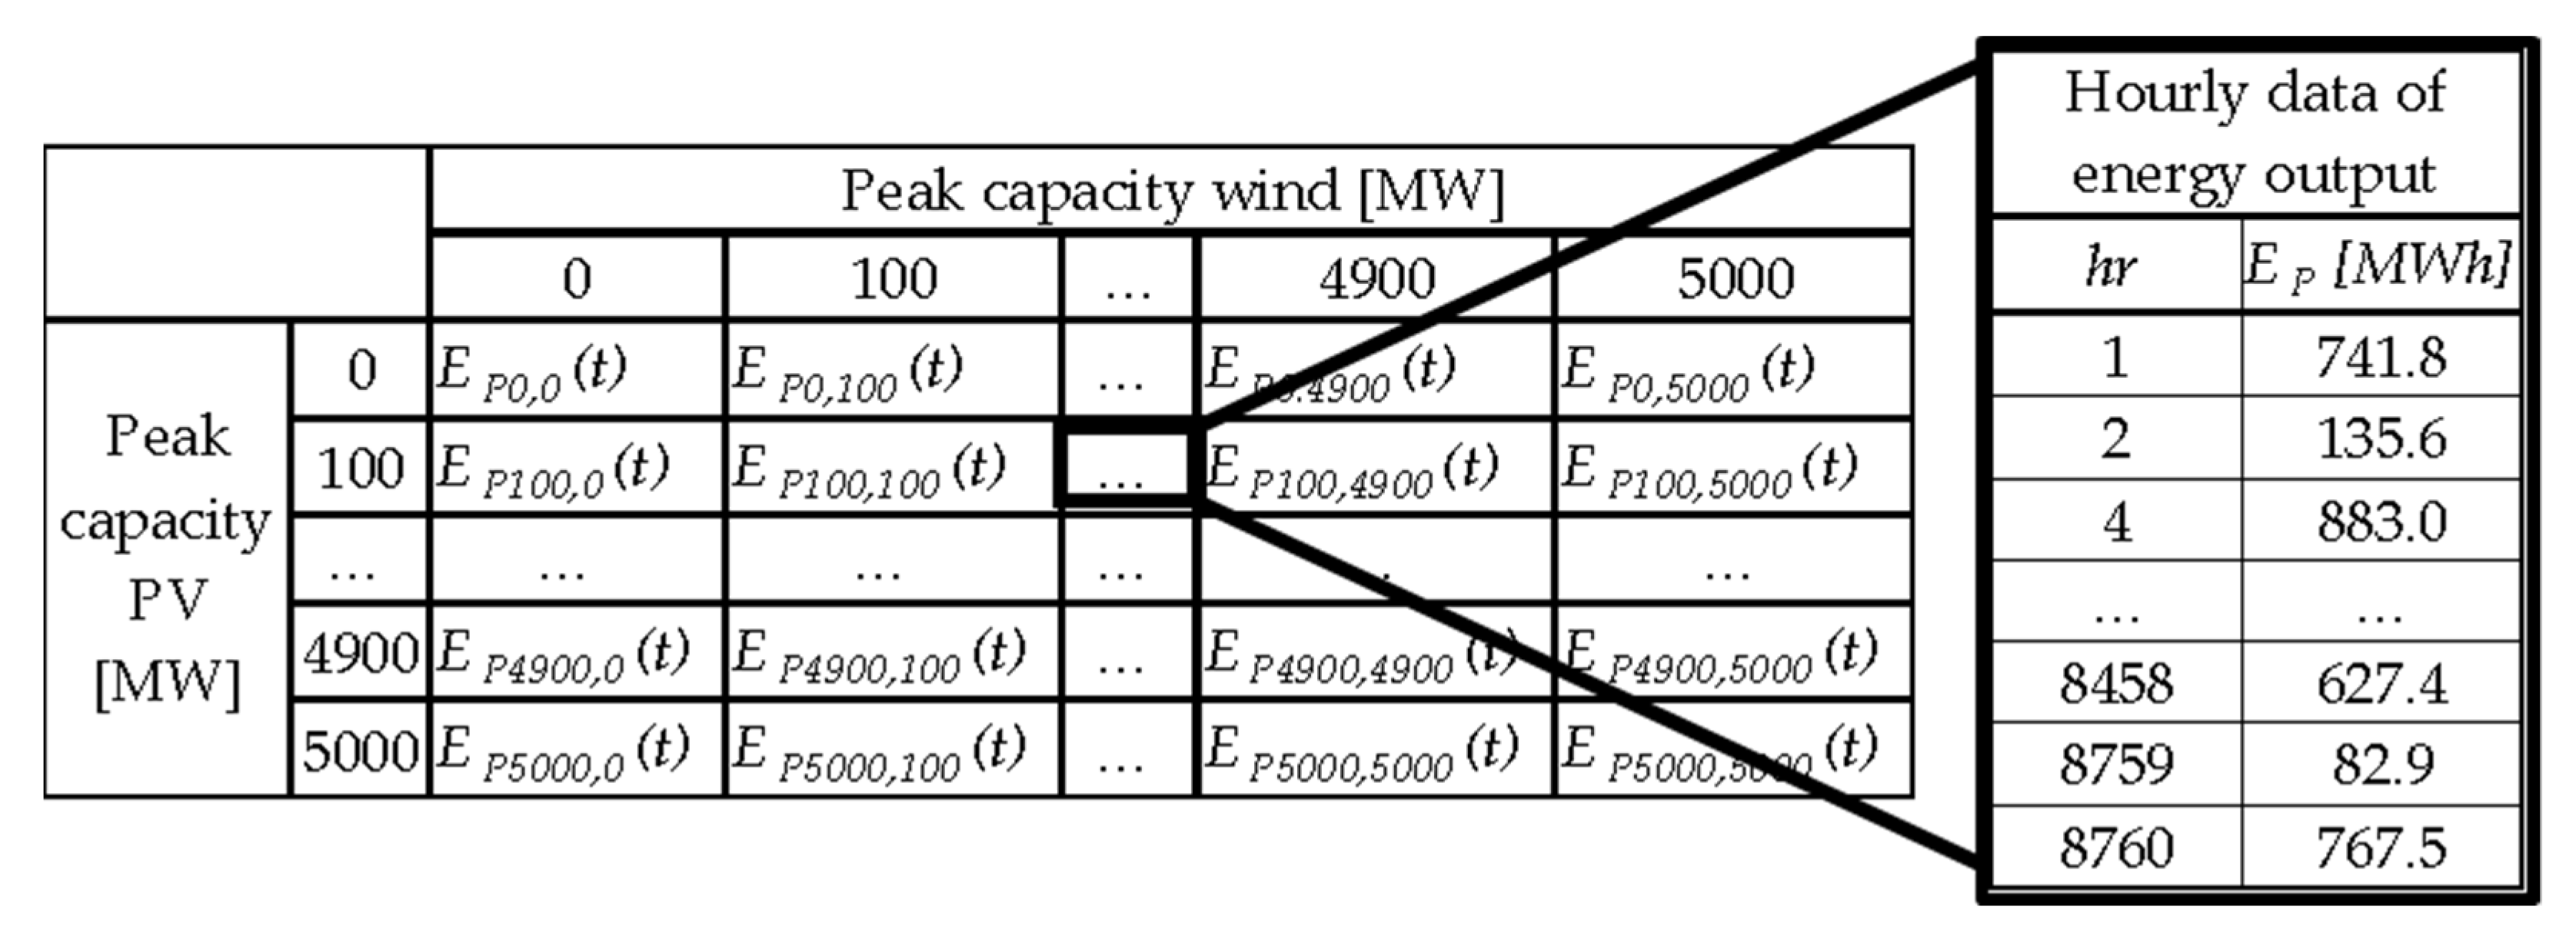
A large set of potential combinations of wind and PV generators were modelled to obtain optimum cost values. Various configurations of each subsystem were assessed, each comprising of multiples of the “base” system spanning from 0 to 5000 MWe in steps of 100 MWe. Hourly data energy was computed for each of the configurations by adding up the hourly data of the “base” systems. Figure 2 illustrates the method of computing each generation system.
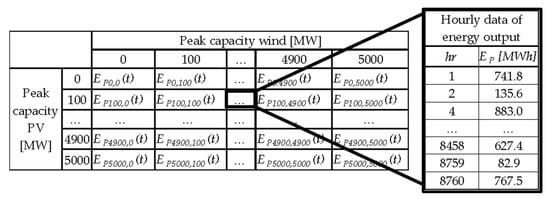
Figure 2.
The combination of wind and PV ‘base’ systems that were evaluated to optimize the energy output from the generators.
To identify the minimum storage size for each configuration a series of steps were undertaken using the hourly PV and wind generation data of the base systems. The approach taken in this study is detailed in the following. Firstly, for each configuration, the total generated energy output in each hour was compared with the demand of the industrial plant. When this value exceeds the demand, the excess energy is stored in a storage device, if storage capacity is available for subsequent use. A similar approach was used to analyse the integration of large-scale renewable energy generators in Italy [29]. Other work using a comparable approach analysed the relationship between storage sizing and unscheduled reduction in output of solar thermal power plants [30]. The storage size is iteratively varied to meet the minimum demand. Each case assessed a large combination of potential configurations for power from wind and PV generators with a similar level of complexity.
To evaluate the efficacy of the combined generation and storage system, we define the RES as the fraction of total energy demand that is met by the system, to be as follows:
where is the yearly sum of energy consumed by the process from the PV/wind/thermal storage system and is the yearly demand of 5256 GWh of the industrial process. The capacity of the storage system was then increased iteratively to provide annually averaged of 80%, 90%, 95% and 100%. Note that a value of ΧRES < 1 implies that the residual energy requirement will be provided from another source, such as additional combustion of gas in the heating system.
The hourly energy difference between supply and demand , are computed as:
where and are the hourly energy output from the wind system and PV system, respectively. The energy that is transferred each hour from and to the thermal or electric battery storage device, is , while is the hourly demand, which is constant 600 MWh. The hourly energy from the renewable power supply that is consumed by the industrial process is defined in each time step as:
where is the renewably produced energy in time step . Note that where the storage energy can only be positive, i.e., discharging.
For a given value of the target renewable share the model iteratively searches for the minimum amount of storage necessary to fulfil the demand to reach the chosen value of for each combination of wind and PV generators. Starting from an arbitrary storage size, the storage size is multiplied by a factor of ten until the target is surpassed. Following this initialization, progressive bisection is used to find the storage size that fulfils the with an accuracy of Figure 3 illustrates schematically the logic used to identify the size of the storage needed to satisfy a given value of for each of the configurations.
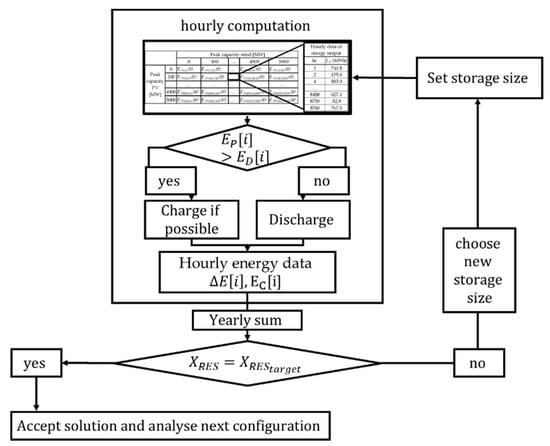
Figure 3.
Logic diagram describing the algorithm used to optimize the size the storage for each target value of renewable share: , where is the energy from the generation system that is consumed by the industrial process. The increments in storage size are progressively refined using bisection.
2.6. Economic Analysis
The LCOE was computed using different scenarios and methods described in the following. We computed four different values for each type of storage system and , namely, the upper bound of the LCOE using a thermal storage device (), assuming that the excess energy is dumped, the lower bound of the LCOE using thermal storage assuming that the excess energy can be utilized or exported to the grid (). Note that the storage systems were minimized in a way that the quantum of stored energy is completely consumed locally. The third and fourth cases are the corresponding upper and lower bounds for the levelized cost of heat using electric battery storage, also assuming that the excess energy is either dumped (), or utilized and exported (). The main aim of computing these four values, shown in Table 4, is to find a cost range for electrical heating powered by intermittent renewable sources. In reality, a complete waste of the excess energy is unlikely to occur. However, realistically, it cannot be assumed that the grid would be able to accept all the surplus energy, for either technical or economic reasons. Further, the cost of the grid connection was not included in the cost analysis. For simplicity, it is also assumed that the average power output from the electrical generators is equal every year. That is, we ignore yearly fluctuations, downtime and the degradation of the power output with time, which can be minimized by proper operation and maintenance measures [31]. The levelized cost values introduced above are computed as follows:
and
where C[t] and are capital and operational expenditure, respectively, is the number of total operational years of the energy system and is the discount rate. Note that the value of considers only the energy consumed by the industrial process, whereas that of considers all of the energy produced by the generator.
Table 4.
A summary of the different cost parameters computed in this study.
The cost for each system is then computed using the algorithm described above using values for system components and operating costs found in literature, as summarized in Table 5. For those cases where operating costs are unavailable, this was assumed to be 2% of the capital cost. The currency used is USD unless otherwise stated. Estimates for wind power installation and operating costs range from USD 1436/kWe and USD 43/kW/year, [32] to USD 1355/kW [33] and USD 48/kW/year [34], respectively. For PV utility-scale installations the capital costs range from a very low value of USD 500/kWe installed [35] to a more realistic USD 883–1010/kWe installed range [36] while operating costs of USD 14.4/kW/year are cited for a 10 MW plant [37], although they will decrease with the increase in scale. The installation cost for electrical storage varies between values of USD 443–1276/kWh depending on the technology and size of the installation [38]. Much lower capital expenditure of about USD 40/kWh installed was estimated for thermal storage [11]. The electrical air heating system chosen to convert electrical energy to heat was estimated to have a capital cost of USD 240/kWth [2], although it is noted that these costs are expected to reduce in the future [39].
Table 5.
The assumed values of capital and operating expenditure used in the economic analysis.
3. Results
3.1. Minimum Storage Capacity for Each Target Renewable Energy Share
The algorithm described in Section 2.4 finds the minimum energy storage requirement for each of the analyzed combinations of wind and solar energy. The storage element is not a productive element in the system but merely shifts produced energy in time. Thus, one chosen strategy could be the minimization of the storage for each . Table 6 presents the minimum storage requirements for each of the values. It is interesting to compare the minimum storage requirement with the most economically viable solutions, as shown in Section 3.2.
Table 6.
Minimum storage capacity requirement and the installed power for wind ( and PV systems and the generated energy and for wind and PV, respectively, and the excess energy that is not consumed by the plant, for each target renewable energy share ( ).
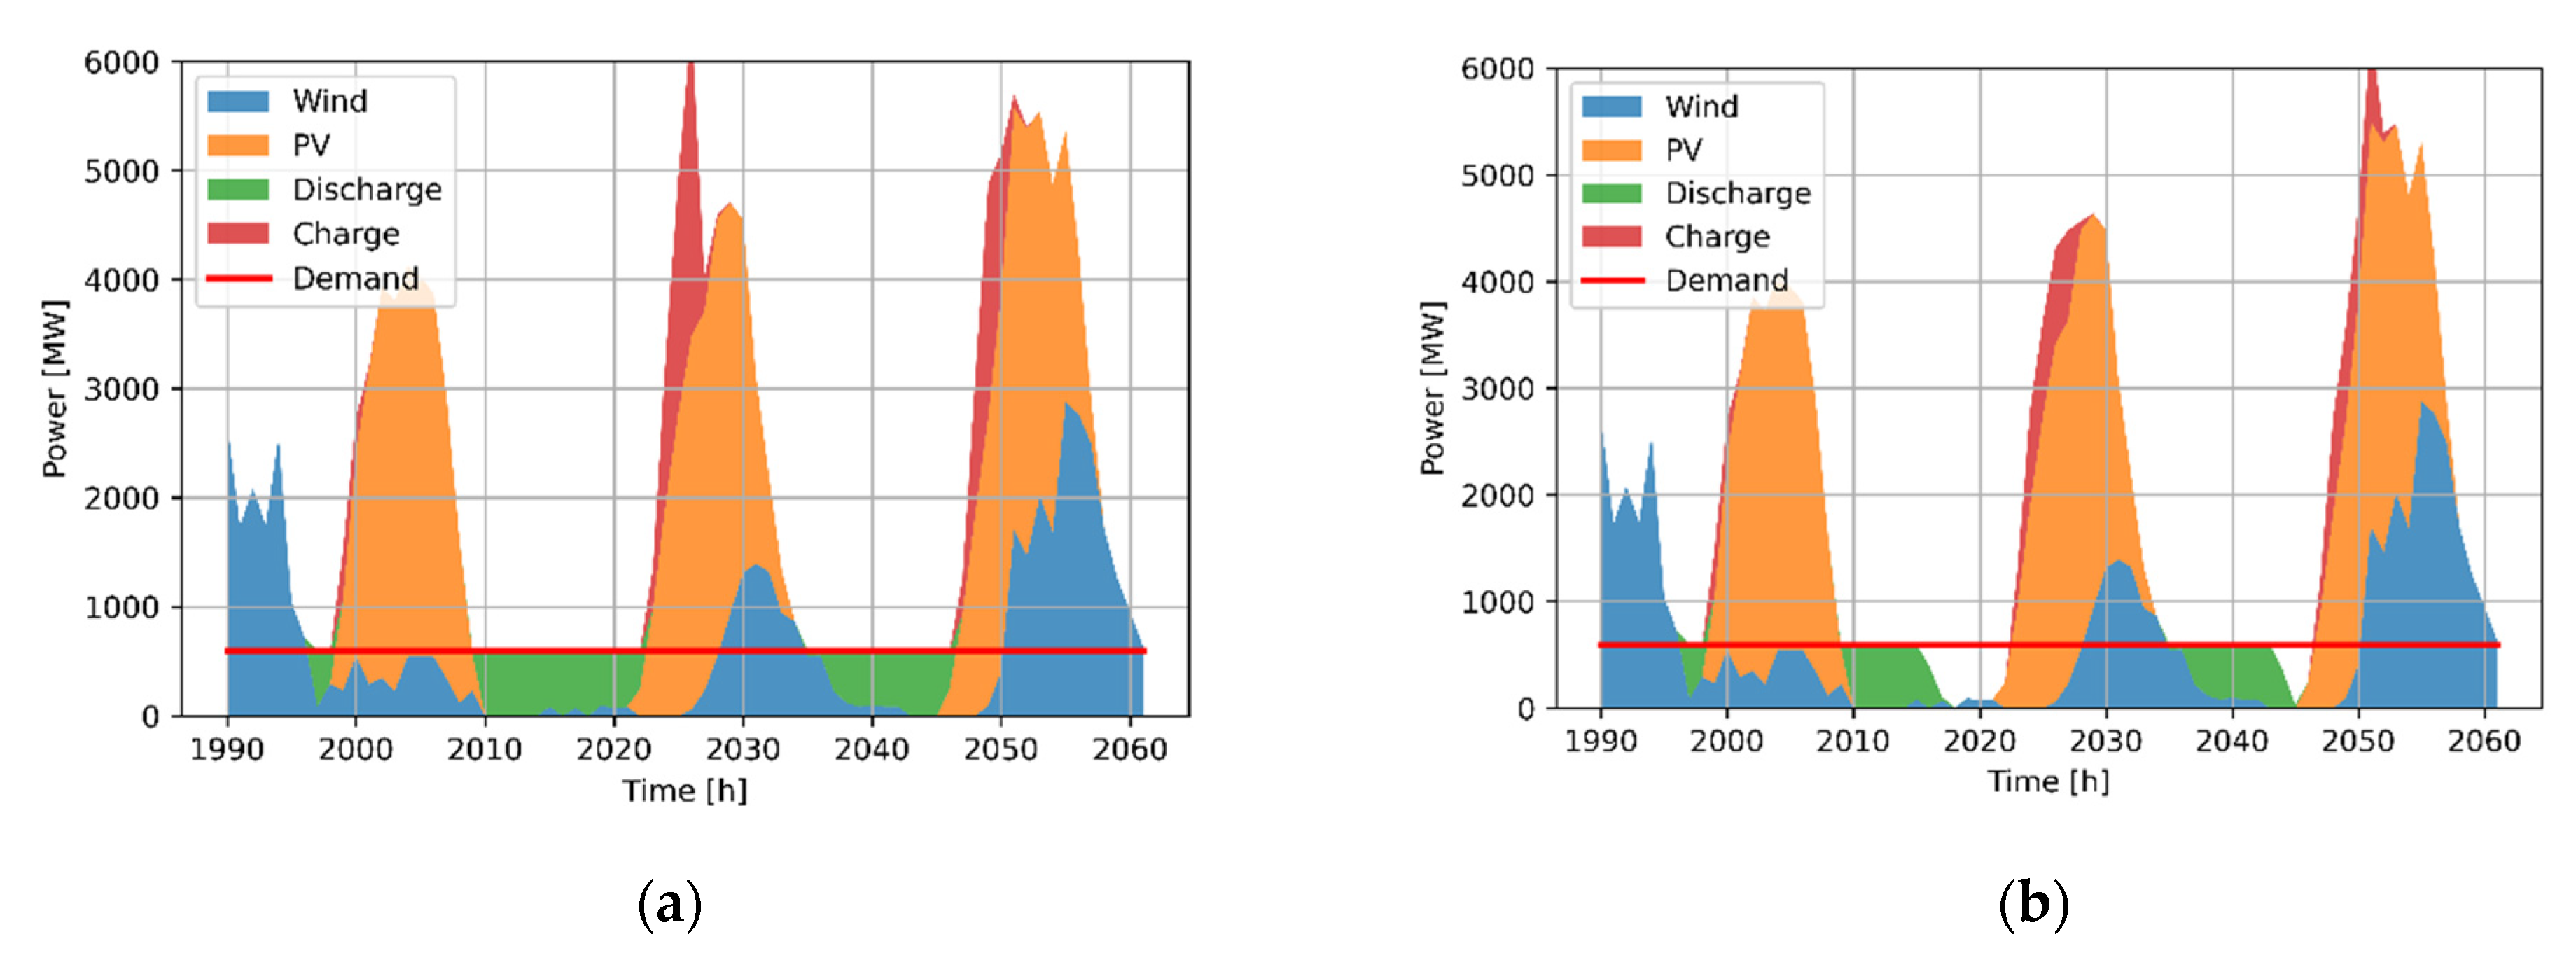
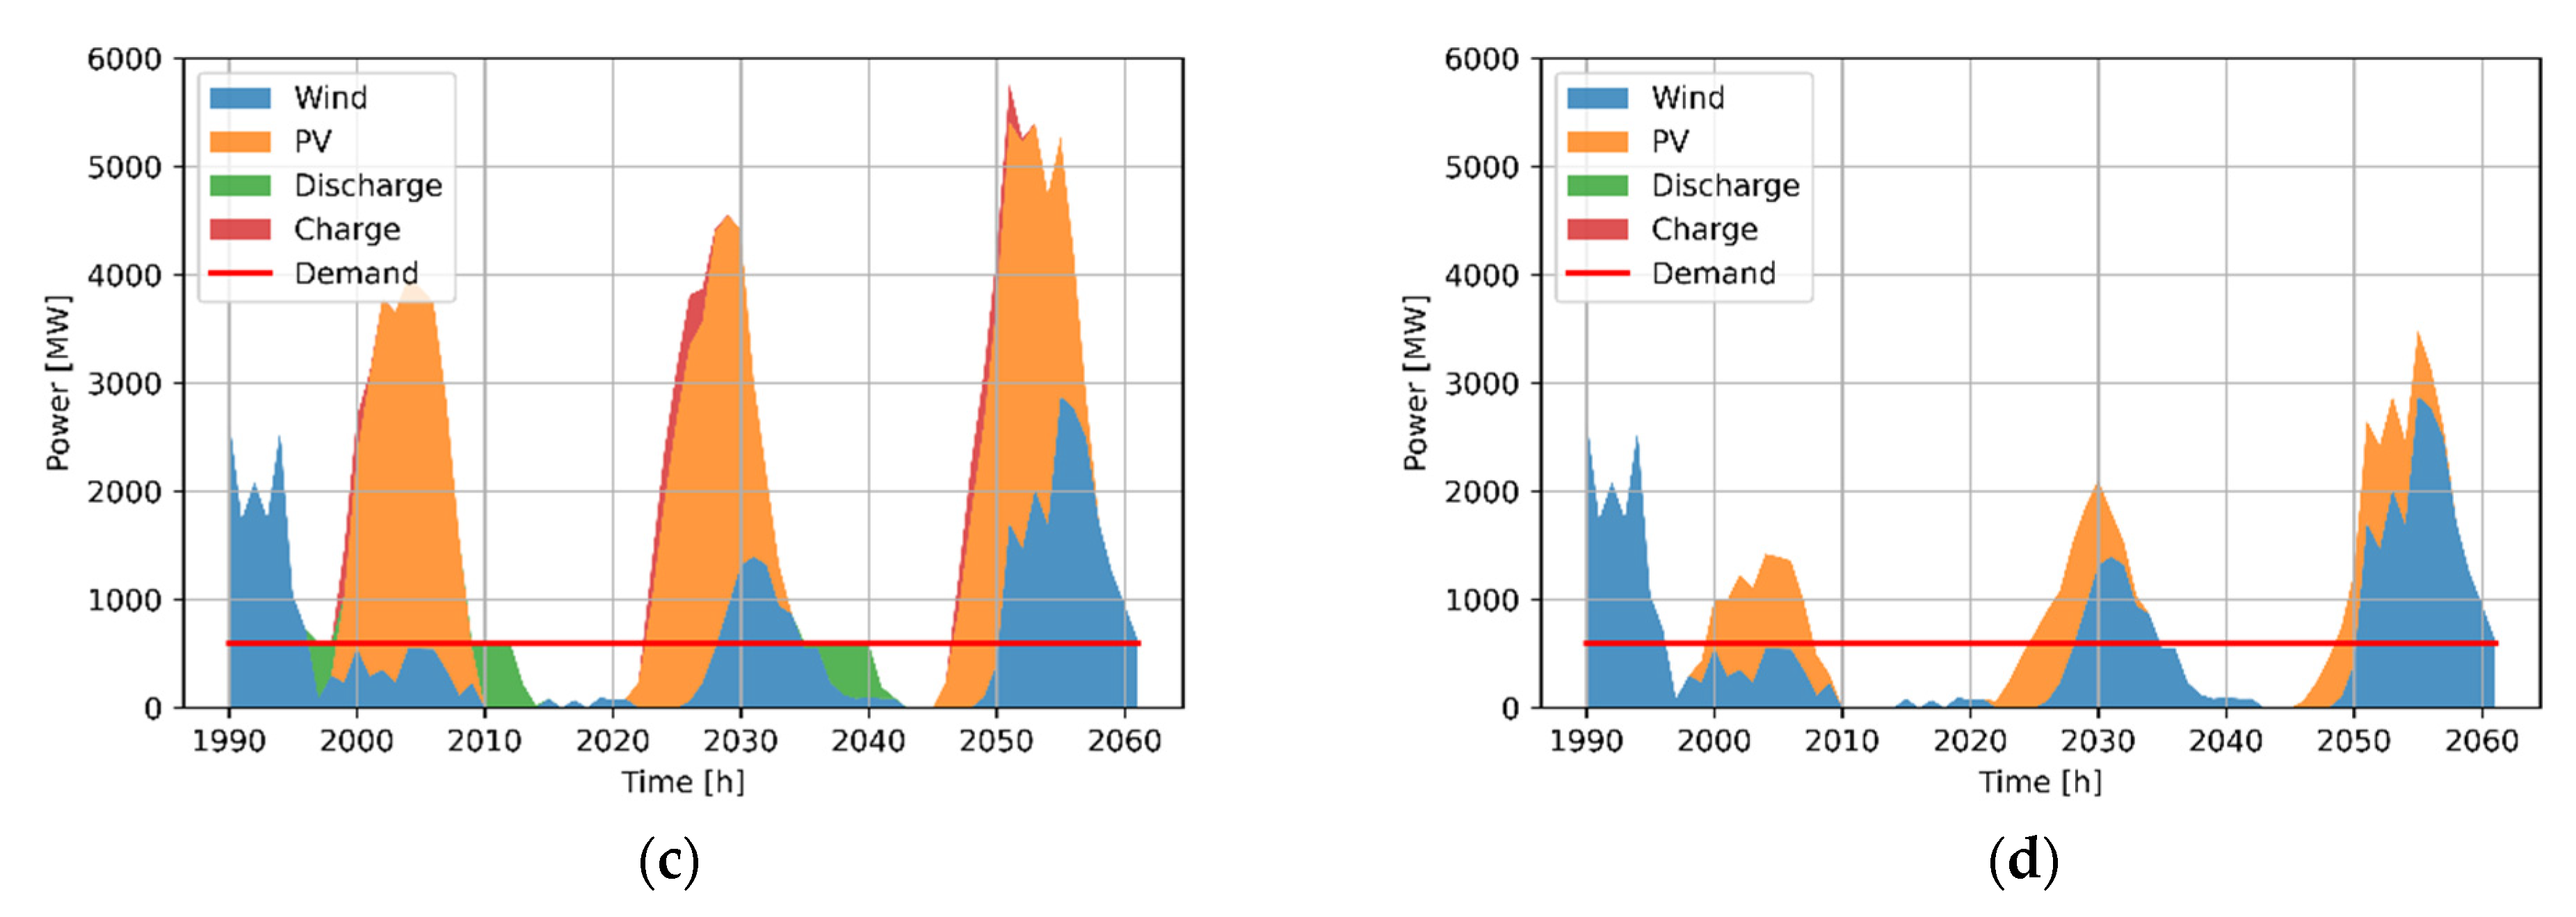
Figure 4 presents a typical time-history of the hour data for each component for the cases of to . It can be seen that for the case of minimum storage installation the excess energy is about 2.6 to 3.8 times larger than the total demand of the calcination plant. It is interesting to observe that, for the case of , it is possible to achieve the renewable target without using any storage with a sufficiently large generation system.

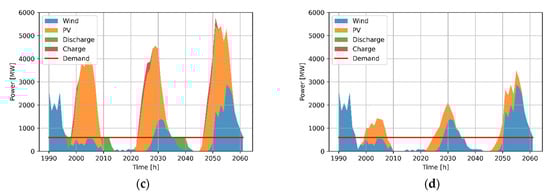
Figure 4.
Stacked power values for three typical days of generation and consumption in March for the configurations with minimum storage requirements for (a) , (b) , (c) , and (d) .
3.2. Economic Analysis
The system is first analyzed for the lowest capital cost as well as for the lower bound for the levelized cost of energy ) and the upper bound ) for both storage types are presented as outlined in Section 2.5.
3.2.1. Analysis of the Capital Cost
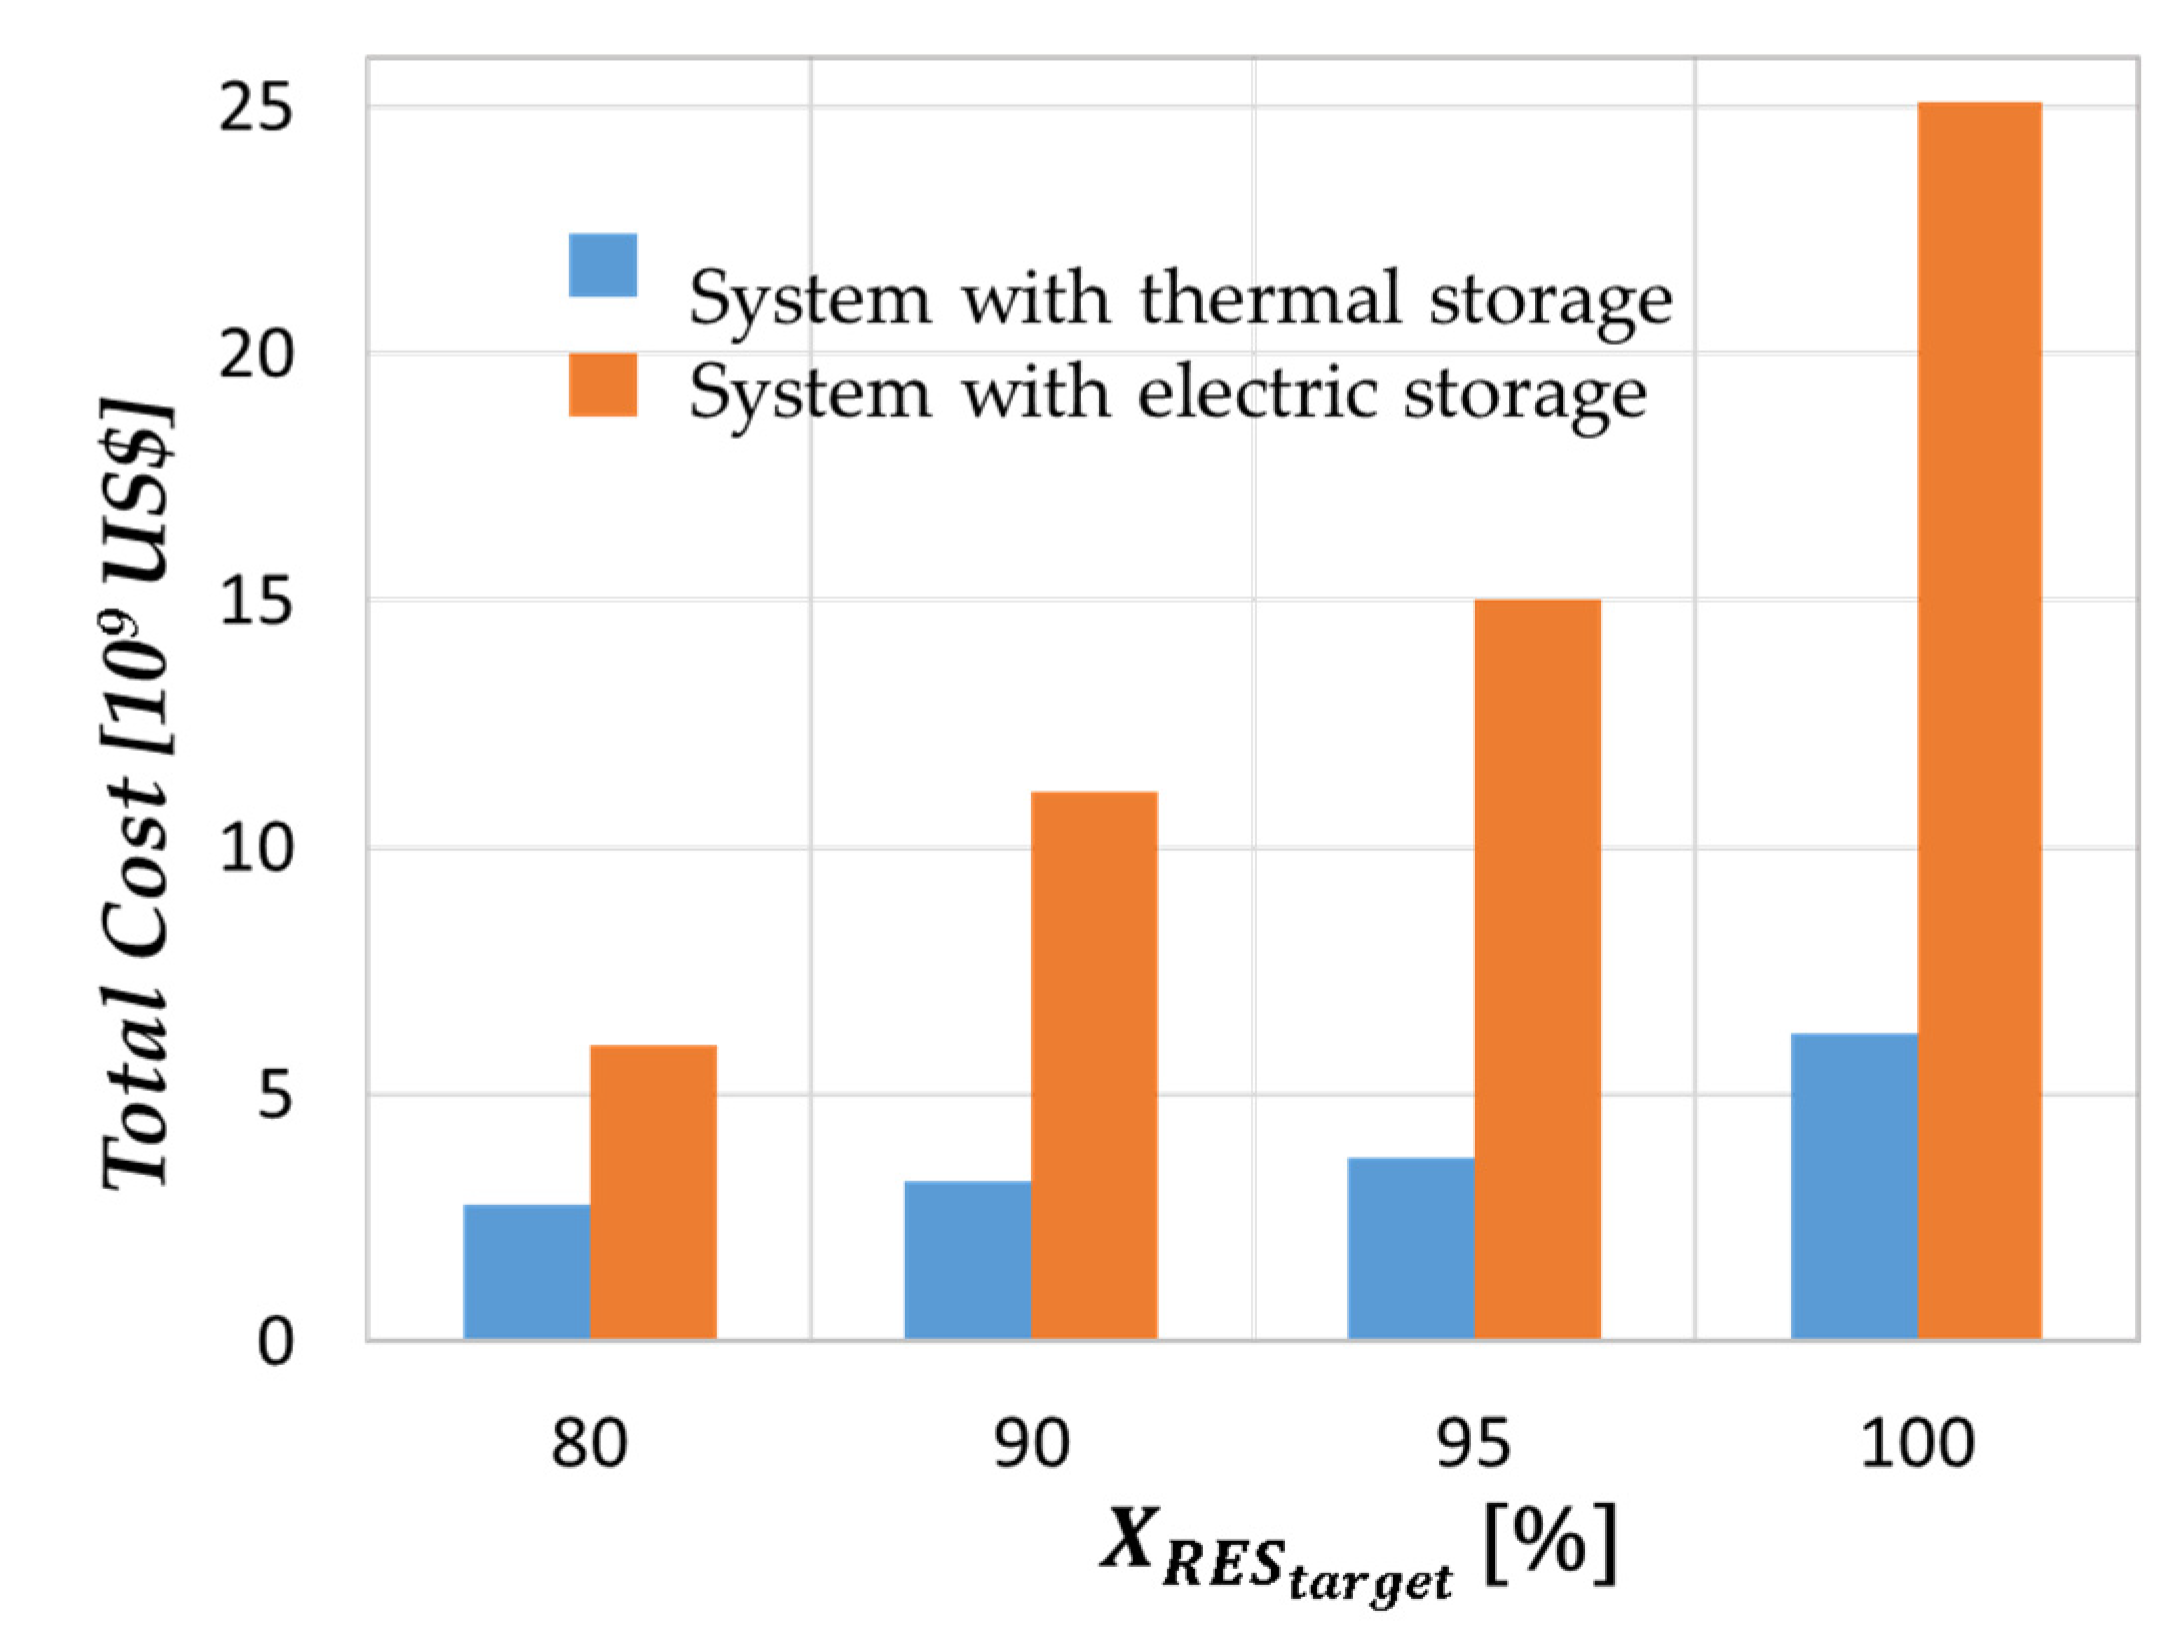
For each configuration of wind, PV and storage (thermal and electric battery), the system was priced using the assumptions of Table 5 to find the lowest initial investment cost and the results are shown in Table 7 and Figure 5. It can be seen that the systems using thermal storage are significantly cheaper than that of electric battery storage. An interesting observation is that optimizing for the lowest capital investment does not favor the systems with the smallest storage, see Section 3.1. Furthermore, due to the low thermal storage cost, the excess energy is much lower for the configurations with thermal storage systems. For the cost for the system utilizing thermal storage is less than half of that of the system using electric battery storage. The advantage of thermal storage over electric battery storage increases with the . For , the ratio between the total cost for a system with electrical and thermal storage is about four.
Table 7.
Summary of the configurations that have the lowest capital initial cost for each REStarget from 80% to 100%.
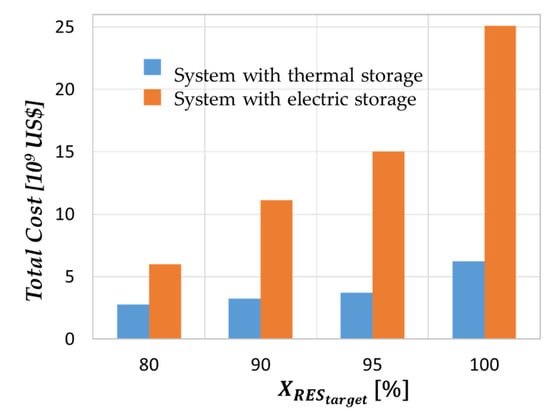
Figure 5.
Illustration of the effect of using thermal storage vs. electric battery storage. The difference in system cost grows larger with the renewable energy share target as defined in Equation (2) .
3.2.2. Analysis of the Upper Bound of the LCOEU
The scenario that assumes no export of the excess energy corresponds to an energy island. The as defined in Equation (5) only ascribes value to the energy that can be consumed directly by the calcination plant, with all excess energy above this fixed demand assumed to be dumped or curtailed with no value. This case corresponds to an upper bound for the cost of renewable process heat. If a grid-connected system turns out to be more expensive, the island system can be employed.
Table 8 presents the configuration of wind/PV generators and storage that were found to yield the minimum for both types of energy storage technology and all of the four target values of the RES. These configurations are similar to, but not the same as, those with the minimum investment cost, presented in Section 3.2.1, due to the influence of the different operational costs for each component. Consistent with the results above, the use of thermal storage reduces the cost of electric heating by a factor of 2.1 compared with the utilization of electric battery storage for . Furthermore, this factor increases to 3.7 for the case of . Indeed, the system providing 100% renewable heat to the system using thermal storage is more economical than the system providing only 80% renewable heat using electric battery storage devices. It can also be seen that the utilization of thermal storage favors configurations with little excess energy due to the low cost of thermal storage. Figure 6 presents the for all optimal configurations.
Table 8.
Configurations with the upper bound of the LCOE for both storage technologies.
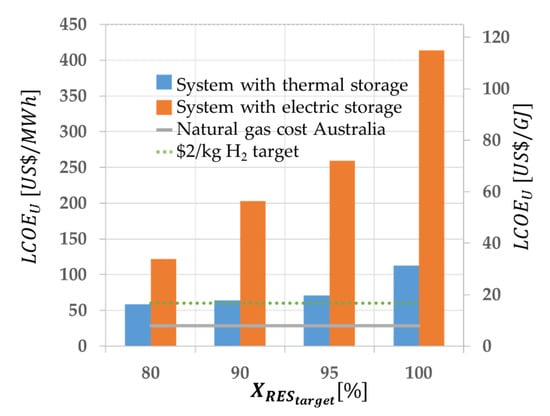
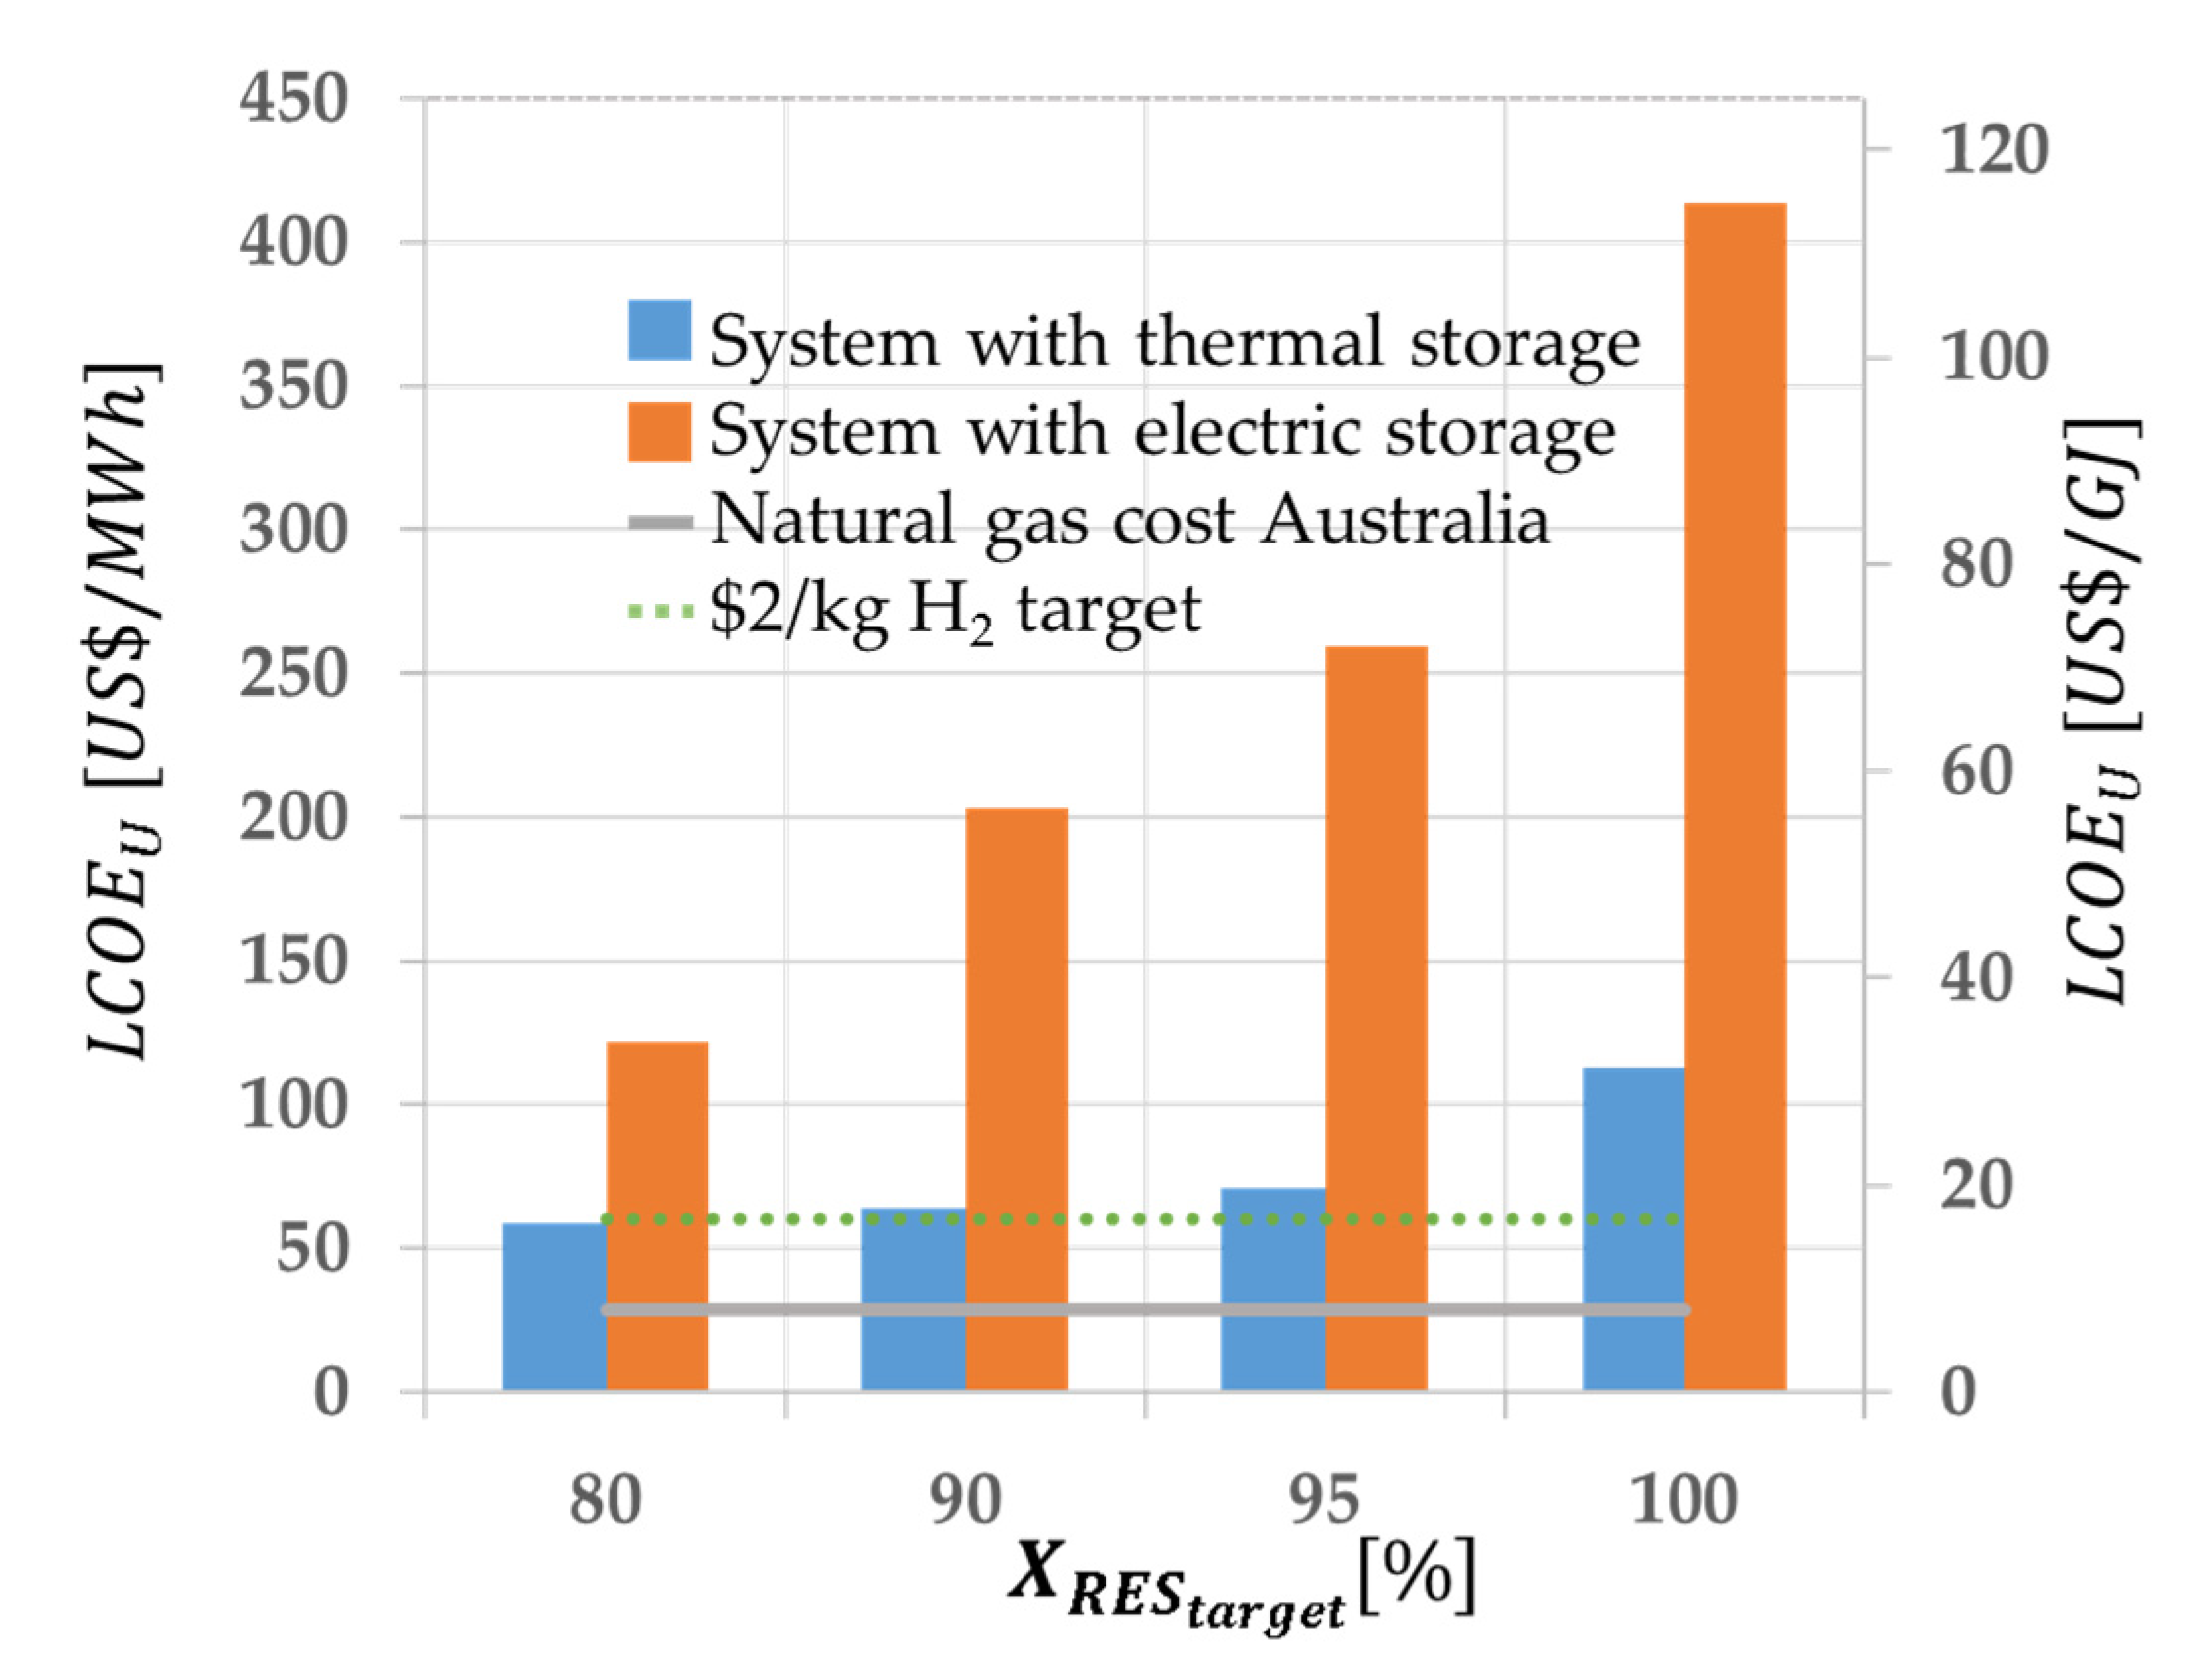
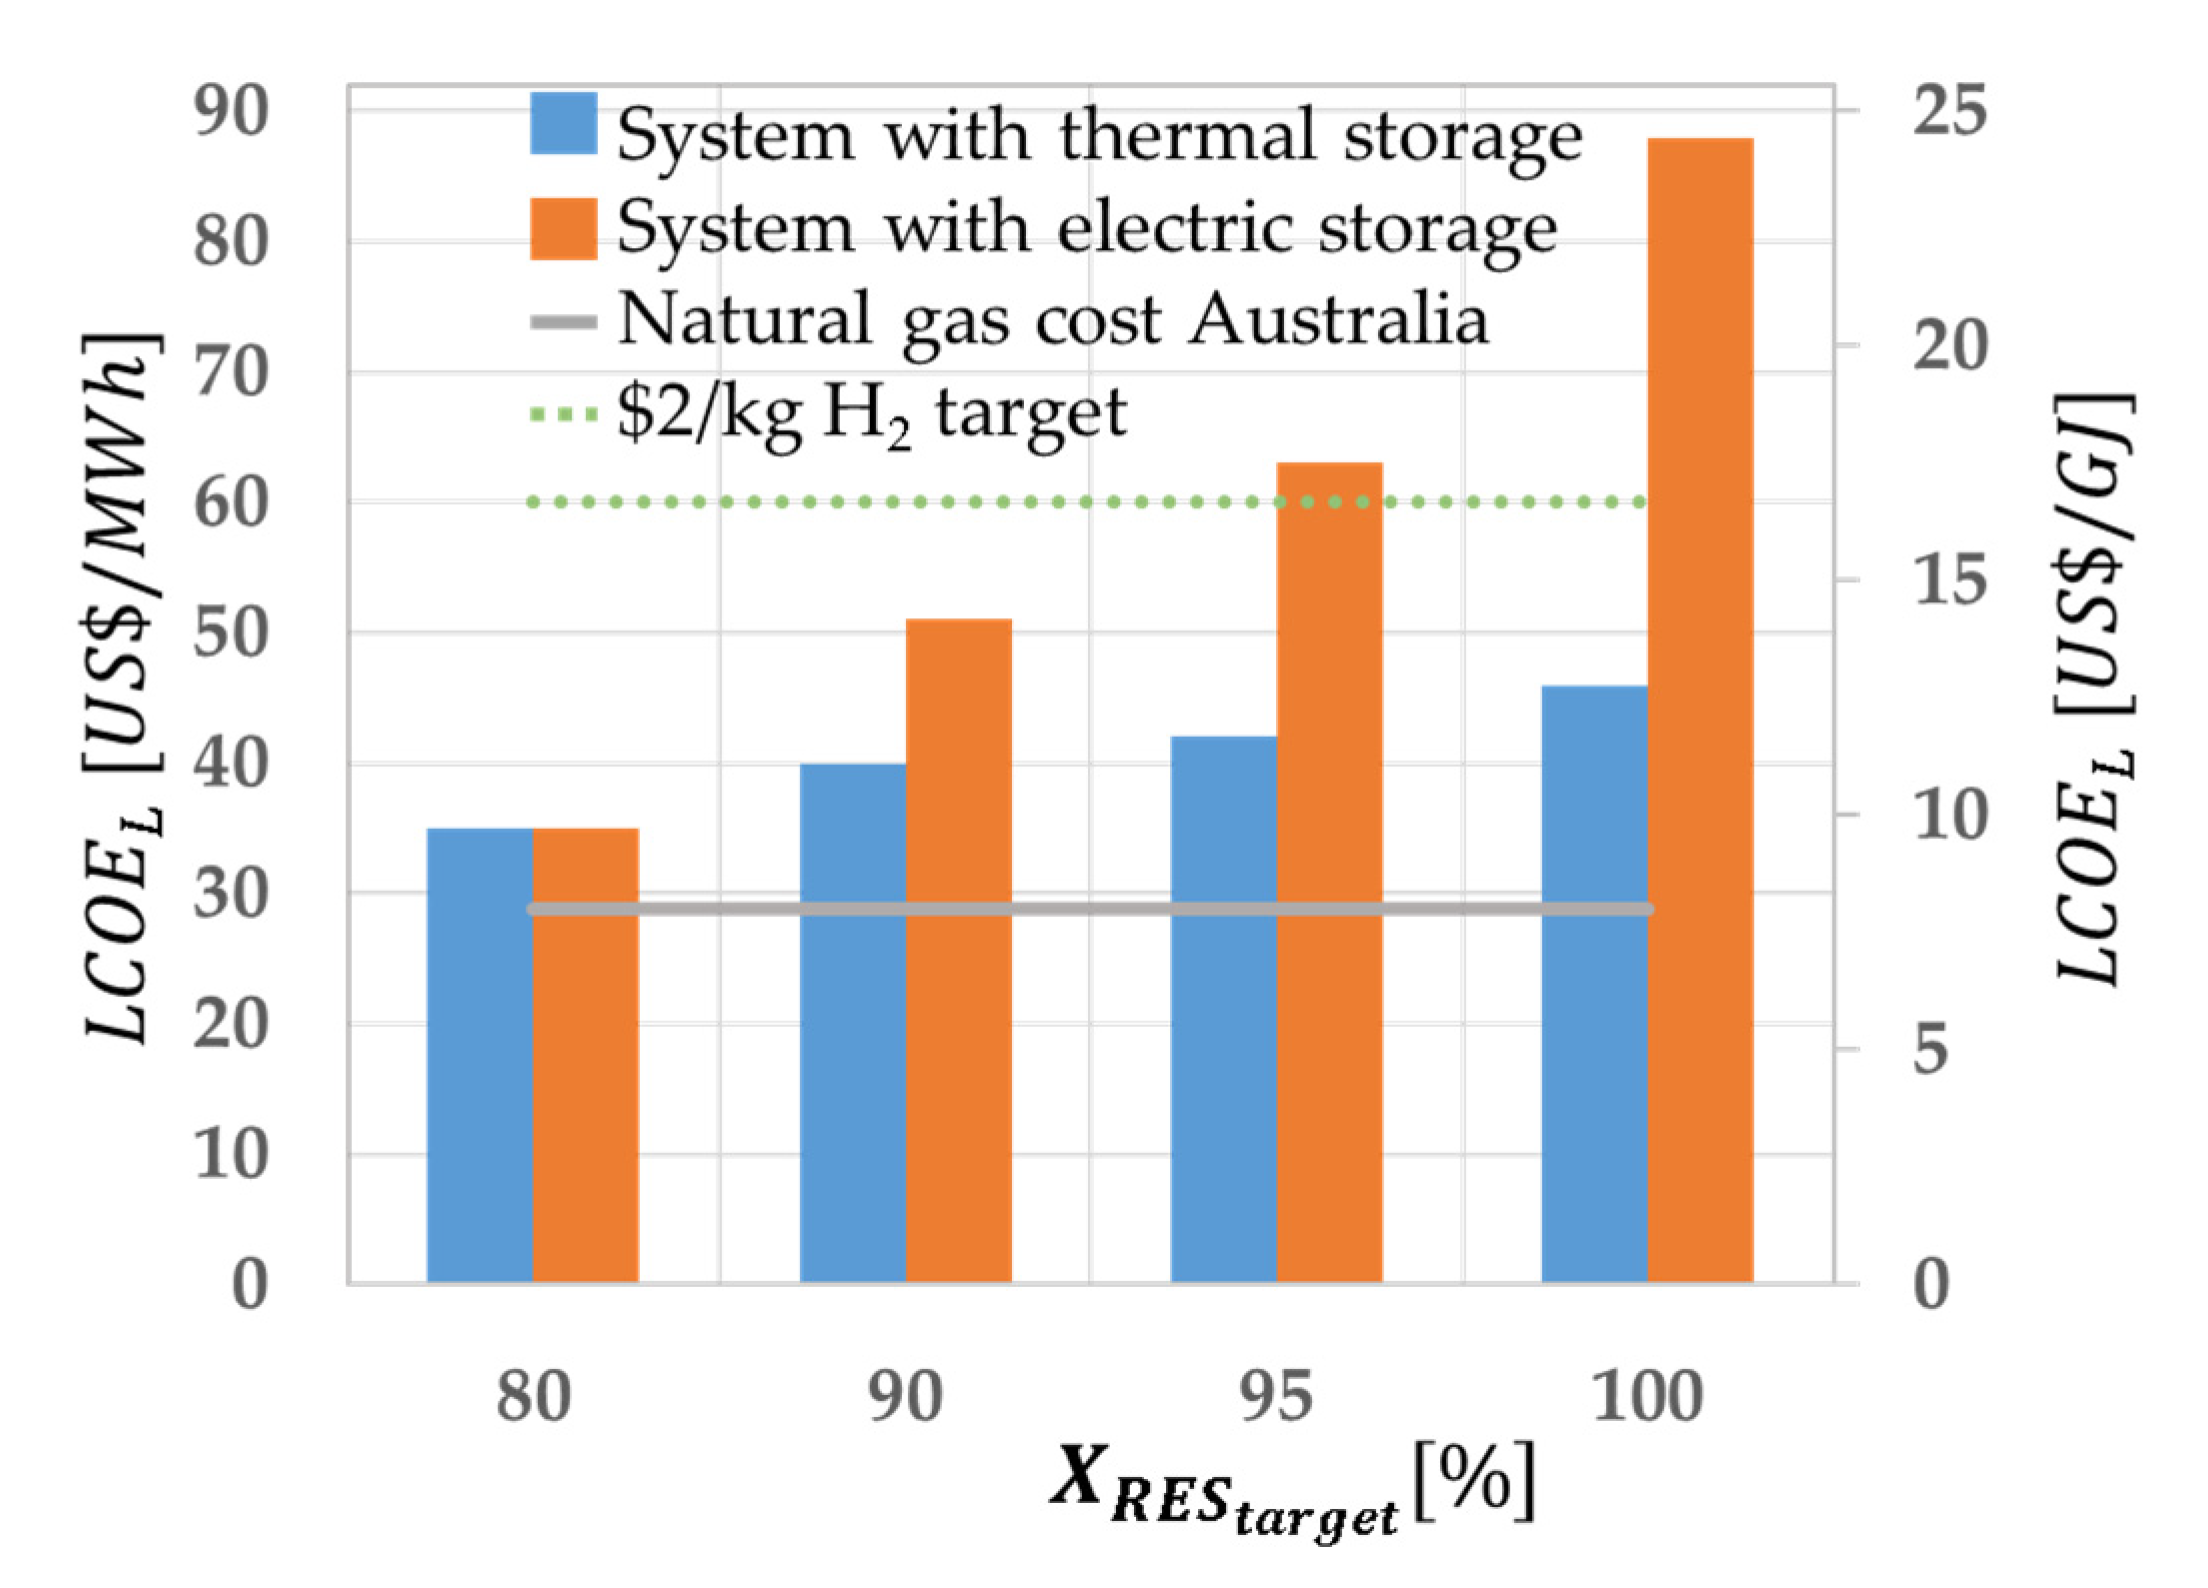
Figure 6.
The levelized cost of energy as a function of the renewable share targets defined in Equation (2) for the case in which the excess energy is not utilized or exported (to the grid). The values are compared with a reference natural gas cost of USD 8/GJ in Australia (2021) [40] and the USD 2/kg target for hydrogen production [41].
3.2.3. Analysis of the Lower Bound for the LCOEL
The validity of the calculated values for the lower bound of the depends not only on the possibility of grid access but also on the capacity of the grid to absorb these large amounts of energy at times of surplus. The cost for grid connection is not included as it goes beyond the scope of this study. The scenario in which the excess energy produced by the generation system can be utilized results in a significantly LCOE for both storage technologies. Furthermore, since this simplified scenario does not include time-of-day pricing, it does not make economic sense to install storage at all for the target renewable energy share and large quantities of energy are fed into the grid. The is equal to the power production cost for the case of as the assumptions do not ascribe value for storage, and is also equal for thermal and battery storage configurations. However thermal storage does offer an advantage for higher values of , e.g., for , where the configuration utilizing thermal storage delivers energy at a levelized cost 1.9 times cheaper than the system utilizing battery storage devices. Table 9 and Figure 7 present the optimal configuration when energy export is allowed for each .
Table 9.
Lower estimate for the LCOE under the assumption that all energy can be used or exported to the grid for each .

Figure 7.
The LCOE as a function of the renewable share targets defined in Equation (2) for the case in which the excess electrical energy is utilized or exported (to the grid). The LCOE values are compared with a reference natural gas cost in Australia in 2021 of USD 8/GJ [40] and the USD 2/kg target for hydrogen production [41].
Table 10 presents a summary of the upper and lower bounds for the LCOE and the the ratio between them. For the case of electric battery storage the impact of the excess is much greater than for the thermal case, with a ratio of 3.5 to 4.7 bewteen the upper and the lower bound for and , respectively. However, for the use of thermal storage the ratio between the upper and the lower bound ranges from 1.7 to 2.5 for and , respectively.
Table 10.
Summary of the minimum LCOE values calculated for all configurations. The ratio between the two scenarios is further shown.
3.2.4. Comparison to the Natural Gas Cost in Australia and Hydrogen Production Target Price
For the case in which the RES target is 80%, the upper bound for the cost of renewable electrical heat is USD 16.4/GJ (USD 59/MWh), which is slightly more than double the cost of natural gas combustion in Australia of USD 8/GJ [40] and similar to the US department of energy’s USD 2/kg target for hydrogen production (USD 16.7/GJ) [41]. For a RES of 100%, the upper bound for the is USD 31.4/GJ (USD 113/MWh) with thermal storage. None of the upper bound cost estimates are competitive with natural gas without a subsidy. The lower bound for a RES of 80% results in a configuration where no storage is warranted and due to the assumed export of energy. The LCOE is equal to the combined production of electricity from solar and wind plants. This lower bound is USD 9.7/GJ (USD 35/MWh) and about 20% above the reference cost of natural gas [40]. The lower bound for a RES of 100% is USD 12.8/GJ (USD 46/MWh), which is some 1.6 times more expensive for the case of full utilization of the energy generated. All lower bound values using thermal storage are lower than the USD 2/kg target [41]. As for the upper bounds, none of the lower bound cost estimates are competitive with natural gas.
If the differences in cost between natural gas combustion and renewable electric heating using thermal storage are translated into the necessary carbon cost to reach price parity the carbon cost needs to reach in the upper bound of USD 434/ for a RES of 100% and USD 116/ for a RES of 80%. In the lower bound with grid export or other utilization of the excess energy, the required carbon cost is lower USD 31/ for RES of 80% and USD 86/ for RES of 100%, respectively.
The cost of natural gas in Australia has increased from about USD 3.6/GJ (USD 13.1/MWh) in 2011 to USD 8.0/GJ (USD 29.1/MWh) in 2021 and this trend is expected to continue [40]. On the other hand, the cost for onshore wind turbines has more than halved and the cost for solar photovoltaics has decreased by a factor of about 6.6 at the same time [42]. Furthermore, global uptake of renewable technologies and technological advances will most likely further reduce this cost. These two trends could contribute to increased competitiveness of renewable electric heating in the future.
4. Conclusions
It can be concluded that the utilization of thermal energy storage can significantly reduce the cost of supplying high temperature industrial process heat from variable renewable electricity over the use of electric battery storage systems. The utilization of thermal storage reduces the upper bound of the LCOH by a factor of 2.1 for a RES of 80% and a factor of 3.7 for a fully renewable system when compared to the use of battery storage.
The lower bound cost is competitive with the envisioned future hydrogen production cost and only moderate CO2 emission reduction is needed to achieve competitiveness, for RES = 80%. However, it is unlikely that a full grid export is possible, so that this lower-bound is not expected to be achievable without further cost reductions in production or other investments in grid connectivity. This is because the time at which this renewable generation is in surplus will coincide with the time at which other renewable sources in the grid (PV and wind turbines) are also producing a potential excess. This will inhibit the capacity to monetize all of the excess. Additional capital cost is also needed to connect the system to the grid, which also needs to be recovered. Furthermore, any export of surplus energy will have an adverse effect on the spot price, to most likely lower it further [43]. It should also be noted that the LCOE is only a first order indicator of viability that does not account for the complexities of markets or of interactions with the electricity grid. Further study and a realistic market model are therefore necessary to better estimate the value of the exported energy.
While electrification to replace natural gas is not presently economically viable in Australia without a green premium or a carbon tax, the relative viability can be expected to increase in the future. This is due to the growing global uptake of renewable technologies, which will likely reduce the cost for PV and wind generators further and introduce new approaches to managing variability. It should also be noted that the capacity to compare the present detailed estimates of LCOH with alternative approaches to deliver high temperature process heat with net-zero CO2 emissions, such as from hydrogen or concentrated solar thermal energy, is presently limited by a lack of alternative calculations of full systems in comparable detail. It is hoped that the current study will stimulate such comparative assessments.
Author Contributions
Conceptualization, P.I.; data curation, P.I.; formal analysis, A.P.; funding acquisition, G.J.N.; methodology, P.I.; software, A.P.; supervision, W.S. and P.I.; visualization, A.P. and P.I.; writing—original draft, A.P. and P.I.; writing—review & editing, A.P., W.S., G.J.N. and P.I. All authors have read and agreed to the published version of the manuscript.
Funding
This research was funded by the Australian Renewable Energy Agency, ARENA, grant number 2015/RND054. The APC was also funded by the Australian Renewable Energy Agency, ARENA, grant number 2015/RND054.
Institutional Review Board Statement
Not applicable.
Informed Consent Statement
Not applicable.
Data Availability Statement
Not applicable.
Conflicts of Interest
The authors declare no conflict of interest.
References
- Climate Change 2022: Impacts, Adaptation and Vulnerability. Available online: https://www.ipcc.ch/report/ar6/wg2/ (accessed on 19 April 2022).
- Lovegrove, K.; Alexander, D.; Bader, R.; Edwards, S.; Lord, M.; Mojiri, A.; Rutovitz, J.; Saddler, H.; Stanley, C.; Urkalan, K.; et al. Renewable Energy Options for Industrial Process Heat; Australian Renewable Energy Agency (ARENA): Turner, Australia, 2019. [Google Scholar]
- Cozzi, L.; Gould, T. World Energy Outlook 2019; International Energy Agency: Paris, France, 2019. [Google Scholar]
- Kempener, R.; Saygin, D. Renewable Energy in Manufacturing: A Technology Roadmap for REmap 2030; International Renewable Energy Agency (Irena): Abu Dhabi, United Arab Emirates, 2014. [Google Scholar]
- Wei, M.; McMillan, C.A.; de la Rue du Can, S. Electrification of Industry: Potential, Challenges and Outlook. Curr. Sustain. Renew. Energy Rep. 2019, 6, 140–148. [Google Scholar] [CrossRef]
- Renewable Energy Options for the Industry Sector: Global and Regional Potential Until 2030—Background to “Renewable Energy in Manufacturing” Technology Roadmap (IRENA, 2014a); Background Paper; Irena: Abu Dhabi, United Arab Emirates, 2015.
- Global Energy Transformation: A Roadmap to 2050, 2019th ed.; Irena International Renewable Energy Agency: Abu Dhabi, United Arab Emirates, 2019; p. 52.
- Bogdanov, D.; Breyer, C. North-East Asian Super Grid for 100% Renewable Energy Supply: Optimal Mix of Energy Technologies for Electricity, Gas and Heat Supply Options. Energy Convers. Manag. 2016, 112, 176–190. [Google Scholar] [CrossRef]
- Blakers, A.; Lu, B.; Stocks, M. 100% Renewable Electricity in Australia. Energy 2017, 133, 471–482. [Google Scholar] [CrossRef]
- Garnout, R. Superpower: Australia’s Low-Carbon Opportunity; Schwartz Publishing Pty, Limited: Melbourne, Australia, 2019; ISBN 978-1-76064-174-0. [Google Scholar]
- Strasser, M.N.; Selvam, R.P. A Cost and Performance Comparison of Packed Bed and Structured Thermocline Thermal Energy Storage Systems. Sol. Energy 2014, 108, 390–402. [Google Scholar] [CrossRef] [Green Version]
- Storage and Hybridization of Nuclear Energy—1st Edition. Available online: https://www.elsevier.com/books/storage-and-hybridization-of-nuclear-energy/bindra/978-0-12-813975-2 (accessed on 19 April 2022).
- Williams, F.; Schmidt, H.-W. Flash- and CFB Calciners, history and difficulties of development of two calcination technologies. In Light Metals 2012; Suarez, C.E., Ed.; John Wiley & Sons, Inc.: Hoboken, NJ, USA, 2012; pp. 135–140. ISBN 978-1-118-35925-9. [Google Scholar]
- Global Renewables Outlook: Energy Transformation 2050; Irena: Abu Dhabi, United Arab Emirates, 2020.
- Jenkins, B.; Bertrand, C. Improvements in the Design and Operation of Alumina Flash Calciners. IFRF Combust. J. 2001, 10, 2–18. [Google Scholar]
- Projected Costs of Generating Electricity 2020–Analysis. Available online: https://www.iea.org/reports/projected-costs-of-generating-electricity-2020 (accessed on 20 April 2022).
- German Aerospace Center (DLR); Institute for Solar Research of the DLR. Greenius—The Green Energy System Analysis Tool. Available online: https://www.dlr.de/sf/en/desktopdefault.aspx/tabid-11688/20442_read-44865/ (accessed on 20 April 2022).
- Vela Solaris, A.G. Polysun Simulation Software; Vela Solaris AG: Winterthur, Switzerland, 2020. [Google Scholar]
- Global Solar Atlas Data Obtained from the Global Solar Atlas 2.0, a Free, Web-Based Application Is Developed and Operated by the Company Solargis s.r.o. on Behalf of the World Bank Group, Utilizing Solargis Data, with Funding Provided by the Energy Sector Management Assistance Program (ESMAP). Available online: https://globalsolaratlas.info (accessed on 20 April 2022).
- Global Wind Atlas Data Obtained from Global Wind Atlas 3.0, a Free, Web-Based Application Developed, Owned and Operated by the Technical University of Denmark (DTU). The Global Wind Atlas 3.0 Is Released in Partnership with the World Bank Group, Utilizing Data Provided by Vortex, Using Funding Provided by the Energy Sector Management Assistance Program (ESMAP). Available online: https://globalwindatlas.info (accessed on 20 April 2022).
- European Commision Joint Resaerch Centre PVGIS 5.2. Available online: https://joint-research-centre.ec.europa.eu/pvgis-photovoltaic-geographical-information-system/pvgis-releases/pvgis-52_en (accessed on 17 May 2022).
- Australia–Asia Wind Energy Association. Available online: https://www.asiawind.org/research-data/market-overview/australia/ (accessed on 22 April 2022).
- Renewable Energy Capacity Factor Maps. 2021. Available online: https://ecat.ga.gov.au/geonetwork/srv/api/records/0b2f1c73-0358-4ff0-9572-2d1ab5077566 (accessed on 22 April 2022).
- Zunft, S.; Hänel, M.; Krüger, M.; Dreißigacker, V.; Göhring, F.; Wahl, E. Jülich Solar Power Tower—Experimental Evaluation of the Storage Subsystem and Performance Calculation. J. Sol. Energy Eng. 2011, 133, 031019. [Google Scholar] [CrossRef]
- Sardeshpande, V.; Anthony, R.; Gaitonde, U.N.; Banerjee, R. Performance Analysis for Glass Furnace Regenerator. Appl. Energy 2011, 88, 4451–4458. [Google Scholar] [CrossRef]
- Hänchen, M.; Brückner, S.; Steinfeld, A. High-Temperature Thermal Storage Using a Packed Bed of Rocks–Heat Transfer Analysis and Experimental Validation. Appl. Therm. Eng. 2011, 31, 1798–1806. [Google Scholar] [CrossRef]
- Toman, M.; Cipin, R.; Cervinka, D.; Vorel, P.; Prochazka, P. Li-Ion Battery Charging Efficiency. ECS Trans. 2016, 74, 37. [Google Scholar] [CrossRef]
- Weitemeyer, S.; Kleinhans, D.; Vogt, T.; Agert, C. Integration of Renewable Energy Sources in Future Power Systems: The Role of Storage. Renew. Energy 2015, 75, 14–20. [Google Scholar] [CrossRef] [Green Version]
- Prina, M.G.; Weitemeyer, S.; Vaccaro, R.; Manzolini, G.; Kleinhans, D.; Garegnani, G.; Moser, D. Large-Scale Integration of Renewable Energy Sources: Technical and Economical Analysis for the Italian Case. In Proceedings of the 32nd European Photovoltaic Solar Energy Conference and Exhibition, WIP, Munich, Germany, 25 July 2016; pp. 2670–2674. [Google Scholar] [CrossRef]
- Kueh, K.C.Y.; Nathan, G.J.; Saw, W.L. Storage Capacities Required for a Solar Thermal Plant to Avoid Unscheduled Reductions in Output. Sol. Energy 2015, 118, 209–221. [Google Scholar] [CrossRef]
- National Renewable Energy Laboratory; Sandia National Laboratory; SunSpec Alliance, and the SunShot National Laboratory Multiyear Partnership; (SuNLaMP) PV O&M Best Practices Working Group. Best Practices for Operation and Maintenance of Photovoltaic and Energy Storage Systems; NREL/TP-7A40-73822; National Renewable Energy Laboratory: Golden, CO, USA, 2018. [Google Scholar]
- Stehly, T.; Beiter, P.; Duffy, P. 2019 Cost of Wind Energy Review. Renew. Energy 2020, 86, 1756710. [Google Scholar]
- Onshore Wind Power Installation Costs 2020. Available online: https://www-statista-com.libproxy.unibz.it/statistics/506774/weighted-average-installed-cost-for-onshore-wind-power-worldwide/ (accessed on 21 April 2022).
- US Wind O&M Costs Estimated at $48,000/MW; Falling Costs Create New Industrial Uses: IEA | Reuters Events | Renewables. Available online: https://www.reutersevents.com/renewables/wind-energy-update/us-wind-om-costs-estimated-48000mw-falling-costs-create-new-industrial-uses-iea (accessed on 21 April 2022).
- Vartiainen, E.; Masson, G.; Breyer, C.; Moser, D.; Román Medina, E. Impact of Weighted Average Cost of Capital, Capital Expenditure, and Other Parameters on Future Utility-Scale PV Levelised Cost of Electricity. Prog. Photovolt. Res. Appl. 2020, 28, 439–453. [Google Scholar] [CrossRef] [Green Version]
- Solar PV Installation Cost Globally 2020. Available online: https://www.statista.com/statistics/809796/global-solar-power-installation-cost-per-kilowatt/ (accessed on 21 April 2022).
- Walker, H.; Lockhart, E.; Desai, J.; Ardani, K.; Klise, G.; Lavrova, O.; Tansy, T.; Deot, J.; Fox, B.; Pochiraju, A. Model of Operation-and-Maintenance Costs for Photovoltaic Systems; National Renewable Energy Lab. (NREL): Golden, CO, USA, 2020. [Google Scholar]
- Brinsmead, T.; Graham, P.; Hayward, J.; Ratnam, E.; Reedman, L. Future Energy Storage Trends: An Assessment of the Economic Viability, Potential Uptake and Impacts of Electrical Energy Storage on the NEM 2015–2035; CSIRO: Canberra, Australia, 2015. [Google Scholar]
- Sens, L.; Neuling, U.; Kaltschmitt, M. Capital Expenditure and Levelized Cost of Electricity of Photovoltaic Plants and Wind Turbines–Development by 2050. Renew. Energy 2022, 185, 525–537. [Google Scholar] [CrossRef]
- Gas Market Prices. Available online: https://www.aer.gov.au/wholesale-markets/wholesale-statistics/gas-market-prices (accessed on 22 April 2022).
- Hydrogen Production. Available online: https://www.energy.gov/eere/fuelcells/hydrogen-production (accessed on 27 April 2022).
- Renewable Power Generation Costs in 2020. Available online: https://www.irena.org/publications/2021/Jun/Renewable-Power-Costs-in-2020 (accessed on 22 April 2022).
- López Prol, J.; Steininger, K.W.; Zilberman, D. The Cannibalization Effect of Wind and Solar in the California Wholesale Electricity Market. Energy Econ. 2020, 85, 104552. [Google Scholar] [CrossRef]

Publisher’s Note: MDPI stays neutral with regard to jurisdictional claims in published maps and institutional affiliations. |
© 2022 by the authors. Licensee MDPI, Basel, Switzerland. This article is an open access article distributed under the terms and conditions of the Creative Commons Attribution (CC BY) license (https://creativecommons.org/licenses/by/4.0/).