1. Introduction
The last mile is the most expensive and most difficult part of the supply chain. This results from traffic congestion and high density of buildings, which are often historical. In the face of the urgent need to adapt transport activities to climate change, a large number of European cities have implemented sustainable urban logistics solutions, starting with basic ones such as time, size and emission restrictions, ending with sophisticated ones, such as the urban consolidation center. These projects do not always bring the effects anticipated at the planning stage. The reasons are the lack of pilot programs which would precede the implementation of the project itself as well as the lack of consultations with stakeholders.
The evaluation of city logistics measures through modeling is gaining greater attention every year. This trend can help stakeholders learn from the experiences of others and understand how new and innovative urban transport solutions can contribute to city liveability. According to Taniguchi et al., in the development of smart city logistics, the evaluation of sustainable urban distribution measures in mathematical models is essential for understanding their effects before introducing them, because each stakeholder has different goals and expectations [
1].
Additionally, the global COVID-19 outbreak has exposed shortcomings in logistics, such as poor emergency response capacity and high risk of infection during transport. The pandemic has significantly affected everyday life and urban logistics distribution. Many consumers have changed their buying habits to save lives and prevent the virus from spreading further. The pandemic is forcing more and more consumers to prefer e-commerce to meet their food needs, and this growing trend is expected to continue after the pandemic [
2]. The global epidemic and its unpredictable duration has had a huge impact on the development of cities and the lives of inhabitants in all its aspects. The logistics industry, especially city logistics, has been severely hit, e.g., by a lack of distribution personnel and a sharp increase in costs. Lockdowns and quarantines increased panicked residents’ demand for door-to-door supplies and services, making it difficult to meet the city’s basic needs with significantly reduced logistics deliveries. More importantly, delivery personnel were at high risk of contracting the virus [
3]. In terms of business-to-customer (B2C) e-commerce, total online sales increased significantly during the COVID-19 pandemic, as consumers felt safer when shopping from home. This growth in e-commerce has placed increased pressure on last mile logistics [
4]. COVID-19 has brought a significant change in urban mobility as well as an unprecedented growth in e-commerce around the world, thanks to the emergence of new ways of shopping and consumption habits. In this context, urban logistics plays a key role [
5]. Due to the impact of the COVID-19 pandemic, the on-demand delivery service, which combines mobile technology and city logistics, has gained immense popularity.
This situation showed that in a world where ceteris paribus does not apply, it is necessary to implement solutions that will increase efficiency and at the same time increase the resistance of city stakeholders to unforeseen incidents and events, which puts pressure on the industry. An efficient city logistics system allows for the movement of cargo at ever lower prices, and an effective system expresses the ability of stakeholders to ensure deliveries in terms of quantity, place, time and customer requirements. The difficulty in managing such a system relates to the various stakeholders involved and the constraints dictated by the urban structure and high levels of retail expansion and sustainability challenges [
6]. However, it is not enough for the city authorities to impose innovative, sustainable city logistics measures. Introduced spontaneously, even on the basis of the experiences of other cities, they will not bring the expected results if they are not discussed with stakeholders beforehand. Each stakeholder has different problems and goals, and the effectiveness of the introduced solutions depends on their matching to the needs of stakeholders.
Stakeholders’ awareness is the key success factor, because by discussing changes before implementing them, we can, on the one hand, make the stakeholders aware of the benefits and, on the other hand, recognize and, perhaps, minimize the stakeholders’ fears. For this reason, public consultations, carried out in the form of Freight Quality Partnership, should be obligatory.
The purpose of the article is to define the attitude of the business owners in a city towards chosen city logistics measures. The hypotheses were defined as follows:
Hypothesis 1. The size of the enterprise does not affect the declared willingness to implement the measure.
Hypothesis 2. The difficulty of implementing the measure affects the company’s declared willingness to implement it.
This survey has its limitations, especially for closed questions. The basic difficulties include the following issues:
- -
respondents often do not know the measures they are asked about and do not understand the idea of a particular measure,
- -
respondents often do not have time to devote to the interviewer, so they may respond indiscriminately to a given issue.
The structure of the paper is as follows. Following this introduction, a Literature Review is presented, then Methodology of the research and a Results are described. Following the Results, there is a Discussion section, followed by Conclusions and References.
2. Literature Review
In order to achieve an effective and environmentally friendly urban transport system, it is necessary to implement city logistics measures. One of the challenges is to model urban freight transport with multiple urban stakeholders. As there are many of them, their behavior in the study and assessment of city logistics measures should be considered [
7].
According to Firdausiyah et al., simulation and modeling methods are used to improve the decision-making process, especially in a multiagent environment. Multi-agent modeling is useful for understanding stakeholder behavior and interactions in urban logistics processes, as well as for examining the impact of city logistics measures [
8]. According to the analysis by Karakikes et al., the measures most often simulated are Intelligent Transport Systems (ITS) for freight monitoring and planning/routing, loading/unloading areas, multimodality for urban freight, urban consolidation centers and electric vehicles diffusion for business. On the other hand, the most common simulation technology (apart from custom-made ones) are traffic simulations, agent-based simulations, hybrid modeling, discrete-event simulations and system dynamics. It is worth noting that the tendency to use simulations to evaluate real case studies in urban freight transport began to increase after 2010. This may be due to the level of data delivery and acquisition, which has been increasing year over year, and to the development of simulation domains (user-friendly interfaces, computers with increased processing capacity). Databases are also better structured these days [
9]. Although city logistics has been researched in recent decades, according to Perboli et al., some shortcomings can be observed in the literature. First, simulations are often based on artificial data, which makes model validation difficult. Second, if the data come from empirical datasets, there is no standard way to collect them from multiple sources and generate results from multiple sources. Perboli et al. proposed an optimization in the field of generating aggregate results. They illustrated the proposals in a case study of e-commerce in Turin, where they fused data from the city’s transport network, statistics on vehicles and their arrival times, as well as data on demographic behavior and restrictions [
10]. Guo et al. noted that in research on the effectiveness of the implementation of urban logistics tools, sociological research is also necessary, allowing stakeholders’ involvement [
11].
Stathopoulos et al. [
12] presented a very interesting study on the openness of stakeholders towards selected tools. It showed differences in perception between individual groups of stakeholders such as policy-makers and supply and demand parties. According to the research by Browne et al. [
13], of all the planned or implemented city logistics projects in Germany, only about 12% succeeds. Benjelloun et al. [
14] explored similarities and differences in the characteristics of various city logistics projects so as to achieve a better understanding of their outcomes. The main conclusion was the lack of proper preparation before implementation, including lack of consultations with stakeholders. M. Kiba-Janiak [
15] presented the chances of implementing a given solution from the point of view of local authorities, using the Delphi method. The most important key success factors were:
stakeholders’ cooperation
funds access
logistics infrastructures access
including urban freight movement measures into the city transport policy.
Castrellón-Torres et al. [
16] claim that besides technological issues, some additional facts have to be taken into account:
collaboration between stakeholders and analysis of their needs and expectations,
dialogue as a crucial principle that builds trust and defines the involvement.
They also proved that a project needs recognition and synchronization of all actors engaged in the urban freight movement as well as establishing the institutional framework for urban freight transport. Additionally, they argued that the framework should be consistent with the structure of information management.
Also M. Kiba-Janiak [
15] claims that stakeholders’ willingness to cooperate and the following long-term cooperation are the most crucial opportunities for cities. City logistics measures cannot be introduced without consultation with the stakeholders. What is more, lack of cooperation can pose a serious threat. Another threat is the failure to collect data by most of the studied cities. Without real-time information, it is impossible for a local authority to take a successful strategic decision [
15].
As mentioned before, the success of implemented measures is influenced by whether or not the implementation was preceded by consultations with stakeholders, in other words, if the change was made voluntarily or compulsorily. An overview of the selected tools, depending on the implementation method and their impact related to the kind of obligation, is presented in
Table 1.
The review presented in
Table 1 shows that in cases when the measure is implemented voluntarily, the introduced tools most often result in benefits not only for the recipients themselves, but also for the general public. Pros and Cons indicate an impact on your audience and indicate a positive (+) or negative (−) impact, while an equal sign (=) shows little or no impact. The number of pluses and minuses reflects the intensity of the effect. Voluntary implementation can be facilitated by political levers such as pricing, incentives or a combination of both. Although financial incentives are widely known, the measures can also take the form of recognition or rewards that are non-financial. If voluntary deployment is not popular, regulations can be implemented to introduce change. In such a case, however, the benefits are smaller.
Only a few cities include Urban Freight Movement (UFT) in their policies. The most sophisticated document incorporating UFT into city policy is the Sustainable Urban Logistics Plan (SULP). As part of the SULPiTER project [
18], several dozen European cities were examined to identify the approach to building transport policy in the field of urban logistics. The European cities included in the analysis were selected on the basis of their size, participation in projects and other relevant characteristics. In total, 129 cities were selected for the analysis. The strategic documents were divided into five groups:
Sustainable Urban Mobility Plans (SUMPs) that address the transport of goods in the city (38 cities),
SUMPs that do not mention the transport of goods (7 cities),
Mobility plans, including freight transport (46 cities),
Logistic plans (6 cities),
SULPs (9 cities); 7 cities should be added to this number, because the SULPiTER project ended with the finalization of the SULP documents by another 7 cities.
In the next phase of the research, the sample of cities was reduced to 30 cities with accepted documents dealing with logistics issues. Then, 158 selected logistic solutions were identified in the chosen cities. Out of them, 58 best practices were selected and at the same time characterized on the basis of the available data. The selected solution was classified into 10 groups that were used for detailed analysis.
The following measures were identified:
loading and unloading bays
cargo bikes
“clean” vehicles
spatial planning taking the supply site into account
dedicated lanes for deliveries
delivery and service plans
mobile magazines
deliveries outside rush hours/night deliveries
logistics using the urban river
urban consolidation center.
Brussels and Paris are the most advanced cities in terms of city logistics of all the cities analyzed—in their strategic documents on transport policy, these cities included five different solutions. Interestingly, 14 out of the 30 cities plan to implement urban consolidation centers towards which stakeholders had a reserved attitude at the planning stage. Among the most popular means are also “clean” vehicles (planned in nine cities) and cargo bikes (planned in six cities).
The measures were then compared in terms of investment, operational costs and savings (
Table 2).
The successful introduction of city logistics measures is often related to the amount of financial capital invested in their implementation. The lower the investment demand, the greater the possibility of a successful implementation of the measure. The so-called soft measures (e.g., communication means, organizational measures) are often preferred by decision-makers over hard or investment-oriented measures (e.g., construction of a new street, new logistics terminal). The greater the savings, the greater the possibility and need to implement the measures. Savings can be measured over time, costs, CO2 emissions and energy.
In the literature on logistics, four groups of stakeholders are the most distinctive ones [
19]: suppliers/shippers, carriers (LSP companies), local administration and residents. However, this division does not take into account recipients/businesses located in the city, shops that place orders and private individuals generating e-commerce traffic. Only Ruesch and Glucker [
20], Russo and Comi [
21], as well as Macario et al. [
22] additionally incorporated the recipients, although Russo and Comi also added national authorities, and Macario et al. also included visitors. The research conducted by the author shows that the most reality-related division is the distinction of the following five stakeholder groups in the city, according to the division by Ruesch and Glucker:
Shippers—wholesalers or producers of goods
Carriers—forwarding and transport companies and their drivers
Recipients—shops, flats and offices
Administration—local government, city authorities
Residents—people living in urban areas who are consumers, residents and tourists.
3. Methodology
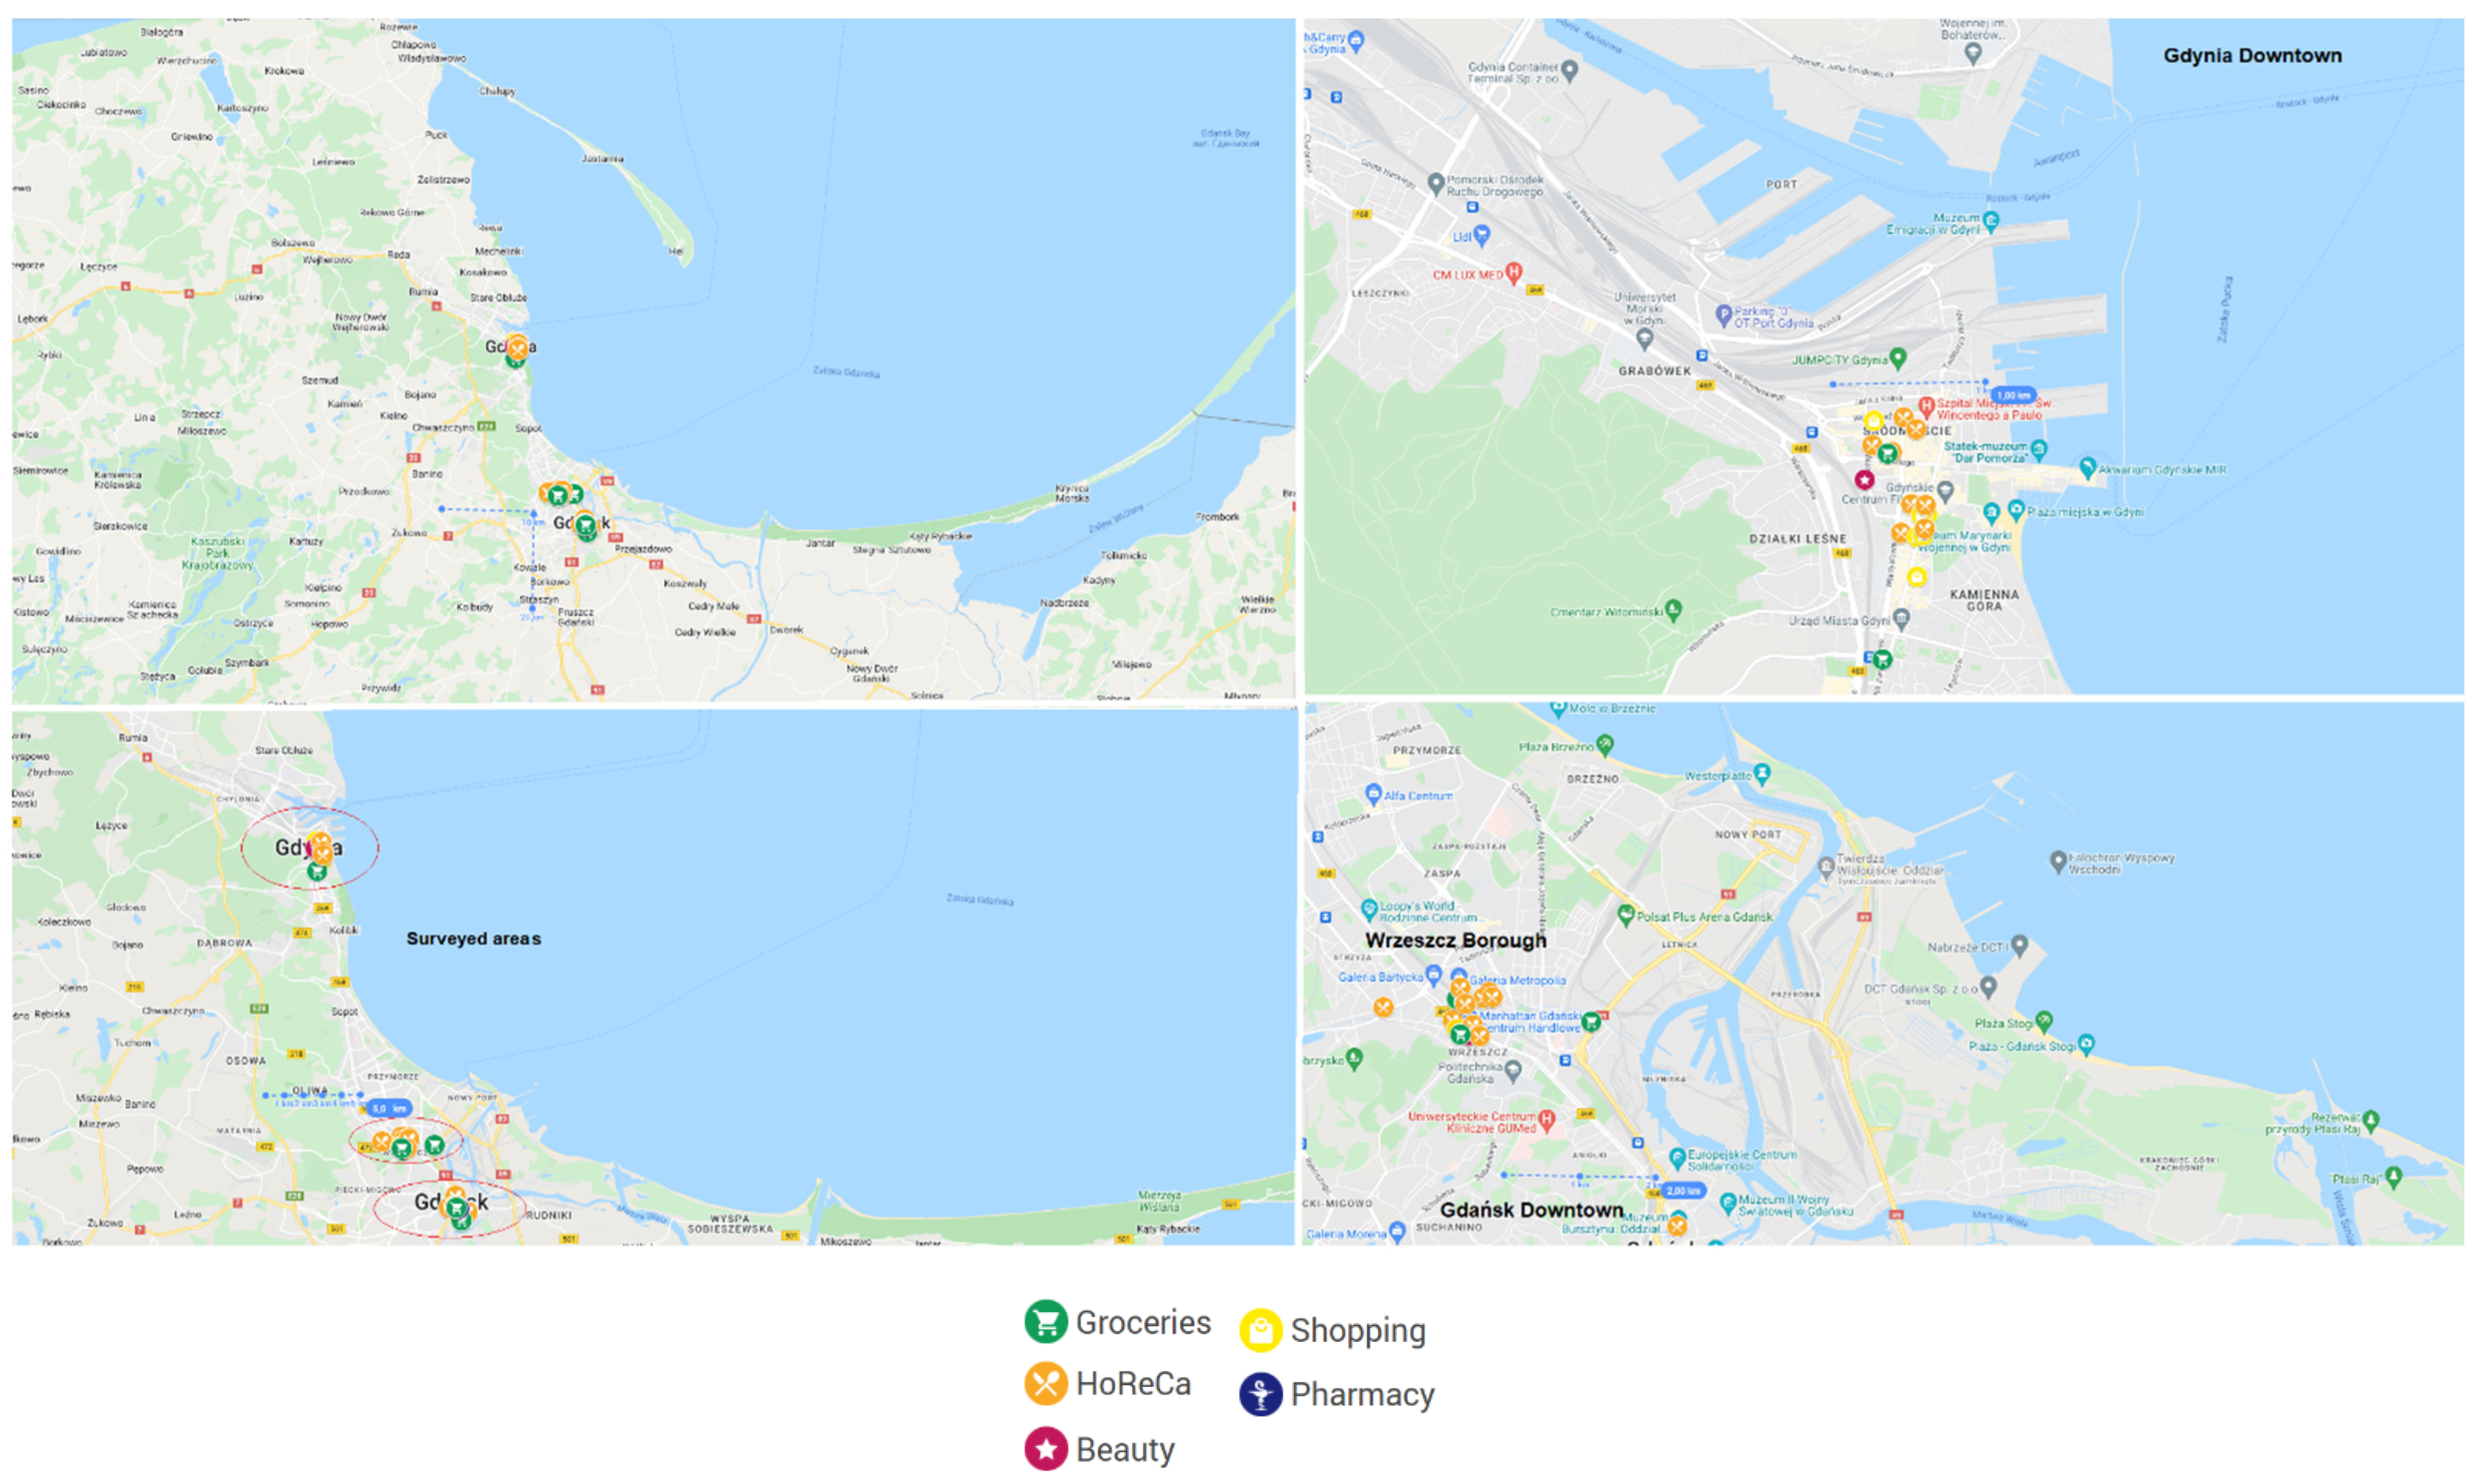
To identify the stakeholders’ attitude, a survey was conducted. The study examined one group of stakeholders, i.e., 54 recipients who were ground floor businesses of two selected Polish agglomerations, in which commercial, business and tourist activities are concentrated. The survey was conducted among the 54 enterprises located in the centers of the two largest cities of Gdańsk and Gdynia, in November and December 2019. Gdańsk (472,000 people) and Gdynia (245,000 people) are the two largest cities in the Tri-City agglomeration. The third city of the Tri-City agglomeration is the smaller city of Sopot (17.31 sq km) with a population of 37,000, which was not covered by the study, because the size and specificity of the city (between Gdańsk and Gdynia) would not give reliable and general results. The author knows Gdańsk and Gdynia, which made it possible to select the districts with the heaviest congestion and the largest number of deliveries, so that the results were reliable and, if possible, could be generalized or compared with those from other similar cities. Tri-City is the third largest agglomeration in Poland. The enterprises in the specified areas were chosen randomly. In Gdynia, the premises located in the Downtown area were examined, while in Gdańsk, the premises surveyed were located in the Downtown area and in the second popular district with a great deal of commercial activity, namely, the Wrzeszcz borough (
Figure 1). For sustainable logistics measures to be effective, they must be matched to the area and business profile of the stakeholders. Areas of the two cities located next to each other where the most businesses related to gastronomy and tourism are located, i.e., restaurants, cafes, hotels, grocery stores and several premises most frequently visited by residents and tourists, were selected. Premises with this profile of activity were selected for the study, which statistically included the greatest number in the region, and the proportions of business profiles in the sample correspond to the actual state, hence the sample is representative. The companies were selected randomly, and the interviewers addressed questions directly to the respondents during their working hours.
Table 3 describes the business profile of the surveyed premises.
The chi-square test method was used to test the first hypothesis.
The Spearman’s rank correlation was used to examine the second hypothesis.
Taking into account the difficulties faced by logistics service providers in large Polish cities [
23,
24], 10 city logistics measures were selected for the study that could be introduced in the study area, choosing from those that work well in European cities (literature from the book):
interactive city map that shows not only traffic and best route, but also available parking spots and available loading bays (IM)
night deliveries (ND)
multifunctional lanes (i.e., for buses, carsharing and deliveries) (ML)
electric vehicles (EV)
benefits for suppliers that meet environmental standards (B)
loading bays (LB)
order sharing (OS)
electronic platform that connects supply and demand sites (EP)
load sharing (LS)
urban consolidation center (UCC)
The tools were then assigned a subjectively perceived level of implementation difficulty (on a scale from 1 to 10). In addition, the respondents were also asked to determine the subjective level of difficulty.
Table 4 presents the degree of difficulty assigned to individual tools by the author and the respondents (average of 54 answers).
4. Results
Despite the invisible correlation in estimating the difficulty between the respondents and the author, the correlation coefficient indicated a high correlation, over 95%, which allowed us to continue the verification of the second hypothesis about the relationship between implementation difficulty and willingness to implement.
The regression model showed no regression between the number of employees and the willingness to implement a given measure, but with the Rsquare = 0.0142, it was not enough to accept the first hypothesis as the model was inadequate. In order to verify the first hypothesis, the chi-square test was used, in which chi-square test statistic < 0.05 means that the presence of a relationship between variables, while a chi-square test statistic > 0.05 means that the data do not match very well, so there is no relationship between the variables.
In order to perform the chi-square test, the respondents were divided into groups:
up to 5 employees (16 premises)
from 6 to 10 employees (19 premises)
over 10 employees (18 premises)
There was no clear trend among the responses, as the companies with up to five employees had premises which declared willingness to implement both 10 measures as well as none.
Table 5 shows the average response juxtaposed with the coefficient of variation.
Due to the lack of an observed dependence and the wide range of the answers, an empirical table (
Table 6) for the chi-square test was prepared, followed by the expected chi-square table (
Table 7).
Since 0.00063629 < 0.05, there was a statistical dependence between the variables, which means the number of employees influence the tendency towards openness to the new logistics measures and, accordingly, Hypothesis 1 was rejected.
In order to verify the second hypothesis, the Spearman’s rank correlation coefficient (rs) was used. As there was no significant regression registered in the regression model, and the R square was 0.12, the model showed incongruity.
Table 8 shows the number of “yes” answers to the question “Would you adopt the measure?”, with the subjective level of the effort to implement it.
We assigned rank values to X and Y (1, for the largest X value, 2, for the second largest X value, etc.; in an analogous way for Y, which was already ranked)—
Table 9.
When rs is between 0.4 and 0.6, there is a moderate correlation or a significant relationship, which means we could positively verify hypothesis number 2. There iwa a relationship between the difficulty of implementing a given measure and the tendency to implement it.
5. Discussion
Urban areas suffer from congestion, road accidents and environmental degradation. That is why it is so important to implement environmentally friendly initiatives without loss of efficiency, so that cities are more liveable and safer. The study present the opinions of some stakeholders of the urban transport system. The hypothesis about a direct correlation between the size of an enterprise and the willingness to accept a given city logistics measures was rejected using the chi-square model. The hypothesis about a direct correlation between the difficulty of introducing a given solution and the readiness to implement it was positively verified using the Spearman model. Rejecting the null hypothesis was somewhat surprising and may be an incentive for further research using a larger group of stakeholders. A significant advantage of the presented article is the multitude of methods used in the research process, which may also inspire other researchers. All Polish cities lack sustainable solutions with regard to the freight distribution in the city, and the problems of Polish cities are the same as those of other European cities, i.e., congestion, smog, inefficient infrastructure, reduced livability and reduced safety. However, before we rush into closing the gap in this field between Poland and other EU countries, we should ask stakeholders, learn about their preferences and problems and consult with them about changes, which will increase the effectiveness of introducing city logistics measures.
6. Conclusions
Urban Freight Transport is a complex process that involves many stakeholders. Stakeholders’ needs and expectations should be analyzed so as to implement practical and workable measures. Identifying the needs and understanding stakeholders’ concerns regarding UFT is a key factor to successfully implement a given logistics solution.
Propensity alone, however, may not be enough, because each attempt may prove to be insufficient. That is the reason why this paper examined the dependence of propensity on two factors: the size of the company and the difficulty of implementing the tool. The first hypothesis assumed that the size of the company does not influence the tendency towards new logistics measures and was rejected using the regression model method and the chi-square model.
The second hypothesis assumed that the more difficult the tool, the lesser the willingness to implement it. It should be added that it was ensured that the respondents perceived the difficulty intuitively, which was confirmed by the research. To verify the second hypothesis, the Spearman’s rank correlation coefficient (rs) was used, which helped us verify the second hypothesis positively—there is correlation between the level of difficulty to implement the measure and the number of consents.
The survey and the analysis of the results with the use of the statistical methods showed that:
there is a relationship between the difficulty of implementing a given city logistics measure and the tendency to implement it
the number of employees influence the tendency towards openness to the new logistics measures; the bigger the enterprise, the greater the openness to new logistic solutions.
Thus, we can conclude that larger enterprises are more open to changes because:
their experience could have made them come to a conclusion that new solutions frequently mean improvement
their size allows them to take a risk and at the same time secure against that risk.
Acceptance of the chosen city logistics measures is the factor that defines the success of their implementation and their effectiveness.
Awareness of the stakeholders is the key factor to achieve success. Discussing the changes before their implementation makes the stakeholders more eager to engage, which in turn has a great influence on the increase of the advantages of the implementation. Future research should focus on the factors encouraging stakeholders to become more involved in the use of sustainable city logistics measures.


