1. Introduction
Between 1990 and 2018, global total energy consumption increased by 59%, owing to global economic expansion and population growth. Furthermore, fossil fuels are likely to be exhausted in the next years, resulting in restricted energy supply supplies. The sector with the highest energy demand is industry, which represents 45% of the total energy supply [
1]. Most of the energy used in the world comes from fossil fuels, which represent 84.3% of primary energies [
2]. This leads to some challenges regarding future energy demand since fewer fossil fuels should be used due to environmental regulations. Moreover, providing future energy demand will require implementing new energy plants, which take a long time to build, especially in developing countries. To move towards efficiency, engineers have the biggest challenge to make improvements on the way energy is used and delivered throughout manufacturing processes [
3].
The sector of industry is heavily responsible for fossil fuel depletion and carbon dioxide emissions. Therefore, many measures to mitigate such problems have been implemented by the industry sector [
4]. To overcome these issues, some changes have been made in many countries, such as improving energy efficiency. Between 1990 and 2018, the global energy intensity has decreased 36%, which is related to the more efficient industry [
1]. However, energy efficiency has not improved in all countries, especially in most developing countries due to a lack of policies in the energy sector [
5,
6].
Several barriers to the application of energy-saving measures must be overcome, particularly among small and midsize enterprises (SMEs). Many cost-effective energy-efficient initiatives remain unimplemented because of financial constraints, a lack of expertise, and insufficient in-house capabilities. Information measures and audits are potentially helpful strategies to encourage the deployment of energy efficiency measures to meet those hurdles [
7]. Energy audits can indicate potential energy and non-energy benefits [
3].
In Ecuador, the industry sector represents 26% of energy end-use and it represents the second sector of energy use, and within this sector are car stores [
8]. The country has had an energy efficiency law since 2019. However, it is not mandatory for the private sector [
9]. In order to enforce energy audits in Ecuador, several attempts have been made. Some isolated programs have been developed for the major energy users of Ecuador, consisting of approximately 115 clothing, chemical, mining, and oil refining companies [
10]. The aim of these efforts was to minimize the amount of energy used among the country’s large electricity consumers. These moves opened the door at local level to progressive policies and requirements.
This article describes the analysis of energy efficiency and the proposal of improvement measures in a car store. The different actions are technically and economically detailed. This can be used for bench-marking, which is used to compare the energy performance of other similar case studies such as this one. This is an essential part of this type of study and usually presents some difficulty because of the lack of concrete data from similar installations to the one being studied. The aim of this study is to promote energy audits in the private sector, particularly in car stores, showing the benefits such as money and energy savings. This issue is important since it is the first step to quantifying total energy use in this particular sector, and later it will help to establish energy efficiency actions in the sector. Moreover, this paper highlights the main barriers and challenges in industries of a specific country, Ecuador.
The main contributions of this paper are highlighted as follows:
A comprehensive method for energy savings is developed considering a real case study in Quito, Ecuador.
Various energy efficiency improvements are proposed in car stores, which are building stores that have not been studied enough.
The rest of this paper is organized as follows:
Section 3.1 presents the description of the case study.
Section 3 presents the methodology. Then, the results are detailed in
Section 4. Finally,
Section 5 is devoted to conclusions.
2. Literature Review
Many works in the literature have analyzed and proposed energy efficiency improvements in different sectors. A visual map of the literature review is illustrated in
Figure 1.
Many energy audits have been performed in buildings. The authors of [
11,
12] performed energy audits of educational buildings, resulting in various recommendations to save energy, including repairing building envelopes, eliminating unnecessary energy usage, and opening outdoor air inlets. In [
13], the energy audit of two mosques in Marrakech (Morocco) was studied, concluding that countries should establish an efficient and adapted sustainable strategy for buildings, by developing more concrete and specific codes and regulations to for each building category. The authors of [
14] indicate the benefits in terms of energy efficiency achieved through the use of hemp-lime composite as insulation in a possible refurbishment intervention. In [
15], some improvement proposals have been indicated for the electricity consumption of households in Abu Dhabi (UAE). The authors of [
16] propose energy savings techniques on educational French university campuses. In [
17], a data-driven framework to identify non-inverter window room air conditioners with low energy efficiency by analyzing smart meter data from the university student hall rooms is studied.
Thus, several audit studies have been performed worldwide for energy efficiency purposes in different industries. For example, in [
18], an energy audit was carried out, indicating that updating old pumps and adapting pumps to today’s needs will improve the energy savings. The authors of [
19] studied a dry process cement plant, where the main findings are that the kiln exit gases and kiln shell are the major sources of thermal energy losses. In [
20], the factors driving the adoption of energy-efficiency measures by small and medium-sized enterprises were investigated. This article suggests that capital constraints slow down the implementation of policies on energy quality, particularly for major investments. Thus, investment subsidies or soft loans (for major investments) can help to accelerate the spread of energy-efficient initiatives to small and medium-sized enterprises. In [
21], the energy audit of a paper mill is performed, and nine energy-efficiency improvement opportunities are identified by the audit. The authors of [
22] propose a novel methodology for energy audit developed and implemented by a large manufacturing company in the home appliances industry. In [
23], the energy audit for a pyro-processing unit of a new generation cement plant was performed by proposing thermal and economic savings. The authors of [
24] propose an evaluation method for energy efficiency in the iron and steel manufacturing process. In [
25], new energy efficiency measures are presented by improving motor systems in Swedish industries. The authors of [
26] predict the energy efficiency using the slow feature partial least squares method for large-scale chemical plants. In [
27], the energy savings potential in the pulp and paper sector by developing disaggregated cost of saved energy curves and energy saving bandwidths are characterized, estimating potential savings of 3.85 GJ/t (98%) for natural gas and 3.04 GJ/t (54%) for electricity. The authors of [
28] explain how to set up a building energy performance framework based on in situ measurements of a building’s fabric thermal structure in order to produce reliable energy performance evaluation and certification schemes in the residential sector.
Many works have also focused on the reduction of electricity consumption, which could be divided into different uses. For example, in [
29], energy efficiency policies have been demonstrated for lighting, which represents typically 20% of the total electricity used. The authors of [
30,
31,
32,
33] demonstrate that refurbishment in buildings could avoid electricity consumption, by reducing HVAC systems. Similarly, the authors of [
34] optimize the air-conditioning control in large buildings to reduce electricity consumption. Other works demonstrate the energy efficiency of industries could be improved by replacing high-consuming devices with efficient ones [
35,
36,
37,
38]. The electricity could be also improved by considering some actions such as [
35,
39,
40]. In [
41], a critical analysis for the assessment of potential electricity savings derived from the replacement of obsolete or inefficient chillers and air-conditioners in the wine industry was presented. The authors of [
42] analyzed energy efficient practice measures for the Portuguese food processing industry to reduce electricity consumption and mitigate environmental impact. In [
43], an integrated modeling framework for quantifying the effect on the growth of the coal-fired power plant fleet in China of the industrial energy savings and on air pollution in the different electricity grids in 2016–2040 is developed. The authors of [
44] propose various energy efficiency proposals for reducing the electricity consumption of lighting systems.
3. Methodology
3.1. Case Study Description
Nowadays, the automotive sector is undergoing very important changes. This means that this sector is in a profound transformation. Specifically, in the section of the sector linked to sales, car sellers can be one of the components to be studied. Hence, the considered case study is the car store of Ambacar located in Av. Granados and Av. Eloy Alfaro, Quito, Ecuador. In Quito, AMBACAR has 11 branches where new and used cars are sold and they perform car maintenance. The agency has 30 people working continuously in the different areas: sales, marketing, and the workshop. Among the activities carried out in the agency are the sale of cars, sale of spare parts, and preventive and corrective maintenance of cars. This agency has a flow of cars of approximately 25 a day. In addition to the respective maintenance, the service of washing and polishing is provided.
For the operation of the different areas, there is equipment such as computers, printers, coffee makers, microwaves, car lifts, elevators, polishers, pumps, compressors, washing machines, vacuum cleaners, and lighting for all areas, which represent energy use.
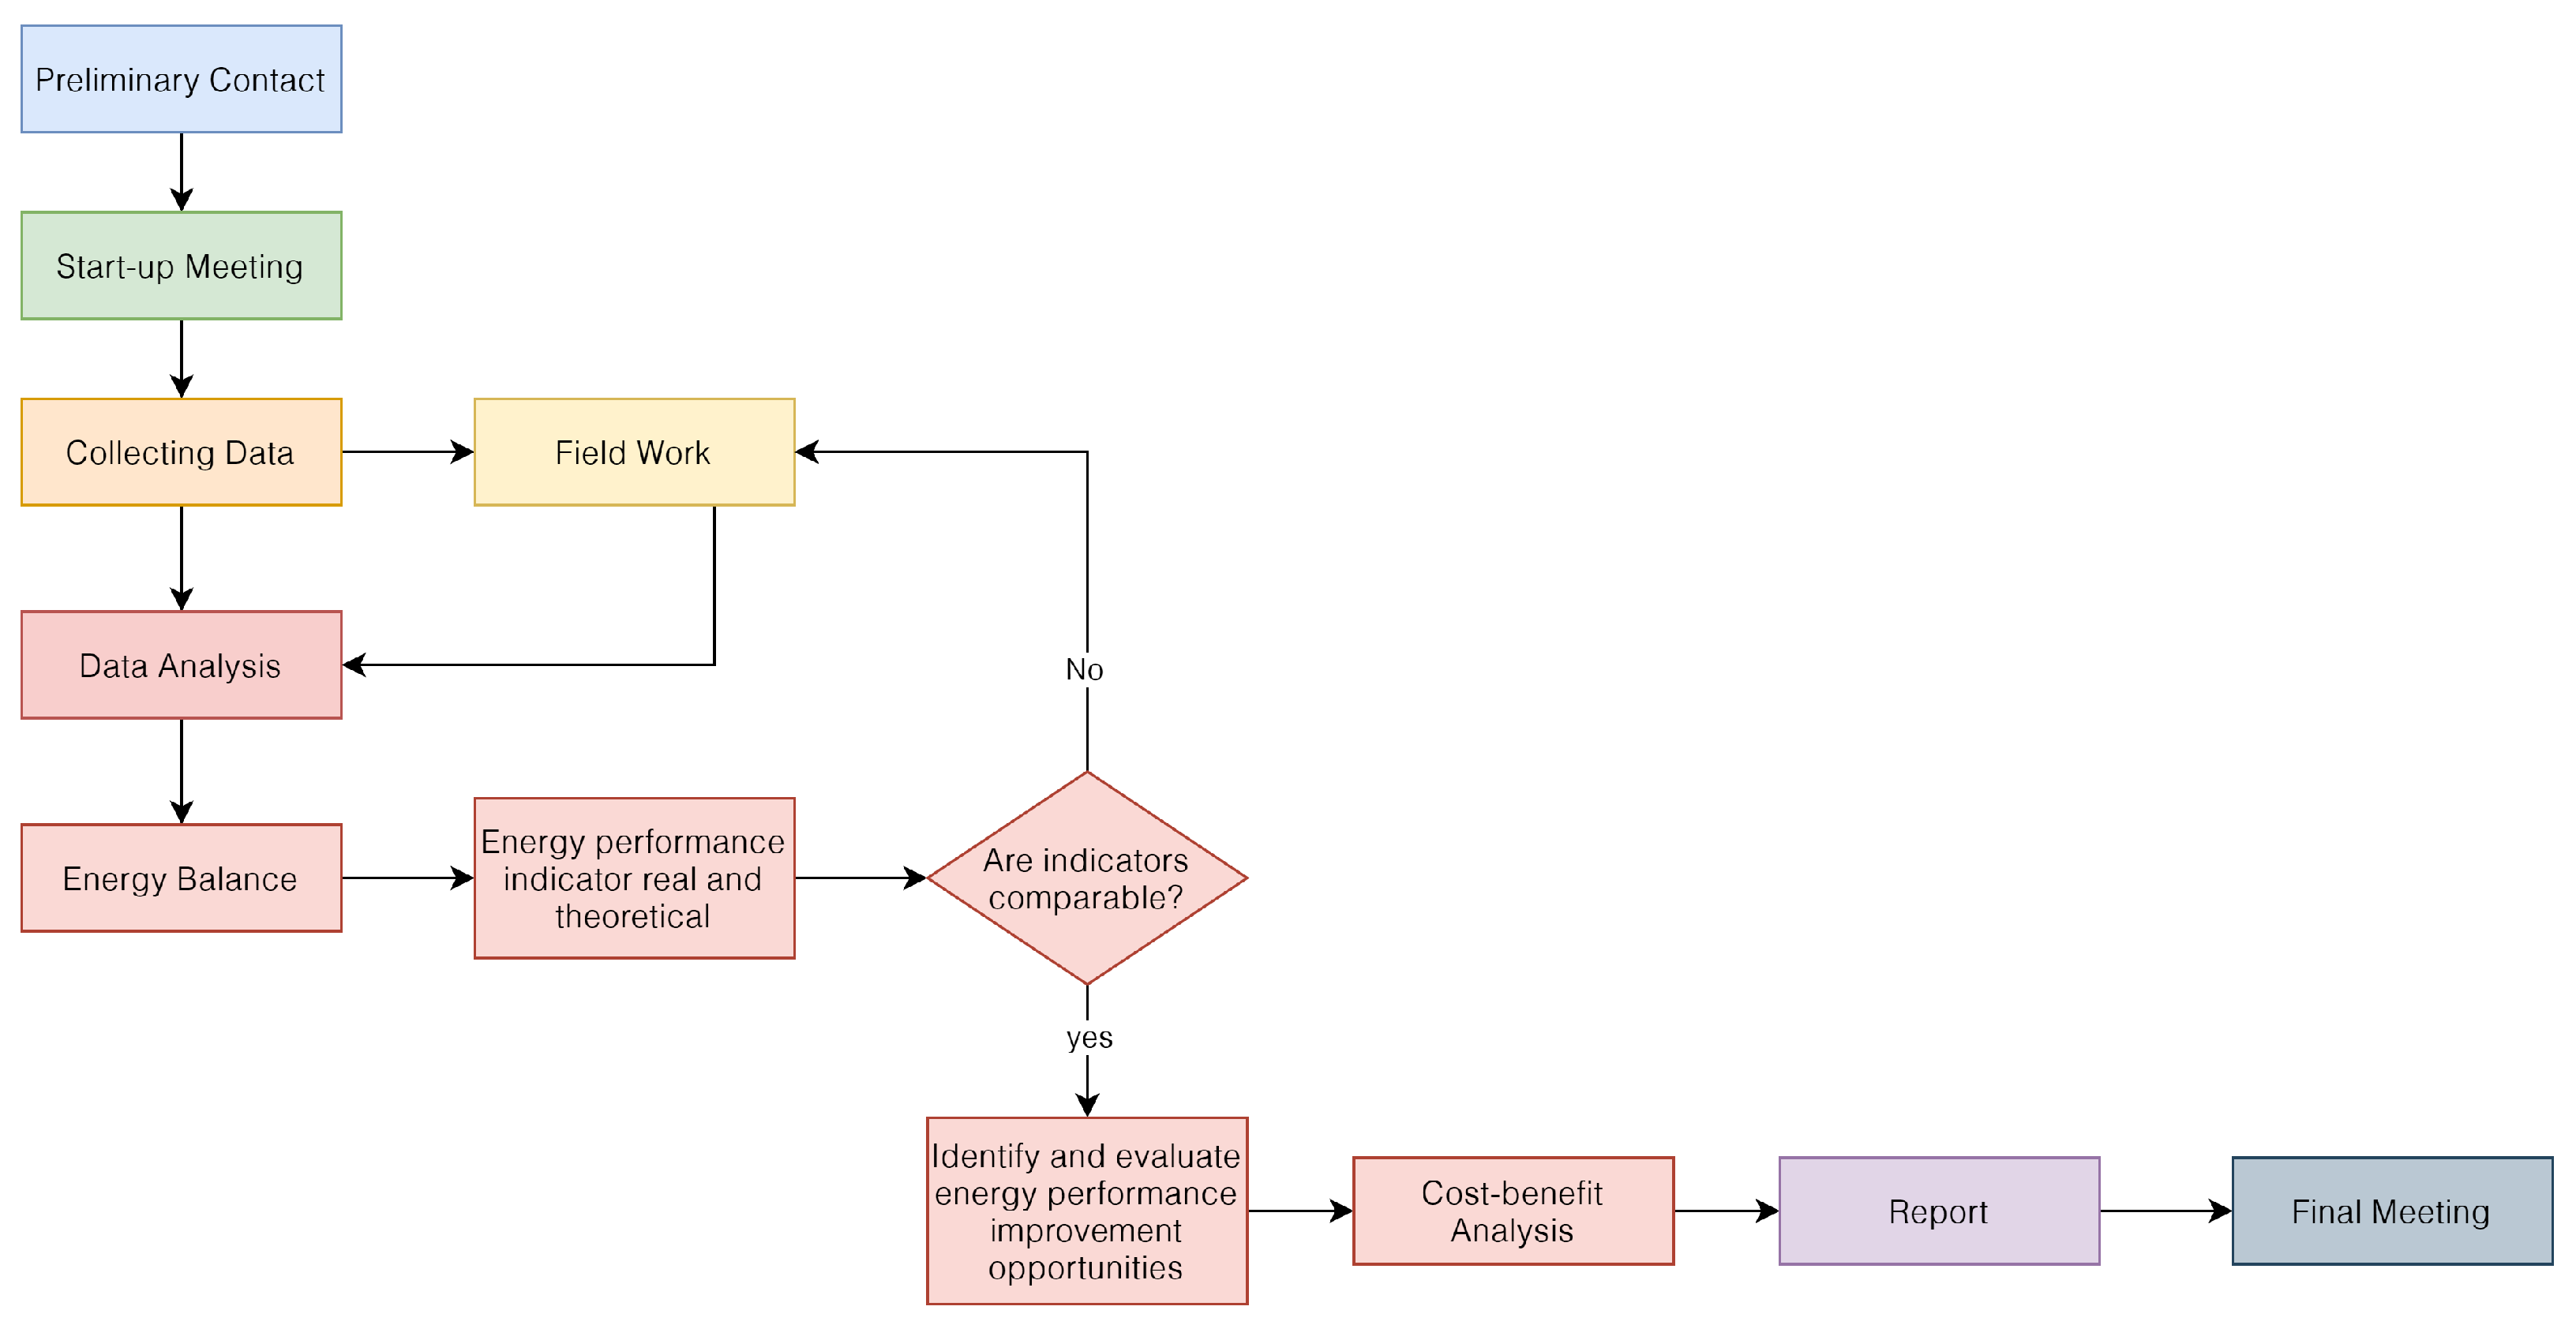
The methodology was based on the standard EN 16247-1-2-3, where the following elements were considered in the energy audit: Preliminary contact, start-up meeting, collecting data, field work, analysis, report, and final meeting.
Figure 2 highlights the main activities of the methodology used to analyze energy end-use in the car store and the improvement proposals. The tasks of the methodology are described below.
The authors of [
22,
23,
29,
30] demonstrate that refurbishment in buildings could avoid electricity consumption by reducing HVAC systems. Other works demonstrate the energy efficiency of industries could be improved by replacing high-consuming devices by efficient ones. The electricity could also be improved by considering some actions such as [
32,
36,
37]. After the energy audit, the main actions to reduce energy use, some actions are proposed such as the refurbishment of electric wire system for lighting, replacement of low-efficiency equipment, and implement some actions to reduce energy use in the night which is related to [
22,
23,
29,
30,
32,
36,
37].
3.2. Preliminary Contact and Start-Up Meeting
In the preliminary contact, it was established that the auditory will be for the whole car store and all processes. Additionally, in the start-up meeting it was defined that the energy performance indicator will be energy used/number of employees.
3.3. Collecting Data
For collecting data, we considered activities such as inventory, estimation of time of use of equipment, interviews, surveys, measurement of office supplies, workshop machinery, and lighting.
3.3.1. Inventory
For the preparation of the inventory of supplies, machinery, and luminaries, an initial inspection of the agency was carried out, taking into account the specifications of each of the office supplies, machinery, and luminaries such as power, voltage, current, type of luminaries, type of motors and pumps.
3.3.2. Estimation of Time of Use of Equipment
To estimate the time of use of machinery and equipment, three processes were carried out: interviews, surveys, and in the case of inputs connected to 120 V, the operating time indicated by the electricity consumption meter was taken into account.
3.3.3. Interviews
Interviews were conducted with the heads of the agency and workshop, respectively, to obtain information on the operating hours of the entire agency and the main processes carried out in it. They are shown in
Appendix A,
Table A1 and
Table A2.
3.3.4. Surveys
The surveys were established to obtain knowledge of the facilities’ consumption habits; these were focused on the administrative areas. To establish the inputs and machinery’s operating hours, a survey was formulated for the administrative area. The results are shown in
Appendix A Table A3.
3.3.5. Measurements
Once the inventory of all the supplies within the agency had been obtained, some parameters were measured such as time of consumption, illuminance, and instant power. For the office supplies, the consumption meter was used and it was set for 24 h. For the luminaries, a Majivu lux-meter meter was used, which measures illuminance. A Holdpeak 850f three-phase power meter was used for the workshop machinery, which gives instant power data while machines were working in normal conditions.
3.3.6. Office Supplies
With a consumption meter Intertek Cat II, the data collection of office supplies, computers, printers, and cafeteria area was carried out. To obtain the data of power, amperage, and voltage, the meter was set for 24 h connected to each input and the meter connected to the facilities’ internal electrical network.
3.3.7. Workshop Machinery
For the workshop machinery measurement, the motors were disassembled to visualize their internal connections, and the measurement was carried out with the three-phase power meter HP850f. The current clamp was connected in each phase while each cable was connected in all the machinery phases. The meter gave the instantaneous powers. This procedure was carried out while the machinery was in operation in normal conditions. The data of real power, active power, reactive power, and power factor of all the machinery was obtained, considering the 220 V electrical installation.
3.3.8. Lighting
For the measurement of the luminaries, a Majivu lux-meter was used; the meter was located at the height of the exposure of the people. For the administrative areas, it was located at the height of the desk, and for the workshop areas, the measurement at the height of the platforms. This measure will be used to find the compliance with the illumination standard.
3.4. Field Work
During the process of collecting data and data analysis, it was necessary to visit the car store to verify the normal operation of the site. In this process, the agency and workshop managers guided the visit. Additionally, some parameters were verified when the energy balance were established.
3.5. Data Analysis
In this section, we established an energy balance, analyzed the energy performance indicators, and identified and evaluated improvements for energy efficiency. It is important to highlight that heat gained by building envelope and heat generated by machinery was not analyzed since the car store is located in Quito, which has an average temperature of 16 °C and there is no need for heating or cooling.
3.5.1. Energy Balance
Once the data provided by the measurements and the surveys were obtained, one month’s energy balance was carried out. In this case, the month of March was taken as a reference since this was when the measurements were made. Previously the energy bills of 2018 and 2019 were analyzed, where January 2019 was the month with the highest energy use. Therefore, the estimation time corresponds to the conditions of January 2019. It was also analyzed according to hourly demand schedules established by the local electricity distribution company, Empresa Eléctrica Quito, in which AMBACAR has a commercial rate with schedule demand. The local electricity company tariffs are classified by the voltage in three main categories: low, medium, and high. Each category is sub-divided by the demand without demand, with demand, schedule demand, and differentiated schedule demand. Therefore, two balances were performed, one for the schedule from 7 a.m. to 10 p.m. and the second from 10 p.m. to 7 a.m., since they have electricity rates of 0.088 USD/kWh and 0.070 USD/kWh, respectively [
45]. There are just two electricity tariffs for industrial customers in Ecuador whose difference is just 1.8 cents/kWh, divided into two periods per day. Furthermore, many energy-consuming activities are rigid in time. Thus, it is challenging to propose electricity-saving programs such as demand response or time of use.
3.5.2. Energy Performance Indicator
In the start-up meeting, it was established that the energy performance indicator that will be used is energy used/number of employees. This indicator will be evaluated after the energy balance and improvement proposal. Additionally, energy usage intensity was analyzed to compare with other studies. Equation (
1) was used to determine the annual energy usage intensity (
), with the the energy demand in the month of the audit
, and the area of the building audited
.
3.5.3. Bench-Marking
Bench-marking of buildings from different countries has been analyzed in
Table 1, and the results of EUI are very different between them due to several factors such as heating or cooling demand, activities developed, and isolation of the building, among others. From the literature review, bench-marking of automobile stores has not been analyzed. Therefore, an energy audit of this sector is an important contribution to energy efficiency. In this section, the statistical tool GPower was used to determine the sample size required for a future benchmarking. The sample size was determined using the
t-test, with two tails, and the statistical test used is means: one group, difference from constant. The parameters chosen were effect size d = 0.5, the significance level
and
power = 0.95.
3.5.4. Improvement Proposal
According to the energy balance data, the highest energy use areas were identified according to the two demand schedules. Once the problem area was identified, the equipment that represented the highest consumption was analyzed.
The action plan was carried out according to the INEN INTE ISO 50001:2011 standard (Ecuadorian Institute of Standardization, 2012), which mentions that within the action plan, it must include the action, type of action, and person responsible, term, investment, and savings.
Each action mentioned in the action plan was analyzed according to its investment and the return time of the investment, evaluating the internal rate of return (IRR) and net present value (NPV) defined as follows:
where
t is the year interval,
T the time horizon,
the net cash inflow at year
t, and
the total initial investment costs.
This was performed in a time horizon of 5 years for each proposal, to identify which actions have the most remarkable capacity for saving both energy and money.
4. Results and Discussion
4.1. Energy Balance
According to the electric power schedule, the Granados agency has a commercial record with hourly demand, which indicates that two rates are charged with two schedules, one that goes from 7 a.m. to 10 p.m. and the second from 10 p.m. to 7 a.m.
For each schedule, a balance was made of all areas and obtained an error percentage of 4% compared to the electricity bill. This error depends on some factors, such as low or inadequate electrical connections providing losses, and the difference in the estimation of time of use of equipment and machines. The energy bill is from March 2018, and the measured values are from the same month of the year 2019. The comparison was not made in the same year, 2019 since in this period, the pumps were not in constant operation since the outdoor facilities were being remodeled. The analysis was carried out under normal conditions of the facilities.
Table 2 summarizes the energy balance per period.
4.2. Highest Consumption Areas
The agency was divided into areas depending on their respective work. The workshop area, sales area, parking lot, marketing area, and meeting room were selected. According to the highest electricity consumption (kWh/month), it was observed that the highest value of electrical energy use is the workshop area, representing 88% of the entire agency, as shown in
Figure 3. Within the percentage of the workshop area, it is found that 12% represent lighting fixtures, 0.4% administrative equipment, and 88% machinery, as shown in
Figure 4.
The areas with the highest energy use of luminaries are found in the workshop, corresponding to 68%, as shown in
Figure 5. This is because most of these are fluorescent and are lit 12 h a day due to a lack of natural illumination.
Within the workshop machinery consumption, there is equipment that represents the highest consumption, such as the vacuum cleaner, which represents 6% of the workshop area’s consumption. This represents a high value for small equipment. Among the highest consumption equipment are the six pumps; the one with the highest consumption is 13% of the workshop’s total because it is the pump that works 24 h a day since it is used for decorative fountain. The other pumps with the highest consumption are two pumps which represent 8% each connected to the decorative fountain system and pumping water to the artificial waterfall. The remaining three pumps represent a low consumption of 7% two of them and 6% the last, as shown in
Figure 6.
Another crucial piece of equipment is the compressor, which represents 12% of the workshop’s consumption and is connected directly to the network. The gas extractor has a consumption of 9%. The elevator marks 6%. All hydraulic motors and elevators account for 1% each. The rest of equipment with low power such as disc polishing, grinding, and aligning has 7% consumption. The air curtains and air conditioning, indicate 2% of consumption, as recorded in
Figure 6.
4.3. Energy Efficiency Proposals
The equipment that represented the highest energy use was taken into account, resulting in the vacuum cleaner, the pool pumps, and the compressor. These pieces of equipment were used for the proposal plan. The equipment such as the extractor and elevator were not considered since they have suitable parameters to be considered in the energy efficiency proposal such as adequate efficiency of equipment, and reasonable time of use for the elevators and ventilation since these two machines are necessary for the daily activities of the workshop. Among the proposals, there are preventive actions such as staff training and corrective actions such as improved electrical connections and equipment changes to reduce consumption. For the proposals with significant investment, an analysis of investment and return time was carried out.
4.4. Analysis of Energy Efficiency Proposals
The first energy efficiency proposal is training for all staff and a timer for the ventilation system. This measure was found after analyzing the surveys, where most of the staff did not set the computer on hibernate or sleep mode while they are on break. It was also observed that air conditioners were turned on even when the meeting room was empty. This measure improves their daily consumption habits, such as reducing the time that computers, air-conditioners, and the ventilation system are turned on, which is limited to working hours. This proposal’s investment is USD 255, a one-time investment, for training and a timer; together with this proposal, a night inspection should be applied to the facilities and equipment to ensure compliance with equipment shutdown especially computers and air conditioners. The time that the investment is recovered is 1.7 years, with an investment return rate (IRR) of 55%, the IRR and NPV were analyzed in 5 years since it is the time limit for return of an investment in this company, and the assumed interest rate used is 5% [
53].
Table 3 shows the sensitivity analysis of the first proposal, where this option is feasible after two years of investment. In this case, we analyzed the interest rate of 5% for investment and 10.21% for a loan [
53].
The revision of the electrical connections is necessary for the proper performance of the facilities. A revision must be necessary annually to avoid losses in electricity consumption. This measure was analyzed over five years, with an initial investment of USD 200. This value is indicated for the necessary materials. The change of electrical connections is focused on the redistribution of switches to optimize and reduce the time consumption of the luminaries. The internal rate of return obtained in this proposal is 81% and a return on investment of 14 months.
Table 4 shows that this improvement option is feasible after the second year for loan and investment interest rate.
The change of luminaries was focused on fluorescent lights in all areas for lower consumption LED luminaries, with an investment of USD 991.50. This value is taken only for the materials; the return on investment time is 1.8 years, with an internal rate of 48%. The annual saving was USD 557.88. The net present value is USD 1423.82 with an interest rate of 5% taken from [
53].
Table 5 shows that this option is feasible after the third year for the interest rate of a loan.
In the machinery change proposal, only the vacuum cleaner was considered. This would be replaced with a more efficient one used in cleaning automobiles, having an initial investment of USD 470.00, with an internal rate of return of 0.2%; this measure was analyzed in 5 years, with an annual saving of USD 94.66. The investment payback time of 5.5 years. This option is not feasible for both interest rates in less than 5 years, which is the limit time considered in the company.
Table 6 summarizes the economic costs of each action for energy efficiency.
4.5. Energy Performance Indicator and Energy Use Intensity
The energy performance indicator used is
energy/number of employees. The car store has 30 employees, 20 are in the administrative area and 10 are in the workshop. The energy used in a month was categorized into three activities, use of machinery, administrative equipment, and lighting. The energy indicator was calculated by energy use by activity/employees that perform this activity, and also the energy performance indicator of the whole car store was analyzed with the energy used in the car store/number of employees in the car store. The energy performance indicators and the energy use intensity were analyzed after energy balance and after energy efficiency proposals as shown in
Table 7 and
Table 8.
Bench-Marking
The energy indicators determined could be used as a starting point for future analysis of bench-marking in this sector. For the bench-marking analysis is important to have a representative sample size of car store buildings. After analyzing the t test where the effect size d chosen was 0.5 as a starting point, the significance level and power = 0.95, the sample size found was 54. It is important to mention that the effect of the size d should be analyzed after to determine whether the chosen initial value was appropriate.
4.6. Audit Program
The energy audit program was developed following the EN 16247-1-2-3. The following activities were fulfilled: preliminary contact, start-up meeting, collecting data, field work, analysis, report, and final meeting. Additionally, the audit program was established based on ISO 19011 [
54]. The activities developed were to establish an energy baseline for future implementation of ISO 50001.
4.7. Results Assessment and Proposals
The profitability indicators, IRR internal rate of return, and NPV net present value were used for the feasibility analysis of the different investment proposals. In the staff training proposal, the current interest rate is 5%. The value of the internal rate of return was 74%, with a net present value of USD 484.24. Since the IRR is higher than the current interest rate and the NPV has a positive value, the staff training proposal is adequate.
The second proposal analyzed is the revision and change of electrical connections within all the facilities, since some light switches are linked between the agency’s floors. This generates unnecessary consumption that will be reduced with the change and maintenance of the electrical connections. Considering that the proposed change of electrical connections has an IRR of 81%, a rate higher than the current interest rate of 5%, this makes the proposal feasible.
The third proposal for improvement is the change of lights. It was analyzed independently of the electrical connection inspection; this measure has an NPV of USD 1423.82 and an internal rate of return of 48%, exceeding the current interest rate of 5%. According to both data obtained, this proposal is viable for application within the agency.
The fourth proposal analyzed is the change of machinery, the vacuum cleaner having a high percentage of consumption. This refers to the machine’s high power and little time of use compare with other equipment. The results of this proposal of the IRR and NPV are 0.23% and USD −60.1, respectively. This proposal is therefore not viable for application within the agency.
The other proposals for improvement proposed in the results were not analyzed since they are not representative or do not need investment. For example, the timers for the compressor, night checking, and the modification of the time that pumps work. In this section we did not analyze the investment of capacitor banks to compensate for the power factor. However, correcting the power factor to 0.92 could save USD 70.01 on the energy bill.
Figure 7 shows that total energy savings after proposals will be 26%. The energy service which has the highest savings will be administrative equipment with 72%, followed by machinery and lighting with 25% and 11% respectively. The highest savings are in the machinery which represents 1821 kWh/month.
Ecuador has 1417 car store companies, and 18% of them are large companies with similar conditions to the car store analyzed [
55,
56]. Since the energy efficiency law in Ecuador is not mandatory in this sector, similar conditions to the study such as the use of low efficient equipment and improper management of energy are expected in this sector. Hence, the proposals analyzed could be implemented in similar companies. It is important to highlight that there are no studies of this kind in the car store sector in Ecuador, and that the amount of energy used in the car store sector is unknown. In fact, only one company has the ISO 50001 certification in the car sector in Ecuador, and it was issued only to the factory and does not include the car stores.
The main barriers found in the industry sector in Ecuador are an energy efficiency law which is not mandatory in the private sector, and it is only mandatory in the public sector. Additionally, it is important to point out that Ecuador has had a law since 2019. Therefore, the law is unknown by most industrial sectors. This carries problems such as low energy efficiency in the industries since no energy audits were performed, particularly in the car store sector. The challenges are to implement energy audits in all sectors, particularly in car stores, to quantify the energy use by sector as a baseline, and then, to implement energy efficiency certifications. This could be promoted with studies such as this, which show a methodology for energy audit and the benefits of reducing energy use.
4.8. Discussion
The automotive sector is undergoing very important changes. In particular, in the section of the sector linked to sales, car sellers can be one of the components to be studied. In this work, different audits are carried out at different car shops. The way in which they use energy is analyzed, the most important processes are presented, specific consumption is calculated, etc.
In the literature, there are some authors who have performed energy audits in commercial buildings. For example, in [
57], the use of combined heat cooling was proposed in malls in Italy. The authors of [
58,
59] analyzed the electricity consumption in commercial buildings in the USA. However, the specific characteristics of the commercial stores were not analyzed. A similar work has been done in [
19] and the pumps were also found as the problem in the energy audit.
In this work, as a novelty, specific data from a sector in which data is not available are presented. The energy use intensity of the car store building determined was 178 (kWh/m
a) after the energy audit, and it was reduced to 131 (kWh/m
a) with the energy proposals. These values are similar to the energy audits of [
49,
50,
52]. However, it is important to mention that the mentioned energy audits are mainly office buildings, and in the energy car store analyzed, other additional activities are developed. These data may be of interest in other studies that can be carried out and can be used as reference data when the bench-marking is performed in other similar facilities. The sample size required in this sector for a benchmark was calculated as 54 samples, which is close to the sample values used in [
48,
49,
51]. In addition, different proposals for efficiency improvement were proposed in the facilities studied, measures that can serve as a reference for other studies.
5. Conclusions
This paper presents an energy efficiency audit in a car store in Quito, Ecuador. Data on energy use, working hours, and consumption have been obtained for each inventory item. The findings were evaluated by operation areas of the agency.
The area with the highest energy use is the workshop since the machinery works with high power levels and the time of use is long. The lighting of the workshop also represents a high consumption since the lights are fluorescent.
Various proposals for energy efficiency were presented. Among the improvement proposals that are viable are the change of lighting, the reconditioning of electrical connections, the training of personnel, the modification of the pumps’ operating hours. With all these proposals applied, a monthly saving of USD 229.15 and 2477 kWh/month would be achieved.
The energy performance indicator determined for the car store building is 313 (kWh/employee) after the energy audit, and 231 (kWh/employee) after the energy proposals.
The energy use intensity calculated for the car store building is 178 (kWh/ma) after the energy audit, and 131 (kWh/ma) after the energy proposals.


 ,
, 


