Abstract
In view of the problem that 1,1,2,2,3,3,4−heptafluorocyclopentane (F7A) is difficult to separate and recover when mixed with tert−amyl alcohol (TAA) for further application, leading to high cost, we designed a reactive distillation process, and conducted experimental research on the recycle effect of F7A, aiming to recycle F7A with high purity and yield from the used compound cleaning agents, thereby greatly reducing the cost. With zinc chloride as the catalyst, the dehydration reaction of TAA was carried out and the reaction kinetics were measured. Besides, the reaction kinetic equation was obtained by the correlation of experimental data. Investigations were also conducted on the effects of catalyst amount, reaction temperature, and reflux ratio on the conversion of TAA and the recovery of F7A. Based on the reaction kinetics and process optimization, the reactive distillation process for recovery of F7A was simulated to analyze the effects of stage number, feed stage, reflux ratio, and heat duty on the reactive distillation column. Under the optimized operating conditions, F7A with purity of 99.4% and recovery of 73.1% was obtained by the reactive distillation process.
1. Introduction
1,1,2,2,3,3,4−heptafluorocyclopentane (F7A) is a non−combustible, environmentally friendly cyclic hydrofluorocarbon (c−HFC) substance, which has zero ozone depletion potential (ODP = 0), low global warming potential over 100 years (GWP100 = 231), and low toxicity [1]. Because F7A has excellent solubility and detergency, the U.S. Environmental Protection Agency (EPA) chose it as the representative of the fourth−generation cleaning agents. Moreover, F7A can be applied to replace 1−fluoro−1,1−dichloroethane (HCFC−141b) as a cleaning agent in the high−end electronic instruments field [2].
Researchers have developed a series of azeotropic cleaning agents with F7A as the main cleaning agent component, and evaluated their cleaning effects in different application scenarios. Patent US10153181B2 disclosed an azeotropic cleaning agent containing tert−amyl alcohol (TAA) and F7A, which can improve the cleaning performance for oil. The vaporization of the cleaning agent in the cleaning process can effectively reduce the surface tension between the cleaning agent and the substrate, which could solve the pattern damage on the substrate surface. Compared with pure F7A, azeotropic cleaning agents can alleviate the damage rate of substrate pattern to less than 0.1% [3]. Patent WO2016181922A1 reported an azeotrope for removing oil in resin processing, which contains F7A and alcohols. This azeotrope possesses non−flammability and better cleaning effect than hydrofluoroethers (HFEs). Moreover, the cleaning process does not need water, which is conducive to rapid resin drying and energy saving [4]. Patent WO2008073408 proposed an azeotrope composed of F7A, trans−1,2−dichloroethylene and alcohols, showing great cleaning performance of soldering flux and grease in the IC process is active, and the pollutant removal rate reaches more than 90% [5].
The research shows that an azeotropic cleaning agent with F7A as the main component displays better performance in a variety of applications. However, impurities accumulated in long−term use will lead to the decline of solvent cleaning effect. At the same time, it is difficult to separate F7A from azeotrope by conventional distillation and there is little research focusing on the regeneration and recovery of F7A azeotropic cleaning agents. Patent JP2019552767 proposed an azeotropic cleaning agent regeneration process of F7A and TAA with the main purpose of separating solid pollutants by precipitation and filtration without breaking the azeotropic system, and F7A and TAA were not completely separated. In addition, the regeneration device is complex, and the efficiency of removing dirt is low [6].
Extractive distillation, reactive distillation, and azeotropic distillation are the main methods to separate azeotropic mixtures in industry [7,8,9,10]. Among them, reactive distillation technology is a new type of coupling unit operation which is used to achieve the purpose of process enhancement by the coupling reaction and distillation [11,12,13]. Consequently, it is widely applied in biodiesel synthesis, etherification reaction, esterification reaction, and dehydration reaction. Additionally, reactive distillation technology can improve the reaction equilibrium conversion and unit production capacity, as well as reduce energy consumption and equipment investment [14,15,16].
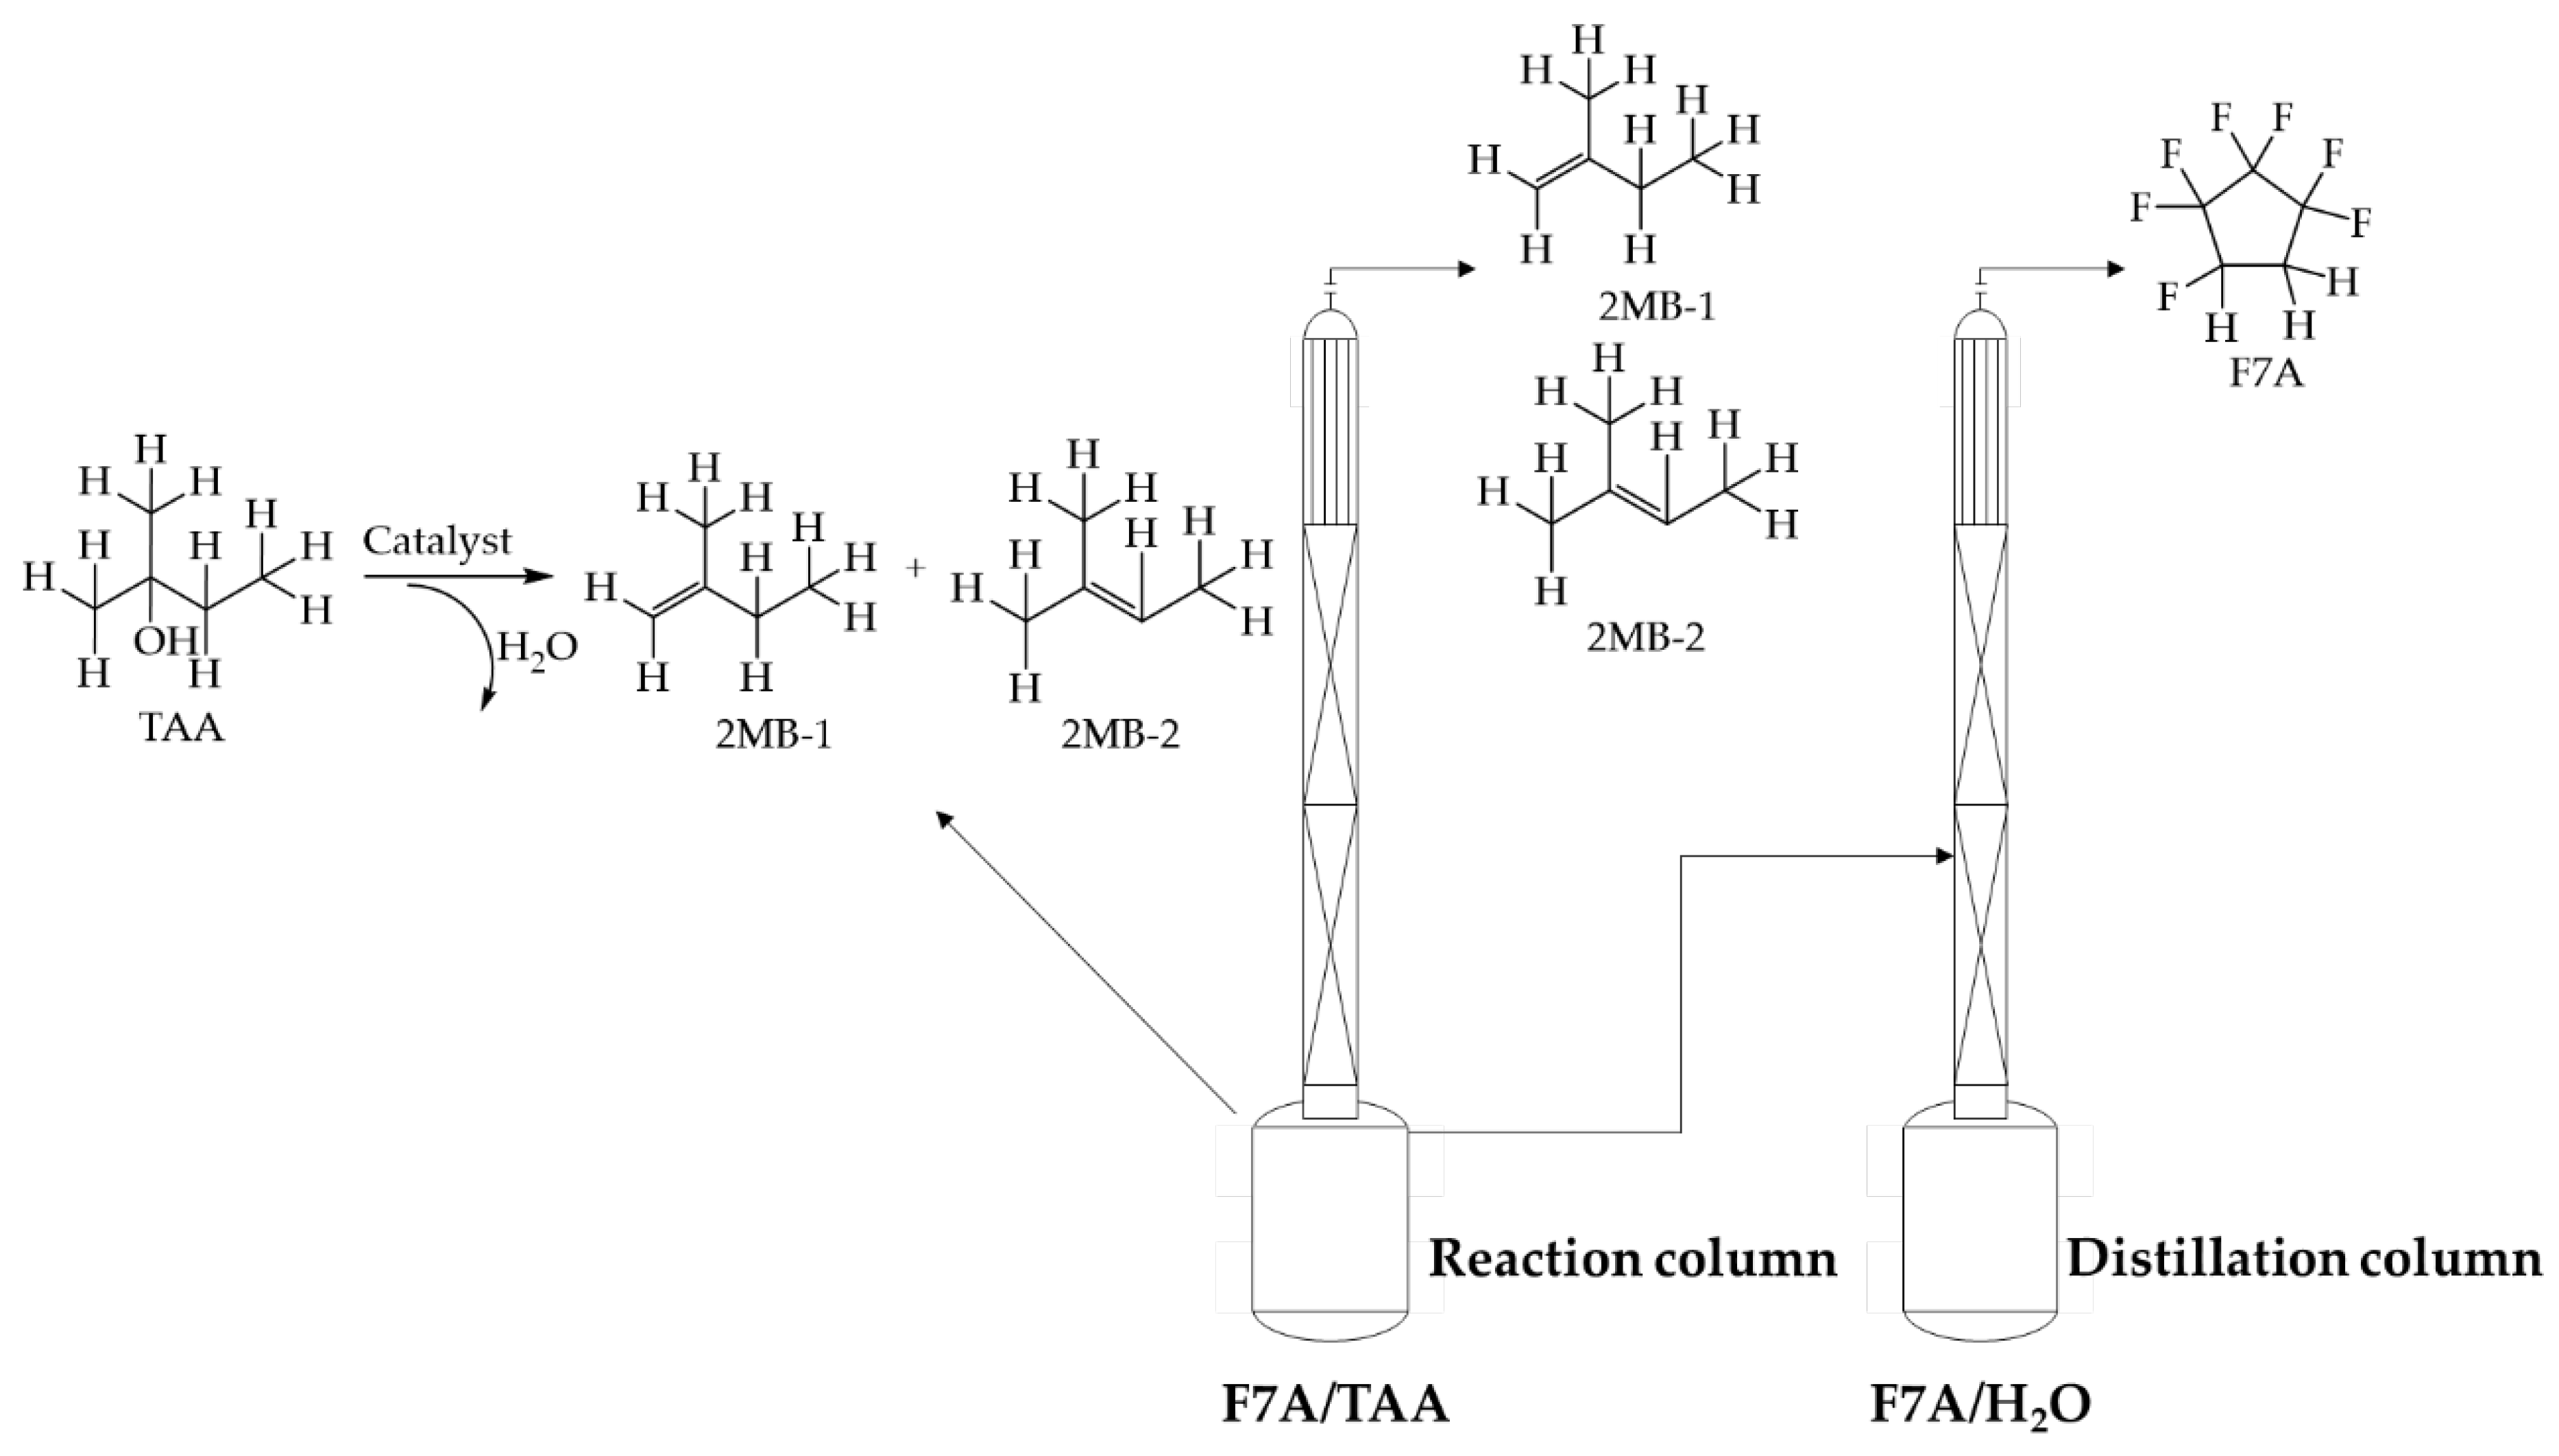
In view of the difficulty in recovering F7A in azeotropic cleaning agents, with the used cleaning agent (trade name: ZEORORA@HTA) as the research object, this study proposed to couple the intramolecular dehydration reaction of TAA and distillation of F7A process to break the stability of the azeotropic system and realize the recovery of F7A (see Scheme 1). In the dehydration of TAA, the catalyst was selected from zinc chloride, molecular sieves, and ion exchange resin. The kinetic data of dehydration reaction with zinc chloride as catalyst were measured and the kinetic equation was fitted. The reactive distillation process was optimized based on the kinetics research, and investigations were carried out on the influence of catalyst use and reflux ratio. Aspen Plus V11 was used to simulate the reactive distillation process, and the operating parameters including the stage number, feed stage, the reflux ratio, and heat duty were optimized by sensitivity analysis.
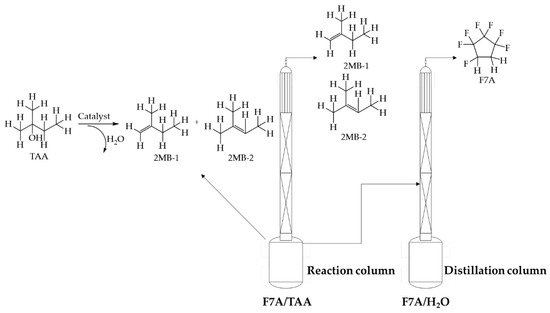
Scheme 1.
Recovery of F7A by reactive distillation.
2. Materials and Methods
2.1. Materials
The used ZEORORA@HTA cleaning agent (95 wt% F7A, 4–5 wt% TAA) was purchased from Zeon Corporation. The zinc chloride was purchased from Jinan Sanshi Biological Technology Corporation. Acid molecular sieve was purchased from Henan Shengwei Desiccant Co., Ltd. (Zhengzhou, China). The ion exchange resin (model: NKC−9) was purchased from Nankai University Catalyst Factory. All chemicals were assessed for purity by GC.
2.2. GC Analysis
The experimental samples were analyzed by gas chromatograph (GC 9560) equipped with the FID detector and an Agilent DB−VRX capillary column (30 m × 0.32 mm × 1.8 μm). The temperatures of the injector and the detector were 523.15 K and 603.15 K, respectively. The column temperature for GC analysis was 323.15 K for 1 min, and the velocity was 10 K/min to 453.15 K for 1 min.
The F7A and TAA were quantified by standard curve method shown as Equations (1) and (2), the weight percentages of which were determined by GC. As side production can be neglected from the GC result, the weight percentages of other components (alkenes and water) were calculated from the mass balance.
Standard curve of F7A:
Standard curve of TAA:
x: Percentage of peak area, %;
y: Actual mass content of components, %.
2.3. Experimental Equipment and Procedures of Reactive Distillation
The experiment of catalytic reactive distillation was performed in a glass distillation system with a 2000 mL flask under atmospheric pressure as shown in Figure S1. The total reflux was kept after being heated to 353.15 K, and the top and bottom components were analyzed by GC when the temperature was stable.
The catalytic reaction was carried out in a 2000 mL three−neck flask with a thermometer and a condenser as shown in Figure S2. During the reaction process, the reaction temperature ranged from 338.15 to 353.15 K. Then, the raw material and products were sequentially condensed and refluxed into the flask.
2.4. Reaction Kinetic Model
In this paper, solid acid catalyst was applied for reaction kinetics study. Since the TAA dehydration reaction is a rate control step with very low boiling point and product recovery, only the forward process is considered in kinetics study [17,18,19]. In addition, the reaction takes place only in the liquid phase, thus the activity coefficients of all substances are 1, and the first−order kinetic equation of TAA dehydration reaction is shown in Equation (3):
Arrhenius equation is shown in Equation (4):
k = rate constant, min−1;
A = pre−exponential factor;
t = reaction time, min;
E = activation energy, kJ/mol;
R = gas constant, kJ/(mol·K)
T = temperature, K;
CTAA = initial reactant concentration, mol/L;
CA = concentration of component, mol/L;
r = dehydration reaction rate, mol/(L·h).
3. Results
3.1. Catalyst Screening
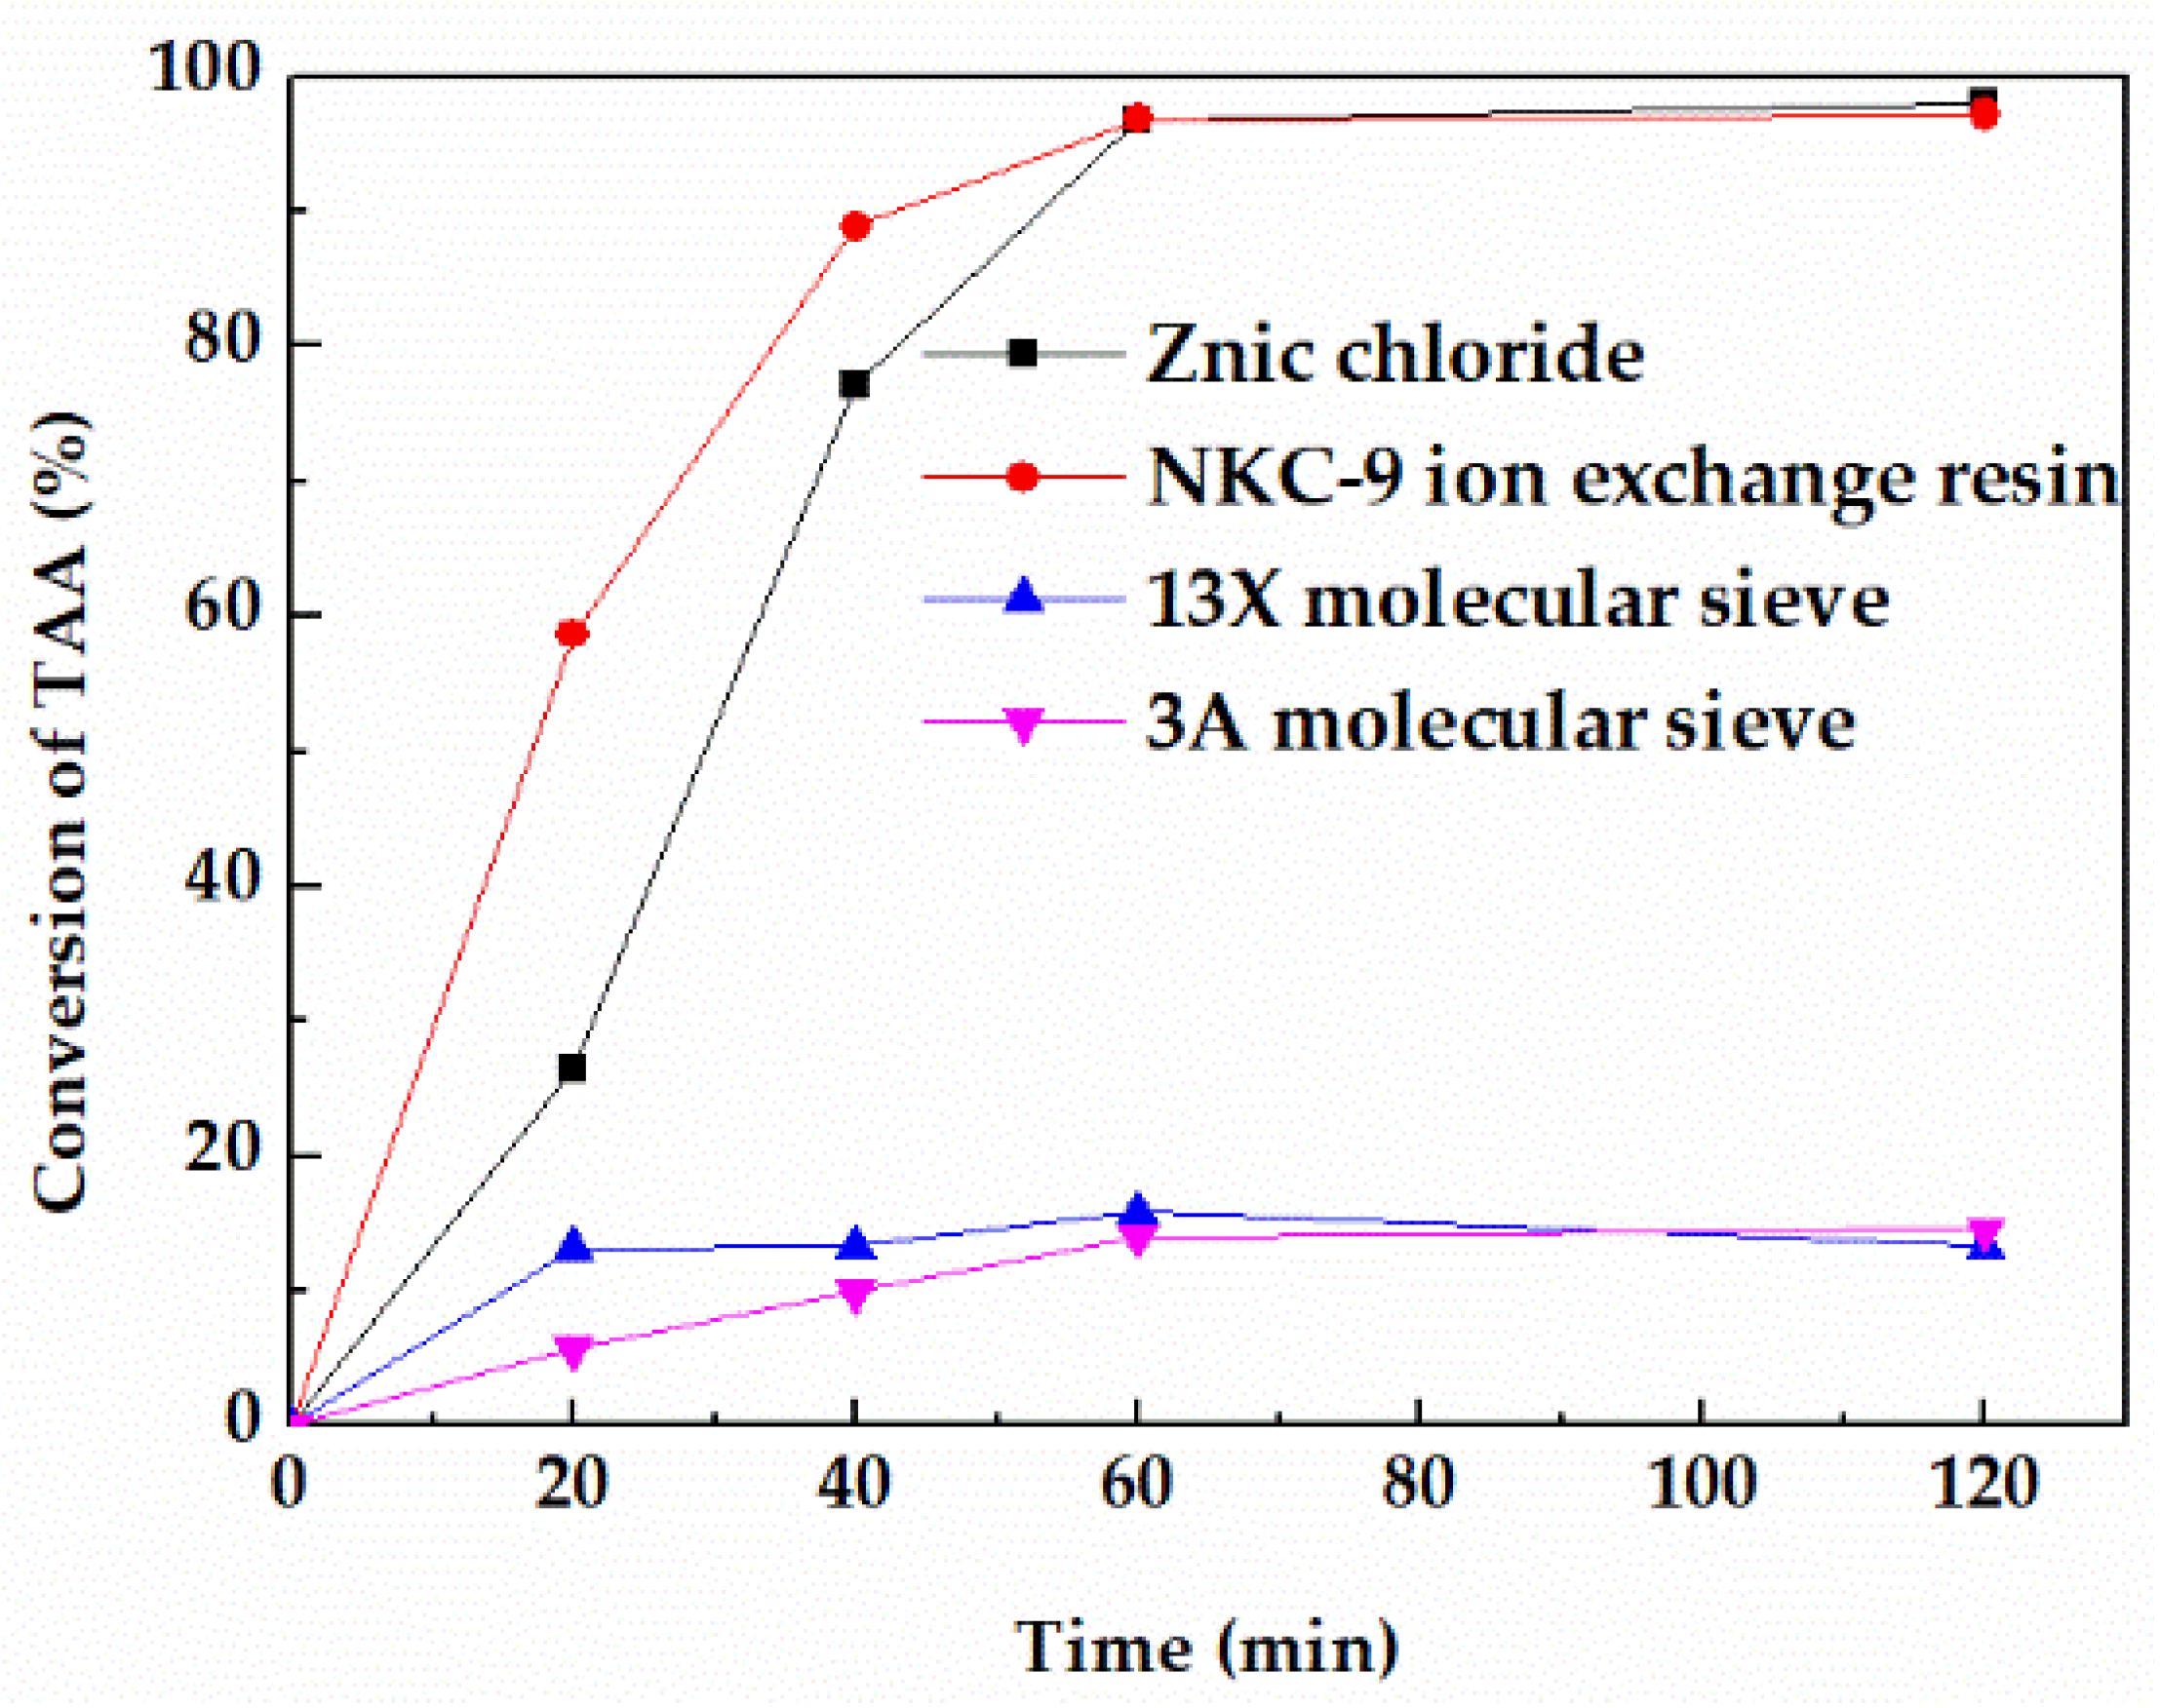
Catalysts exert a significant influence on the reaction, thus four commonly used catalysts in the dehydration reaction including NKC−9 ion exchange resin, 3A molecular sieve, 13X molecular sieve, and zinc chloride were investigated. When the reaction temperature was 353.15 K and the mass ratio of TAA to catalyst was 4/1, the dehydration reaction effects of the four catalysts are shown in Figure 1, and the average reaction rate at 60 min are listed in Table S1.
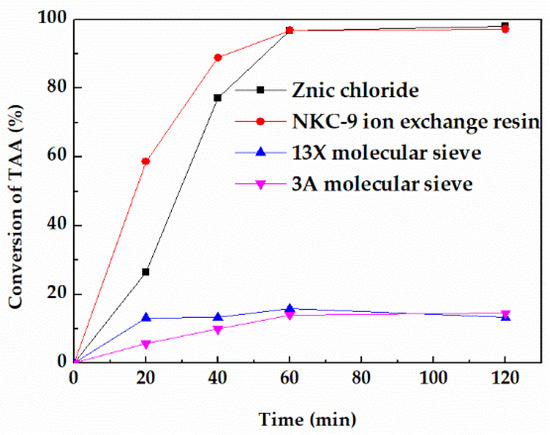
Figure 1.
Effect of different catalysts on the conversion of TAA.
The order of reaction activity is r (zinc chloride) ≈ r (NKC−9) > r (3A molecular sieve) > r (13X) molecular sieve under the same conditions. Zinc chloride showed the highest activity with an average reaction rate of 0.428 mol/L·h−1 at 60 min, which is almost equivalent to that of NKC−9 ion exchange resin. In contrast, the reaction activity of 3A molecular sieve and 13X molecular sieve were significantly lower than that of zinc chloride and NKC−9 ion exchange resin with average reaction rate at 60 min of 0.019 mol/L·h−1 and 0.014 mol/L·h−1 respectively, which was far below that of zinc chloride catalyst.
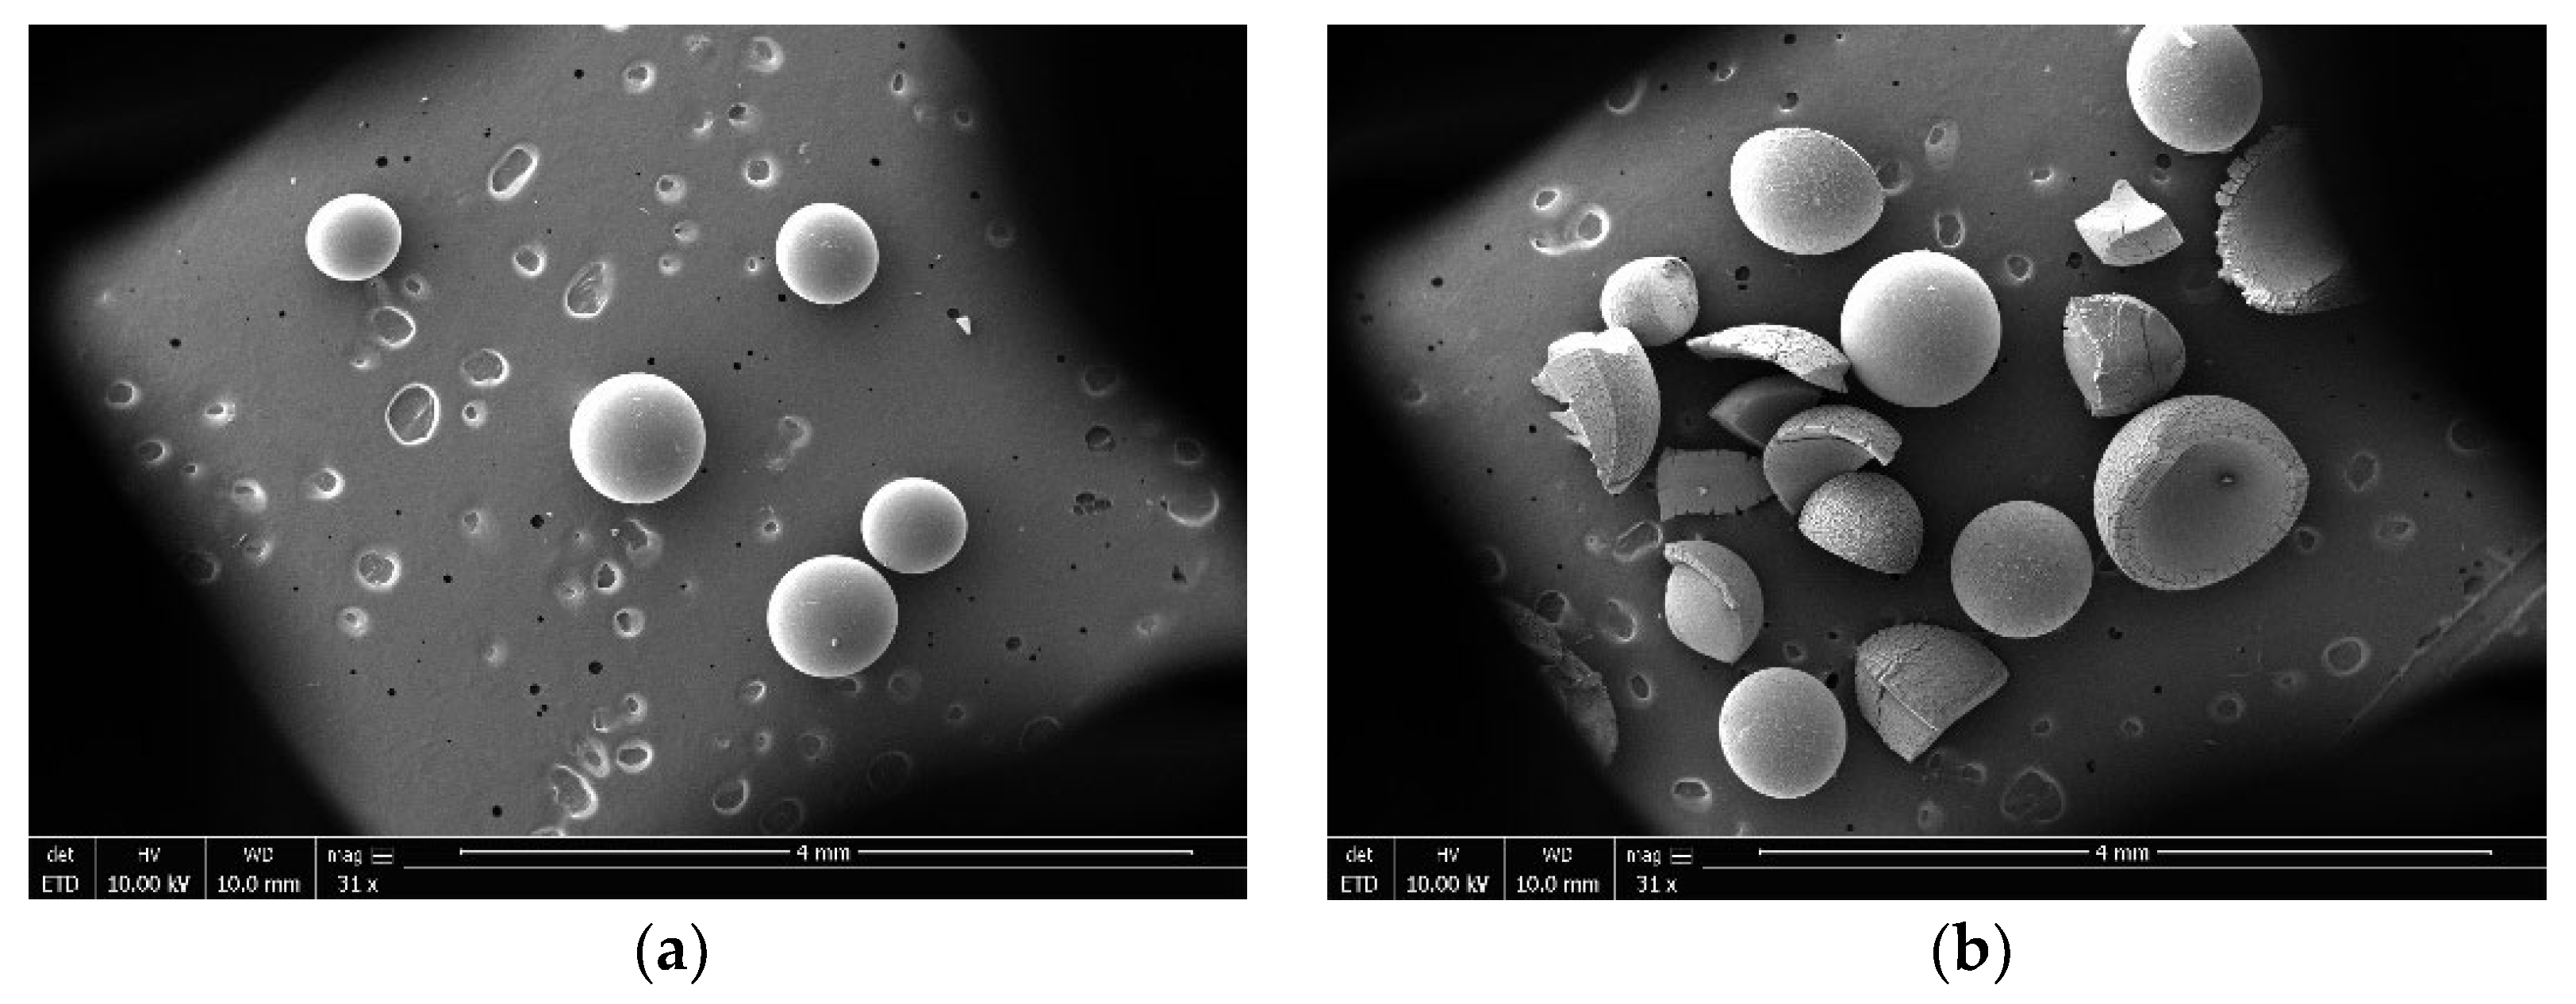
The reaction temperature of molecular sieve catalyst for TAA dehydration is usually higher than 473.15 K. The surface steric effect and weak surface acidity are the main reasons for low activity of molecular sieve in this reaction when the reaction temperature was below 473.15 K [20,21]. However, although the reaction rate of NKC−9 ion exchange resin was equivalent to that of zinc chloride at 353.15 K, it can be clearly seen from Figure 2 that it was broken after use, mainly because the reaction temperature of 353.15 K was close to the maximum operating temperature of NKC−9 (373.15 K), which destroyed the mechanical strength of the catalyst. Therefore, zinc chloride was eventually selected for further study.
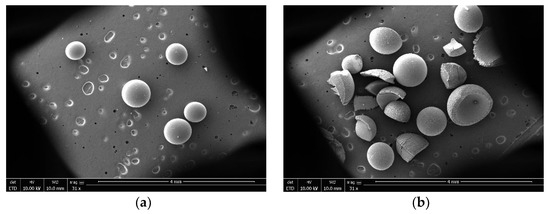
Figure 2.
SEM photomicrographs of NKC−9 catalyst (a) fresh and (b) used.
3.2. Kinetics of Intramolecular Dehydration of TAA Catalyzed by Zinc Chloride
3.2.1. Effect of Reaction Temperature on the Dehydration Reaction Rate of TAA
It can be seen from Equation (3) that the rate of intramolecular dehydration reaction was affected by the rate constant k, while Equation (4) shows that temperature was the main factor affecting the rate constant k. Therefore, this section mainly studied the effect of reaction temperature on the dehydration reaction rate of TAA. Due to a fact that the boiling point temperature of raw materials is 355.15 K under normal pressure, the reaction rate at 338.15–353.15 K was compared under the conditions of feed amount of 1000 g and molar ratio of zinc chloride to TAA of 0.4.
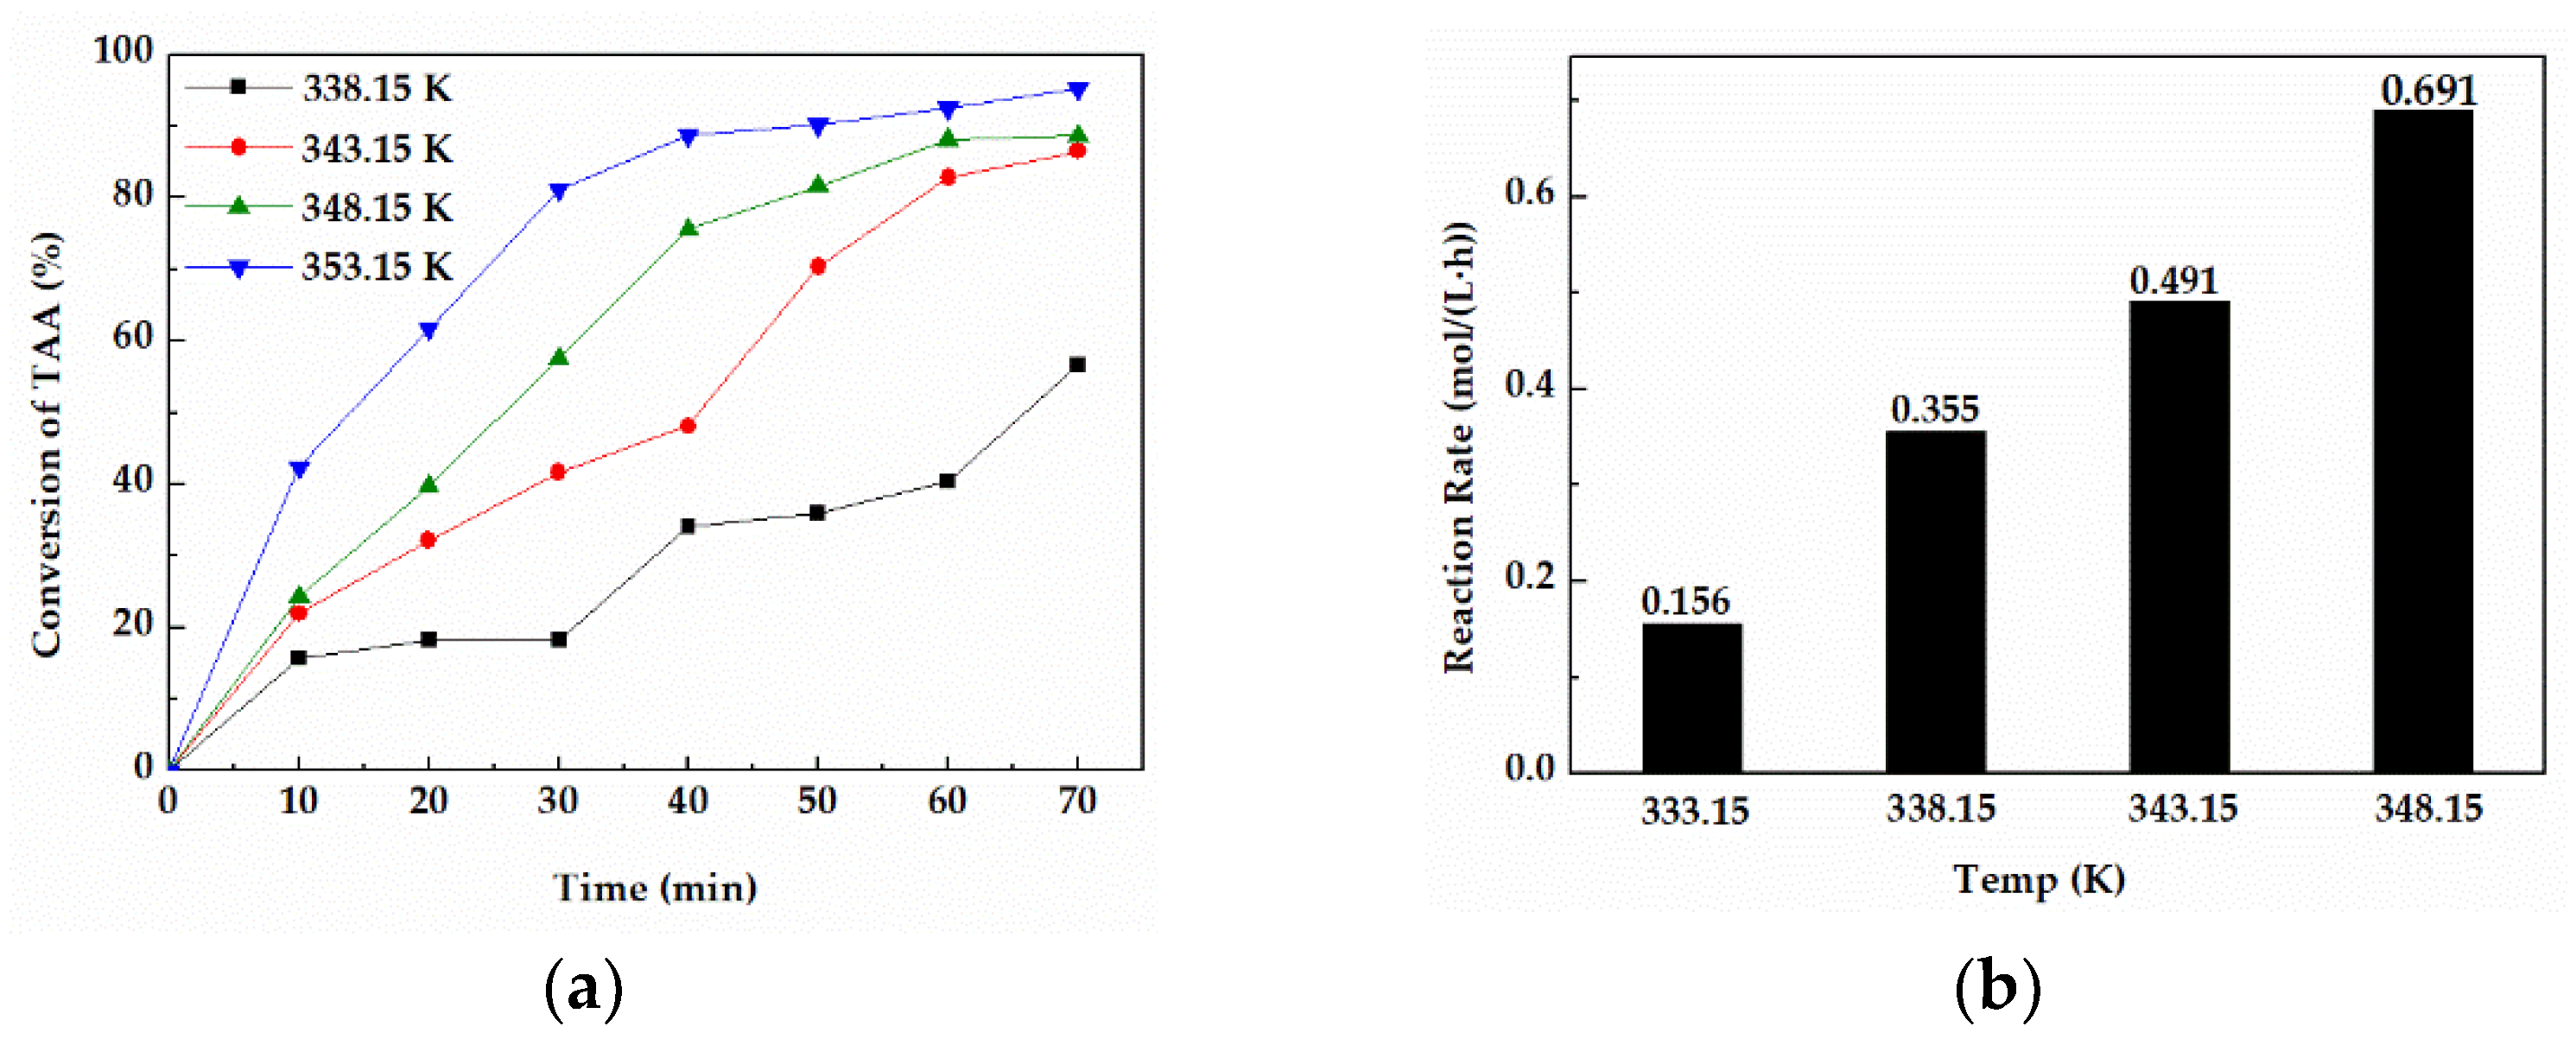
As shown in Figure 3a, the reaction temperature had a significant effect on the conversion of TAA. When the reaction temperature (353.15 K) was close to the boiling point of the cleaning agent, the conversion of TAA could reach 92.47% after 60 min. However, when the temperature was lower than 353.15 K, the reaction rate tended to be slow, and the conversions of TAA were all less than 90% in 60 min. Furthermore, the average reaction rate in 60 min at 353.14 K (Figure 3b) was 0.691 mol/(L·h), which was remarkably higher than that under other temperatures.
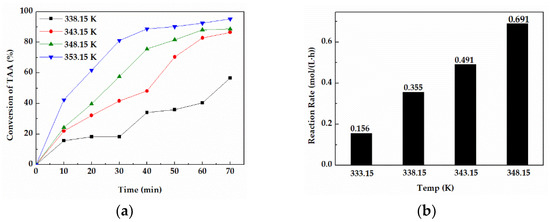
Figure 3.
(a) Conversions of TAA at different temperatures for 70 min. (b) The average reaction rate in 30 min at different temperatures.
3.2.2. Reaction Kinetic Model
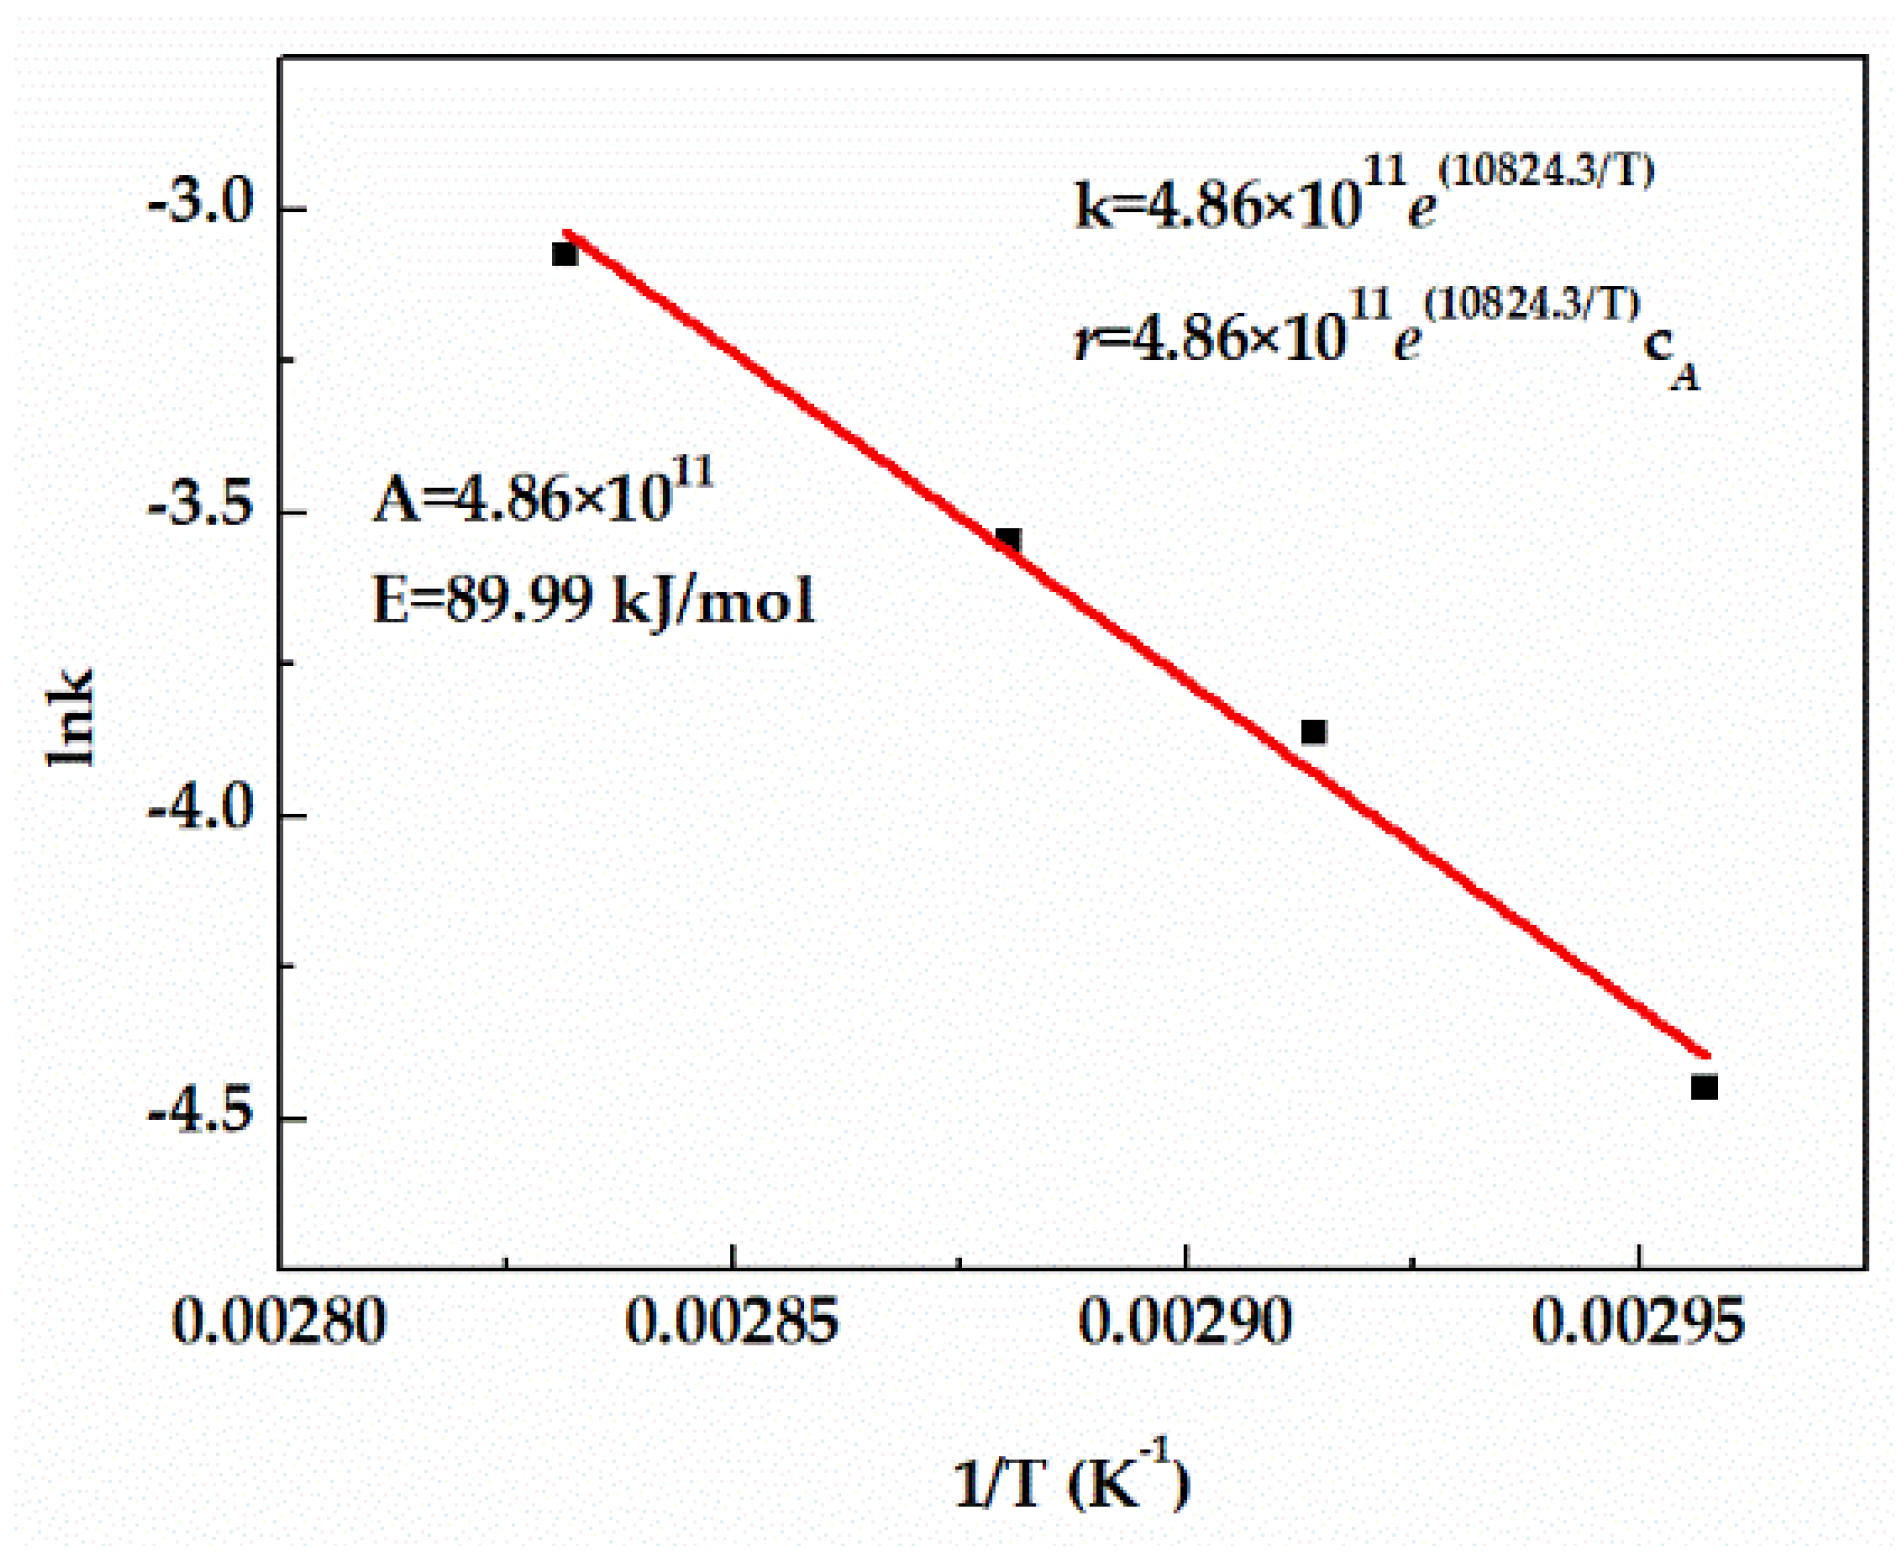
The rate constant k of TAA dehydration in the kinetic equation can be determined by fitting the relationship equation between reaction temperature and reaction rate. Figure 4 displays good first−order fitting results of the TAA conversion, enabling the application of the first−order fitting equation to the reaction. It can also be seen that the rate constant k increased constantly with the increase of temperature, which also confirmed that the increase of temperature promoted the acceleration of the reaction rate. Pre−exponential factor (A) and activation energy (E) were calculated by the relationship curve between lnk and 1/T, and the rate constant k and reaction rate equation are shown in Figure 4.

Figure 4.
Effect of temperature on reaction rate constant.
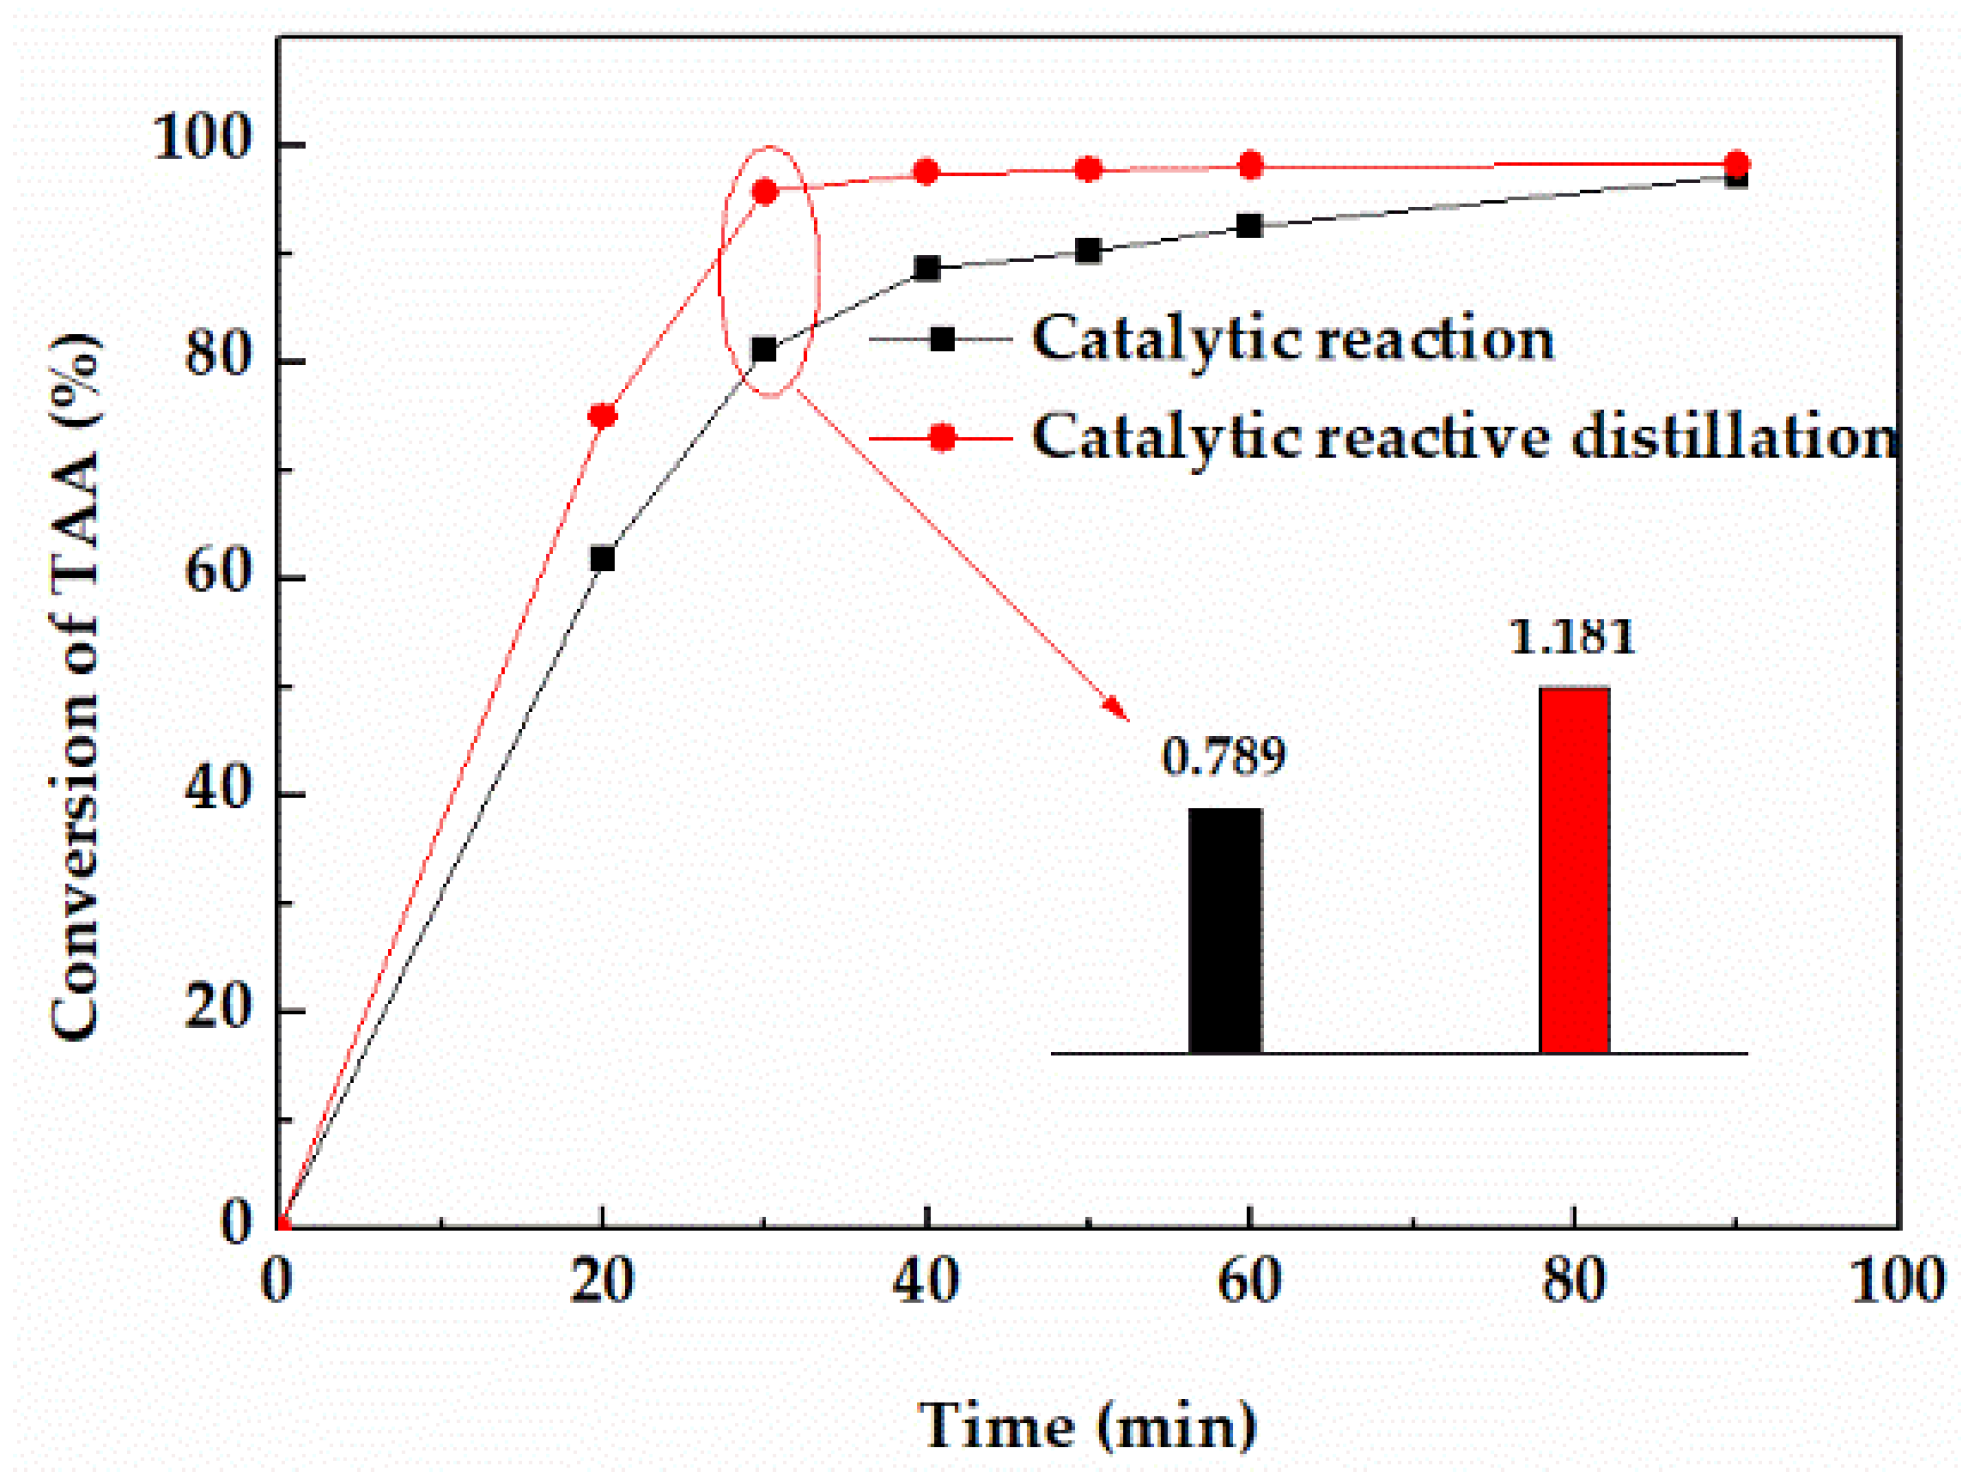
3.2.3. Effect of Distillation on the Reaction Rate
In order to study the effect of distillation on the dehydration reaction, the conversion and reaction rate of TAA in device A and B were compared under the same conditions. As shown in Figure 5, after the addition of a distillation column, the conversion of TAA was significantly improved. The conversion in device A could reach 92.44% in 20 min, while that of device B needed 60 min. Besides, the equilibrium time in device A was about 40 min, while that of device B was 90 min. The average reaction rate of 30 min showed that the reaction rate of device A was about 50% higher than that of device B. The results showed that distillation could significantly improve the dehydration reaction rate mainly due to the removal of dehydrated products 2−methyl−1−butene (2MB−1) and 2−methyl−2−butene (2MB−2) from the reactor by distillation, which accelerated the forward reaction, and then further improved the reaction rate.
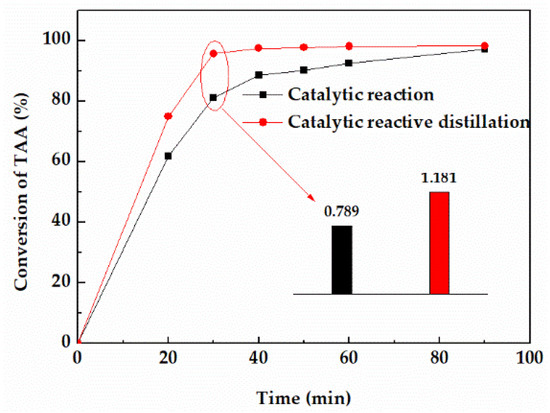
Figure 5.
Effect of distillation on the conversion of TAA.
3.3. Optimization of Operating Conditions for Catalytic Reaction Distillation
To obtain the optimal operation parameters of reactive distillation and provide initial conditions for process simulation, the effects of catalyst amount and reflux ratio were studied in the conversion of TAA and the recovery of F7A.
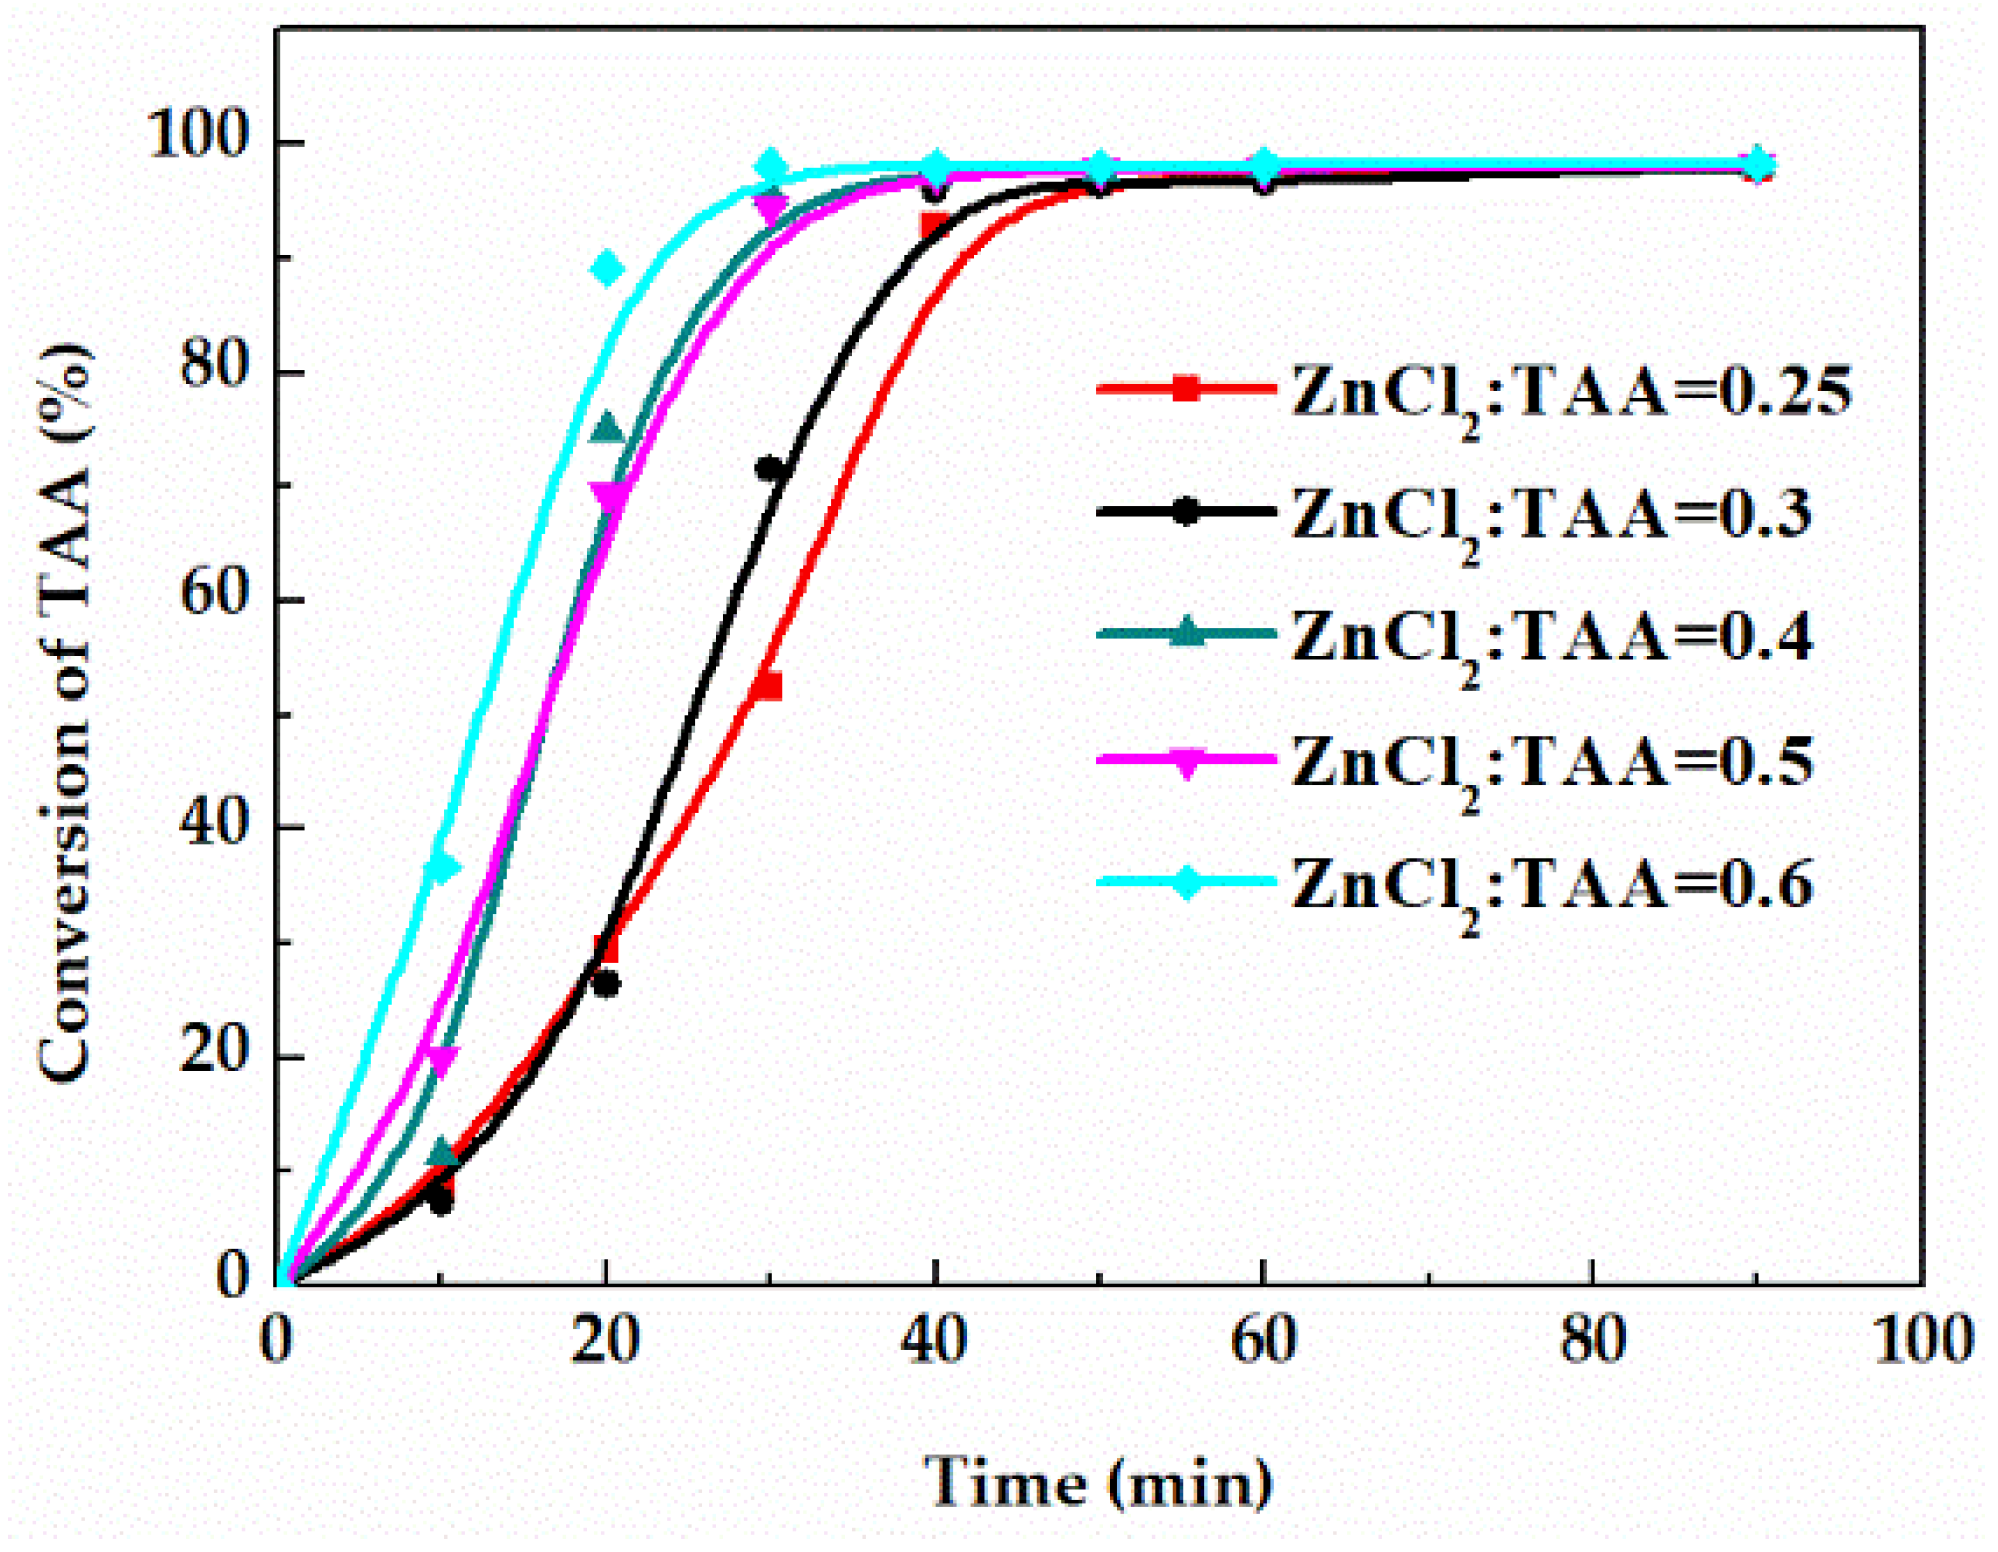
3.3.1. Effect of Catalyst Amount on the Conversion of TAA
The catalyst amount is an important factor affecting the reaction rate. Therefore, related measurements were taken on the conversion of TAA curves under the catalyst amount (the molar ratio of the ZnCl2 to TAA) of 0.25, 0.3, 0.4, 0.5 and 0.6. As shown in Figure 6, with the increase of catalyst amount, the time for the reaction to reach equilibrium was shortened. Since the catalyst did not affect the equilibrium, the equilibrium conversion of TAA using a different catalyst amount was unchanged. Additionally, excess catalyst will lead to the rise of solid content and operating duty. Thus, the optimal molar ratio of ZnCl2 to TAA is 0.6.

Figure 6.
Effect of catalyst amount on the conversion of TAA.
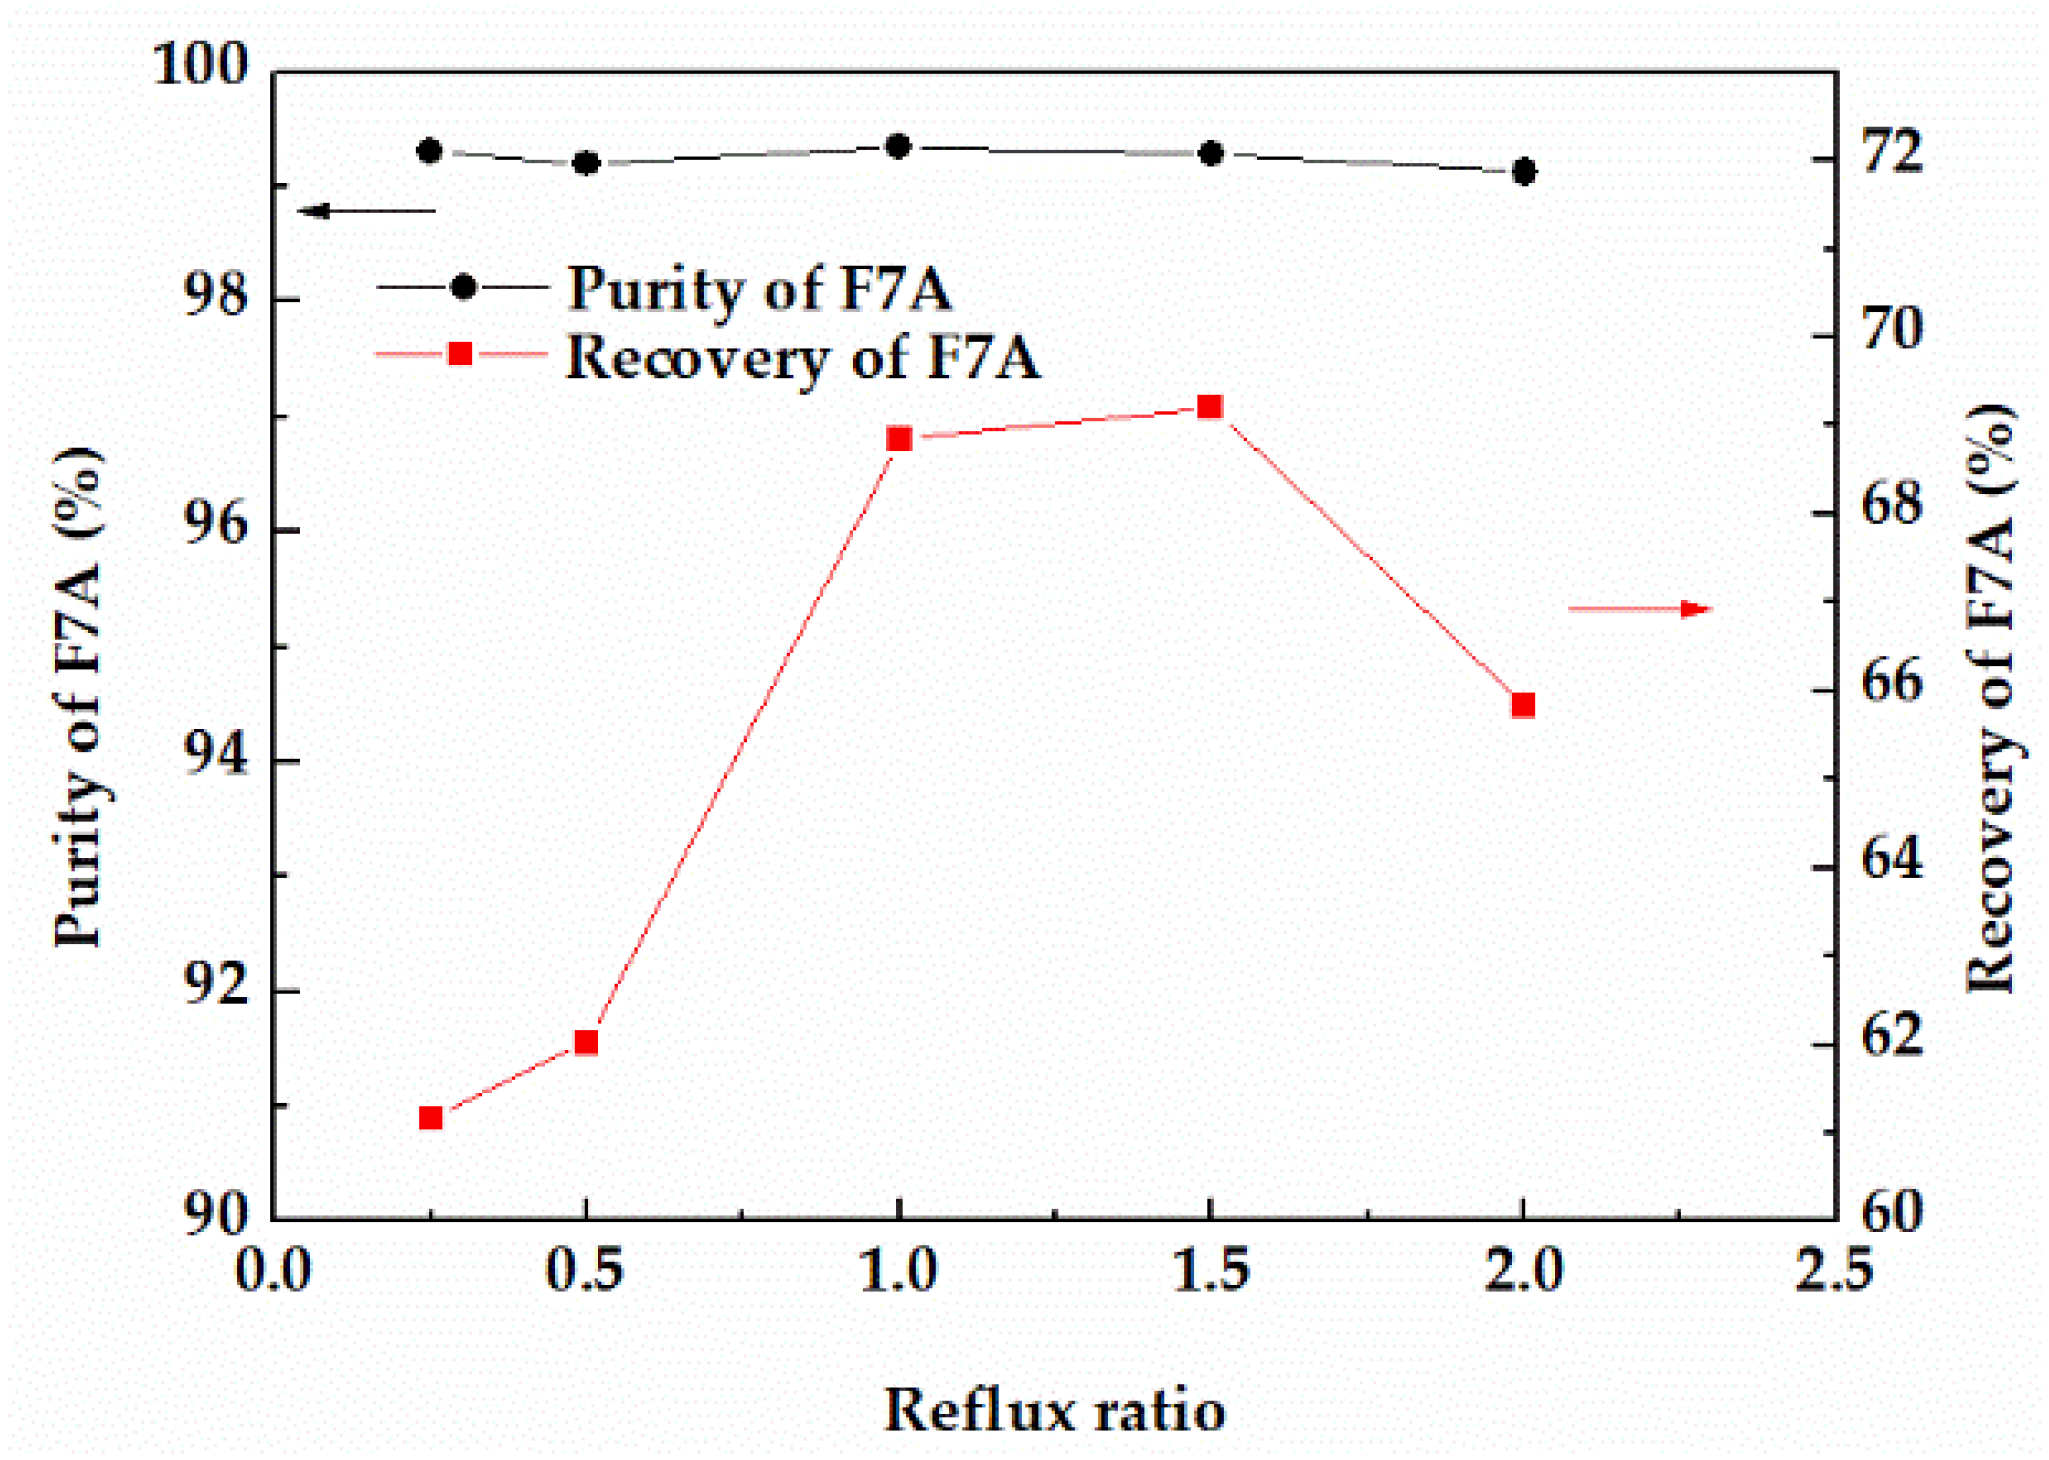
3.3.2. Effect of Reflux Ratio on the Purity and Recovery of F7A
In reactive distillation, the change of reflux ratio will affect the purity and recovery of the product as well. The effects of reflux ratios on the purity and recovery of F7A were compared at 353.15 K. With the increase of reflux ratio, the recovery of F7A with purity of 99% increased first and then showed a decreasing tendency (Figure 7). When the reflux ratio was less than 1, F7A and dehydration products at the top of the column could not be completely separated, resulting in the loss of F7A. When the reflux ratio was higher than 1.5, the operation time was longer, and the recovery of F7A tended to decrease. From the perspective of high purity and recovery, when the reflux ratio was 1, the recovery and purity of F7A could achieve 68.8% and 99.3%, respectively.
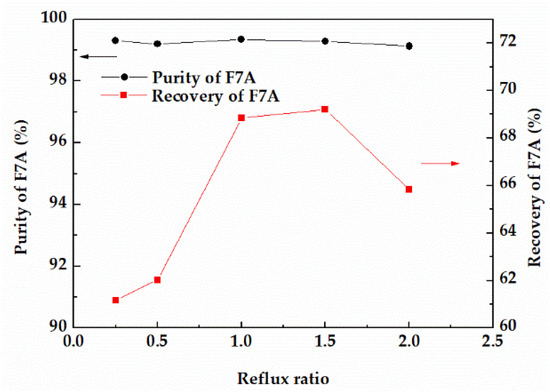
Figure 7.
Effect of reflux ratio on the purity and recovery of F7A.
3.3.3. Recovery Effect of F7A
Based on the optimized process parameters, the recovery results of F7A are shown in Table 1. It can be seen from that the purity of recovered F7A was higher than 99%, which means it basically reached the purity standard of product. Meanwhile, the highest recovery was 73.5% and the lowest was 65.5% with an average recovery of 70.8%.

Table 1.
Recovery results of F7A.
3.4. Simulation of Reactive Distillation Process
Aspen Plus V11 was used to simulate the reactive distillation process, and the missing physical properties of F7A were estimated by PCES method. The simulation process adopted the steady−state equilibrium model, and the NRTL−RK model was used to predict vapor−liquid equilibrium. The Rad Frac module was employed to simulate distillation columns to achieve more accurate calculations of process parameters obtained by the above DSTWU module (Table 2). As shown in Scheme 2, this process contained two distillation columns, in which column 1 was the reaction column, and column 2 was the distillation column. Based on the simulation results, sensitivity analysis was conducted on the stage number, feed stage, reflux ratio, and heat duty for each distillation column. Accordingly, the effects of operation conditions on the purity and recovery of F7A were discussed.
Table 2.
Key parameters and heat duty in column 1 and column 2.
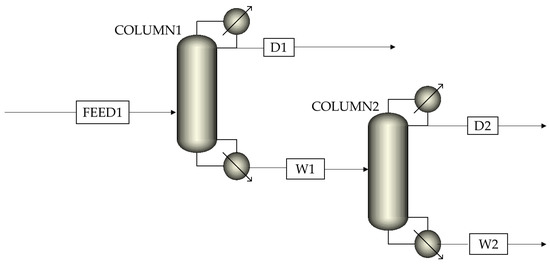
Scheme 2.
Reactive distillation simulation process with two columns.
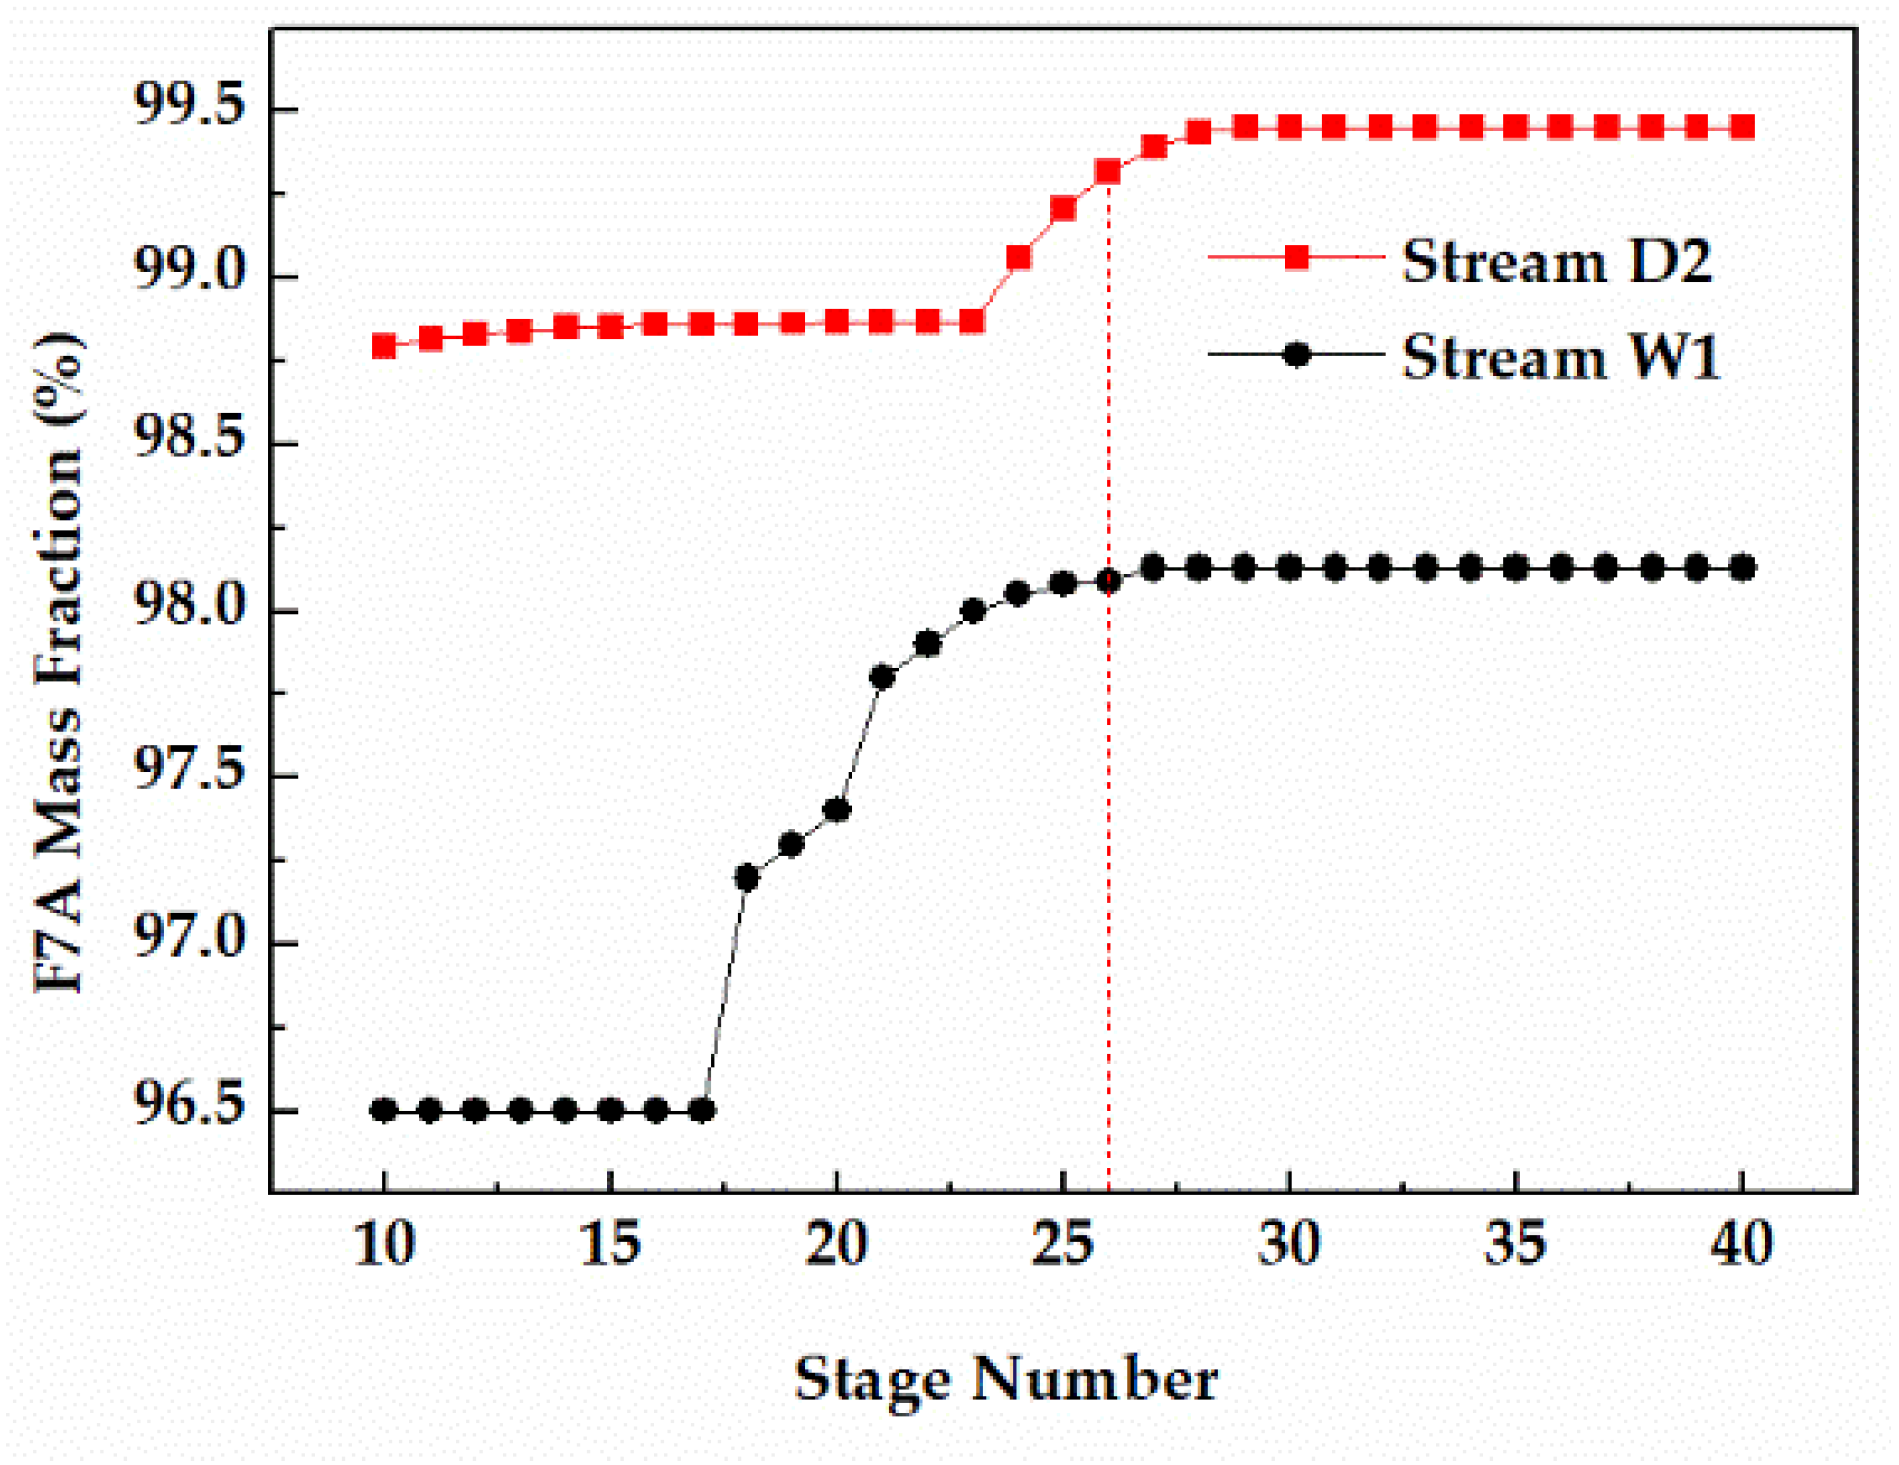
3.4.1. Stage Number
The number of theoretical stages is directly related to the separation effect of the distillation. For the reaction column, increasing the F7A mass fraction in the bottom (Stream W1) was more conducive to the recovery of F7A. For the distillation column, the key is to obtain F7A with purity higher than 99% in high recovery (Stream D2). As shown in Figure 8, when the number of theoretical stages in column 1 was 26, the F7A mass fraction in stream W1 exceeded 98% and tended to be stable. At the same time, when the number of theoretical stages of column 2 was 26, the F7A mass fraction in stream D2 exceeded 99%, reaching the optimization target. Therefore, the number of theoretical stages of reaction tower and distillation column was determined to be 26.
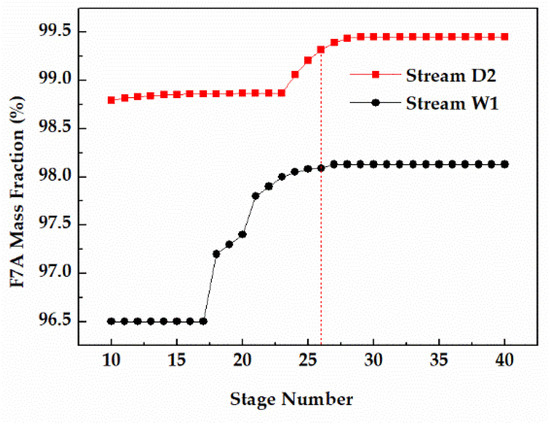
Figure 8.
Effect of stage number on F7A mass fraction in stream W1 and D2.
3.4.2. Feed Stage
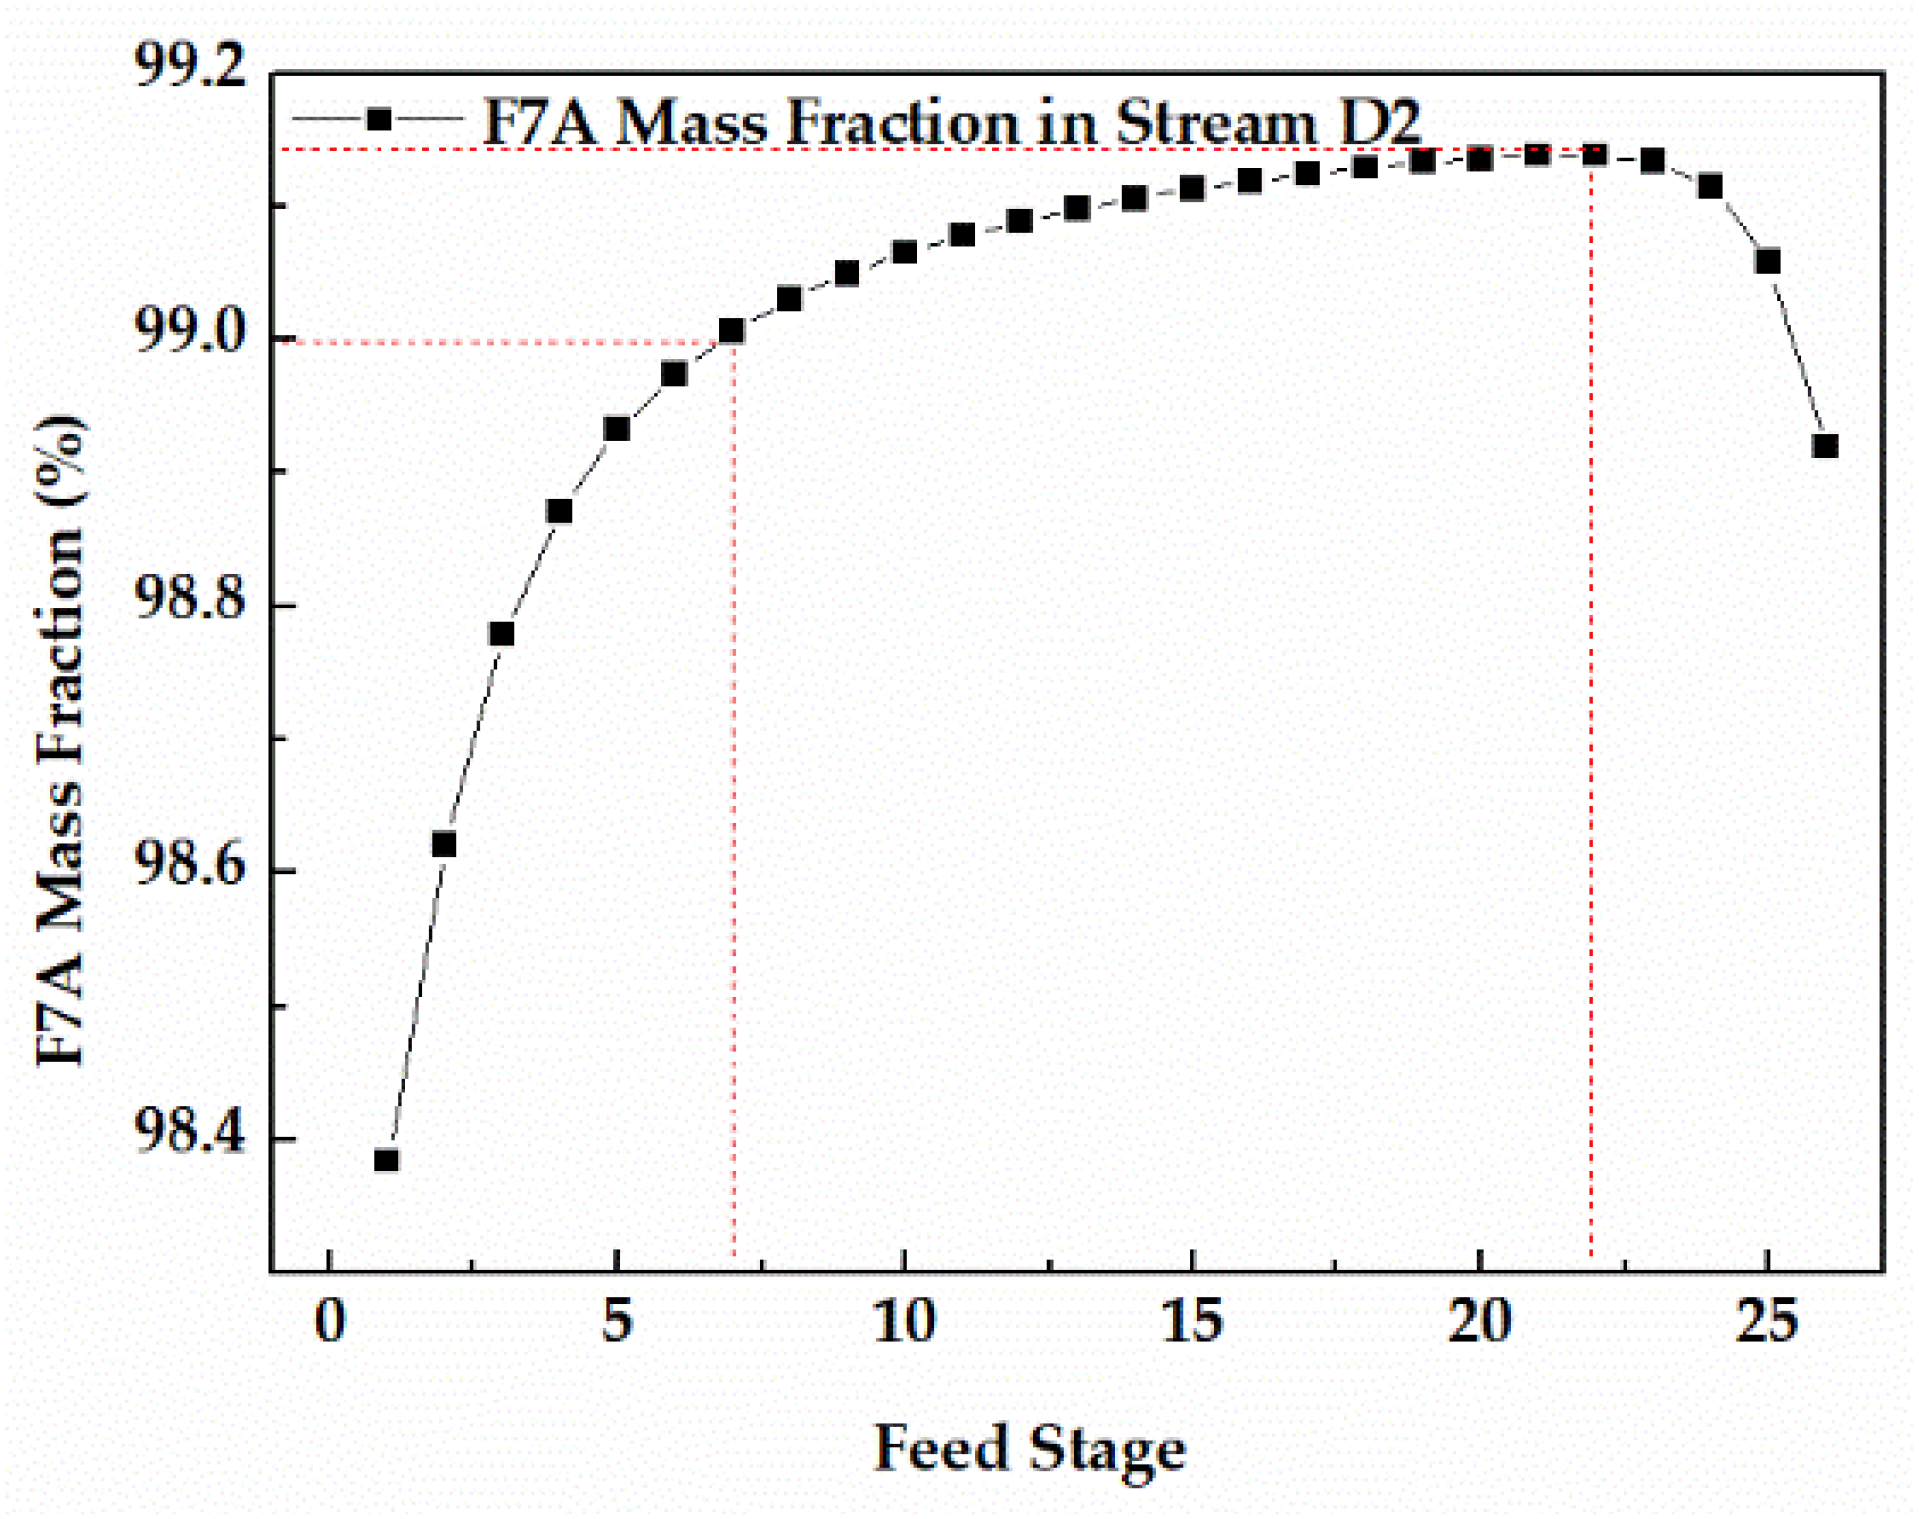
Since the dehydration of TAA occurred in the bottom of column 1, the feed stage of column 1 was 26. The feed stage of stream W1 had a significant effect on the F7A mass fraction in stream D2, and the appropriate feed stage was favorable to get F7A with higher purity. The sensitivity analysis of stream W1 feed stage in column 2 is shown in the Figure 9. When the feed stage was 7, the F7A mass fraction in stream D2 reached 99.0%, conforming to the technical requirements. When the feed stage moved to 22, the F7A mass fraction reached the maximum. If the feed stage continued to move downward, it led to the decrease of the F7A mass fraction. Thus, the best feed stage proved to be 22.
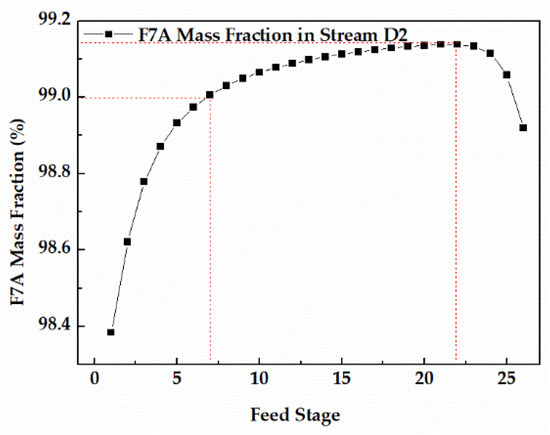
Figure 9.
Effect of feed stage on F7A mass fraction in stream D2.
3.4.3. Reflux Ratio
In column 1, the F7A mass flow and F7A mass fraction in stream W1 displayed similar trends as shown in Figure 10a. When the reflux ratio was 4, the F7A mass fraction reached 98%, and the continuous increase of reflux ratio had little effect on that. In column 2, the F7A mass fraction increased first and then decreased during the process of reflux ratio (Figure 10b). When the reflux ratio was 2.5, the F7A mass fraction exceeded 99%. Although the increase of reflux ratio can increase the F7A mass fraction, it will also reduce the product mass flow and increase the operation duty. Therefore, combined with F7A mass fraction and mass flow, the optimal values of reflux ratio were 4 and 2.5, respectively.
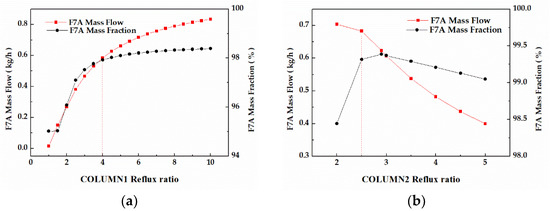
Figure 10.
(a) Effect of reflux ratios on F7A mass fraction and F7A mass flow in stream W1. (b) Effect of reflux ratios on F7A mass fraction and F7A mass flow in stream D2.
3.4.4. Heat Duty
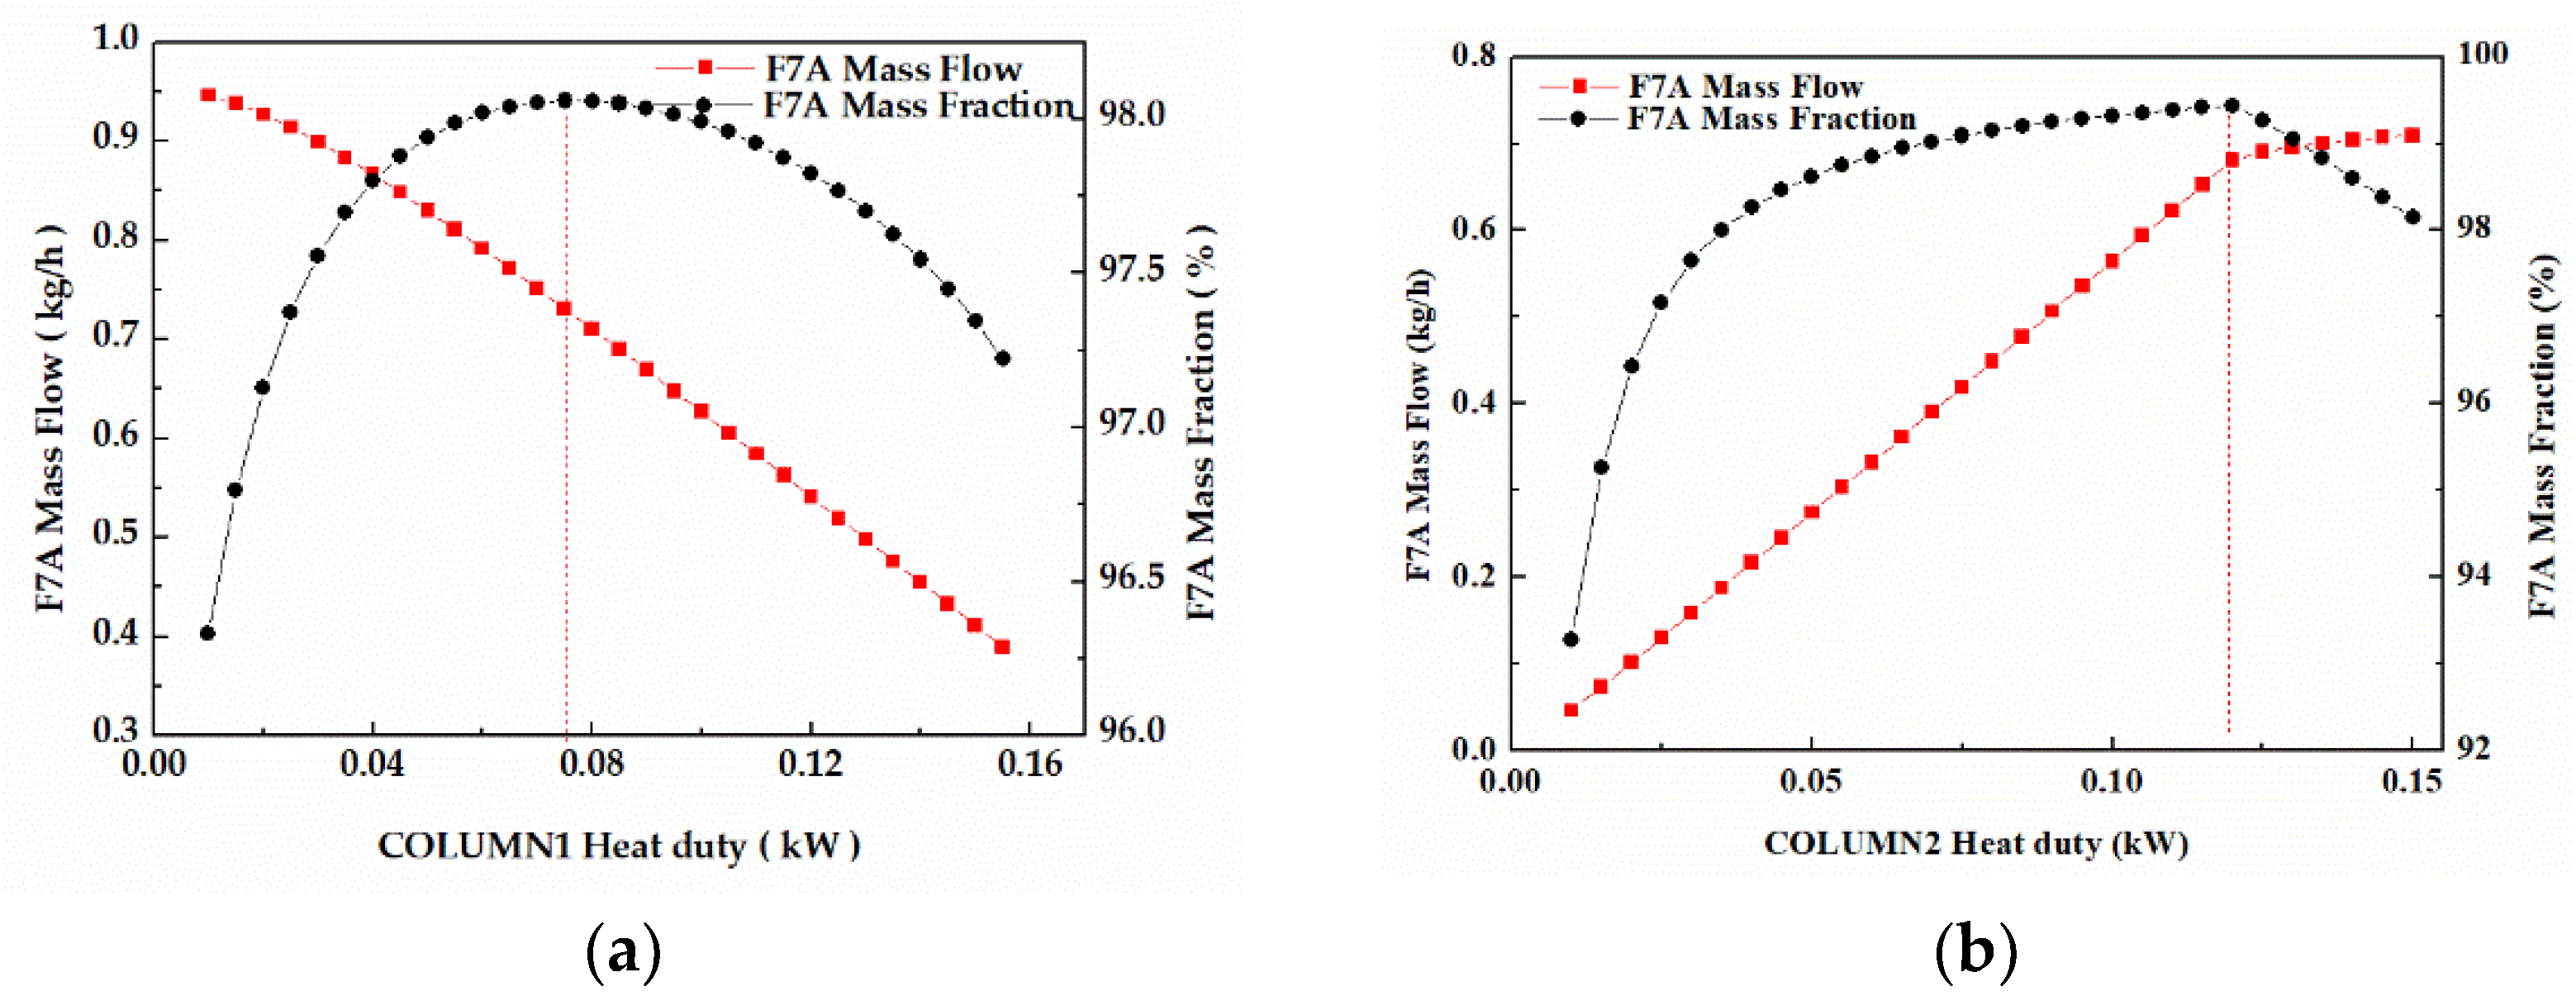
In column 1 (Figure 11a), the F7A mass fraction increased first and then decreased with the increase of reboiler heat duty, while the F7A mass flow appeared to gradually decrease. When reboiler heat duty was 0.075 kW, the F7A mass fraction in stream W1 reached top (98.1%). While feed flow was fixed, enhancing reboiler heat duty would cause the change of reflux ratio, thus affecting F7A mass flow and the F7A mass fraction in stream W1. The same phenomenon occurred in column 2 (Figure 11b). Considering the influence of reboiler heat duty on mass flow and mass fraction, the optimal values of reboiler heat duty were 0.075 and 0.12 kW, respectively.
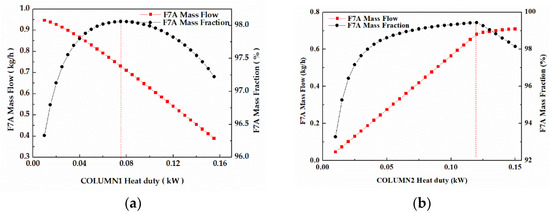
Figure 11.
(a) Effect of reboiler heat duty on F7A mass fraction and F7A mass flow in stream W1. (b) Effect of reboiler heat duty on F7A mass fraction and F7A mass flow in stream D2.
3.4.5. Analysis of Simulation Results in Distillation Columns
The profiles of temperature and F7A mass fraction with the height in distillation columns operated under optimized parameters are shown in Figures S3 and S4. The simulation results under the optimum conditions are shown in Table 3 and Table 4. It is observed that the dual−column distillation process can realize the recovery of F7A with purity of 99.4%. Due to the large number of total stages (26) and the large reflux ratio of 4 in column 1, the F7A mass fraction in stream W1 reached 98% with TAA mass fraction lower than 2 ppm. In column 2, high purity of F7A (99.4%) and large F7A mass flow (0.699 kg/h) could be achieved by total stages of 26 and reflux ratio of 2.5. The recovery rate of F7A was 73.1%, which was consistent with that of the experimental results (70.8%).
Table 3.
Mass flow and mass fraction in all streams.
Table 4.
Key parameters and heat duty in column 1 and column 2.
4. Conclusions
The following conclusions were obtained through the screening of catalysts for intramolecular dehydration of TAA, the study of reaction kinetics, the process optimization, and the steady−state simulation of reactive distillation process:
- (1)
- NKC−9 ion exchange resin, 3A molecular sieve, 13X molecular sieve, and zinc chloride can catalyze TAA dehydration reaction, among which zinc chloride displays the highest catalytic performance and the longest life.
- (2)
- The kinetic data of TAA dehydration reaction were measured, and the model parameters were fitted. According to the fitting results, pre−exponential factor (A = 4.86 × 10¹¹) and activation energy (E = 89.99 kJ/mol) were calculated.
- (3)
- A dual−column distillation process was proposed and verified, through which the stage number, feed stage, reflux ratio, and reboiler heat duty were determined to be 26/26, 26/22, 4/2.5, and 0.075/0.12 kW in column 1 and column 2, respectively. Under the optimal process conditions, the recovery of F7A was 73.1% and the purity was 99.4%.
This work provides an efficient, green way to recycle F7A from spent azeotropes, which is beneficial to reduce the cost of commercial cleaning agent F7A and has a positive effect on subsequent promotion.
Supplementary Materials
The following supporting information can be downloaded at: https://www.mdpi.com/article/10.3390/pr10061146/s1, Figure S1: Reactive distillation experimental system (device A); Figure S2: Catalytic reaction experimental system (device B); Figure S3: Temperature distribution in column 1 and column 2; Figure S4: (a) Liquid phase distribution in column 1. (b) Liquid phase distribution in column 2; Table S1: Effect of different catalysts to the reaction rate.
Author Contributions
Conceptualization, Y.M. and L.D.; methodology, Y.M.; software, Y.M.; validation, Y.M.; formal analysis, Y.M. and L.D.; investigation, Y.M.; resources, H.Q.; data curation, Y.M.; writing—original draft preparation, Y.M.; writing—review and editing, L.D. and C.Z.; visualization, C.Z.; supervision, C.Z. and H.Q.; project administration, H.Q.; funding acquisition, H.Q. All authors have read and agreed to the published version of the manuscript.
Funding
This research received no external funding.
Conflicts of Interest
The authors declare no conflict of interest.
References
- Forster, P.; Storelvmo, T.; Armour, K.; Collins, W.; Dufresne, J.-L.; Frame, D.; Lunt, D.J.; Mauritsen, T.; Palmer, M.D.; Watanabe, M.; et al. The earth’s energy budget, climate feedbacks, and climate sensitivity. In Climate Change 2021: The Physical Science Basis. Contribution of Working Group I to the Sixth Assessment Report of the Intergovernmental Panel on Climate Change; Masson-Delmotte, V., Zhai, P., Pirani, A., Connors, S.L., Péan, C., Berger, S., Caud, N., Chen, Y., Goldfarb, L., Gomis, M.I., et al., Eds.; Cambridge University Press: Cambridge, UK; New York, NY, USA, 2021; pp. 923–1054. [Google Scholar]
- Zhang, C.P. Investigation on Synthesis of 1H,1H,2H-Heptafluorocyclopentane; Beijing Institute of Technology: Beijing, China, 2017; pp. 1–5. [Google Scholar]
- Sasaki, Y.; Hanawa, Y.; Nadahara, S.; UedaHiroaki, D.; Kitagawa, H.; Okumura, K. Substrate Treating Apparatus and Substrate Treating Method. U.S. Patent No. 10,153,181, 11 December 2018. [Google Scholar]
- Ando, K.; Otsuki, N. Release Solvent Composition, Release Method, and Cleaning Solvent Composition. European Patent No. 3,296,366, 5 September 2016. [Google Scholar]
- Bartelt, J.E. Azeotrope-Like Mixtures Comprising Heptafluorocyclopentane. U.S. Patent No. 7,540,973, 2 June 2009. [Google Scholar]
- Ando, K.; Sugawara, M. Recycling Method and Recycling Device for Cleaning Solvent Composition, and Cleaning Method and Cleaning System for Object to be Cleaned. Japanese Patent No. 2,019,552,767, 2 November 2018. [Google Scholar]
- Kiss, A.A.; Jobson, M.; Gao, X. Reactive distillation: Stepping up to the next level of process intensification. Ind. Eng. Chem. Res. 2019, 58, 5909–5918. [Google Scholar] [CrossRef] [Green Version]
- Yang, A.; Shen, W.; Wei, S.; Dong, L.; Li, J.; Gerbaud, V. Design and control of pressure-swing distillation for separating ternary systems with three binary minimum azeotropes. AIChE J. 2019, 65, 1281–1293. [Google Scholar] [CrossRef] [Green Version]
- Yang, A.; Sun, S.; Shi, T.; Xu, D.; Ren, J.; Shen, W. Energy-efficient extractive pressure-swing distillation for separating binary minimum azeotropic mixture dimethyl carbonate and ethanol. Sep. Purif. Technol. 2019, 229, 115817. [Google Scholar] [CrossRef]
- Liang, S.; Cao, Y.; Liu, X.; Li, X.; Zhao, Y.; Wang, Y. Insight into pressure-swing distillation from azeotropic phenomenon to dynamic control. Chem. Eng. Res. Des. 2017, 117, 318–335. [Google Scholar] [CrossRef]
- Rameshwar, S.H.; Nitin, V.B.; Yogesh, S.M. Industrial applications of reactive distillation: Recent trends. Int. J. Chem. React. Eng. 2004, 2, 1–51. [Google Scholar]
- Kiss, A.A. Novel catalytic reactive distillation processes for a sustainable chemical industry. Top. Catal. 2019, 62, 1132–1148. [Google Scholar] [CrossRef] [Green Version]
- Kaymak, D.B. Design and control of an alternative bioethanol purification process via reactive distillation from fermentation broth. Ind. Eng. Chem. Res. 2019, 58, 1675–1685. [Google Scholar] [CrossRef]
- Park, J.; Jeong, Y.; Han, M. Process intensification of reactive distillation using improved RCMs: Acetic acid production. Chem. Eng. Processing-Process Intensif. 2020, 157, 108136. [Google Scholar] [CrossRef]
- Kiss, A.A. Heat-integrated reactive distillation process for synthesis of fatty esters. Fuel Process. Technol. 2011, 92, 1288–1296. [Google Scholar] [CrossRef]
- An, W.Z.; Lin, Z.X.; Chen, J. Simulation and analysis of a reactive distillation column for removal of water from ethanol–water mixtures. Ind. Eng. Chem. Res. 2014, 53, 6056–6064. [Google Scholar] [CrossRef]
- Yadav, G.D.; Joshi, A.V. Etherification of tert-amyl alcohol with methanol over ion-exchange resin. Org. Process Res. Dev. 2001, 5, 408–414. [Google Scholar] [CrossRef]
- Marıa, A.P.; Bringue, R.; Iborra, M.; Tejero, J.; Cunill, F. Kinetic study of 1-butanol dehydration to di-n-butyl ether over amberlyst. AIChE J. 2016, 62, 180–194. [Google Scholar]
- Cunill, F.; Vila, M.; Izquierdo, J.F. Effect of water presence on methyl tert-butyl ether and ethyl tert-butyl ether liquid-phase syntheses. Ind. Eng. Chem. Res. 1993, 32, 564–569. [Google Scholar] [CrossRef]
- Nguyen, C.M.; Reyniers, M.F.; Marin, G.B. Theoretical study of the adsorption of the butanol isomers in H-ZSM-5. J. Phys. Chem. C 2011, 115, 8658–8669. [Google Scholar] [CrossRef] [Green Version]
- Nel, R.J.J.; Klerk, A.D. Dehydration of C5−C12 linear 1-alcohols over η-alumina to fuel ethers. Ind. Eng. Chem. Res. 2009, 48, 5230–5238. [Google Scholar] [CrossRef]


Publisher’s Note: MDPI stays neutral with regard to jurisdictional claims in published maps and institutional affiliations. |
© 2022 by the authors. Licensee MDPI, Basel, Switzerland. This article is an open access article distributed under the terms and conditions of the Creative Commons Attribution (CC BY) license (https://creativecommons.org/licenses/by/4.0/).