Article

A Novel MPPT Heating Control Strategy Applied to the Induction Heating System

1
Department of Electrical Engineering, National Taiwan University of Science & Technology, Taipei 10607, Taiwan
2
Undergraduate Program of Vehicle and Energy Engineering, National Taiwan Normal University, Taipei 10620, Taiwan
*
Author to whom correspondence should be addressed.
Processes 2022, 10(6), 1151; https://doi.org/10.3390/pr10061151
Submission received: 18 May 2022 / Revised: 7 June 2022 / Accepted: 7 June 2022 / Published: 8 June 2022

Abstract

:
This study proposes an induction heating system with maximum power-point tracking (MPPT) control strategy. The system architecture adopts a 1.3 kW full-bridge series resonant circuit with a step-down transformer and adjusts the operating frequency by a microcontroller unit to improve the heating efficiency. Secondly, the proposed MPPT control strategy based on induction heating uses the relationship between the operating frequency and the system heating temperature to find the operating frequency corresponding to the maximum power point (MPP) quickly. Then, an additional hill-climbing algorithm adjusting the duty cycle is applied to reach the duty cycle corresponding to the MPP. Under the simulation and actual experimental measurement, the traditional control strategy has 76% and 68% at 500 and 750 degrees, respectively, and it takes 320 s for the system to reach 750 degrees. By contrast, the proposed MPPT control strategy achieves 96% efficiency when the system heating temperature is 500 and 750 degrees, and it only takes 120 s to reach the system heating temperature to 750 degrees. The contribution of this study is that the traditional full-bridge series resonant converter is implemented for the proposed induction heating system, where the proposed MPPT control strategy applied to the proposed induction heating system significantly has high efficiency, high stability, and high heating speed advantages, which can be accurately controlled.

1. Introduction

Traditional heating technology generates heat by burning coal, gas, biomass, etc. The process of burning causes problems, such as environmental pollution and low heating efficiency. Therefore, using the electric method for heating has been increasingly popular and well developed, including resistance heating [1], infrared heating [2], microwave heating [3,4], and induction heating [5,6,7,8], and other technologies. The comparison between these four heating methods is shown in Table 1. Induction heating has a simple mechanical structure, safety features without an open flame, and high heating efficiency within these heating technologies. Hence, the induction heating method is widely used in industrial applications (such as inductor applications [9,10]) and household applications (such as cooking appliances [11]). The induction heating method aims to improve power efficiency, longevity, and system controllability. In recent years, induction heating technology has been widely used in the metal industry, especially in metal heat treatment to increase metal wear resistance and toughness [12].
To improve the efficiency of induction heating systems, the control strategies for induction heating systems are indispensable. Some control strategies have been applied to the induction heating systems: Yun and others introduced a new control strategy based on two different frequencies to improve induction heating efficiency [13]. Codecasa et al., discussed a high-speed heating control strategy. The control strategy is on the basis of nonlinear model order-reduction techniques, which can reduce the heating duration [14]. Aki et al. proposed a wireless constant temperature control strategy applied to the induction heating system. The proposed strategy can keep the induction heating system operating at a stable constant temperature depending on the superimposed voltage ratio and the heating distance relationship [15]. Villa et al., calculate the relationship between the equivalent load of the induction heating and the voltage phase with a deep-learning technique, to improve the system’s stability and accuracy [8].
The induction heating method has become more popular than other heating methods to protect the environment and improve heating efficiency. However, the heating effect (power change) is affected due to the heating load variation [16]. In order to design high-frequency resonant induction heaters, MOSFETs are usually used as power switches. If the system’s power is high, using IGBTs are required as power switches to withstand significant current stress [17]. The two most commonly used circuit structures in the induction heating system are the full-bridge resonant converter [18,19,20] and the half-bridge resonant converter [21,22]. Under the same conditions (the same input voltage and output power), the current stress on the power switches and maximum output voltage of the half-bridge resonant converter are twice those of the full-bridge. The switching loss generated by the power switches is also more significant than that of the full-bridge power switch. Thus, the full-bridge topology is more suitable for high-power occasions [18].
In conclusion, this study adopts a full-bridge series resonant converter as the main circuit structure of the induction heating system, where the power switches are IGBTs. Additionally, the equivalent model of the induction heating load is raised, and the load characteristics are analyzed. To effectively improve the heating efficiency and shorten the heating time, the feedback control method with optimal heating efficiency is proposed, which can change the system parameters according to the variation in load characteristics and maintain the safe operation of the system. This study proposes a maximum power-point tracking (MPPT) induction heating control strategy. The proposed strategy is compared with other control strategies, as shown in Table 2. Based on the comparison, the proposed control strategy has a lower complexity than the high-speed heating control, the wireless constant temperature control, or the deep-learning control. The proposed control strategy performs better than the two frequencies control. Additionally, the heating duration of the proposed control strategy is the least among these five control strategies.
The remaining work is structured as follows: First, the induction heating systems are described in Section 2. Section 3 includes the proposed MPPT control strategy. Experimental results are in Section 4. Finally, the concluding remarks showing the contribution of this study are offered in Section 5.

2. System Description of Induction Heating System

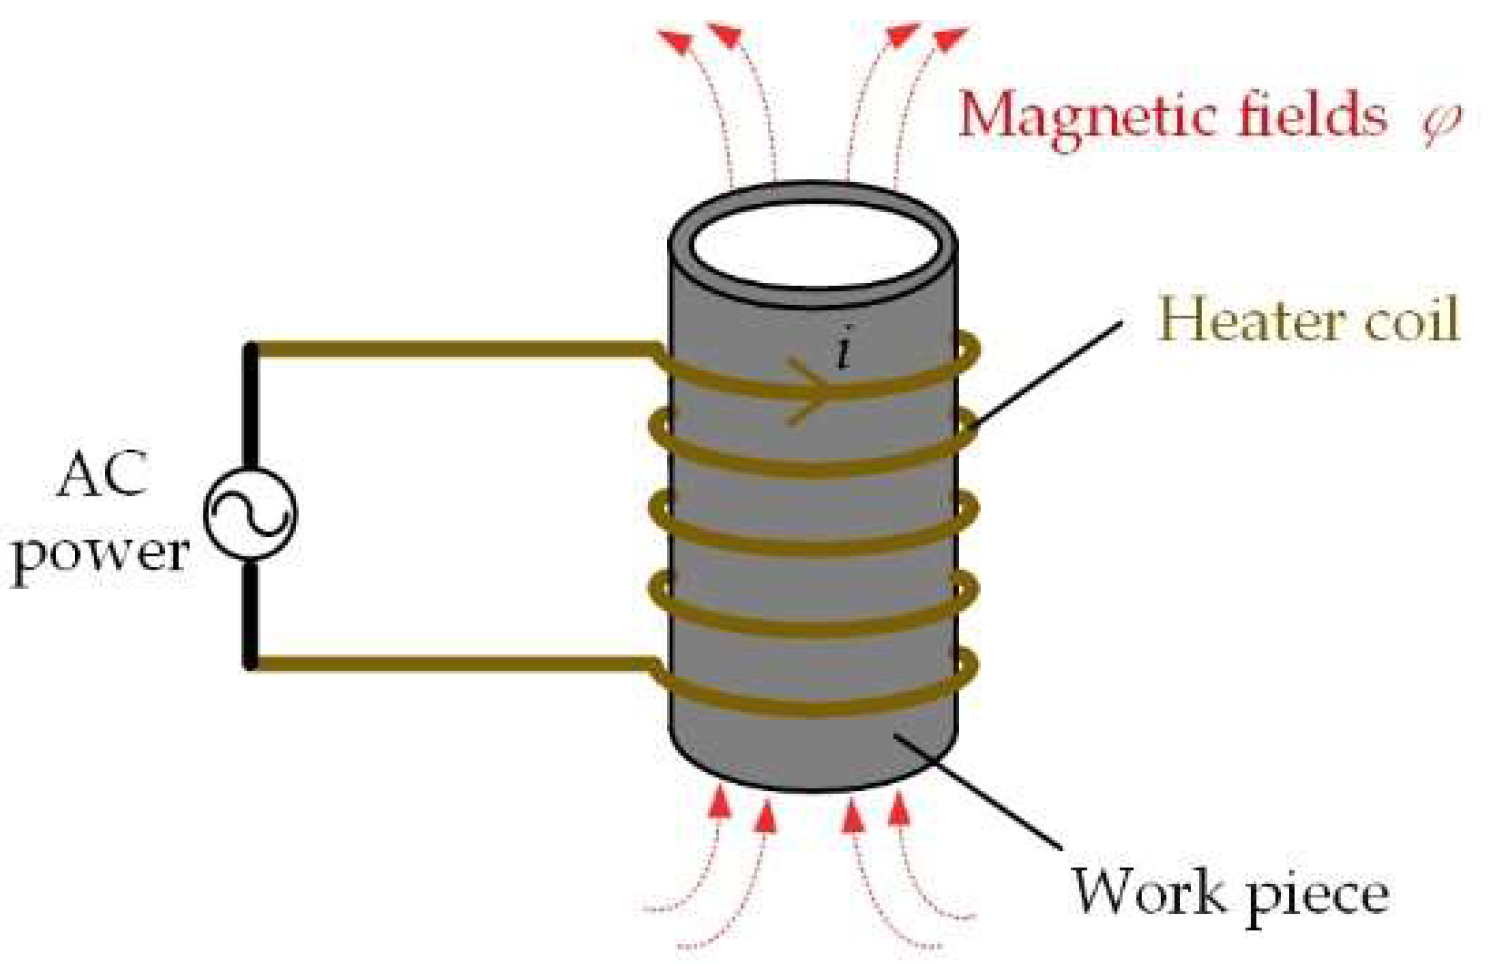
2.1. Principle of Induction Heating

Figure 1 shows a diagram illustrating the principle of induction heating. Induction heating is a technology that uses electromagnetic induction to heat metals. According to Faraday’s law of electromagnetic induction, as shown in Figure 1, when current i passes through the heating coil, a magnetic field φ will be generated around it, and the eddy current produces the effect of Joule heating, which increases the temperature of the workpiece [23]. According to Joule’s law, the heat generated by the eddy current is determined as follows:
Q = I 2 R t
Through Formula (1), if the heating effect needs to be enhanced, the current passing through the heater coil should be increased.
Figure 2 shows a schematic diagram of a barrel helical heating coil. The heating coils in the induction heating equipment are all designed in the shape of the processed object. In general, if there is no special requirement, a pure copper tube with a small resistivity is usually processed into an inductor of the hollow core, which is wound in a round barrel helical coil (Figure 2). Its inductance depends on the characteristic of the coil (turns, shape, size, etc.). The value can be estimated by Formula (2), where L is the inductance of the heating coil (H), N is the turns of the coil, D is the average diameter of the coil (cm), H is the coil length (cm), and a is the coil wall thickness (cm).
L = D 2 N 2 50 D + 2 H + 1.3 a H D
Figure 3 shows a schematic diagram of the Curie temperature. The Curie temperature can be represented by the symbol Tc, whose definition is shown in Figure 3. The Curie temperature is the intersection of the two-point line (80% μmax and 20% μmax points) extending to the temperature axis [24]. If the temperature of the workpiece reaches Tc, the ferromagnetism of the workpiece changes into paramagnetism, which means the magnetism disappears.
There are two ways to generate heat energy during the process of electromagnetic induction heating of the ferromagnetic workpiece. One of them is generated by an eddy current, and the other (hysteresis thermal energy) is caused by hysteresis losses. Hysteresis losses are produced by repeated magnetization and demagnetization of the processed object during electromagnetic induction [25].
The load of the induction heating system includes the heating coil and the processing workpiece, as shown in Figure 4a, which can be equivalent to an inductive load, as shown in Figure 4b, which consists of a resistance Req and the inductance Leq [26,27].
The physical variation of the processing workpieces affects their equivalent resistance and inductance during the heating process. It causes the circuit parameters to change in the induction heating system.
The equivalent inductance of the workpiece increases with the increase in temperature while heating [28]. When the temperature of the heating workpiece exceeds the Curie temperature Tc, the ferromagnetism of the workpiece disappears and converts into paramagnetism. The phenomenon causes the variation trend of the equivalent resistance and inductance value with temperature variation, as shown in Figure 5. Figure 5a is a schematic diagram of the variation trend of equivalent resistance with temperature. Figure 5b is a schematic diagram of the variation trend of equivalent inductance with temperature. In conclusion, it is necessary to note the influence of temperature on the parameters of the induction load while designing the induction heating system.

2.2. Design Consideration of the Components

Figure 6 shows the circuit architecture diagram of the LC series resonant converter proposed in this study, where Figure 6a,b is based on the half-bridge converter and the full-bridge converter, respectively. This study focuses on the full-bridge LC series resonant converter because the full-bridge topology is more suitable for high-power occasions [29]. In addition, the induction load of the heating system, which is the heating coil and the workpiece, can be equivalent to an inductance Leq and a resistance Req. The commonly known equivalent model for the transformer includes a magnetizing inductance Lm and a leakage inductance Lk. Since the Lm of the step-down transformer is much larger than the leakage inductance Lk and the equivalent inductance Leq of the heating coil, Lm does not participate in the resonance. To simplify the proposed structure, this study ignores the effects of Lm and combines the external inductance Lr1 and the leakage inductance Lk into Lr, which considers their effects simultaneously.
Table 3 presents the specification of the full-bridge LC series resonant converter, where the rated power is 1.3 kW, the input voltage Vs is 250 VDC, the system operating frequency range fs is from 44 to 50 kHz, and the maximum heating temperature is 750 °C.
This study analyzes the proposed full-bridge LC series resonant converter under the steady-state condition. The fundamental waveforms and the operation modes can be obtained in Figure 7 and Figure 8, respectively. The operation modes are divided into six intervals, which describe the timing relationship between the IGBTs’ control signal vGE1(vGE4), vGE2(vGE3); the voltage across the IGBTs vCE1(vCE4), vCE2(vCE3); the current of the resonant inductor iL; the voltage across the heating coil vo; and the turn-on current of the IGBTs iCE1. Since the first three operation modes (t0–t3) and the last three operation modes (t3–t6) are symmetrical, the following only displays the operation and the equivalent models of the first three operation modes (t0–t3).
Figure 8 shows the first three operation modes of the full-bridge LC series resonant converter. In Interval I (t0−t1), as shown in Figure 8a, the IGBTs Q1, Q2, Q3, and Q4 are off. Meanwhile, the current of the resonant inductor iL maintains the current flow due to the characteristic of the inductor. The parasitic capacitances of the IGBTs C1 and C4 discharge the energy to the parasitic capacitances of the IGBTs C2 and C3 through iL. When C2 and C3 are wholly charged, this interval ends. In Interval II (t1−t2), as shown in Figure 8b, the IGBTs Q1, Q2, Q3, and Q4 are off, and D1, D2 are on. Meanwhile, the processes of C1, C2, C3, and C4 are over; vCE1 and vCE4 are clamped at zero potential and remain until the next interval. This interval ends when Q1 and Q4 turn on. For Interval III (t2−t3), as shown in Figure 8c, Q1, Q4 turn on, Q2, Q3 stay off, and D1, D2 turn off at time t = t2. Since vCE1 and vCE4 are clamped at zero potential in Interval II, Q1, Q4 achieve the ZVS operation. Meanwhile, charge Lr and Cr through iLr pass through Q1, Q4. The flow of iLr reverses during this interval. This interval ends when Q1 and Q2 turn off.

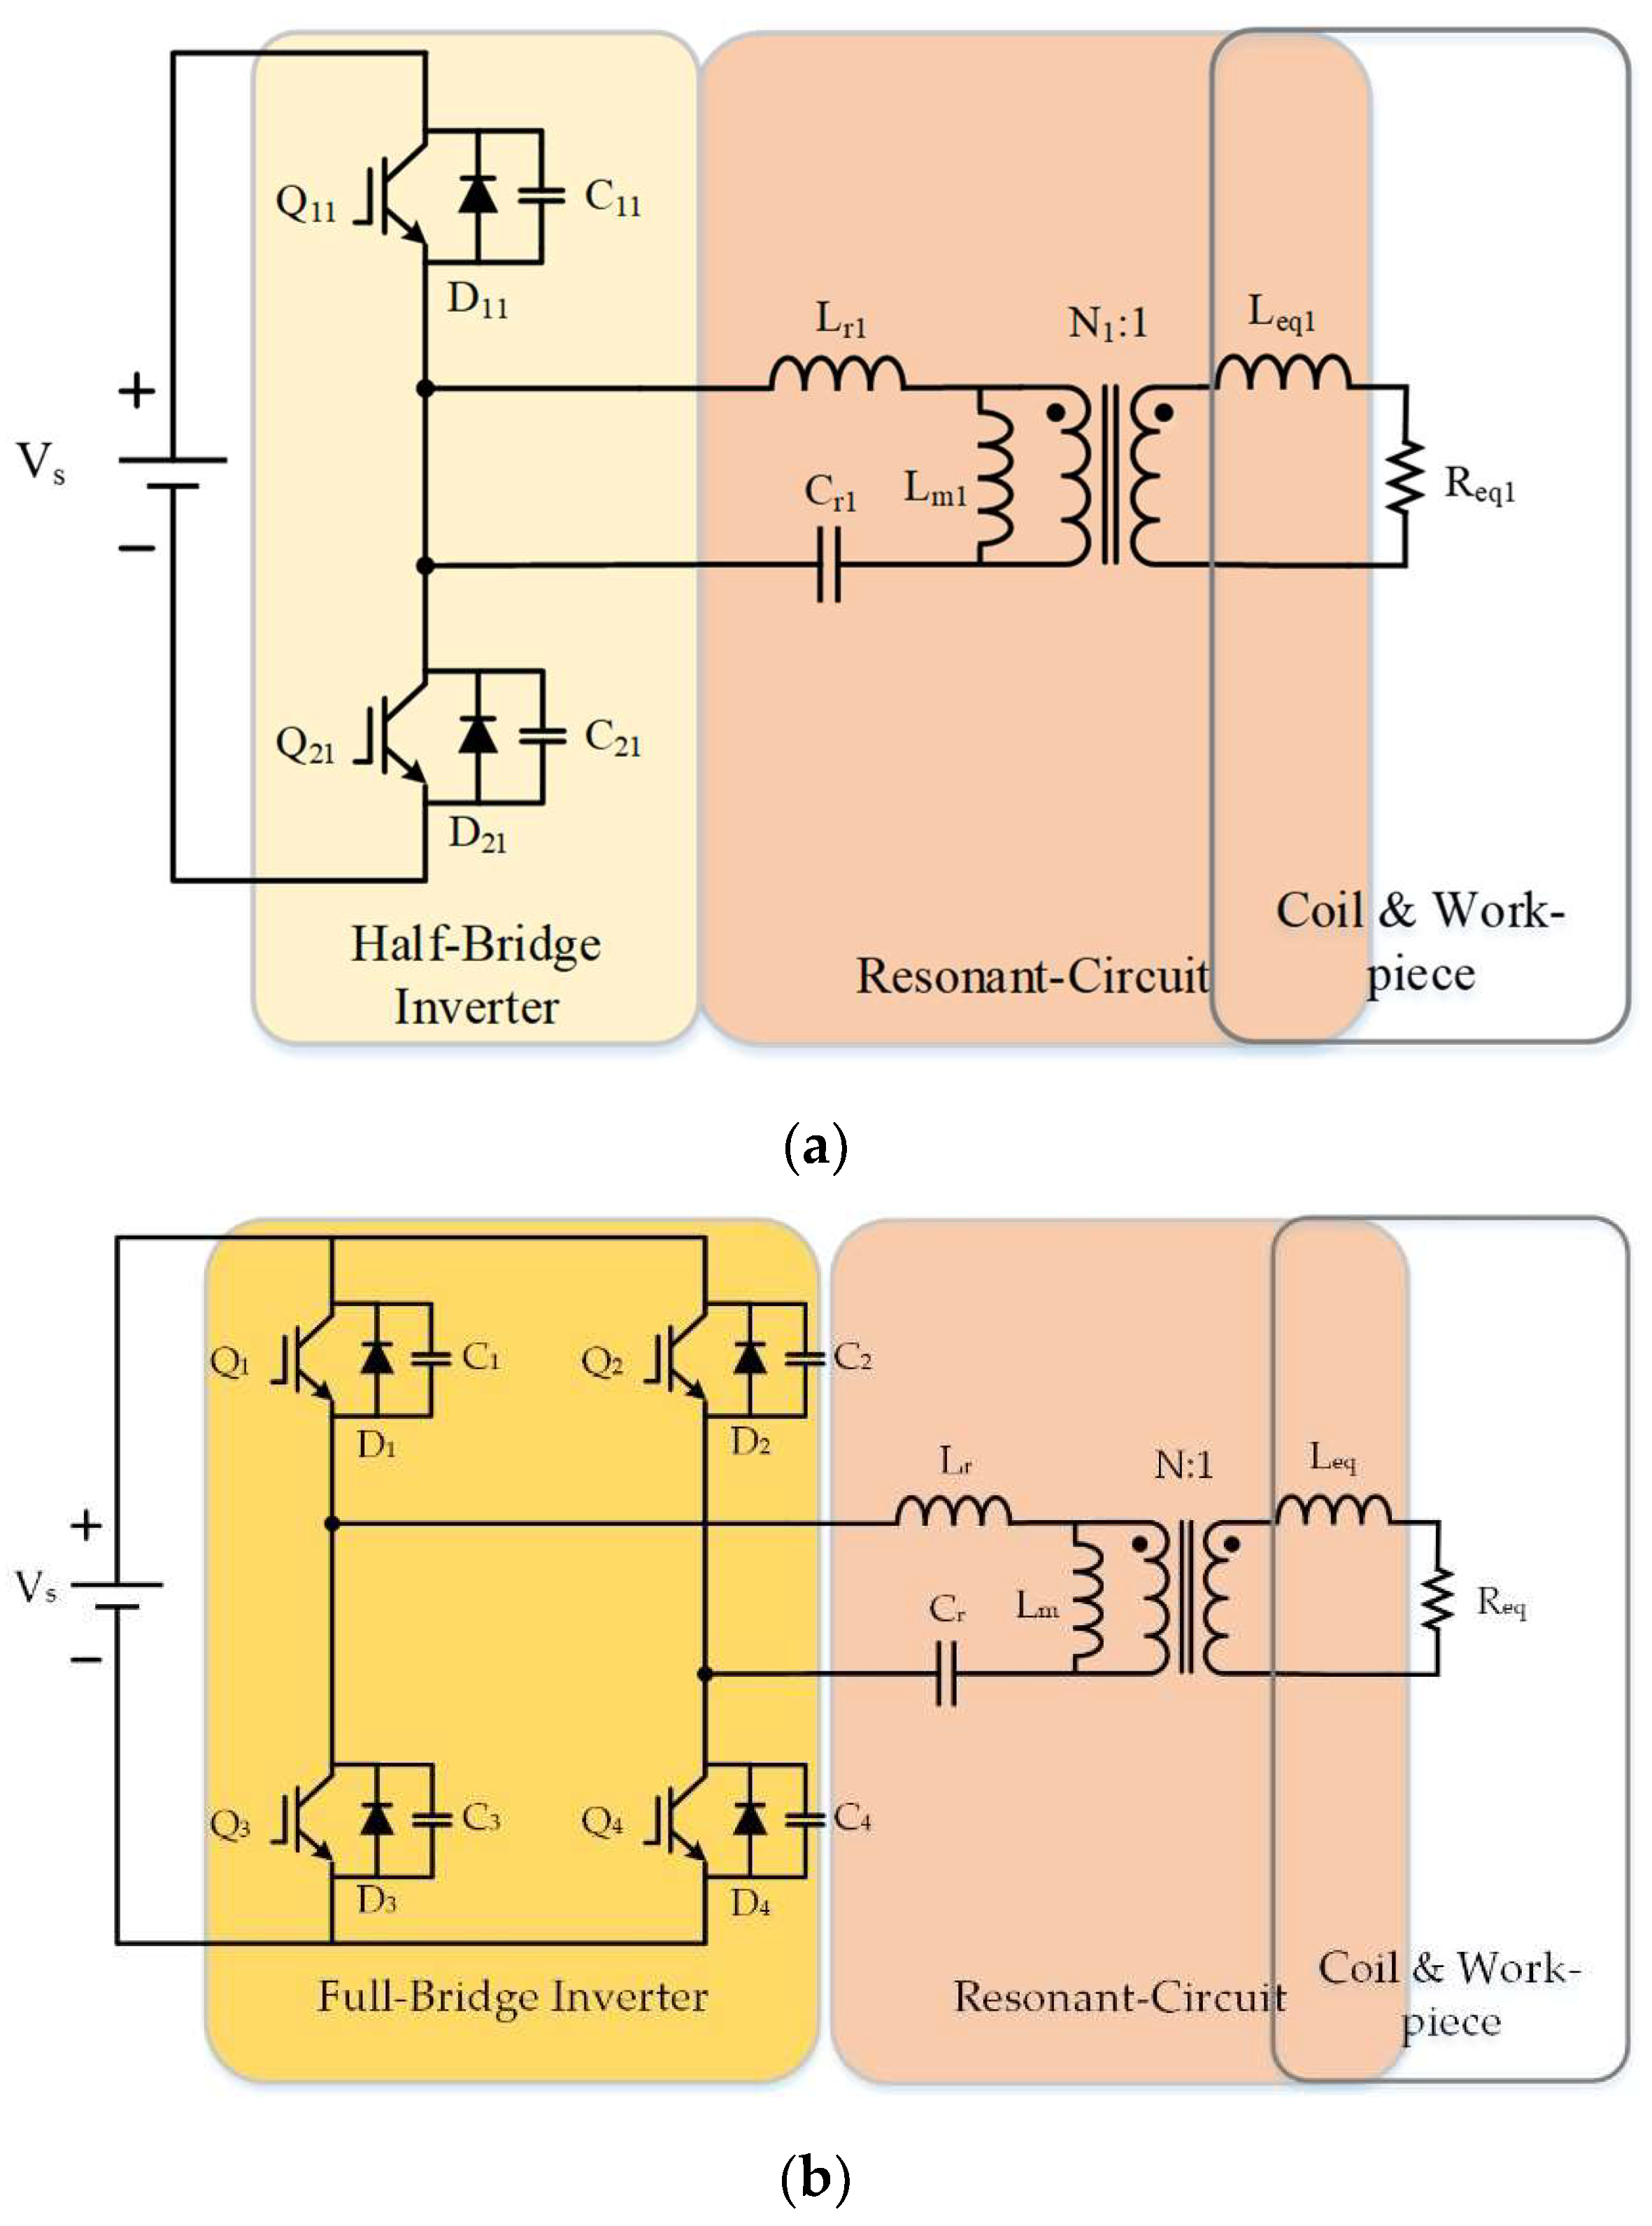
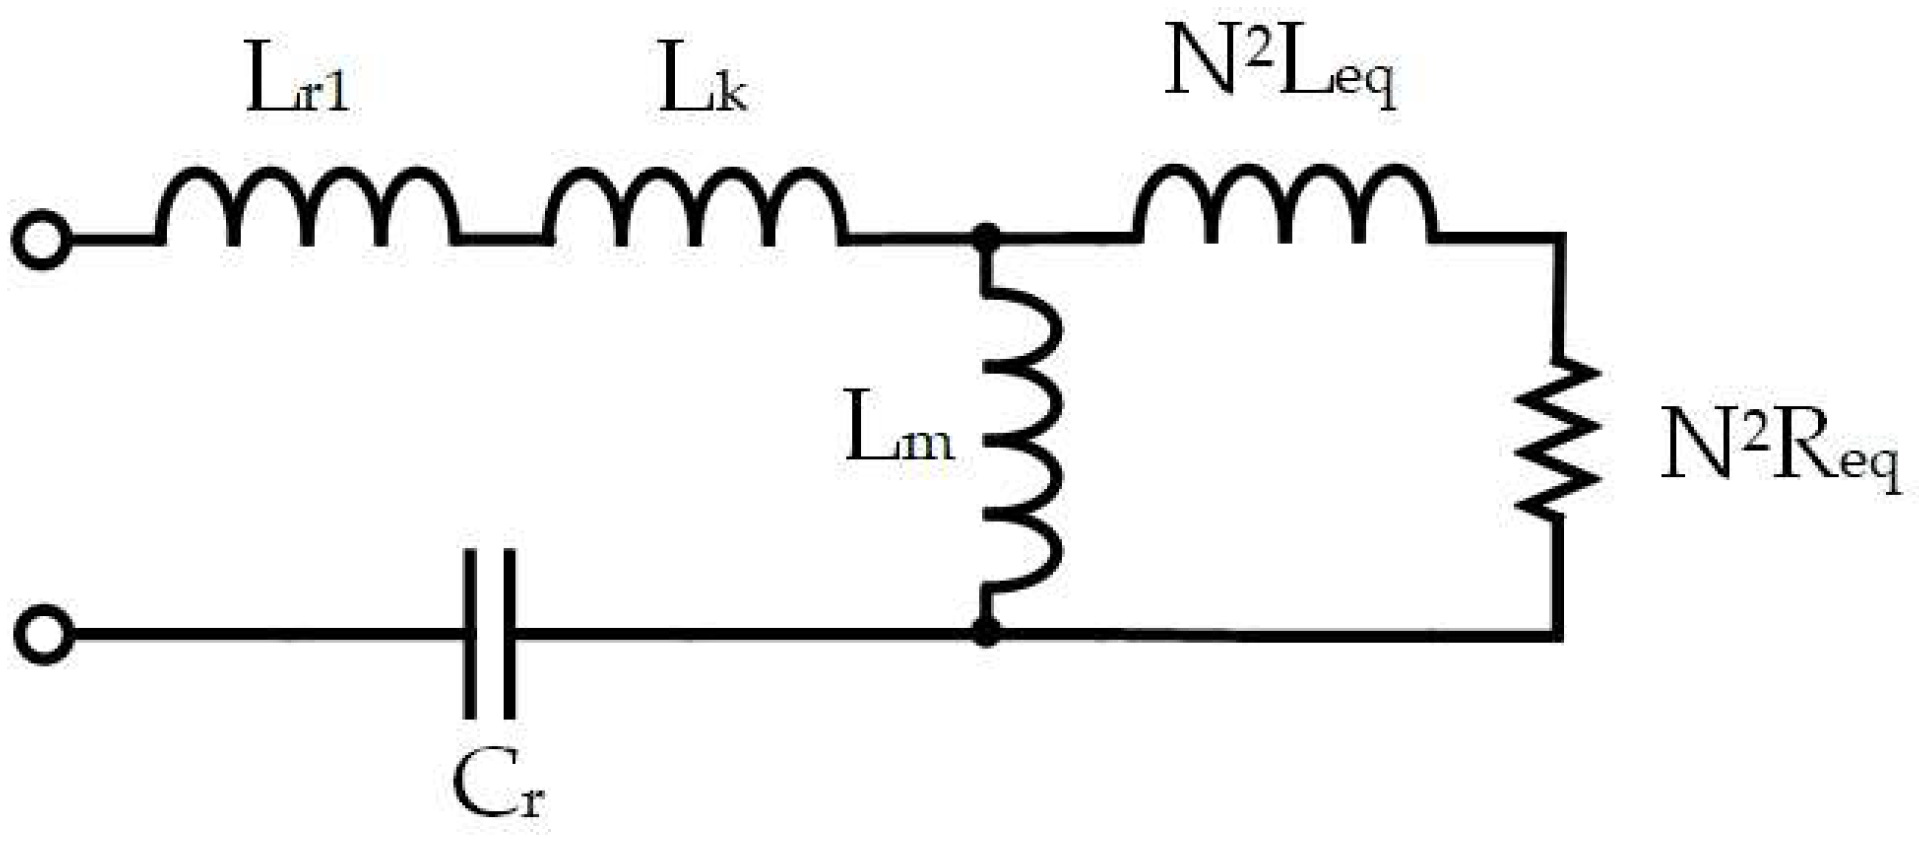
2.3. Transfer Function Analysis of Full-Bridge LC Series Resonant Converter

The parameters of the heating coil and the workpiece to be heated should be taken into consideration in the transfer function analysis. As shown in Figure 9, the equivalent model considers the transformer, the heating coil, and the processing workpiece, including the transformer magnetizing inductance Lm, the leakage inductance Lk, and the Leq and Req of the heating coil and the processed object. After the parameters on the secondary side are equivalent to the primary side, the equivalent model is modified, as shown in Figure 10.
The value of Lm in the proposed architecture is about 1.3 mH, which is much larger than the heating coil equivalent inductance Leq (1.25 μH), by about 1000 times. Therefore, Lm does not participate in the resonance. Thus, the equivalent model can be further modified into an RLC series resonant circuit, as shown in Figure 11, by simplifying Lr1, Lk, N2Leq into Lr, and N2Req into Ro. The formulas of Lr and Ro are shown as follows:
L r = L r 1 + L k + N 2 L eq
R o = N 2 R eq
This study investigates the characteristics of the aforementioned RLC series resonant circuit. The first harmonic approximation (FHA) is used to draw the input equivalent circuit of the RLC series resonant circuit, as shown in Figure 12, where the proposed equivalent circuit transfers to the model under the frequency domain.
The mathematical model of the RLC resonant converter is analyzed as follows:
First, ω, ωr, and Q are regarded as operating frequency, resonant frequency, and quality factor, respectively, as shown in Formulas (5) and (6).
ω r = 1 L r C r
Q = ω r L r R o = 1 ω r C r R o
According to Figure 12, Formula (7) can be obtained by using the Kirchhoff voltage law (KVL).
V i = V L r + V C r + V o = I R o + s L r + 1 s C r
Substituting s = into Formula (7) gives Formula (8).
V i = V L r + V C r + V o = I R o + j ω L r + 1 j ω C r
According to the voltage divider rule, the formula of the voltage across Ro can be obtained as follows:
V o = V i R o R o + j ω L r + 1 j ω C r
The transfer function of Vo to Vi can be obtained by rearranging Formula (9), as shown in Formula (10).
V o V i = R o R o + j ω L r + 1 j ω C r
Substituting Formulas (5) and (6) into Formula (10), Formula (11) can be derived.
V o V i = 1 1 + j Q ( ω ω r ω r ω )
The norm of V o V i (voltage gain) is displayed in Formula (12).
V o V i = 1 1 + Q 2 ( ω ω r ω r ω ) 2
When the operating frequency is equal to the resonant frequency ( ω = ω r ), the voltage gain will be 1, as shown in Formula (13).
V o V i = 1 1 + Q 2 ( ω ω r ω r ω ) 2 = 1
Meanwhile, current I = V i R o . The voltage across inductor VLr and capacitor VCr are given in Formulas (14) and (15).
V L r = I j ω r L r = j V i R o L r C r = j Q V i
V C r = I 1 j ω r C r = j V i R o L r C r = j Q V i
When the operating frequency is equal to the resonant frequency, the impedance effects of the inductor Lr and the capacitor Cr cancel each other out. Thereby, all of the input energy transfers to resistor Ro, which means the system reaches the maximum voltage gain and input current. In the LCR series resonant circuit, it can be seen that the partial voltage of components can be changed by adjusting the operating frequency to achieve the control of the voltage Vo [30].
The transfer function of voltage gain can be plotted as voltage gain curves, as shown in Figure 13. It can be observed that the voltage gain is at its maximum (=1) when f s = f r . Meanwhile, the current is at its maximum, and its phase with voltage is 0. Under this circumstance, the power utilization is the highest. When the operating frequency fs is greater than the resonant frequency fr, the system operates in the ZVS region; when the operating frequency fs is less than the resonant frequency fr, the converter will operate in the ZCS region.

3. Proposed Maximum Power-Point Tracking Heating Technology

3.1. Heating Control Technology

During induction heating, as the temperature changes, the load characteristics of the processed workpiece also changes, which affects the circuit parameters of the induction heating system, such as the resonance frequency fr. Suppose the operating frequency fs is not adjusted accordingly. In that case, the system is unable to reach the maximum power output, the heating efficiency decreases, and even the power switch loses its ZVS operation, resulting in the problem of significant voltage, current stress, and switching loss. To solve these problems, this study proposes a feedback control base on optimized heating efficiency. The following proves how the system maintains a higher efficiency output through theoretical and mathematical derivation of the resonant circuit.
The voltage across Ro, as shown in Figure 12, is expressed in Formula (16).
V o = V i R o R o + j ω L + 1 j ω C V o = V i R o R o 2 + ( X L X C ) 2
The loop current is calculated as shown in Formula (17).
I = V i R o + j ω L + 1 j ω C I = V i R o 2 + ( X L X C ) 2
Then, the phase of the input voltage and current is given in Formula (18).
θ = tan 1 X L X C R o
Finally, the power on the resistor Ro is expressed in Formula (19):
P o = V o × I × cos θ
In an ideal case, when the resonant circuit operates at the resonance point ( f s = f r , X L = X c ), the voltage across the resistor Ro at the resonance point can be obtained in Formula (20) through Formulas (16)–(18).
V o = V i R o R o 2 + 0 2 = V i
The loop current is calculated as shown in Formula (21).
I = V i R o 2 + 0 2 = V i R o
Then, the phase of the input voltage and current are calculated as shown in Formula (22).
θ = tan 1 0 R o = 0
Substituting Formulas (20)–(22) into Formula (19), the power on the resistor Ro can be obtained as shown in Equation (23).
P o = V o × I × cos ( 0 ) = V i × I × 1
From above, the induction heating system can change the phase between the voltage and current by adjusting the operating frequency, which changes the output power. When f s = f r , the power factor is 1 because the voltage and current have the same phase, and then the induction heating system achieves the maximum power point (MPP).
To determine the influence of the load characteristic variation on the system parameters during the heating process, this study draws the curve of the output power po corresponding to the operating frequency fs, considering the load characteristic variation. The resonant frequency fr is expressed in Formula (24). As shown in Figure 14, when the induction heating system is heating the load with the fixed input voltage, the equivalent inductance Leq and equivalent resistance Req increase with higher temperature. When the temperature rises, the equivalent inductance Leq increases, which causes the resonant frequency to decrease, and the resonant point gradually shifts to the left (low-frequency direction). Meanwhile, the equivalent resistance Req increases the same as the equivalent Leq. This decreases the loop current, resulting in a drop in the output power. Summarizing, the frequency−power curve drawn according to the change of load characteristics gradually shifts to the left (lower resonant frequency) and down (lower output power) as the heating temperature increases.
f r = 1 2 π L eq C eq
From these curves, the output power and the resonant frequency fr of the induction heating system both decrease (A→B→C→D) when the temperature rises during the heating process.

3.2. Proposed MPPT Control Strategy

This study proposes a maximum power-point tracking control strategy to help the proposed induction heating system achieve the optimal operating frequency and duty cycle. The details follow:
Figure 15 shows the relationship between the heating power and the operating frequency of the proposed induction heating system. The corresponding formula is obtained by using Microsoft Excel’s curve fitting function, as expressed in Formula (25). Through Formula (25), the best operating frequency can be obtained in time.
f s = a p o 2 + b p o + c
where a = −0.3044, b = 1054.7, and c = −413788.
Although the system operation has the best operating frequency, this study also improves the system flexibility. The improvement of the system flexibility is realized by an adjustable duty cycle to stabilize the system’s output power and heating performance. Figure 16 is the schematic diagram of the hill-climbing algorithm, where the red dot is the MPP of po, and A1, A2 are the operating points close to the MPP. If the current operating point is A1, which falls on the left half plane (LHP), the hill-climbing algorithm [31] adjusts the duty cycle close to the MPP by comparing the two powers (previous and current). On the contrary, if the current operating point is A2, which falls on the right half plane (RHP), the duty cycle is adjusted (similar to A1) close to the MPP.
Figure 17 shows the flow chart of the proposed MPPT heating strategy. First, the output voltage vo and output current io are measured to calculate the output power po (n−1) and po (n). Second, according to Formula (25), the optimal operating frequency of the induction heating system can be obtained. Finally, the hill-climbing algorithm estimates the optimal duty cycle of the induction heating system by comparing po (n−1) and po (n). Therefore, the proposed MPPT heating strategy can precisely control the heating system to achieve higher efficiency and stability.

4. Experiment Results

In this study, the proposed induction heating system is implemented and shown in Figure 18, where the proposed is mainly composed of a full-bridge LC series resonant converter, a microcontroller unit (MCU) (brand: Microchip, model: TMS320F28035), and an auxiliary power supply circuit. The system’s output power can be adjusted by adjusting the operating frequency of the power switches. The operating frequency ranges from 44 to 50 kHz, and the maximum input power of this system is 1.3 kW.
Table 4 shows the specification of the proposed induction heating system, where the input voltage is 250 VDC; the resonant inductor Lr = 150 μH; the resonant capacitor Ceq = 33 nF; the equivalent inductance of heating coil Leq is 1.25 μH; the equivalent resistance of heating coil Req is 0.5 Ω, the turn ratio of the transformer N1:N2 = 10:1; the heating coil has a 2.5 cm inner diameter and 13 turns; and the workpiece is a 2 cm diameter and 15 cm long cylindrical low-carbon iron.

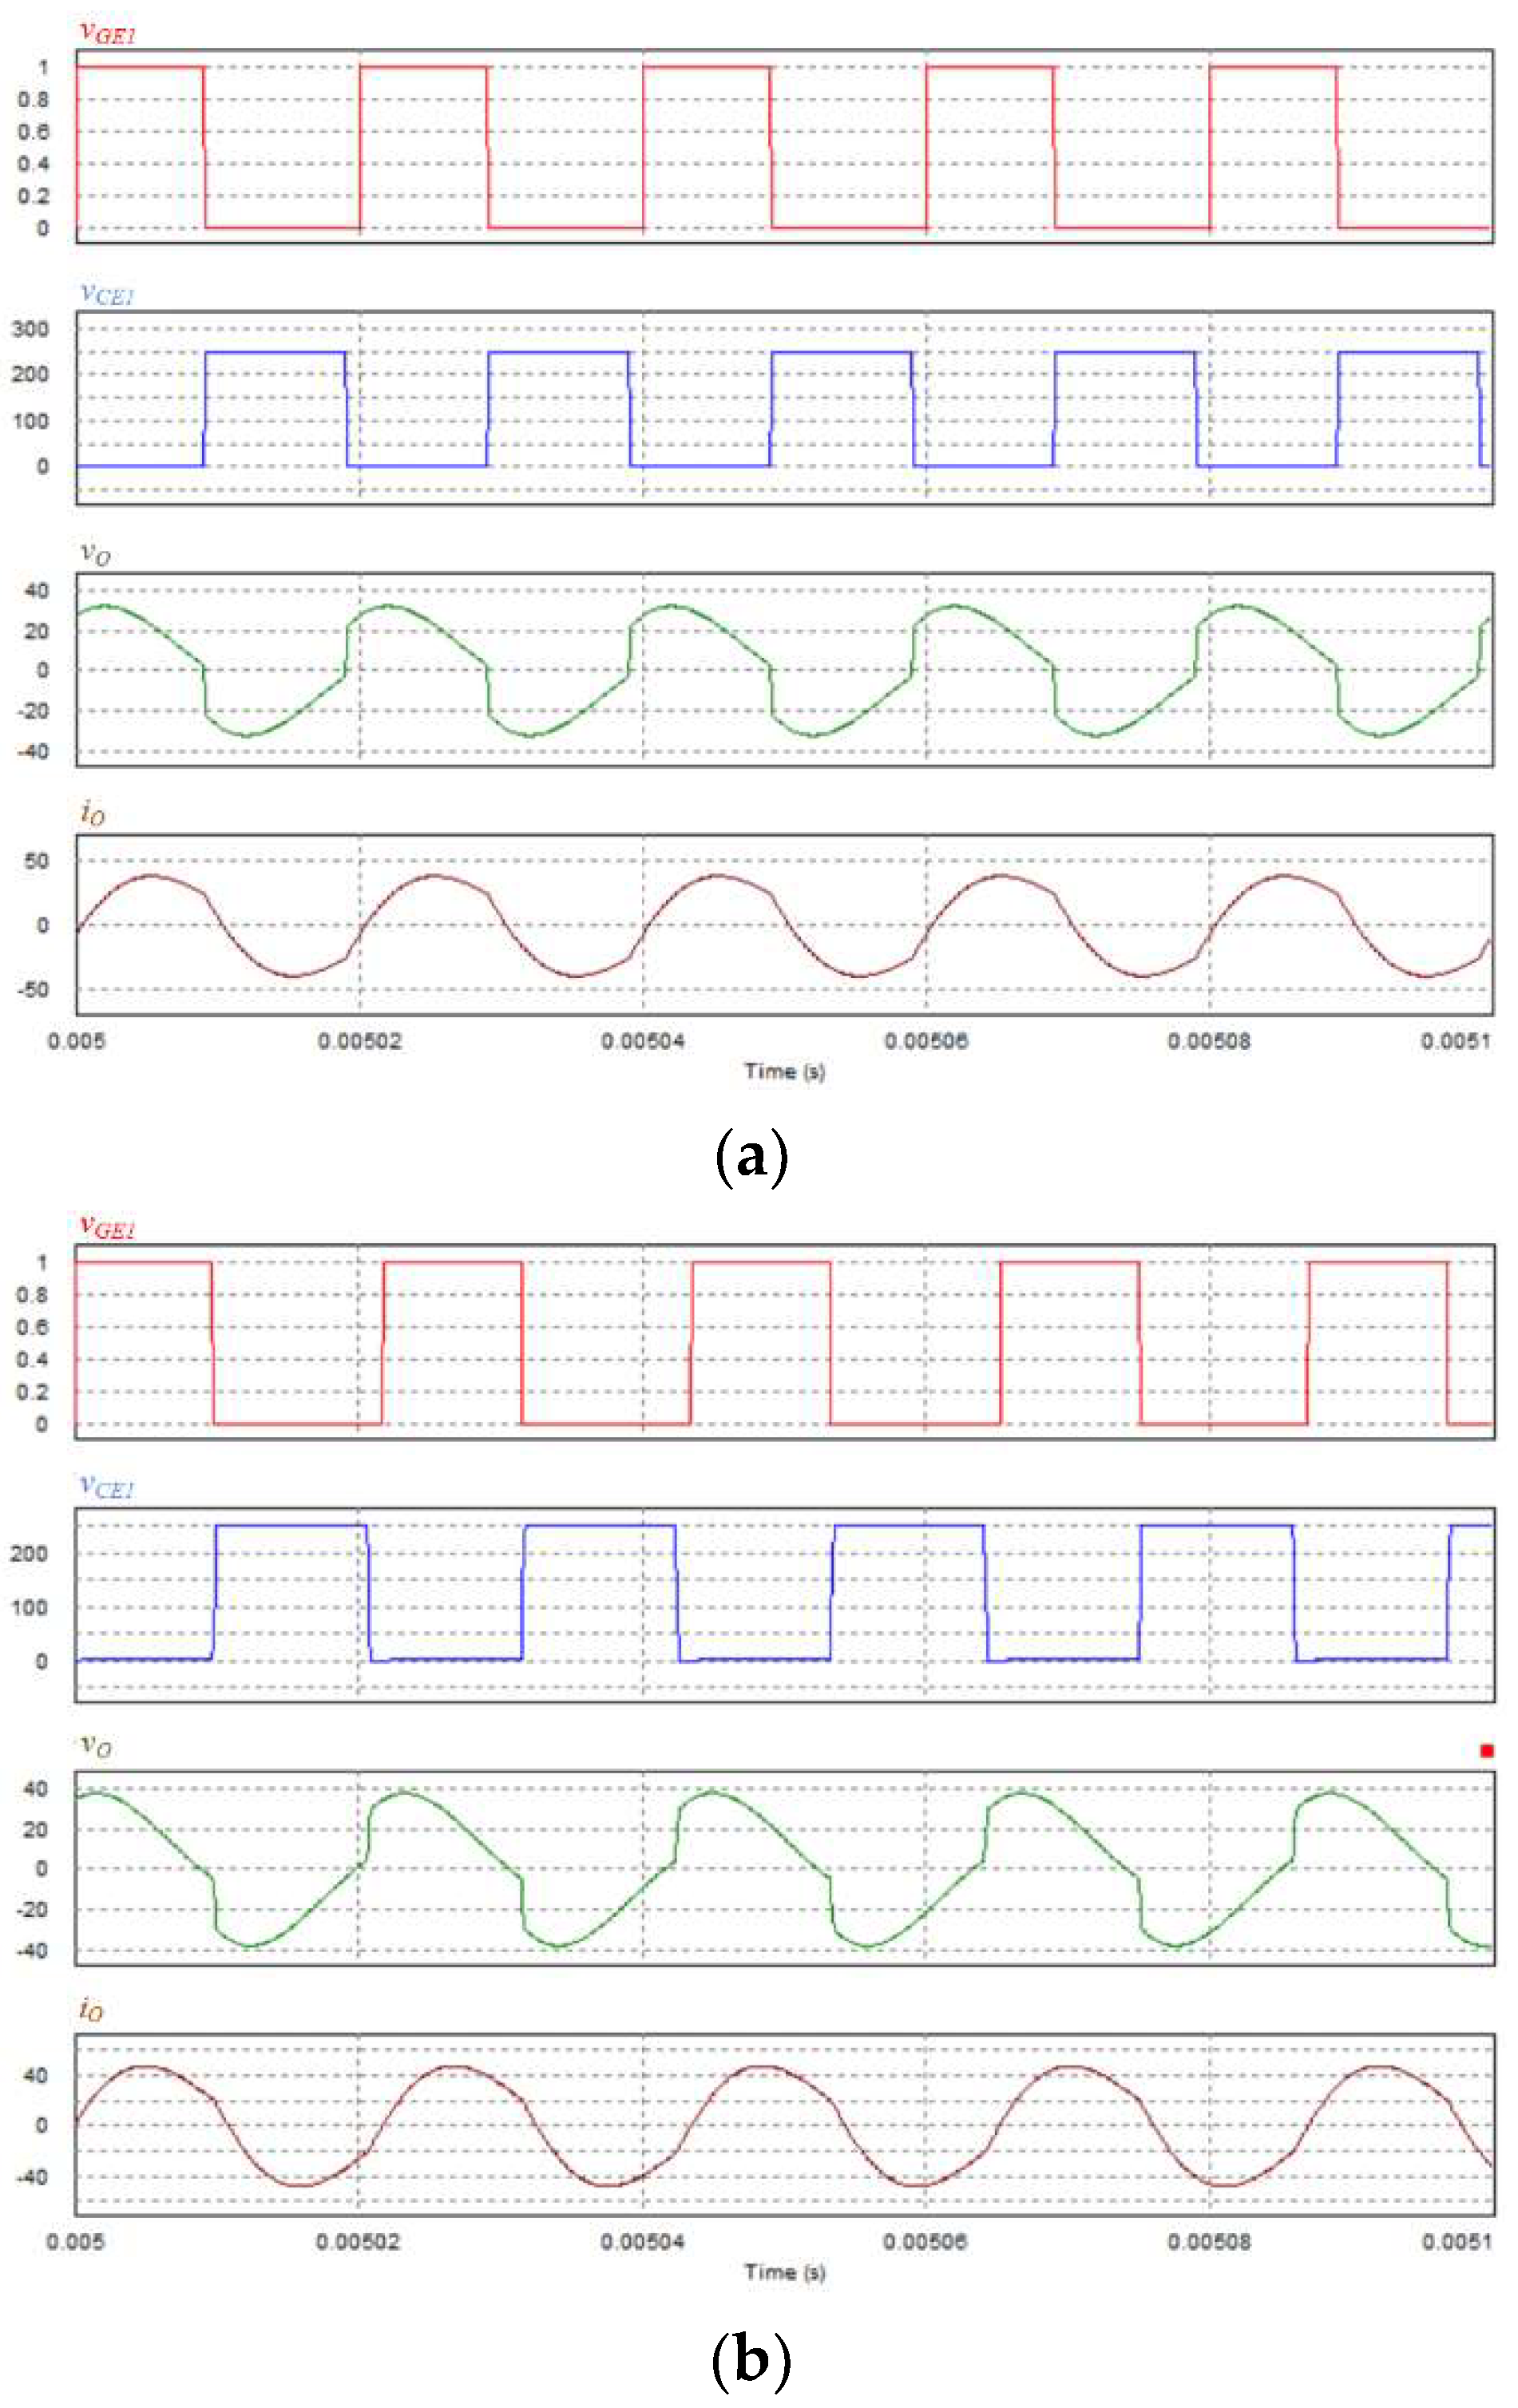
4.1. Simulation Experiment Results

In this study, the simulation results are tested under the conditions that the workpiece’s temperature is 500 and 750 °C. Figure 19 and Figure 20 show the simulation result of the proposed induction heating system, which operates with the traditional control strategy (fixed operating frequency) and the proposed MPPT heating control strategy, respectively.
Figure 19a shows the control signal of the traditional control strategy, where the workpiece’s temperature is 500 °C, the operating frequency is 45 kHz, vGE1 (duty cycle) is 0.45, the peak value of the power switch voltage vCE1 is 250 V, the peak value of the output voltage vo is 30 VAC, and the peak value of the output current io is 40 AAC. The proposed MPPT heating control strategy (Formula (25) and hill-climbing algorithm) is shown in Figure 19b, where the operating frequency is 46 kHz, vGE1 (duty cycle) is 0.43, and the peak value of the power switch cross-voltage vCE1 is 250 V, the peak output voltage vo is 39.5 VAC, and the peak output current io is 43 AAC.
Figure 20a shows the control signal of the traditional control strategy, where the workpiece’s temperature is 750 °C, the operating frequency is 45 kHz, vGE1 (duty cycle) is 0.45, the peak value of the power switch voltage vCE1 is 250 V, the peak value of the output voltage vo is 32 VAC, and the peak value of the output current io is 35 AAC. The proposed MPPT heating control strategy (Formula (25) and hill-climbing algorithm) is shown in Figure 20b, where the operating frequency is 44 kHz, vGE1 (duty cycle) is 0.44, and the peak value of the power switch cross-voltage vCE1 is 250 V, the peak output voltage vo is 40 VAC, and the peak output current io is 42 AAC.
From the simulation results in Figure 19 and Figure 20, it can be observed that no matter which heating method is used, when the workpiece temperature increases, the output voltage and the output current decrease. Using the proposed MPPT heating control strategy can improve power loss more than the traditional control strategy, proving the high heating performance of the proposed MPPT heating control strategy.

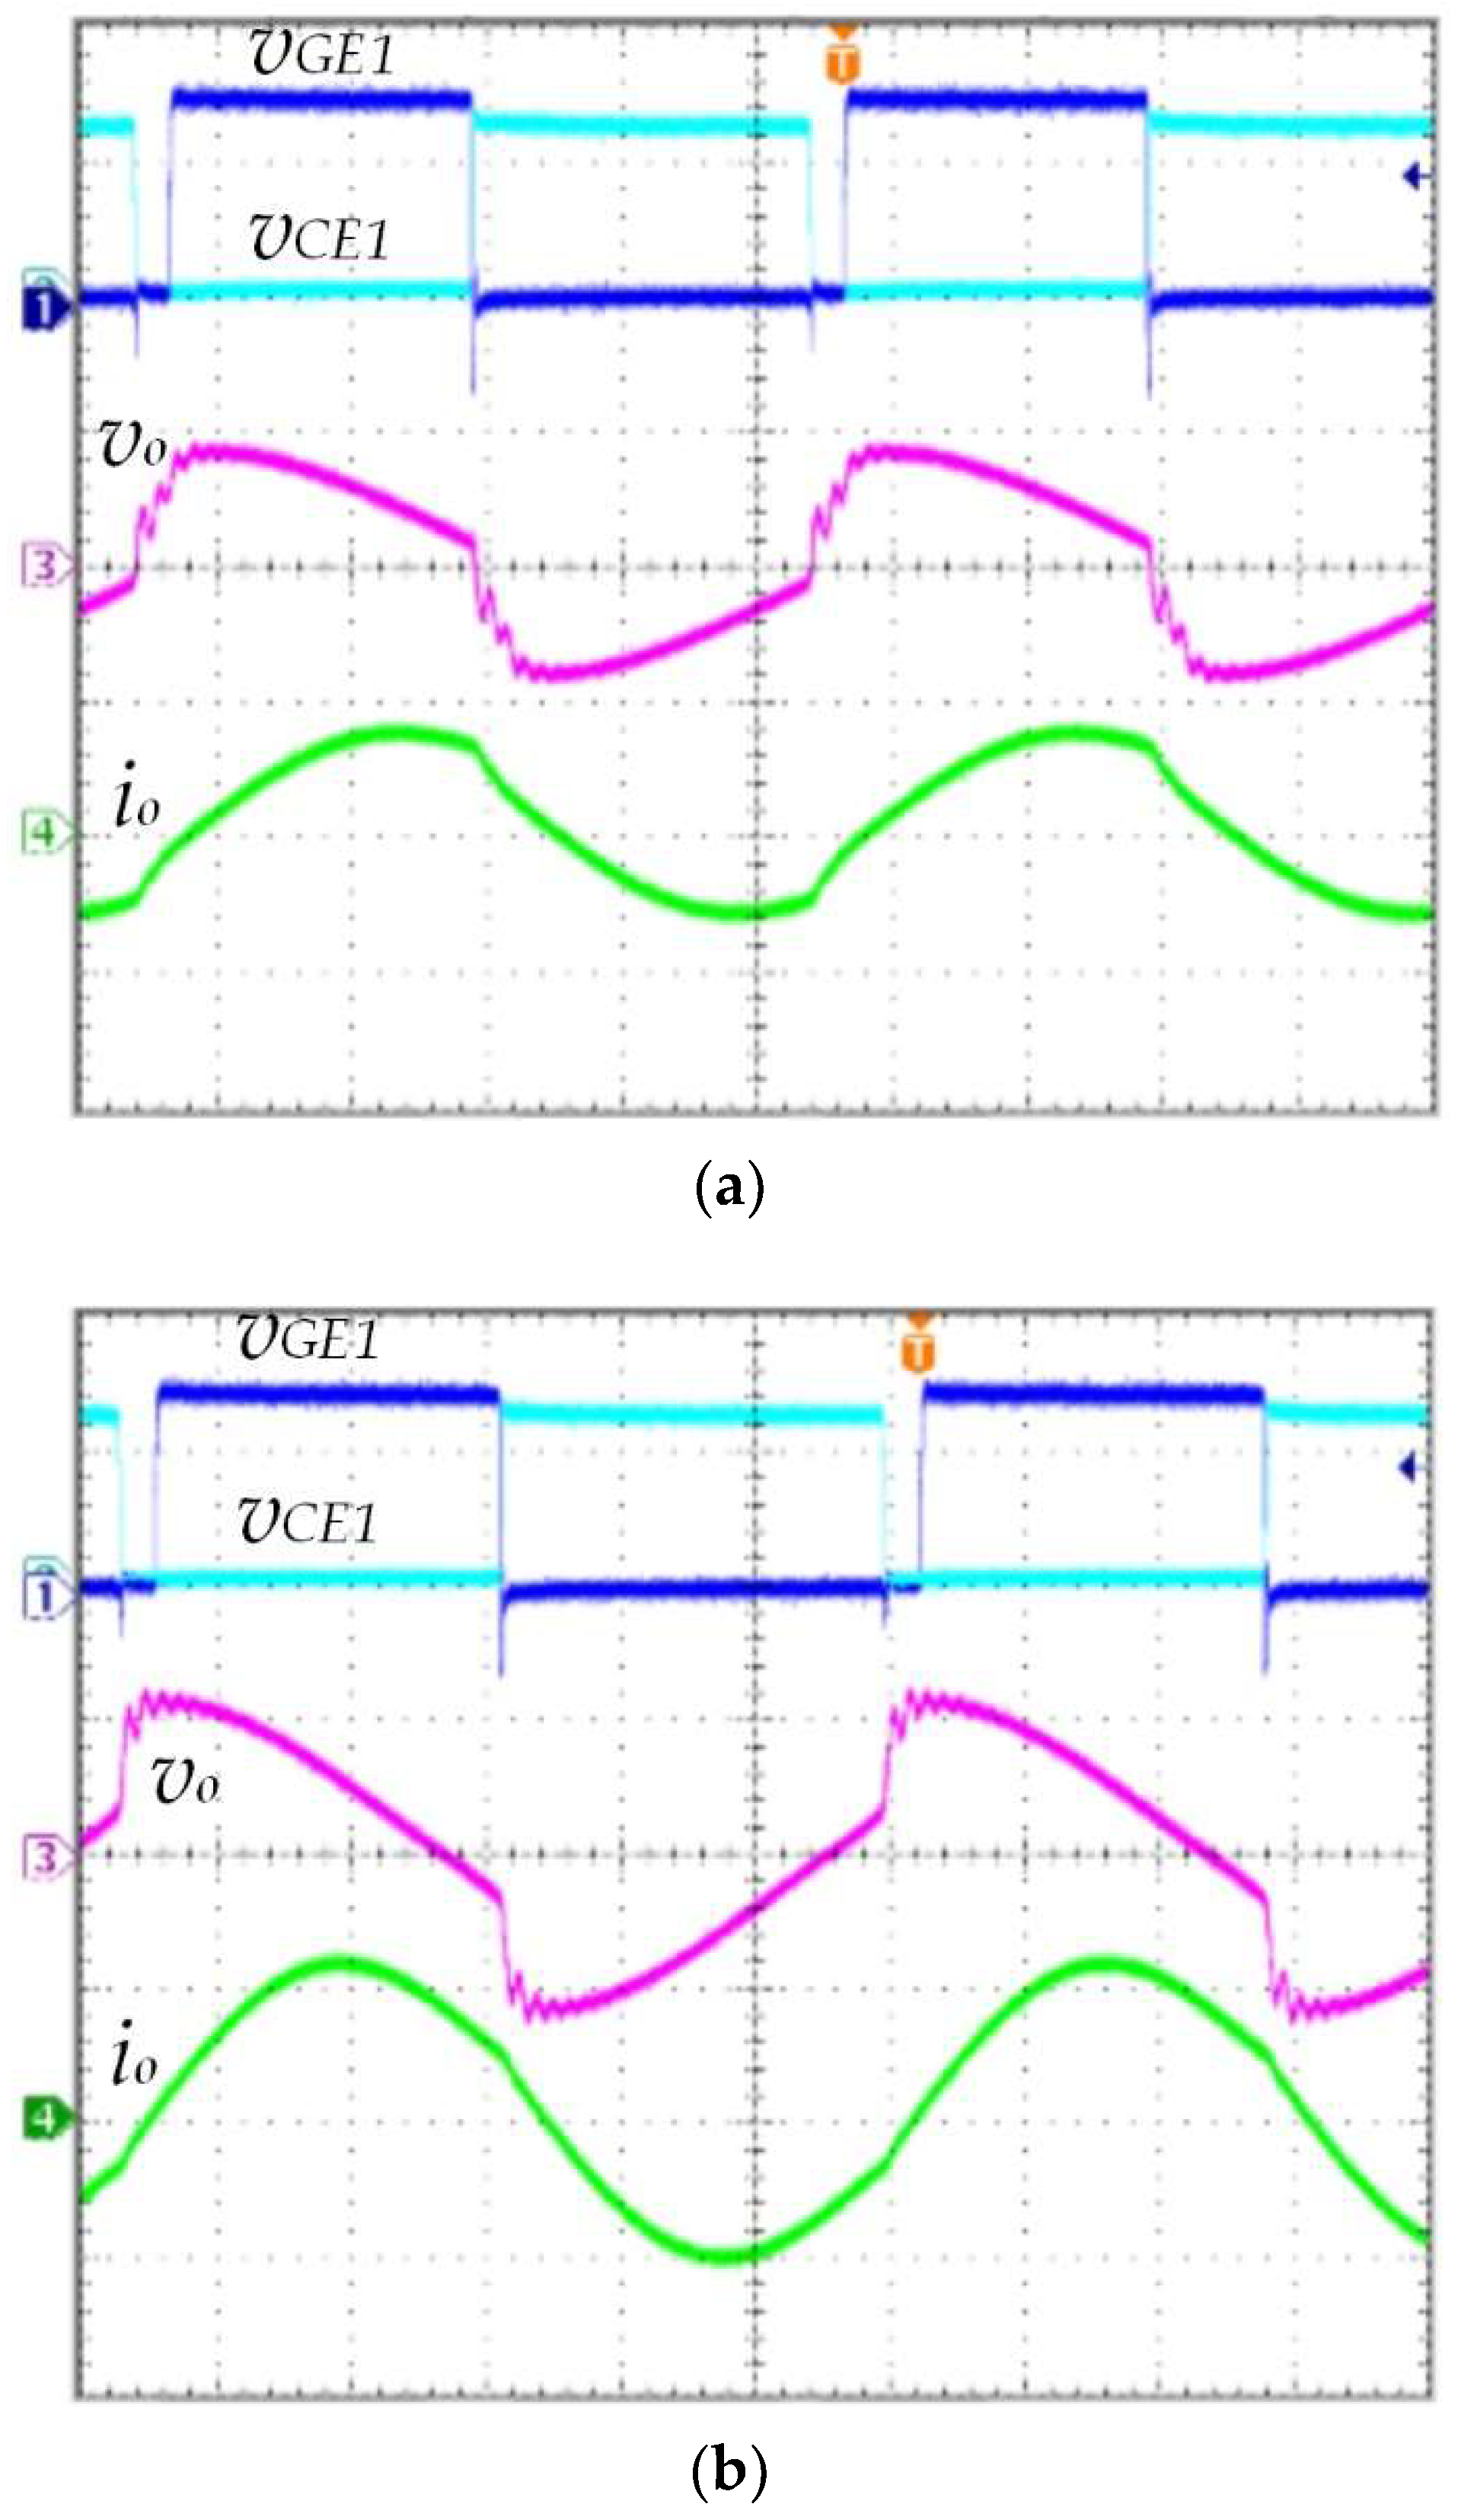
4.2. Hardware Experiment Results

In this study, the hardware experiment is tested with the workpiece’s temperature at 500 and 750 °C. Figure 21 and Figure 22 show results of the experiments for the proposed induction heating system, which operates with the traditional control strategy (fixed operating frequency) and the proposed MPPT heating control strategy, respectively.
Figure 21a shows the control signal of the traditional control strategy, where the workpiece’s temperature is 500 °C, the operating frequency is 45 kHz, vGE1 (duty cycle) is 0.45, the peak value of the power switch voltage vCE1 is 250 V, the peak value of the output voltage vo is 35 VAC, and the peak value of the output current io is 40 AAC. The proposed MPPT heating control strategy (Formula (25) and hill-climbing algorithm) is shown in Figure 21b, where the operating frequency is 46 kHz, vGE1 (duty cycle) is 0.43, the peak value of the power switch cross-voltage vCE1 is 250 V, the peak output voltage vo is 41 VAC, and the peak output current io is 43 AAC. The hardware experiment results (Figure 21) are similar to the simulation results (Figure 19).
Figure 22a shows the control signal of the traditional control strategy, where the workpiece’s temperature is 750 °C, the operating frequency is 45 kHz, vGE1 (duty cycle) is 0.45, the peak value of the power switch voltage vCE1 is 250 V, the peak value of the output voltage vo is 35 VAC, and the peak value of the output current io is 35 AAC. The proposed MPPT heating control strategy (Formula (25) and hill-climbing algorithm) is shown in Figure 22b, where the operating frequency is 44 kHz, vGE1 (duty cycle) is 0.43, the peak value of the power switch cross-voltage vCE1 is 250 V, the peak output voltage vo is 42 VAC, and the peak output current io is 42 AAC. The hardware experiment results (Figure 22) are similar to the simulation results (Figure 20).
From the measured waveform results (Figure 21 and Figure 22), it can be observed that the output current decreases as the temperature increases (Req increases). In the proposed MPPT heating control strategy, the operating frequency fs follows the variation in the resonant frequency fr so that the system can operate near the resonant point. Therefore, compared with the traditional heating control strategy (fixed frequency operation), the proposed system has a larger output voltage and current, increasing the output power and optimizing the heating efficiency.
Figure 23 shows that the proposed induction heating system heats the workpiece (a 2 cm diameter and 15 cm long cylindrical low-carbon iron) to 753.3 °C, measured by the infrared thermal imager.
Figure 24 shows the heating duration of the proposed induction heating system, where the traditional heating control strategy (the blue dotted line) takes 320 s to reach 750 °C, and the proposed MPPT heating control strategy (the solid orange line) reaches 750 °C in 120 s.
Table 5 shows the comparison between the simulation results and the experiment results of the proposed and the traditional control strategies. During heating, the proposed control strategy adjusts the operating frequency and the duty cycle with the heating temperature rising, while the traditional control strategy keeps the operating frequency and the duty cycle fixed. The peak value of vo and io are higher than the traditional one. Therefore, the proposed control strategy performs better than the traditional one in heating speed (Figure 24).
This study verifies the feasibility of the proposed induction heating system and the performance of the proposed MPPT heating control strategy, which is better than the traditional heating control strategy (fixed-frequency operation). In addition, Table 6 shows the comparison between the traditional heating control strategy and the proposed MPPT heating control strategy. When the workpiece reaches 500 and 750 °C, the efficiencies of the traditional heating control strategy are 76% and 67%, respectively. By contrast, the efficiencies of the proposed MPPT control strategy are both 96%. Therefore, the proposed MPPT heating control strategy is far better than the traditional one.

5. Conclusions

This study realized a 1.3 kW induction heating system based on a full-bridge LC series resonant converter. An MPPT heating control strategy was proposed to improve the heating performance, which uses the relationship between the resonant frequency and the workpiece’s heating temperature to find the optimal operating frequency. To further improve the induction heating system, this study also utilized the hill-climbing algorithm to calculate the duty cycle that reaches the MPP for heating. The proposed heating control strategy considered the operating frequency and duty cycle to improve the problems of the traditional heating control strategy. The proposed heating induction system had high efficiency, stability, and accurate control. Under the simulation and hardware experiment measurement, the traditional heating control strategy had 76% and 68% efficiencies, respectively, when the workpiece reached 500 and 750 °C. By contrast, the proposed heating control strategy had 96% efficiency when the system heating temperature was 500 and 750 °C. Furthermore, the traditional heating control strategy took 320 s to reach 750 °C, and the proposed MPPT heating control strategy reached 750 °C in 120 s. This study’s contribution is that the proposed control strategy dramatically improves the traditional full-bridge LC series resonant induction heating system, reducing power loss and heating time.
Future work on the induction heating system can simulate and measure different types of workpieces and analyze the influence of the workpiece material and heating coil type on heating speed. Further, methods to reduce the power loss and reduce the size of the circuit are also research directions to consider.

Author Contributions

Y.-L.L., C.-H.L. and H.-D.L. conceived the concept and designed the experiment; Y.-L.L. performed testing and verification; Y.-L.L., C.-H.L. and H.-D.L. wrote the original draft of this article; Y.-L.L., C.-H.L. and H.-D.L. wrote the review and edited this article; C.-H.L. supervised the findings of this work; all authors provided critical feedback and helped shape the research, analysis, and manuscript. All authors have read and agreed to the published version of the manuscript.

Funding

This research was funded by the Ministry of Science and Technology, Taiwan, R.O.C., grant number MOST 110-2221-E-011-081 and MOST 110-3116-F-011-002. The authors also sincerely appreciate the abundant support from the Taiwan Building Technology Center, Featured Areas Research Center Program, within the framework of the Higher Education Sprout Project by the Ministry of Education in Taiwan.

Institutional Review Board Statement

Not applicable.

Informed Consent Statement

Not applicable.

Data Availability Statement

Not applicable.

Conflicts of Interest

The authors declare no conflict of interest.

References

  1. Tarbutton, G.B.; House, P.A.; Hallerberg, D.A. IEEE recommended practice for the testing, design, installation, and maintenance of electrical resistance heat tracing for commercial applications. IEEE Trans. Ind. Appl. 1997, 33, 1035–1040. [Google Scholar] [CrossRef]
  2. Suszynski, Z.; Arsoba, R.; Napieralski, A.; Tylman, W. Infrared detection of delaminations using induction heating. IEEE Trans. Compon. Packag. Technol. 2004, 27, 112–116. [Google Scholar] [CrossRef]
  3. Yang, Y.; Fan, Z.; Hong, T.; Chen, M.; Tang, X.; He, J.; Chen, X.; Liu, C.; Zhu, H.; Huang, K. Design of Microwave Directional Heating System Based on Phased-Array Antenna. IEEE Trans. Microw. Theory Tech. 2020, 68, 4896–4904. [Google Scholar] [CrossRef]
  4. Li, N.; Link, G.; Engler, M.; Jelonnek, J. Small-Size Coaxial Resonant Applicator for Microwave Heating Assisted Additive Manufacturing. IEEE Trans. Microw. Theory Tech. 2021, 69, 4631–4638. [Google Scholar] [CrossRef]
  5. Lucia, O.; Navarro, D.; Guillén, P.; Sarnago, H.; Lucia, S. Deep Learning-Based Magnetic Coupling Detection for Advanced Induction Heating Appliances. IEEE Access 2019, 7, 181668–181677. [Google Scholar] [CrossRef]
  6. Lin, S.; Huang, X.; Gu, D.; Lv, W.; Wang, L. Investigation on Nickel-Based Nano-Scaffold Getter with Induction Heating and Rapid Activation. IEEE Trans. Nanotechnol. 2020, 19, 67–70. [Google Scholar] [CrossRef]
  7. Acero, J.; Lope, I.; Carretero, C.; Burdio, J.M. Adapting of Non-Metallic Cookware for Induction Heating Technology via Thin-Layer Non-Magnetic Conductive Coatings. IEEE Access 2020, 8, 11219–11227. [Google Scholar] [CrossRef]
  8. Villa, J.; Navarro, D.; Dominguez, A.; Artigas, J.I.; Barragan, L.A. Vessel Recognition in Induction Heating Appliances—A Deep-Learning Approach. IEEE Access 2021, 9, 16053–16061. [Google Scholar] [CrossRef]
  9. Lope, I.; Acero, J.; Burdío, J.M.; Carretero, C.; Alonso, R. Design and Implementation of PCB Inductors with Litz-Wire Structure for Conventional-Size Large-Signal Domestic Induction Heating Applications. IEEE Trans. Ind. Appl. 2015, 51, 2434–2442. [Google Scholar] [CrossRef]
  10. Serrano, F.S.; Sagues, C.; Llorente, S. Power Distribution in Coupled Multiple-Coil Inductors for Induction Heating Appliances. IEEE Trans. Ind. Appl. 2016, 52, 2537–2544. [Google Scholar] [CrossRef]
  11. Wang, S.; Izaki, K.; Hirota, I.; Yamashita, H.; Omori, H.; Nakaoka, M. Induction-heated cooking appliance using new quasi-resonant ZVS-PWM inverter with power factor correction. IEEE Trans. Ind. Appl. 1998, 34, 705–712. [Google Scholar] [CrossRef]
  12. Meziane, B.; Zeroug, H. Comprehensive Power Control Performance Investigations of Resonant Inverter for Induction Metal Surface Hardening. IEEE Trans. Ind. Electron. 2016, 63, 6086–6096. [Google Scholar] [CrossRef]
  13. Yun, D.; Park, H.; Koo, J.-H.; Ham, S.; Lee, S. Investigation of Heat Treatment of Gears Using a Simultaneous Dual Frequency Induction Heating Method. IEEE Trans. Ind. Electron. 2015, 51, 8003104–8003107. [Google Scholar] [CrossRef]
  14. Codecasa, L.; Alotto, P.; Moro, F. Fast Solution of Induction Heating Problems by Structure-Preserving Nonlinear Model Order Reduction. IEEE Trans. Magn. 2016, 52, 7200704–7200707. [Google Scholar] [CrossRef]
  15. Aki, F.; Loi, T.; Saito, H.; Mitobe, K. Examination of the Influence on Precision of the Wireless Temperature Measurement Induction Heating System by 37 °C Constant Temperature Environment. IEEE Trans. Magn. 2018, 54, 2800303–2800305. [Google Scholar] [CrossRef]
  16. Yin, S.; Ma, X.; Luo, C.; Wang, J.; Zhu, X. Modeling and Analysis of Transient Performance for Induction Heating System Considering Frequency-Dependent Inductive Load. IEEE Trans. Magn. 2019, 55, 8001404–8001407. [Google Scholar] [CrossRef]
  17. Esteve, V.; Jordán, J.; Kilders, E.S.; Dede, E.J.; Maset, E.; Ejea, J.B.; Ferreres, A. Improving the Reliability of Series Resonant Inverters for Induction Heating Applications. IEEE Trans. Ind. Electron. 2014, 61, 2564–2572. [Google Scholar] [CrossRef]
  18. Sarnago, H.; Lucía, Ó.; Tarragona, M.P.; Burdío, J.M. Dual-Output Boost Resonant Full-Bridge Topology and its Modulation Strategies for High-Performance Induction Heating Applications. IEEE Trans. Ind. Electron. 2016, 63, 3554–3561. [Google Scholar] [CrossRef]
  19. Lin, B.-R. Bidirectional Resonant Converter for DC Microgrid Applications. Processes 2021, 9, 1664. [Google Scholar] [CrossRef]
  20. Lin, B.-R. Analysis and Implementation of a Bidirectional Converter with Soft Switching Operation. Processes 2022, 10, 561. [Google Scholar] [CrossRef]
  21. Sarnago, H.; Lucía, Ó.; Mediano, A.; Burdío, J.M. Analytical Model of the Half-Bridge Series Resonant Inverter for Improved Power Conversion Efficiency and Performance. IEEE Trans. Power Electron. 2015, 30, 4128–4143. [Google Scholar] [CrossRef]
  22. Lin, B.-R. Analysis of a Series-Parallel Resonant Converter for DC Microgrid Applications. Processes 2021, 9, 542. [Google Scholar] [CrossRef]
  23. Han, W.; Chau, K.T.; Zhang, Z. Flexible Induction Heating Using Magnetic Resonant Coupling. IEEE Trans. Ind. Electron. 2017, 64, 1982–1992. [Google Scholar] [CrossRef]
  24. Matsuki, H.; Murakami, K. High quality soft heating method utilizing temperature dependence of permeability and core loss of low Curie temperature Ferrite. IEEE Trans. Magn. 1985, 21, 1927–1929. [Google Scholar] [CrossRef]
  25. Lucía, O.; Maussion, P.; Dede, E.J.; Burdío, J.M. Induction Heating Technology and Its Applications: Past Developments, Current Technology, and Future Challenges. IEEE Trans. Ind. Electron. 2014, 61, 2509–2520. [Google Scholar] [CrossRef] [Green Version]
  26. Aung, S.S.; Wai, H.P.; Soe, N.N. Design Calculation and Performance Testing of Heating Coil in Induction Surface Hardening Machine. World Acad. Sci. Eng. Technol. 2007, 2, 1134–1138. [Google Scholar]
  27. Huerta, J.M.E.; Santamaria, E.J.D.G.; Gil, R.G.; Moreno, J.C. Design of the L-LC Resonant Inverter for Induction Heating Based on Its Equivalent SRI. IEEE Trans. Ind. Electron. 2007, 54, 3178–3187. [Google Scholar] [CrossRef]
  28. Chudjuarjeen, S.; Sangswang, A.; Koompai, C. An Improved LLC Resonant Inverter for Induction-Heating Applications with Asymmetrical Control. IEEE Trans. Ind. Electron. 2011, 58, 2915–2925. [Google Scholar] [CrossRef]
  29. Bi, C.; Lu, H.; Jia, K.; Hu, J.; Li, H. A Novel Multiple-Frequency Resonant Inverter for Induction Heating Applications. IEEE Trans. Power Electron. 2016, 31, 8162–8171. [Google Scholar] [CrossRef]
  30. Mohammadi, M.; Ordonez, M. Fast Transient Response of Series Resonant Converters Using Average Geometric Control. IEEE Trans. Power Electron. 2016, 31, 6738–6755. [Google Scholar] [CrossRef]
  31. Liu, H.-D.; Lin, C.-H.; Pai, K.-J.; Lin, Y.-L. A novel photovoltaic system control strategies for improving hill climbing algorithm efficiencies in consideration of radian and load effect. Energy Convers. Manag. 2018, 165, 815–826. [Google Scholar] [CrossRef]
Figure 1. Diagram showing the principle of induction heating.
Processes 10 01151 g001
Figure 2. Schematic diagram of a round barrel helical heating coil.
Processes 10 01151 g002
Figure 3. Schematic diagram of the Curie temperature.
Processes 10 01151 g003
Figure 4. The heater coil and workpiece: (a) schematic diagram, (b) equivalent circuit model.
Processes 10 01151 g004
Figure 5. Schematic diagram of the trend: (a) variation in equivalent resistance with temperature, (b) variation in equivalent inductance with temperature.
Processes 10 01151 g005
Figure 6. Architecture diagram of the LC series resonant converter: (a) half-bridge, (b) full-bridge.
Processes 10 01151 g006
Figure 7. Fundamental waveforms of the full-bridge LC series resonant converter.
Processes 10 01151 g007
Figure 8. Operation modes of the full-bridge LC series resonant converter: (a) Interval I (t0−t1), (b) Interval II (t1−t2), and (c) Interval III (t2−t3).
Processes 10 01151 g008
Figure 9. Equivalent simplified model of a heating coil and workpiece combined with a transformer.
Processes 10 01151 g009
Figure 10. Modified equivalent model of a heating coil and workpiece combined with a transformer.
Processes 10 01151 g010
Figure 11. RLC series resonant circuit.
Processes 10 01151 g011
Figure 12. RLC series resonant equivalent circuit under the frequency domain.
Processes 10 01151 g012
Figure 13. Transfer function curves of RLC series resonant converters under different quality factors.
Processes 10 01151 g013
Figure 14. Frequency−power curve trend of the proposed system with temperature change.
Processes 10 01151 g014
Figure 15. Relationship between the heating power and the operating frequency of the proposed induction heating system.
Processes 10 01151 g015
Figure 16. Schematic diagram of the hill-climbing algorithm.
Processes 10 01151 g016
Figure 17. Flow chart of the proposed MPPT heating strategy.
Processes 10 01151 g017
Figure 18. A prototype of the proposed induction heating system.
Processes 10 01151 g018
Figure 19. Simulation waveforms vGE1 (duty cycle), the voltage across the power switch voltage vCE1, the output voltage vo, and the output current io under the condition that the workpiece is 500 °C: (a) traditional control strategy, (b) proposed MPPT heating control strategy.
Processes 10 01151 g019
Figure 20. Simulation waveforms vGE1 (duty cycle), the voltage across the power switch voltage vCE1, the output voltage vo, and the output current io under the condition that the workpiece is 750 °C: (a) traditional control strategy, (b) proposed MPPT heating control strategy.
Processes 10 01151 g020
Figure 21. Hardware experimental waveforms vGE1 (duty cycle), the voltage across the power switch voltage vCE1, the output voltage vo, and the output current io under the condition that the workpiece is 500 °C: (a) traditional control strategy, (b) proposed MPPT heating control strategy. (vGE1: 10 V/div; vCE1: 200 V/div; vo: 40 V/div; io: 40 A/div; and Hor: 4 μs/div).
Processes 10 01151 g021
Figure 22. Hardware experimental waveforms vGE1 (duty cycle), the voltage across the power switch voltage vCE1, the output voltage vo, and the output current io under the condition that the workpiece is 750 °C: (a) traditional control strategy, (b) proposed MPPT heating control strategy. (vGE1: 10 V/div; vCE1: 200 V/div; vo: 40 V/div; io: 40 A/div; and Hor: 4 μs/div).
Processes 10 01151 g022
Figure 23. Actual photo of the induction heating system heating the workpiece to 753.3 degrees Celsius, measured by the infrared thermal imager.
Processes 10 01151 g023
Figure 24. Comparison of the traditional control strategy and proposed MPPT heating control strategy for the heating duration of the proposed induction heating system.
Processes 10 01151 g024
Table 1. Comparison among four heating methods.
Heating MethodApplicationCharacteristic
Resistance heating
[1]
Low-temperature heating (electric kettles and pots)Contact heating, simple heating method, low heating efficiency
Infrared heating
[2]
Surface heating of various materials at the same timeFar and near-infrared has different heating effects for different materials
Microwave heating
[3,4]
Heat rubber or food with more water content (microwave oven)Rapid heating, suspicion of electromagnetic wave leakage, need to be isolated
Induction heating
[5, 6, 7, 8]
Heating metal at high temperature (induction cooker)Noncontact heating, using frequency to decide the heating depth, speed, and efficiency
Table 2. Comparison among five induction heating control strategies.
Control MethodComplexityPerformanceHeating Speed
Two frequencies control [13]LowMediumMedium
High-speed heating control [14]MediumHighHigh
Wireless constant temperature control [15]MediumHighMedium
Deep-learning control [8]HighHighMedium
ProposedLowHighHigh
Table 3. Specification of the full-bridge LC series resonant converter.
ParameterValue
Rated power1.3 kW
Input voltage Vs250 VDC
System operating frequency range fs44 to 50 kHz
Maximum heating temperature750 °C
Table 4. Specification of the induction heating system.
ParameterValue
Input voltage250 VDC
Resonant inductor150 μH
Resonant capacitor33 nF
Equivalent inductance of heating coil Leq
(temperature of 750 °C and frequency of 44 kHz)
1.25 μH
Equivalent resistance of heating coil Req
(temperature of 750 °C and frequency of 44 kHz)
0.5 Ω
Turn ratio (transformer)N1:N2 = 10:1
Heating coilInner diameter 2.5 cm, 13 turns
WorkpieceCylindrical low-carbon iron
(2 cm diameter, 15 cm long)
Table 5. Comparison between the simulation results and the experiment results of the proposed and the traditional control strategies.
Heating TemperatureMeasurementSimulationExperiment
TraditionalProposedTraditionalProposed
500 °Cfrequency45 kHz46 kHz45 kHz46 kHz
duty cycle0.450.430.450.43
peak value of vo30 VAC39.5 VAC35 VAC41 VAC
peak value of io40 AAC43 AAC40 AAC43 AAC
750 °Cfrequency45 kHz44 kHz45 kHz44 kHz
duty cycle0.450.440.450.44
peak value of vo32 VAC40 VAC35 VAC42 VAC
peak value of io35 AAC42 AAC35 AAC42 AAC
Table 6. Performance comparison between the traditional heating control strategy and the proposed MPPT heating control strategy.
Control MethodHeating Temperature
500 °C750 °C
Traditional (Efficiency)76%68%
Proposed (Efficiency)96%96%
Publisher’s Note: MDPI stays neutral with regard to jurisdictional claims in published maps and institutional affiliations.

