Article

The Readiness of the Water Utilities in Bulgaria for Transition toward a Circular Economy

Water Supply, Sewerage, Water and Wastewater Treatment Department, University of Architecture, Civil Engineering and Geodesy (UACEG), Hristo Smirnenski, No 1 Hristo Smirnenski blvd, 1164 Sofia, Bulgaria
*
Author to whom correspondence should be addressed.
Processes 2022, 10(6), 1156; https://doi.org/10.3390/pr10061156
Submission received: 9 May 2022 / Revised: 2 June 2022 / Accepted: 6 June 2022 / Published: 9 June 2022

Abstract

:
Urban water systems are still in their infancy regarding the transition toward a circular economy, despite the sporadic successful examples worldwide. This paper was aimed at analyzing the preparedness of four water utilities in Bulgaria for the implementation of circular economy principles and solutions. These utilities provide water supply and sewerage services to about 30% of the population in Bulgaria. SWOT analysis was used as a core tool. Publicly available data such as nonrevenue water, pressure management, energy demand, network digitalization, and sludge utilization were used to explore the internal factors. The external environment was considered through the legislative and socioeconomic framework, climate change, etc. Finally, the credibility of the conclusions was verified in workshops with the water utilities. The key positive outcomes were that the external factors favor the shift to circular systems, while the major weakness, i.e., the aged infrastructure, is actually a good opportunity for the implementation of modern and circular solutions. The efficient collaboration of water utilities with other actors is a precondition for the development of a sustainable market for “circular” products.

1. Introduction

The traditional linear economy usually characterized by “take–make–dispose” has resulted in substantial depletion of the natural resources and huge depositions of often nonbiodegradable wastes. The alternative approach is the circular economy where the industrial development is striving toward closing the loop between raw material input and waste, trying to simulate the unique cycles of nature for renewable water and energy sources and no waste piling.
The EU policy framework toward a circular economy is quickly developing. The first Circular Economy Action Plan was launched in 2015, followed by the second Action Plan in 2020 [1,2]. The latter supports the European Green Deal for the need to set up a circular economy in the industrial and agricultural sectors, in addition to the prioritization of investments in renewable energy sources and increasing the energy efficiency [3]. For an assessment of the progress of implementing a circular economy, the European Commission has developed a monitoring framework consisting of 10 indicators grouped into four thematic aspects of circular economy: (a) production and consumption, (b) waste management, (c) secondary raw materials, and (d) competitiveness and innovation [4]. Eurostat proposed the summary indicator “the circular material use rate” for evaluation of the circularity of different countries at a macroeconomic level, defined as “the contribution of recycled materials towards the overall use of materials” [5].
For example, the circularity rate in the EU is 12.8 in 2020, growing by 0.8 compared with 2019 and by 4.5 points compared with 2004—the first year with available data [5]. About 70% of EU countries, however, have a circularity rate below the average value of the EU. The Netherlands, France, Belgium, and Italy are the countries with the highest rates (30.9–21.6), while Bulgaria, Portugal, Ireland, and Romania have the lowest rates (2.6–1.3). On a global scale, the Circularity Gap Report 2020 concluded that Today, the global economy is only 8.6% circular—just two years ago, it was 9.1%” [6]. Despite the considerable EU and worldwide incentives boosting the implementation of a circular economy, the pace of progress is still slow.
Water supply and sanitation services play a key role in social and economic development. The processes of water intake, treatment, and distribution, as well as wastewater conveyance and treatment, uniquely integrate the flows of water, energy, and materials and provide remarkable opportunities for the implementation of circular solutions. Such solutions not only increase the value of water as a product but also increase the added value of water services, turning them into a source of green energy and valuable recycled materials for other economic sectors. Thus, water utilities have significant potential for increasing the circularity rate at a macroeconomic level [7,8].
A study of the International Water Association (IWA) presented a roadmap to the circular economy of the water utilities, outlining the state of the art of the potential circular solutions along the water, energy, and material pathways, the main drivers of the process, and the stakeholders that have to be involved in the process [9]. The reviewed circular economy solutions are summarized below.
The water pathway—upstream investments (e.g., solutions for the protection of water at the source resulting in fewer expenses for further treatment), rainwater harvesting, graywater recycling or reuse of (waste)water in agriculture and industry, utilization of reused water for potable needs, prevention of water leakages, and reduction in water consumption.
The materials pathway—increasing the resource efficiency within the treatment processes, sludge utilization for the production of goods (e.g., bioplastics and fertilizers), as input materials for other industries (e.g., paper production and building materials), or for the extraction of metals and minerals and extraction of gases (e.g., carbon dioxide, nitrogen ammonia, and methane) from wastewater effluent.
The energy pathway—increasing the energy efficiency of water supply and sewer systems, energy reduction and recovery of water within households, a yield of electricity from distribution systems, heat yield from sewer networks, utilization of sludge for energy production, and production of renewable energy (e.g., hydropower plants and solar panels).
The proposed circular solutions may be analyzed from another perspective. For instance, some of them are traditional approaches for increasing the efficiency of water supply and sewer services (e.g., water loss reduction, biogas production, energy demand reduction, and energy production by hydropower plants), while others have recently started real-scale applications (e.g., recovery of cellulose from municipal waste sludge and alginate production from granulated sludge). The new products from reused materials, the produced green energy, and the water to be reused need a sustainable market to cover the investments and operational expenses of the water operator; thus, it is essential the involvement of other economic sectors in the engine of circular economy of the water utilities. The household consumers also play a vital role through their behavior toward the efficiency of water and energy utilization, thus influencing the amount of drinking water consumption and/or wastewater discharged into the sewer network. This, however, may decrease the level of utilization of centralized services, which consequently affects the incomes of the water operators.
Thus, the water utilities, despite being an initiator and environment (or production site) for circular products, cannot be a solo player. An appropriate level of cooperation, behavior, and social awareness needs to be cultivated among the stakeholders to drive this process. Such key drivers are the consumers, the industrial sector and agriculture, the regulatory framework, the urban infrastructure, and the urban and basin economies [9]. Last but not the least, a more active role of the water utilities in the integrated resource management, the cooperation with research institutions for the development of innovative technologies, and educational initiatives for increasing the public awareness or incentives for the efficient use of water, as well as the application of new business models, can boost the progress toward a circular economy.
So far, worldwide, there are many successful examples of circular economy application to water utilities. For example, it is worth mentioning the successive circular economy approaches in the wastewater treatment plant (WWTP) of Apeldoorn, the Netherlands. The treatment plant delivers biogas for electricity and heating to a nearby residential area, produces struvite for agriculture, and has a large-scale installation for extraction of alginate from the sludge (https://www.dutchwatersector.com, accessed on 20 April 2022). The managing board also works actively with the government to change/adapt legislation to provide a market for “circular” products. The Veolia Group demonstrates large-scale innovative circular economy solutions focusing on water services, e.g., wastewater recycling, heat and electricity generation, or application of smart water metering for reduction of water leakages (https://www.veolia.com, accessed on 20 April 2022). An Israeli water case study reported that around 7% of the water is lost through conveyance and distribution to users, about 23% of the water is reused in agriculture, and about 86% of the treated water is recycled, which is the highest wastewater recycling rate in the world [10].
Although many other good examples can be found worldwide for successful circular economy solutions, recent studies evidence that, for many water utilities, the circular economy seems to still be a concept rather than a usual business with compatible solutions [11]. There remain different barriers (e.g., technological, regulatory, organizational, social, and economic) that have to be overcome by the WSSOs on their way to a circular economy [12].
The “circular” transition is neither a simple nor a quick process. A sound approach toward comprehensive adoption of the circular economy in the water sector requires a thorough analysis of the status quo as a first step. SWOT analysis is a well-acknowledged strategic planning tool. It helps identify and map the internal strengths and weaknesses of the business units and the external factors that may positively influence or hinder the meeting of the specific, predefined targets. The usefulness of SWOT analysis for strategic planning in the water field has been demonstrated in many studies [13,14,15,16]. However, none of the reviewed papers reported the application of SWOT analysis for revealing the readiness of water operators to shift urban water systems into circular ones.
This study develops an approach for the application of SWOT analysis as a first step in the strategic planning of water supply and sewerage operators (WSSOs) toward the transition to a circular economy. The study suggests a set of key performance indicators, which are publicly available and appropriate for the identification of strengths and weaknesses of the studied systems. The usefulness of the approach is demonstrated for four WSSOs in Bulgaria. The outcomes may be used as a benchmark in other studies.

2. Materials and Methods

An analysis of internal strengths (S) and weaknesses (W), as well as external opportunities (O) and threats (T), i.e., so-called SWOT analysis, was the core tool of this study.
The approach for this study consisted of four steps, presented in Figure 1.
Step 1: Selection of representative WSSOs
The selection was based on several criteria:
  • The population covered by the water supply and wastewater service.
  • The complexity of water supply and sewer systems—the type of the water sources, characteristics of the water supply and sewer networks, existing drinking water treatment plants (DWTPs) and urban wastewater treatment plants (UWWTPs), and sludge management approaches.
  • The form of ownership of the operator, e.g., state, municipal, or private ownership.
Step 2: Analysis of the internal environment (strengths and weaknesses) for each of the selected WSSOs.
The analysis encompassed those characteristics of the water supply and sewerage systems that may favor or create obstacles in the development of circular economy solutions. The information provided in the Business Plans for 2017–2021 of the selected WSSOs was studied in detail, as some issues were further discussed/clarified with the operational staff. The already existing “circular” technologies and approaches were emphasized. In order to provide an equal base for comparison, indicators such as the efficiency of water utilization, energy efficiency, and efficiency of materials utilization were analyzed in depth using the annual data of the WSSOs provided to the Regulator for the period 2017–2020. Together with the specific indicators for each of the studied WSSOs, whenever possible, information on the relevant average values of the indicators for specific groups of WSSOs in Bulgaria is provided.
The existing cooperation of the selected WSSOs with key stakeholders that may benefit from the ready for reuse products of the water utilities, as well as the cooperation with research institutions for the development of innovative solutions, was also analyzed.
Step 3: Analyses of the external environment (opportunities and threats)
The influence of the key external factors on the transition of the water utilities in Bulgaria toward a circular economy was analyzed. These are the regulatory framework, the climate change effects, the economic factors (i.e., the cost of water supply and sewerage services and the market for reused products), and the social factor concerning the trends of population development.
Step 4: Verification of SWOT analysis by WSSOs and summarizing the results
SWOT analyses developed for each of the selected WSSOs were presented and discussed with the managing board of three (out of four) selected WSSOs. The presentation to the fourth WSSO is forthcoming. On the basis of the SWOT analyses, a range of potential circular solutions that can be realized in short term were also discussed with each of the investigated WSSOs.
The common strengths, weaknesses, opportunities, and threats are summarized and presented below. The results are compared with other similar case studies.

3. Results

3.1. Step 1: Selection of Representative WSSOs

In Bulgaria, using statistical data as of 2020, 99.4% of the population is connected to a centralized water supply, while the centralized sewer collection covers 76.3% of the population, with 66.3% also connected to wastewater treatment (www.nsi.bg, accessed on 2 May 2022). At present, there are 45 water supply and sewerage operators (WSSOs), each one operating in a specific region of the country and providing both water supply and sewerage services. The operators are categorized into four groups by the Energy and Water Regulatory Commission (shortly named herewith the Regulator), as a function of the serviced population, the water amount entering the water supply system, and the revenues of the provided services [17]:
  • 10 big WSSOs serving about 59% of the population.
  • 18 medium WSSOs serving about 35% of the population.
  • 10 small WSSOs serving about 5% of the population.
  • seven micro WSSOs serving about 1% of the population.
All the big and medium WSSOs were initially screened according to the defined criteria in step 1 of the methodology. Four WSSOs were selected:
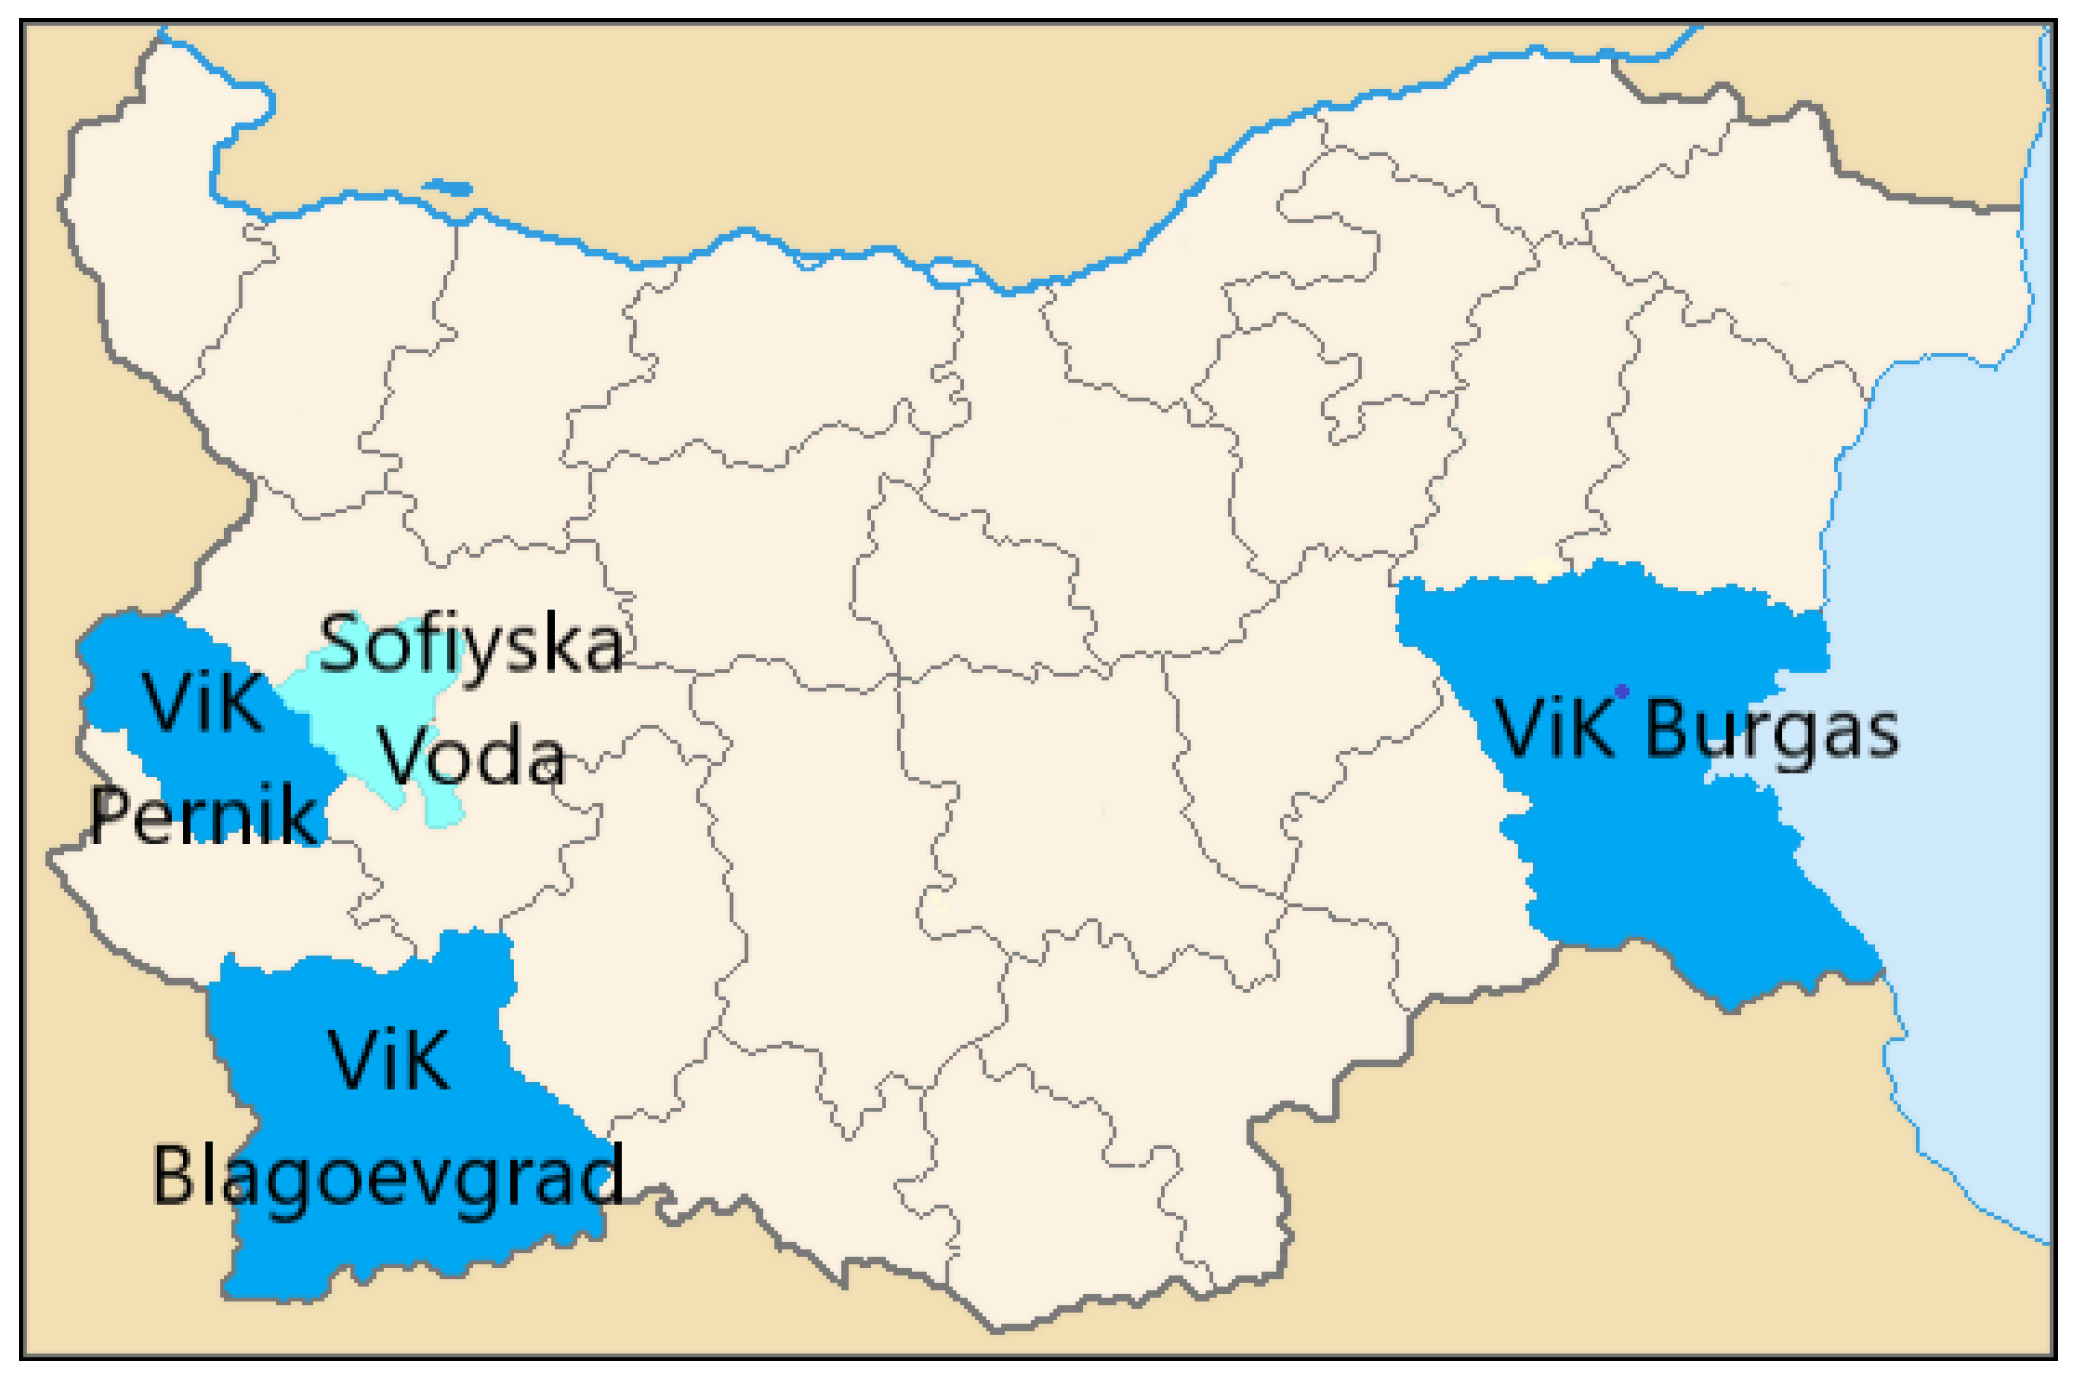
  • two big WSSOs—ViK Burgas and Sofiyska Voda.
  • two medium WSSOs—ViK Blagoevgrad and ViK Pernik.
The location of the services of the selected WSSOs is shown in Figure 2. Table 1 presents some key data for each of the WSSOs [17,18,19,20,21]. It has to be noted that, in 2020, ViK Blagoevgrad annexed ViK Petrich (a small WSSO) and became a big operator. Since the analyses encompass the period 2017–2020, however, ViK Blagoevgrad was considered a medium operator.
Each of the selected WSSOs also has some unique features:
  • ViK Burgas—the water supply infrastructure is one of the longest in the country, also providing water to the neighboring Varna District. The serviced area is with intensive tourist activities in the summer, as the number of tourists exceeds several times the number of residents.
  • Sofiyska Voda services Sofia capital—the most developed region in Bulgaria, with the highest concentration of both population and economic activities. Sofiyska Voda is a part of the international Veolia Group.
  • ViK Blagoevgrad services mountainous area with many river intakes with significant seasonal variations of water quality and flow. A substantial part of the population lives in small villages with a lower living standard compared to the urbanized areas.
  • The ViK Pernik serviced area neighbors that of Sofiyska Voda. It, however, has a lower rate of social and economic development. In 2019–2020, Pernik suffered from severe water shortage due to insufficient water volume in the main water source—Studena Dam.
The selected WSSOs provide water supply and sewerage services to about 30% of the population in Bulgaria.

3.2. Step 2: Analysis of the Internal Environment (Strengths and Weaknesses) of the Selected WSSOs for Applying Circular Economy

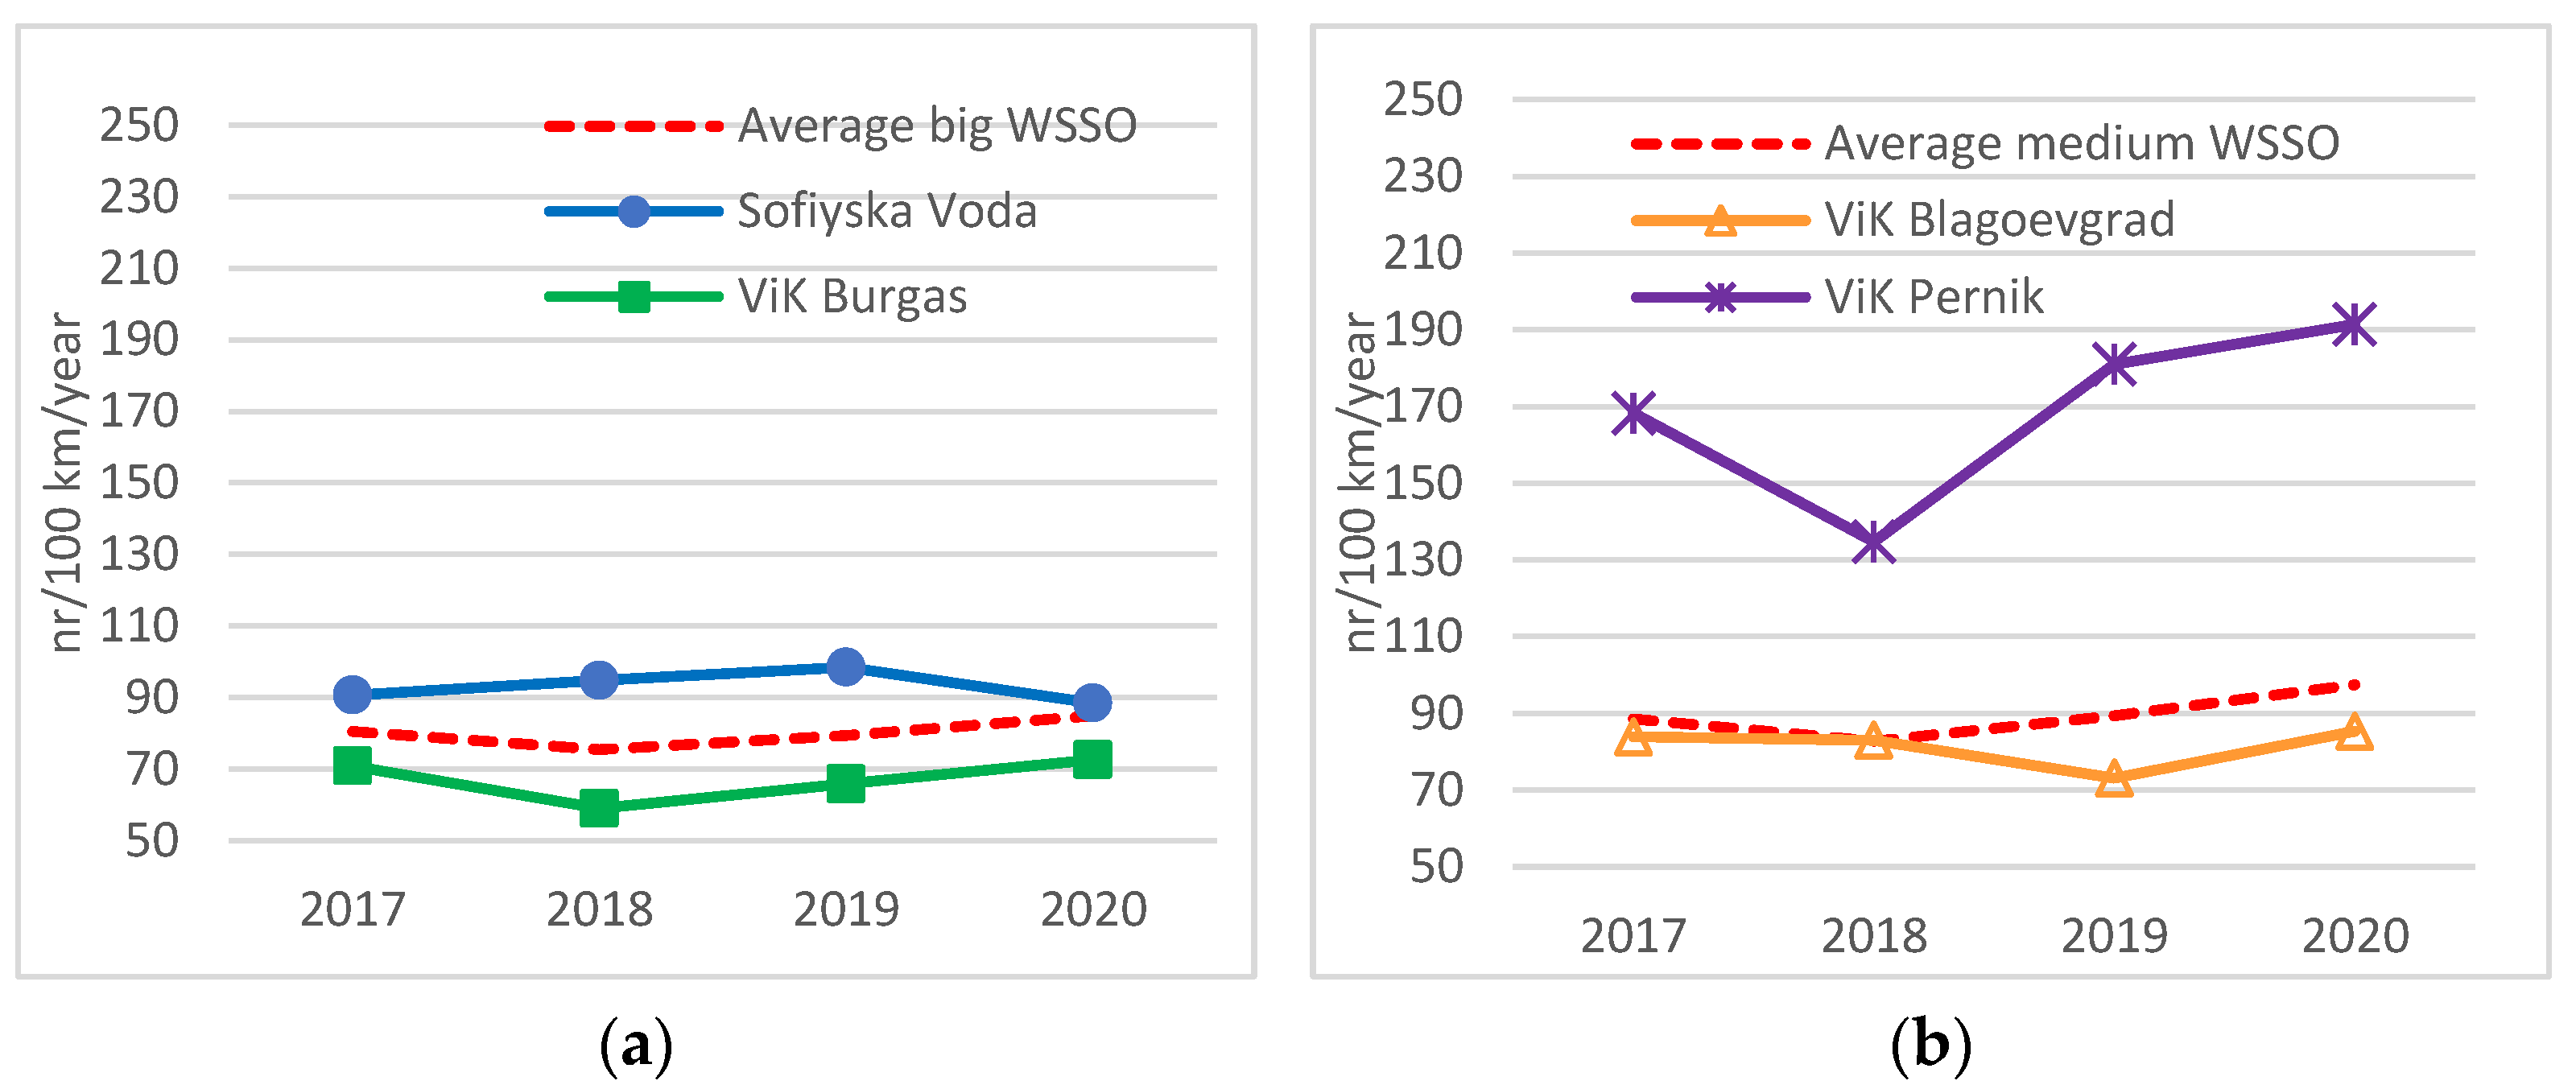
3.2.1. Condition of the Water Supply and Sewerage Infrastructure

Most of the water supply systems were installed between 1940 and 1960. At present, asbestos cement (AC) pipes are still predominant, representing 63% of the trunk mains and 60% of the distribution networks in ViK Blagoevgrad [18], and 45% of the trunk mains and 60% of the distribution networks in ViK Burgas [19]. ViK Pernik also has a significant percentage of AC pipes. The lowest share is reported by Sofiyska Voda—around 20%. The bad condition of the pipes is reflected in frequent failures, as shown in Figure 3 [17,22,23,24].
The long-term target set by the Regulator of 60 failures per 100 km pipes per year seems to be reached only by ViK Burgas, although an increasing trend of failures can be observed. The number of failures for ViK Pernik is the highest among the investigated WSSOs, also much higher than the average reported rates for the group of medium operators.
The sewer systems are mostly in the towns and are of the combined type, while villages rely on decentralized solutions. The majority of the collectors are 50–80 years old. Most of the collecting systems were extended and rehabilitated after 2013 in order to fulfill the requirements of Directive 91/271/EEC, as the activities were co-financed by the EU Cohesion Fund. One of the most significant problems concerning the sewer networks is the infiltration/exfiltration. The selected WSSOs could not specify a credible percentage, but the relatively low organic load and relatively high hydraulic load at the inlet of the UWWTPs prompt suggest the share of infiltration is significant. In addition, some collectors have no sufficient hydraulic capacity and increase the risk of local floodings during storm events. The number of such complaints for the investigated period was in the range of 0.08 to 0.15 per 10,000 population for Sofyiska voda, 0.30 to 0.41 for ViK Burgas, 0.60 to 0.86 for ViK Blagoevgrad, and 0.12 to 0.60 for ViK Pernik accordingly [17,22,23,24].
The existing DWTPs have conventional treatment schemes for the removal of turbidity and color. The main treatment process is rapid sand filtration, while some DWTPs also have a settling/clarification stage before filtration. Most of the DWTPs were constructed between 1970 and 1995. The quality of treated water is in compliance with the requirements of the EU Directive 98/83/EEC on the quality of water intended for human consumption. It is not clear, however, to what extent the existing technological schemes will be able to comply with the more stringent water quality requirements of the new drinking water directive (EU Directive 2020/2184/EC). The monitoring of the newly introduced water quality parameters, set by the directive, has not yet started.
The existing WWTPs are conventional with mechanical and biological treatment stages. Nutrient removal is also included depending on the size of the agglomeration. The approaches for sludge stabilization are aerobic stabilization in the smaller UWWTPs operated by ViK Burgas and ViK Blagoevgrad and open-air anaerobic stabilization in the bigger plants serving the central towns of the districts (UWWTP Burgas, UWWP Pernik, UWWTP Blagoevgrad) or anaerobic digestion with methane tanks in UWWTP Kubratovo operated by Sofiyska Voda. It has to be noted that there are methane tanks in UWWTP Burgas and UWWTP Pernik, but the structural condition is very bad, and, for a long time, they have been operated as open-air digesters. Currently, both ViK Pernik and ViK Burgas are beneficiaries of projects co-financed by the EU Cohesion Fund. In UWWTP Burgas a new methane tank and a sludge drying facility will be constructed. The latter will also dry sludge from the neighboring treatment plants in the serviced area. The sludge in UWWTP Pernik will be aerobically digested. A new, additional methane tank and converters were recently constructed and put into operation at UWWTP Kubratovo (Sofiyska Voda, Sofia, Bulgaria).
All operators develop and continuously extend the systems for control and data acquisition (SCADAs). Currently, they encompass mostly the water supply networks (e.g., distant control of pumping stations, water levels in key reservoirs, control of flowmeters, and pressure regulators). SCADA systems are partially implemented in the sewer networks of ViK Burgas and Sofiyska Voda, mostly for the operation of the sewer pumping stations. Sofiyska Voda is a step ahead, also including SCADAs for water quality monitoring in the distribution network and for monitoring of hydraulic and wastewater quality parameters at key points of the sewer network. A SCADA system for control of the main processes in DWTPs is almost completed in Sofiyska Voda, and it is partially developed in the DWTPs operated by ViK Burgas. There is an ongoing project for SCADA implementation in DWTP Blagoevgrad and DWTP Pernik; the latter is in process of complete renovation. SCADAs are well developed in almost all UWWTPs covering the key treatment processes. WWTP Pernik and WWTP Burgas are currently in the process of complete renovation, including SCADA implementation.
The establishment of certain types of registers and databases facilitates data processing and enables outlining of trends and deficiencies of system operation. The WSSOs maintain different types of registers, e.g., register of failures, register of consumer complaints, and WWTP sludge register. In addition, Sofiyska Voda has fully implemented a GIS register of the water supply and sewerage networks, ViK Blagoevgarad has almost completed one, and ViK Burgas and ViK Pernik are at the initial stage of development [17]. All operators maintain different types of data, e.g., databases for water entering the water supply systems, for DWTP inlet flow, for WWTP inlet flow (not yet completed for ViK Burgas), and for the used energy. Sofiyska Voda is also maintaining a monitoring database of water meters along the network and for calculating the legal non-measured consumption.

3.2.2. Approaches Related to Circular Economy along the Water Pathway

The below approaches were identified in the selected WWSOs, in line with the IWA’s roadmap of circular solutions in water utilities [9].
  • Upstream measures for the protection of water sources
The protection of water quality sources from deterioration is a prime task for all the WSSOs, and sanitary protection zones have been established around all the main water supply sources.
There is, however, seasonal proliferation of blue-green algae in Iskar Dam, which provides about 75% of the drinking water to the Sofia capital. This phenomenon complicates the technological process of treatment in both DWTPs and results in higher water consumption for filter backwash. In 2021, Sofiyska Voda installed a floating LG Sonic buoy with an ultrasonic device and real-time monitoring sensors for several water quality parameters including phytocyanin and chlorophyll a. The facility transfers the data to a web-based software, which makes prognoses and remotely controls the ultrasonic technology for algae regulation. The introduction of this technology is in the framework of the Aqua3S project (https://aqua3s.eu, accessed on 29 November 2021).
An early alarm system was installed at the river intakes of ViK Blagoevgrad to protect the DWTP Blagoevgrad from extreme turbidity events. Usually, the turbidity is low (0.5 to 5 NTU); however, during rainfall events, it may change briefly to above 500 NTU. The alarm system allows diverting the highly polluted flow from the DWTP Blagoevgrad (usually for 1 to 3 h) without affecting the continuous water supply to the city, since the storage capacity of the pressure reservoirs is utilized.
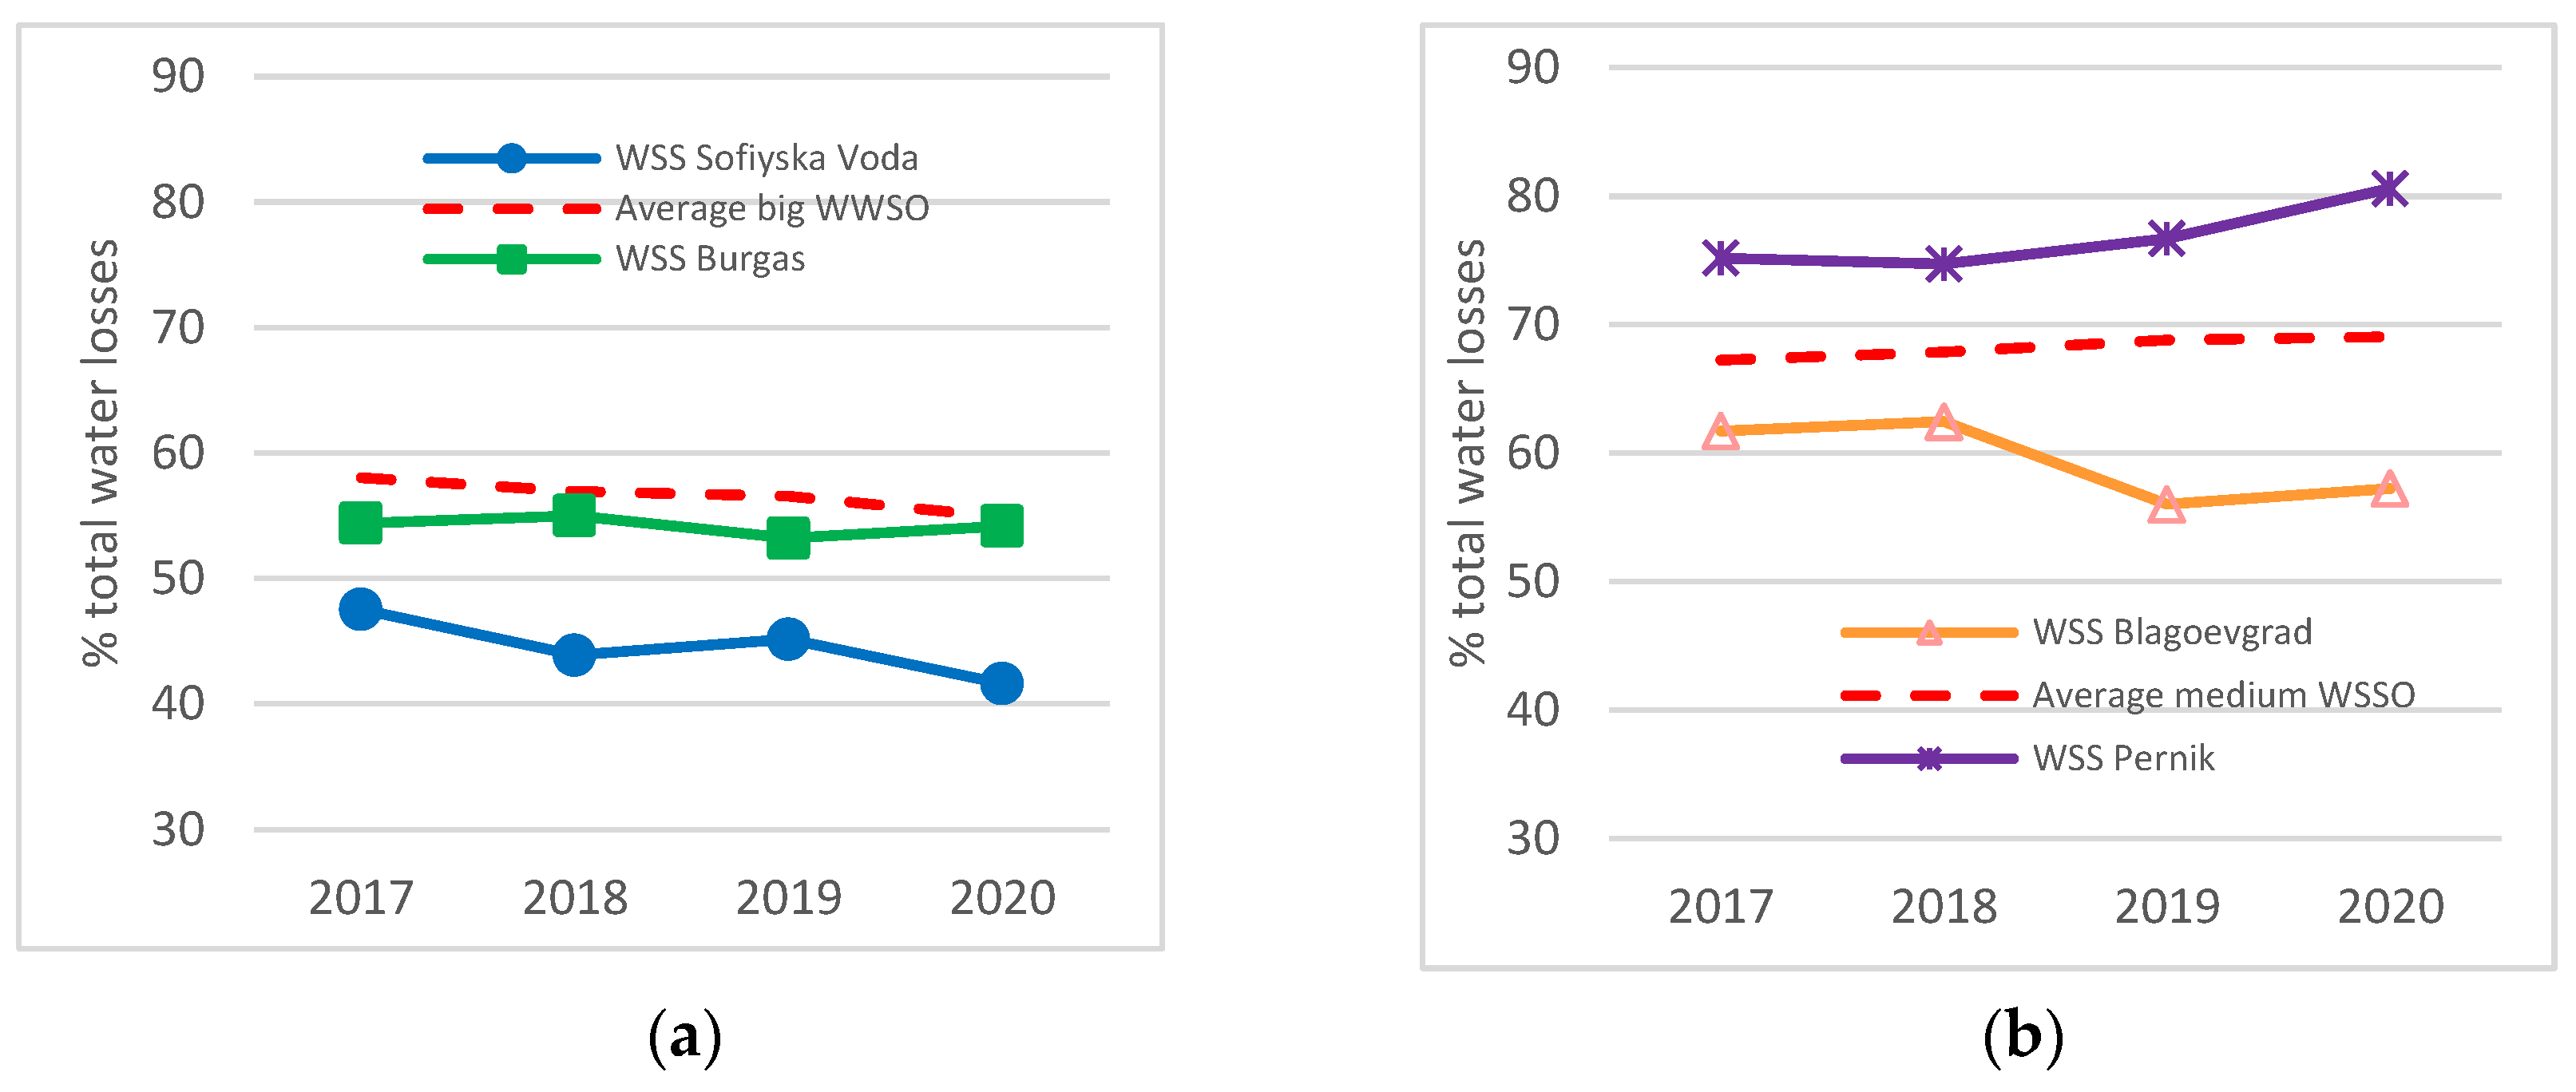
  • Control and prevention of water leakages
Physical water leakages represent a serious problem for each water supply network, resulting in loss of drinking water and an increase in the energy demand for water intake, treatment, and distribution.
All the selected WSSOs have annual programs concerning leakage control, including both investment budgets for pipes replacement and soft measures. The latter includes active leakage control, water supply network zoning, the establishment of district metering and pressure regulation areas, and implementation of a supervisory control and data acquisition (SCADA) system for management of system operation [18,19,20,21]. The current rate of development of these measures is different for the different WSSOs, and the most advanced is Sofiyska Voda.
Real water losses are a part of the nonrevenue water (NRW); due to the lack of unified methodology in the EU for computation of physical leakages, the NRW, together with the number of failures along the water supply networks, usually serves as an indirect parameter for estimation of the significance of the problem of water leakages in the system [25,26]. The selected WSSOs have no sound conclusion on the share of the real water losses in the NRW. According to expert estimation, however, they are the biggest component of the NRW and may account for over 70% of it. A study assessing the real water losses for the WSSO in the town of Vidin, Bulgaria reached a similar value, i.e., real water losses of about 80% of the NRW [27].
The percentage rate of NRW, defined as the ratio between the NRW and the water entering the water supply systems is used as an indicator of the quality of the water supply service in Bulgaria. Through the efforts demonstrated by the selected WSSOs, Figure 4 shows that the current results are still unsatisfactory [17,22,23,24].
The Regulator set a long-term target value of 49% NRW for all the Bulgarian WSSOs [17]. Sofiyska Voda has the lowest NRW rate and has reached the long-term target value. ViK Burgas maintains relatively constant rates, while ViK Blagoevgrad has a progressive trend of decrease, but is still quite distant from the long-term target. The most problematic is ViK Pernik with a stable trend of increasing NRW rate. The average NRW rates for the groups of big and medium WSSOs in Bulgaria are also quite distant from the target value.
The pressure management is another measure closely related to the control and prevention of leakages. The rate of development of pressure management in Bulgaria is assessed through a criterion determined by the ratio between the number of water metering zones having continuous flow and pressure measurements at the inlet and outlet of the zone (including measuring the pressure at a critical point of the zone) and the total number of water measuring zones. Figure 5 presents the results for the investigated operators and the corresponding average rates for the groups of big and medium operators [17,22,23,24].
The long-term target set by the Regulator is 100%. The pressure management of ViK Burgas, ViK Blagoevgrad, and ViK Pernik is quite distant from the target, although the first two operators show a trend of increase. A similar conclusion can be made for the average rates of the groups of big and medium WSSOs. Sofiyska Voda is a good example of the positive effect of pressure management and a well-developed SCADA system on the rate of the NRW.

3.2.3. Approaches Related to Circular Economy along the Energy Pathway

  • Water power utilization for energy production
Hydropower plants (HPPs) utilizing the power of water on the way to the drinking water systems are installed on the water way to the water supply systems of all WSSOs. There are seven HPPs (in total 6 MW) on the water way from Blagoevgradska Bistritza River to Blagoevgrad, one HPP (1.3 MW) on the water way from Kamchia Dam to Burgas, one HPP (0.82 MW) on the water way from Studena Dam to Pernik, two HPPs (in total 53 MW) on the water way from Iskar Dam to Sofia, and three HPPs (in total 31 MW) on the water way Beli Iskar Dam to Sofia [28,29]. The existing HPPs, however, are not owned by the WSSOs, except for HPP Studena, owned by ViK Pernik. The produced energy is sold to the regional electrical operator and not directly used to cover the energy needs of ViK Pernik.
Sofiyska Voda applies an innovative approach for energy yield along the water distribution network through the installation of microturbines. The produced energy makes possible the operation of the pressure regulators and data loggers in the zones where there is no other source of energy [21].
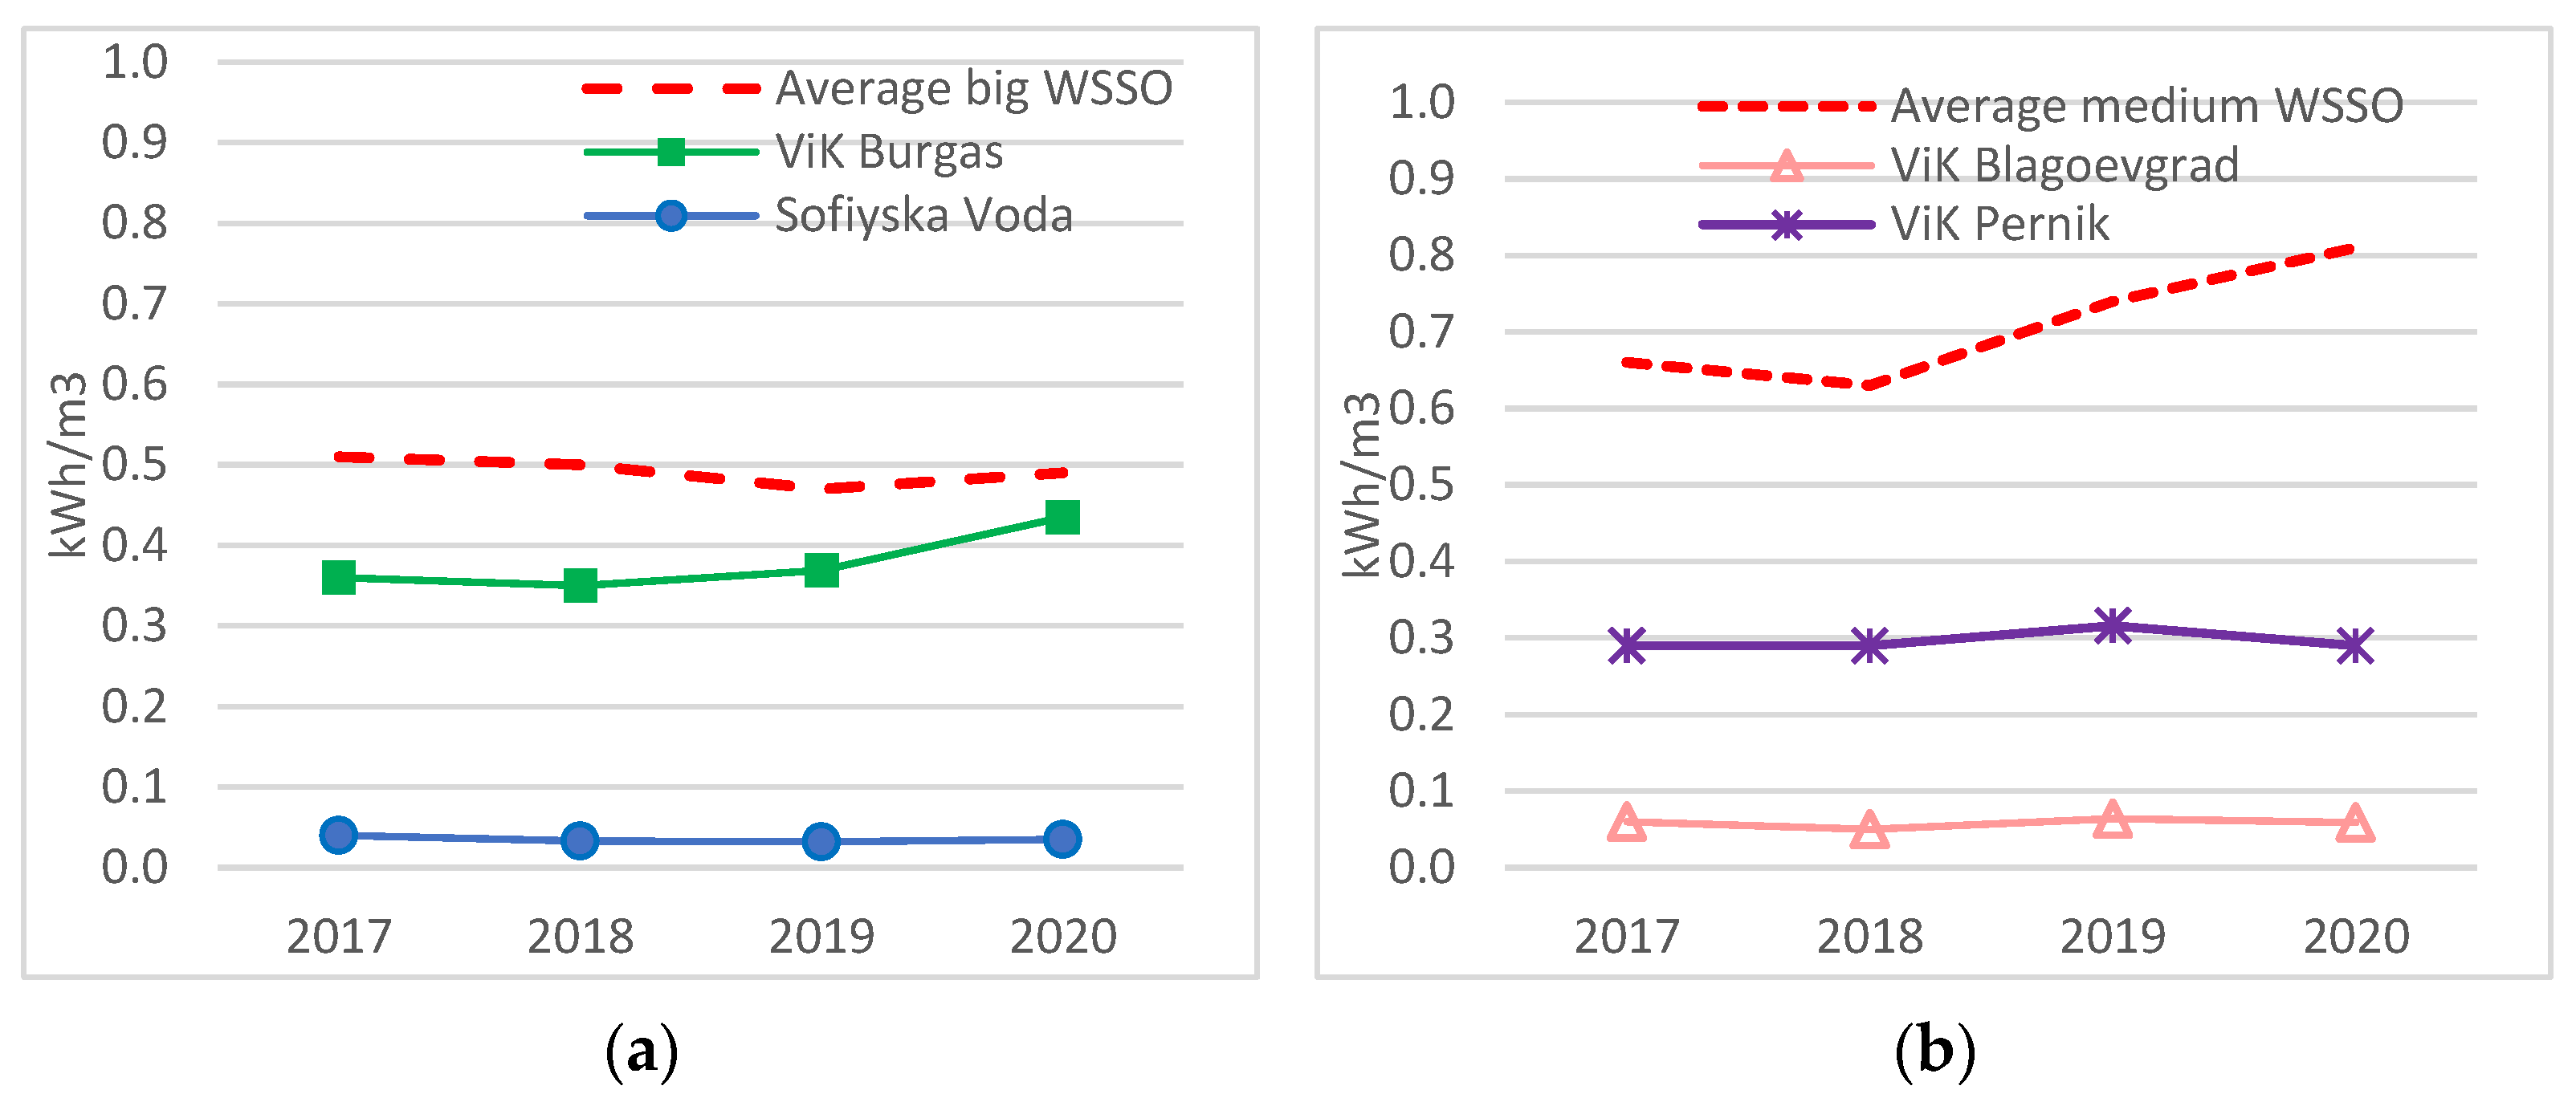
  • Overall energy efficiency of the water supply and sewerage networks
There are two indicators for energy efficiency concerning the water supply and sewer services in Bulgaria: (a) the energy demand for water intake, treatment, and distribution per cubic meter of water at the inlet of the water supply systems, and (b) the energy demand per cubic treated wastewater. Figure 6 and Figure 7 present the results for the investigated WSSOs, as well as the corresponding average values for the group of big and medium WSSOs [17,22,23,24].
The performance of the different operators cannot be compared, since each water supply system is unique, and the energy demand is a result of many factors (e.g., terrain, pumps availability, treatment characteristics, leakages control, and pressure management). It can be noted, however, the great advantage of the gravitational water supply systems (ViK Sofiyska voda, ViK Blagoevrad) compared to those where part of the water is delivered by pumps (ViK Burgas, ViK Pernik). All the WSSOs invest in the modernization of the pump aggregates and the installation of frequency controllers. The performance of the selected WSSOs seems to be quite good compared to the corresponding average values for the groups of medium and big operators.
In ViK Burgas, a tendency of increase in energy demand for water supply can be observed. In discussion with the operating staff, it was clarified that 2018, 2019, and 2020 were droughty years, which significantly affected the available capacity in the main water source—Kamchia Dam, almost reaching the dead volume. This necessitated taking water from lower horizons with higher turbidity, resulting in a more frequent backwash of the filters. Pumping water from local alternative water sources was also necessary. These measures resulted in higher energy demand per cubic drinking water.
The selected WSSOs operate a different number of UWWTPs with different capacity and technological schemes. Obviously, ViK Burgas has the highest demand for energy, but it also operates the highest number of WWTPs with different sizes, most of them with high seasonal variation of load due to tourist activities. There is also no energy yielding sludge digestion. As mentioned above, only UWWTP Kubratovo (Sofiyska Voda) has methane tanks and converts the biogas into electrical energy. The produced energy covers the needs of the treatment plant; since 2014, UWWTP Kubratovo has been energy-independent. In 2019–2020, Sofiyska Voda launched the rehabilitation of one of the existing methane tanks and the construction of a new one. Therefore, the methane production was not optimal in this period and the energy demand per cubic meter of treated wastewater should be regarded as indicative only for the period.

3.2.4. Approaches Related to Circular Economy along the Materials Pathway

This aspect seems to be least considered in the investigated WSSOs. It is limited to approaches for utilization of the stabilized sludge either in agriculture as fertilizer or for recultivation of disturbed terrains. At present, Sofiyska Voda utilizes 100% of the sludge in agriculture. Partial sludge utilization is reached in ViK Burgas (76.44%) and ViK Blagoevgrad (87%), again for agriculture or terrain recultivation [17].The rest of the sludge is usually deposited within the UWWTP’s sites for temporary storage. There is no sludge utilization at ViK Pernik due to problems with sludge quality (i.e., presence of arsenic).

3.2.5. Communication and Cooperation with Other Stakeholders or Research Institutions

The surveyed WSSOs conduct periodic polls among customers in order to improve their service. Sofiyska Voda also includes questions related to water saving by consumers. For example, in the poll for preparation of the business plan for the period 2017–2021, about 63% of the interviewed 800 households in Sofia declared that they take measures for optimizing water utilization [21]. The measures can be summarized as follows: decrease in unnecessary water consumption (74.6%), replacement of old pipes (52.2%), replacement of household water facilities with more water-efficient ones (21.1%), and others (1.2%). Concerning the other investigated WSSOs, the communication with the customers seems to be focused exclusively on the quality of the provided services by the operators.
Sofiyska Voda participates actively in scientific projects. For the investigated period, the operator was a partner in a project INNOVA P-recovery for the extraction of phosphate from UWWTP sludge, financed within the framework of the Bulgarian–Swiss Research Program. On the basis of the data from a 1 year investigation, it was estimated that about 170–250 tons of recovered phosphorus per year can be achieved through sludge incineration and subsequent P-recovery technology [30]. Sofiyska Voda also collaborates with researchers for the development of methods for increasing the efficiency of biogas production, e.g., through fluorescence in situ hybridization analysis of the structure of the microbial communities in the digesters [31]. Sofiyska Voda is also an associate partner in the Clean and Circle project (https://www.clean-circle.eu/, accessed on 2 May 2022) in the framework of which this study was developed. After presenting the SWOT analysis, the managers of Sofiyska Voda are interested in launching investigations for the reuse of filter backwash water in the DWTPs, as well as application of green roofs to decrease and retardation of stormwater runoff to further increase the efficiency of the biogas yield. Furthermore, the effluent of Sofiyska Voda WWTP Kubratovo was experimentally studied for the possibility of the application of post-treatment with algae-based bioreactors—a circular solution technology that has emerging economic and ecological potential [32,33]. Sludge and wastewater from UWWTPs operated by ViK Burgas were studied concerning P-recovery through the production of struvite [34,35], The cooperation of the remaining selected WSSOs with research institutions needs to be intensified in the future.

3.2.6. Identified Strengths and Weaknesses

According to the collected information, strengths and weaknesses for each of the investigated WSSO were identified.
Strengths
  • The WSSOs have already implemented circular solutions, although they are mostly conventional, targeting efficiency of water use through the decrease in NRW, green energy yield (HPPs, biogas), and/or sludge application in agriculture.
The WSSOs apply a set of qualitative and quantifiable indicators (NRW rate, pressure management rate, energy efficiency rate, and sludge utilization rate) which are closely related to the circular economy concept of increasing the product’s value.
  • SCADA systems have been implemented and are continuously developed especially for the water supply networks, DWTPs, and WWTPs, thus contributing to the digitalization of the management and operation of the facilities, allowing efficient online control of the processes and detailed database establishment.
  • Sufficient data are available and organized in appropriate registers and databases allowing sound evaluation of systems’ performance and drawbacks. The establishment of a GIS register is in progress for most of the WSSOs, which may significantly facilitate the efficiency of water utilization.
  • The water supply networks are well developed, covering almost 100% of the population. The sewer systems cover the bigger settlements, although the rate of the connection is lower than the water supply ones. This means that the WSSOs have good management and operational experience, which may facilitate the transition to a circular economy.
  • Most of the WSSOs are already beneficiaries of regional projects for modernization of the water supply and sewerage infrastructure (including implementation of circular solutions) co-financed by the EU Cohesion Fund.
Weaknesses
  • A majority of the water supply and sewerage infrastructure is 50–80 years old and predetermines frequent failures, significant real water losses, and high rates of infiltration/exfiltration in sewer networks. Most of the DWTPs and the older UWWTPs also need modernization. The maintenance/modernization of the existing infrastructure and the implementation of circular solutions demand higher capital costs, which cannot be covered by the budget of the WSSOs alone.
  • The NRW and the pressure management of the water supply systems is not satisfactory for most of the WSSOs, thus delaying the decrease in real water losses and the increase in efficiency of water use. The increase in efficiency of water use, without investments for appropriate adaptation of the water supply and sewerage infrastructure, may create operational problems for the systems, resulting in increased costs for maintenance.
  • The energy efficiency indicators for water supply and sewerage systems are too general and do not allow a detailed analysis of the energy efficiency performance of the key elements of the water supply and wastewater treatment.
  • The implementation of SCADA systems in the sewer networks is not satisfactory. This prevents having a better estimation of the rates of infiltration/exfiltration and a definition of consequent appropriate measures for improvement.
  • The “old” design of water supply and sewerage systems makes it more difficult to change the architecture of the networks (especially in the zones with a high concentration of population and activities) following circular economy principles.
  • The level of cooperation and exchange of information among the customers and key stakeholders is insufficient. The WSSOs do not actively advertise the benefits of their ready-for-reuse products to the economic sectors that might use them.
  • In general, the level of cooperation with scientific and research institutions is not satisfactory and needs to be strengthened (although some WSSOs already benefit from such cooperation).

3.3. Step 3: Analysis of the Macroenvironment for Applying Circular Economy (Opportunities and Threats)

3.3.1. Legislative Background

The EU legislative framework strongly encourages the implementation of a circular economy in the social and economic development of the countries. The first EU Action Plan (2015) and the second Action Plan (2020) on a circular economy emphasize the need for increasing the value of water as a key component of the circular economy, focusing on (a) increasing the confidence in drinking water quality (and, thus, decreasing the use of plastic mineral water bottles) and (b) water reuse for groundwater recharge, in agriculture and industrial activities [1,2]. The second Action Plan also discusses the need for reviewing the directives on wastewater treatment and sewage sludge and the stimulation of the market for recovered nutrients (e.g., using natural technologies such as algae). The role of the water utilities in the transition to a circular economy is further supported by other documents and regulations, e.g., guidelines for integrating water reuse into planning and management [36] and EU Regulation 2020/741 specifying the minimum requirements for urban wastewater reuse for agricultural irrigation [37]. In addition, Regulation No 547/2012 sets requirements for the eco-design of rotodynamic water pumps which are widely used in water supply systems [38]. It also has to be mentioned that the increasing requirements for the quality of drinking water and wastewater introduced through Directive 2020/2184/EC, Directive 91/271/EEC, and Regulation 2020/741 will also necessitate the implementation of enhanced or emerging treatment technologies for reaching compliance.
Bulgaria, as an EU Member, harmonizes its policy with the relevant EU policies. In 2020, the country adopted “a national strategy and action plan toward the transition to a circular economy”. Some of the analyzed strategic measures are proactive measures for water saving, as well as measures for water reuse for agricultural irrigation and inside the industrial processes [39]. Particular attention is paid to the development of technologies for utilization of the sludge originating from the UWWTPs, e.g., phosphorus extraction, biogas production, and mono- and co-incineration.
As mentioned above, the water supply and sewerage services are legislatively regulated in Bulgaria, and the WSSOs must cover a set of requirements, some of which are in line with the principles of a circular economy, e.g., decreasing the NRW, increasing the energy efficiency of water supply systems, increasing the energy efficiency of wastewater treatment, and appropriate UWWTP sludge utilization [40].

3.3.2. Environmental Factors

According to all climate change scenarios for Bulgaria, the air temperature will increase and precipitation will decrease, especially in the summer, resulting in prolonged droughty periods which will negatively affect the water resources, leading to increased demand for water for irrigation, potable, and industrial needs [41]. Table 2 presents the percentage of the population in the serviced areas which suffered from intermittent water supply due to water shortage, based on data from the National Statistical Institute (www.nsi.bg, accessed on 2 May 2022).
Water shortage was an acute problem for ViK Pernik in 2019–2020 due to the lack of sufficient volumes of water in the main water source—Studena Dam. A hydrological investigation for Studena Dam showed that, in the period 2003–2019, the inflow to the dam was minimal in 2011 and 2019, equal to about 38% of the average annual inflow [42]. No water shortage was registered in 2011. The reasons for the drinking water shortage in 2019 were complex, including bad management of the priority of water distribution and too low natural inflow. The problem was solved with the construction of a new trunk main transporting water from Sofiyska Voda to ViK Pernik. For ViK Burgas and ViK Blagoevgrad, the water shortage seems not to be an acute problem, but there is a tendency of increase in the affected population. The effects of droughty periods in the region of ViK Burgas were also mitigated by using alternative groundwater sources, which resulted in higher energy demand for water intake and treatment (see Section 3.2.3).
Another aspect of climate change is the worsening quality of water resources. At present, there are no indications of water quality problems due to the presence of toxic algae in the water sources in any of the investigated WSSOs. A study on the evaluation of cyanoprokaryote blooms and of cyanotoxins in Bulgaria identified cyanotoxins in three drinking water reservoirs, although the concentration of microcystin LR is lower than the limit of 1 μg/L required by EU Directive 2020/2184 [43]. Scientists report worldwide that increasing temperatures favor the proliferation of toxic cyanobacteria that may seriously deteriorate the source water quality [44,45,46].

3.3.3. Economic Factors

  • Cost of the water supply and sewerage services
In Bulgaria, the prices of water supply and sewerage services are regulated, as the price includes three components: drinking water supply, wastewater conveyance, and wastewater treatment. The total price for these services should not exceed the socially affordable price, set to 2.5% of the average income per household in the serviced region of the WSSOs. Table 3 presents the current total prices in EUR and the corresponding socially affordable prices for the selected WSSOs. The data are based on the decisions of the Regulator for approval of the prices of water supply and sewerage services (www.dker.bg, accessed on 8 March 2022). Apparently, the total cost of water services is quite lower than the socially affordable price. Any increase in the water service costs, however, always has a negative effect on the clients and may also influence the policy decisions.
  • Market for reused water products
An appropriate market for reused products from water utilities seems to be at the initial stage of development in Bulgaria. It is expressed in the utilization of UWWTP sludge as fertilizer for agriculture or for reclamation of terrains. The establishment of good cooperation with farmers is a difficult process, mostly due to complicated regulatory procedures for sludge application on agricultural land and/or inappropriate sludge quality (mostly concerning bacteriological content). The finding of terrains for reclamation also does not seem to be an easy task for the WSSOs.

3.3.4. Social Factors

Analysis of the database of the National Statistical Institute in Bulgaria showed that the population in Bulgaria has a stable trend of decrease since 1989, as the percentage decrease for the period 2010–2020 was about 7.8% (www.nsi.bg, accessed on 2 May 2022). This tendency is also observed for all the investigated WSSOs, except for Sofiyska Voda (Table 4).

3.3.5. Identified Opportunities and Threats

Bulgaria is a small country, and it can be considered that the external factors (with small exceptions) apply equally to all WSSOs.
The identified opportunities and threats based on the above analyses of the legislative, environmental, economic, and social factors are summarized below.
Opportunities
  • The EU policy and national legislation encourage circular economy development. The developed national strategy for a circular economy encourages wastewater reuse and sludge utilization as a source of energy and nutrients.
  • There are eco-efficient products and smart technologies on the EU market that may be installed/implemented for increasing the efficiency of water supply and sewerage systems.
  • The EU Cohesion Fund provides opportunities for co-financing the Bulgarian WSSOs for bringing water supply and sewerage systems in line with the requirements of the relevant EU Directives and for improving the efficiency of water and energy use.
  • More tangible climate changes may require urgent investments for mitigation of water shortage and/or water reuse. Thus, climate changes may act as a booster for implementing circular economy technologies.
  • There is potential for cooperation with research organizations at national and international levels for the development and implementation of innovative technologies.
Threats
  • The nationally regulated long-term values for some indicators concerning the efficiency of water and energy use are common for all the WSSOs, and this may discourage some of them from investing in further improvements after reaching the long-term target. Tailor-made target values would be more suitable.
  • The market of reused products in Bulgaria is at the initial stage of development. The key stakeholders and the public seem not to be aware of the potential of water utilities to be also a producer of valuable ready-to-reuse products.
  • Some of the circular economy approaches may require significant investments that may increase the price of water services and provoke a negative reaction from customers.
  • The stable tendency of decrease in the population in Bulgaria may decrease the users of water services, and this may reflect negatively on the incomes of the WSSOs for recovery of water services.

3.4. Step 4. Verification of the Results by the Water Utilities

The results were presented to the managing and operational staff of the studied water utilities, namely, ViK Blagoevgrad, ViK Burgas, and Sofiyska Voda. The presentation for ViK Pernik is forthcoming. Some conclusions were fine-tuned; however, most importantly, the draft roadmaps for the next strategic steps were outlined.
On the basis of the discussions, several circular economy solutions with the potential for short-term realization and common for the investigated WSSOs were identified. These are mostly solutions that do not necessitate cooperation with stakeholders. For example, the efficiency of water use can be increased in the DWTPs through increasing the efficiency of performance of sand filters and utilization of filter backwash water. The technical and economic efficiency of approaches for temporary retardation of the stormwater runoff (e.g., green roofs, specific pavements, or green solutions) can also be analyzed together with the urban planning administrations in zones with frequent flooding due to insufficient hydraulic capacity of the sewer collectors.

4. Discussion

4.1. In Regard to Identification of Strengths and Weaknesses of the Systems

Among all other strengths, the availability of a good informational system and sufficient data about system condition and performance is considered as a strength in the current study.
A similar conclusion was reached in a SWOT analysis dedicated to the development of urban water infrastructure asset management based on investigations in four WSSOs operating in Portugal [47]. Although at an initial phase, the development of a GIS register is also considered a “strength”, since it gives much more flexibility of operation and may further contribute to the development of a GIS-based approach for more efficient leakage and pressure management, as demonstrated in a recent study in Tehran [48].
Another “strength” worth discussing is the good experience and qualification of the staff demonstrated during the discussions of the results of the study. This experience is predetermined by the long history of the water supply and sewer services in Bulgaria, the strict regulatory requirements toward each WSSO to reach specific criteria concerning the quality of the service, and the existence of higher educational institutions in the field of water infrastructure. The positive effect of the competence of the operating staff was also noted in other studies used the SWOT analysis approach for strategic planning in the water field [14,47].
Despite the indicated progress, the NRW is apparently a serious problem not only for the investigated WSSOs, but also for the Bulgarian WSSOs as a whole (Figure 4). The long-term target value of 49% set by the Regulator is also high compared to other international studies. A recent report of EurEau shows that the NRW rate ranges from 5% to 60% (average 25%) according to a survey among 29 European countries, with Bulgaria having the highest percentage (about 60%) [26]. A World Bank report gave a range of NRW rates between 35% (for developing countries) and 15% for (developed countries), with real losses forming 60% to 80% of the NRW accordingly [49]. It should be noted that the NRW is an imperfect criterion, since many specific characteristics of the networks are not taken into account [25]. In the near future, pursuant to the requirements of the new EU drinking water Directive 2020/2184, a specific criterion for real water losses—the so-called Infrastructure Leakage Index (ILI)—will be more broadly applied [25]. It has to also be noted that, from the technical point of view, the substantial decrease in water leakage may have a negative effect on the water velocity, creating problems with water quality in the water supply networks. This in turn may require additional investments for adaptation of the water supply networks or increased costs for maintenance (e.g., for maintaining good water quality).
Due to the scale of the investigation (e.g., each WSSO covers large geographic areas operating a significant number of water supply and sewerage systems) and the relatively long time period (2017–2020), a direct relationship among the NRW, pressure management, and energy efficiency cannot be demonstrated for the investigated case studies, since other factors also influence the NRW (e.g., active leakage control and pipe replacement).
Pressure management control, however, is considered to be the most efficient tool for the reduction in real water losses [50]. The positive effect of the pressure management on the decrease in real water losses was demonstrated in many studies [25,50,51,52,53]. In general, except for Sofiyska Voda, it can be concluded that the majority of the Bulgarian WSSOs are too distant from the long-term target of 100% pressure management, as set by the Regulator (Figure 5). Thus, the lack of adequate pressure management was classified as a weakness in the developed SWOT analysis.
The control of NRW and pressure management affect the energy efficiency of the water supply networks and, thus, have a direct influence concerning the energy pathway in the circular economy concept. Studies by Feldman and Perrone et al. pointed out that the percentage energy saving is directly related to the percentage decrease in real water losses [50,54]. Other studies also reported the positive effect of leakage reduction and pressure management on energy efficiency, although the given values are very case-specific [52,53]. The adopted indicator in Bulgaria for energy efficiency of water supply networks is too general, as it does not allow differentiation between gravitational and pumping supply, nor between energy consumption for water distribution and water treatment.
A similar conclusion can be reached concerning the energy efficiency of the wastewater systems. The related indicator expressed in kWh/m3 treated wastewater does not account for, e.g., approaches for energy yield through anaerobic sludge digestion. Thus, WSSOs that have open anaerobic sludge digestion (e.g., ViK Blagoevgrad and ViK Pernik) may have comparable or even lower energy consumption than WSSOs that operate methane tanks and yield energy that can completely satisfy the treatment needs (e.g., Sofiyska Voda). Therefore, the currently applied approach for evaluation of energy efficiency of the water supply and sewerage systems in Bulgaria is considered imperfect and, therefore, was categorized as a “weakness”. It has to be noted, however, that biogas yield through sludge digestion is an option subject to technical and cost–benefit analyses for each individual case. For instance, in Flanders, it was reported that, unless a significant amount of organic matter is available, the energy yield is sufficient only for heating of the methane tanks [11]. Additional organic matter (e.g., food waste) is necessary to increase the yield, and there are some legal constraints for utilizing the produced gas in the gas network. The Dutch case is just the opposite; the biogas cheapens the wastewater treatment when injected into the gas grid and is regarded as a business option worth considering [11].
The old water supply and sewerage infrastructure seem to be key problems, predetermining nonefficient energy and water utilization. In addition to the apparent negative effect on the efficiency performance Mbavarira and Grimm concluded that aging infrastructure is a significant financial burden to the WSSOs, demanding costly maintenance over time and, thus, hindering the implementation of innovative solutions [11]. On the other hand, this weakness might also be seen as a strength, because the upgrade of the infrastructure can be achieved considering the principles of a circular economy.
The analyses showed that the applied circular economic approaches are completely within the capacity of the WSSOs, i.e., they do not necessitate cooperation with other stakeholders. The exception is the WWTP sludge utilization as a fertilizer for agricultural needs, but the investigated WSSOs shared that it is difficult to convince farmers, since the administrative procedure is complex. In general, in Bulgaria, about 45% of the sludge is utilized in agriculture, which is comparable with the average level for the EU countries [26]. Imperfect legislation and public acceptance are considered the main barriers concerning sewage sludge reuse [11,12]. Thus, at present, in Switzerland and the Netherlands, all the sludge is incinerated, while, in Portugal, over 95% of the sludge is used in agriculture; in Estonia, Lithuania, and Norway, this share is also high at about 80% [26]. Focusing on the purpose of this study, however, the authors considered that, in Bulgaria, the lack of incentives for sludge utilization as a fertilizer or for other purposes (e.g., nutrient extraction) is mainly due to the lack of effective communication with appropriate stakeholders and the need for further investments, which without an appropriate market are not justifiable.

4.2. In Regard to Identification of Opportunities and Threats

Some of the external factors may have variable effects or be in complex interactions, as discussed below.
The influence of legislation on reaching specific targets in the water sector was acknowledged in many studies. Depending on the specific case, the legislation could have either a facilitating or hindering role [11,14]. Thus, for instance, the existing legislation seems to hinder the broader application of recycled nutrients from sludge and/or reclaimed wastewater in Belgium and Denmark, while, in Greece, the HYDROUSA project considers the legislation as “an enabler of circular practices” for bankable decentralized solutions [11]. In Bulgaria, the “circular” legislation is following the relevant EU legislation; hence, it creates a positive horizontal regulatory environment. In the authors’ opinion, however, the application of unified long-term target values concerning different aspects of the efficiency of the performance of water services may be discouraging for some WSSOs. Imposing a tailor-made target may provide better motivation for increasing the value of water, energy, and materials in specific water supply and/or sewerage systems.
On the other hand, the increasing requirements concerning environment and human health protection are reflected in higher standards for water and wastewater treatment, and following the precautionary principle may lead to higher requirements concerning the quality of reclaimed or recycled products. This necessitates the development of clean and green technologies which may predetermine higher investments.
Most of the Bulgarian WSSOs benefit from EU funds (e.g., the Cohesion Fund) for the renovation of the water supply and sewer infrastructure and increasing the efficiency of their performance. Since 2007, there have been three Operational Environment Programs which provided opportunities for co-financing of investment measures into this field. According to the recent report of the EurEU, the investment rate in Bulgaria in both water and wastewater infrastructure (at a 5 year average rate) is 73 EUR per inhabitant per annum, which is comparable with the average investment rate of 81.5 EUR per inhabitant per annum in a study of 28 European countries [26]. Bulgaria has the highest renewal rate for drinking water infrastructure: 3% compared to only 0.96% at the EU level [26].

5. Conclusions

A four-step approach using SWOT analysis as a main tool is suggested as an initial step in the strategic planning of the transition of the urban water systems toward circular economy. The approach was successfully applied for four big and medium water operators in Bulgaria, which cover about 30% of the population in Bulgaria. The presented average rates of key indicators for each of these groups show that the conclusions for the selected WSSOs are also applicable to the rest of the WSSOs in Bulgaria.
The presented approach and analyses may facilitate the strategic planning for other water utilities in countries with similar social and economic environment or be used as a reference.
The case-study-specific conclusions are that the investigated WSSOs are at the initial stage of implementation of a circular economy, relying mostly on solutions within their own competence and capacity, and following the requirements of the national regulatory framework for reaching certain criteria for efficiency of water and energy utilization.
The adoption of quantifiable indicators for assessing system performance, the progress in system digitalization, and the availability of operational databases in combination with the qualified staff are all strengths that will facilitate the further implementation of a circular economy. The favorable national and EU legislation, the availability of EU funds, and the speeding up cooperation with scientific organizations create good opportunities for WSSOs in realizing circular measures. The more tangible climate changes may speed up the implementation of circular solutions.
These positive outcomes, however, need to be balanced in a smart way with the outlined deficiencies resulting from the very old water supply and sewerage infrastructure that need significant investments for rehabilitation and modernization of its operation. The establishment of efficient communication of the WSSOs with other stakeholders and with the public sector for increasing the awareness about the benefits of circular economy and the active participation in the development of a sustainable market for “circular” products must be a prime task of the WSSOs in near future.

Author Contributions

Conceptualization, G.D. and I.R.; methodology, G.D.; formal analysis, G.D., I.K., S.D., E.T., S.L., R.T., D.V. and D.S.; investigation, G.D., I.K., S.D., E.T., S.L., R.T., D.V. and D.S.; resources, G.D.; writing—original draft preparation, G.D.; writing—review and editing, G.D., I.R., S.D., I.K., D.V. and E.T.; visualization, R.T.; supervision, I.R., S.D. and I.K.; project administration, I.R., G.D. and I.K.; funding acquisition, I.R. All authors have read and agreed to the published version of the manuscript.

Funding

This research was funded by Project BG05M2OP001-1.002-0019: “Clean technologies for sustainable environment—water, waste, and energy for circular economy”, financed by the Operational Program “Science and Education for Smart Growth” 2014–2020, co-financed by the European Union through the European structural and investment funds. Part of the article processing charges was covered by the University of Architecture, Civil Engineering, and Geodesy.

Data Availability Statement

The main sources of data presented herewith are the Business Plans of the selected WSSOs for the period 2017–2020 and the annual comparative analyses of the Water and Energy Regulatory Commissions, which are publicly available. Data provided by the operational staff of the studied WSSOs or from other sources are specifically mentioned in the text.

Acknowledgments

The authors would like to thank the management and operational staff of Sofiyska Voda, ViK Burgas, ViK Blagoevgrad, and ViK Pernik for the valuable support during the preparation of this study, as well as the University of Architecture, Civil Engineering, and Geodesy for covering part of the article processing charges. The authors also specially thank A. Paskalev for the expert advice.

Conflicts of Interest

The authors declare no conflict of interest. The funders had no role in the design of the study; in the collection, analyses, or interpretation of data; in the writing of the manuscript, or in the decision to publish the results.

References

  1. European Commission. Closing the Loop—An EU Action Plan for the Circular Economy. Communication from the Commission to the European Parliament, the Council, the European Economic and Social Committee and the Committee of the Regions. COM 614 Final. 2015. Available online: https://eur-lex.europa.eu/resource.html?uri=cellar:8a8ef5e8-99a0-11e5-b3b7-01aa75ed71a1.0012.02/DOC_1&format=PDF (accessed on 20 October 2016).
  2. European Commission. A New Circular Economy Action Plan for a Cleaner and More Competitive Europe. Communication from the Commission to the European Parliament, the Council, the European Economic and Social Committee and the Committee of the Regions. COM 98 Final. 2020. Available online: https://eur-lex.europa.eu/resource.html?uri=cellar:9903b325-6388-11ea-b735-01aa75ed71a1.0017.02/DOC_1&format=PDF (accessed on 15 September 2020).
  3. European Commission. The European Green Deal. Communication from the Commission to the European Parliament, the Council, the European Economic and Social Committee and the Committee of the Regions. COM 640 Final. 2020. Available online: https://eur-lex.europa.eu/legal-content/EN/TXT/?uri=COM:2020:98:FIN&WT.mc_id=Twitter (accessed on 1 April 2022).
  4. European Commission. On a Monitoring Framework for the Circular Economy. Communication from the Commission to the European Parliament, the Council, the European Economic and Social Committee and the Committee of the Regions. COM 29 Final. 2018. Available online: https://eur-lex.europa.eu/legal-content/EN/TXT/PDF/?uri=CELEX:52018DC0029&from=EN (accessed on 1 April 2022).
  5. Eurostat Statistics Explained. Circular Economy—Material Flows. 2021. Available online: https://ec.europa.eu/eurostat/statistics-explained/index.php?title=Circular_economy_-material_flows#Circularity_rate (accessed on 1 April 2022).
  6. Circle Economy. The Circularity Gap Report 2020: When Circularity Goes from Bad to Worse. The Power of Countries to Change the Game. 2020. p. 13. Available online: https://www.circle-economy.com/resources/circularity-gap-report-2020 (accessed on 20 November 2021).
  7. Veolia. Water at the Heart of the Circular Economy. 2014. Available online: https://www.veolia.com/sites/g/files/dvc4206/files/document/2014/12/economy-circular-water.pdf (accessed on 27 May 2022).
  8. Water and Circular Economy: A Whitepaper. 2018. Available online: https://www.acrplus.org/en/epr/water-and-circular-economy-white-paper (accessed on 27 May 2022).
  9. International Water Association. Water Utility Pathways in a Circular Economy. 2016. Available online: https://iwa-network.org/water-utility-pathways-circular-economy-charting-course-sustainability (accessed on 10 July 2018).
  10. Israeli Water System. R2Pi—The Route to Circular Economy. A Circular Economy Business Model Case. 2019. Available online: https://minerva.usc.es/xmlui/bitstream/handle/10347/20417/R2Pi_Case%20Study%20Report_Israel%20Water_FINAL%20%282%29.pdf?sequence=1&isAllowed=n (accessed on 20 April 2022).
  11. Mbavarira, T.M.; Grimm, C. A Systemic View on Circular Economy in the Water Industry: Learnings from a Belgian and Dutch Case. Sustainability 2021, 13, 3313. [Google Scholar] [CrossRef]
  12. Mannina, G.; Badalucco, L.; Barbara, L.; Cosenza, A.; Di Trapani, D.; Gallo, G.; Laudicina, V.A.; Marino, G.; Muscarella, S.M.; Presti, D.; et al. Enhancing a Transition to a Circular Economy in the Water Sector: The EU Project WIDER UPTAKE. Water 2021, 13, 946. [Google Scholar] [CrossRef]
  13. Mainali, B.; Ngo, H.H.; Guo, W.S.; Pham, T.T.N.; Wang, X.C.; Johnston, A. SWOT analysis to assist identification of the critical factors for the successful implementation of water reuse schemes. Desalin. Water Treat. 2011, 32, 297–306. [Google Scholar] [CrossRef]
  14. Srdjevic, Z.; Bajcetic, R.; Srdjevic, B. Identifying the Criteria Set for Multicriteria Decision Making Based on SWOT/PESTLE Analysis: A Case Study of Reconstructing a Water Intake Structure. Water Resour. Manag. 2012, 26, 3379–3393. [Google Scholar] [CrossRef]
  15. Gao, X.; Chen, L.; Sun, B.; Liu, Y. Employing SWOT Analysis and Normal Cloud Model for Water Resource Sustainable Utilization Assessment and Strategy Development. Sustainability 2017, 9, 1439. [Google Scholar] [CrossRef] [Green Version]
  16. Nagara, G.; Lam, W.-H.; Lee, N.C.H.; Othman, F.; Shaaban, G. Comparative SWOT Analysis for Water Solutions in Asia and Africa. Water Resour. Manag. 2015, 29, 125–138. [Google Scholar] [CrossRef] [Green Version]
  17. Energy and Water Regulatory Comission of Bulgaria. Annual Report and Comparative Analysis of the Condition of the Water Supply and Sewarage Sector in the Republic of Bulgaria for 2020. 2021. Available online: https://www.dker.bg/uploads/documents/vik/prot_215_21.pdf (accessed on 10 November 2021).
  18. Business Plan for the Development of “Vodosnabdyavane I Kanalizacia” EOOD Blagoevgrad for the Period 2017–2021. Available online: http://vikblg.com/wp-content/uploads/2019/01/bp-2017-2021za-KEVR_final_petrich_2020.pdf (accessed on 9 March 2020).
  19. Business Plan for the Development of “Vodosnabdyavane I Kanalizacia” EAD Burgas for the Period 2017–2021. Available online: https://vik-burgas.com/page/83-Biznes-plan-2017 (accessed on 9 March 2020).
  20. Business Plan for the Development of “Vodosnabdyavane I Kanalizacia” OOD Pernik for the Period 2017–2021. Available online: https://www.vik-pernik.eu/documents/biznesplan2017vikPk.pdf (accessed on 9 March 2020).
  21. Business Plan for the Devlopment of “Sofiyska Voda” AD for the Period 2017–2021. Available online: https://www.sofiyskavoda.bg/dokumenti/biznes-plan (accessed on 9 March 2020).
  22. Energy and Water Regulatory Comission of Bulgaria. Annual Report and Comparative Analysis of the Condition of the Water Supply and Sewarage Sector in the Republic of Bulgaria for 2017. 2018. Available online: https://www.dker.bg/uploads/documents/vik/sravnitelen-analiz-vik-2017.pdf/ (accessed on 10 November 2021).
  23. Energy and Water Regulatory Comission of Bulgaria. Annual Report and Comparative Analysis of the Condition of the Water Supply and Sewarage Sector in the Republic of Bulgaria for 2018. 2019. Available online: https://www.dker.bg/uploads/documents/vik/sravnitelen-analiz-vik-2018.pdf (accessed on 10 November 2021).
  24. Energy and Water Regulatory Comission of Bulgaria. Annual Report and Comparative Analysis of the Condition of the Water Supply and Sewarage Sector in the Republic of Bulgaria for 2019. 2020. Available online: https://www.dker.bg/uploads/documents/vik/prot_257_20.pdf (accessed on 10 November 2021).
  25. Liemberger, R.; Farley, M. Developing a Nonrevenue Water Reduction Strategy Part 1: Investigating and Assessing Waterlosses. Available online: https://www.researchgate.net/publication/228707498_Developing_a_Non-Revenue_Water_Reduction_Strategy_Part_1_Investigating_and_Assessing_Water_Losses (accessed on 20 April 2022).
  26. The European Federation of National Water Associations; EurEau. Europe’s Water in Figures. An Overview of the European Drinking Water and Waste Water Sectors. 2021; pp. 20–33. Available online: https://www.eureau.org/resources/publications/eureau-publications/5824-europe-s-water-in-figures-2021/file (accessed on 10 April 2022).
  27. Kalinkov, P.; Vladov, G.; Radovanov, V. Studies and procedures of water loss reduction in the water supply system of the town of Vidin. Water Util. J. 2011, 1, 11. [Google Scholar]
  28. WWF—Rivers of Bulgaria. Public Register of Installations for Production of Electricity from Renewable Energy Sources (RES). 2021. Available online: https://www.veiregistar.bg (accessed on 10 November 2021).
  29. WWF—Rivers of Bulgaria. List of Water Power Stations in Operation in Bulgaria. 2021. Available online: https://dams.reki.bg/Dams/List (accessed on 10 November 2021).
  30. Ribarova, I.; Dimitrova, S.; Lambeva, R.; Wintgens, T.; Stemann, J.; Remmen, K. Phosphorus recovery potential in Sofia WWTP in view of the national sludge management strategy. Resour. Conserv. Recycl. 2017, 116, 152–159. [Google Scholar] [CrossRef]
  31. Dinova, N.; Belouhova, M.; Schneider, I.; Rangelov, Z.; Topalova, Y. FISH analysis of microbial communities in a full-scale technology for biogas production. Eng. Life Sci. 2018, 18, 914–923. [Google Scholar] [CrossRef] [Green Version]
  32. Valchev, D.; Ribarova, I.; Uzunov, B.; Stoyneva-Gärtner, M. Photo-sequencing batch reactor with Klebsormidium nitens: A promising microalgal biotechnology for sustainable phosphorus management in wastewater treatment plants. Water Sci. Technol. 2021, 83, 2463–2476. [Google Scholar] [CrossRef]
  33. Valchev, D.; Ribarova, I. A Review on the Reliability and the Readiness Level of Microalgae-Based Nutrient Recovery Technologies for Secondary Treated Effluent in Municipal Wastewater Treatment Plants. Processes 2022, 10, 399. [Google Scholar] [CrossRef]
  34. Peeva, G.; Koleva, R.; Stancheva, M.; Yemendzhiev, H.; Nenov, V. Phosphorus Recovery from Waste as Struvite. Ecol. Eng. Environ. Prot. 2020, 2, 34–44. Available online: http://ecoleng.org/archive/2020/2/34-44.pdf (accessed on 5 April 2022). [CrossRef]
  35. Peeva, G.; Yemendzhiev, H.; Nenov, V. Precipitation of struvite from digested sewage sludge by sea water brine and natural flocculants. J. Chem. Technol. Metall. 2022, 57, 310–318. [Google Scholar]
  36. European Environmental Agency. Guidelines on Integrating Water Reuse into Water Planning and Management in the Context of the WFD. 2016. Available online: https://www.eea.europa.eu/policy-documents/guidelines-on-integrating-water-reuse (accessed on 15 December 2021).
  37. European Commission. Regulation (EU) 2020/741 of the European Parliament and of the Council of 25 May 2020 on Minimum Requirements for Water Reuse. Off. J. Eur. Union 2020, 177, 32–55. Available online: https://eur-lex.europa.eu/legal-content/EN/TXT/?uri=CELEX%3A32020R0741 (accessed on 15 December 2021).
  38. European Commission. Commision Regulation (EU) No 547/2012 of 25 June 2012 Implementing Directive 2009/125/EC of the European Parliament and of the Council with Regard to Ecodesign Requirements for Water Pumps. Off. J. Eur. Union 2020, 165, 28. Available online: https://eur-lex.europa.eu/legal-content/EN/TXT/?uri=CELEX%3A32012R0547 (accessed on 15 December 2021).
  39. Strategy and Action Plan for Transition to the Circular Economy of the Republic of Bulgaria for the Period 2021–2027. Available online: https://www.moew.government.bg/bg/strategiya-i-plan-za-dejstvie-za-prehod-kum-krugova-ikonomika-na-republika-bulgariya-za-perioda-2021-2027-g-10910/ (accessed on 15 December 2021).
  40. Ordinance for regulation of the quality of water supply and sewerage services. Adopted by CMD № 8 of 18.01.2016. Bulg. State Gaz. 2016, 6. Available online: https://www.lex.bg/bg/laws/ldoc/2136727660 (accessed on 8 June 2022).
  41. Ministry of Environment and Water Bulgaria. National Climate Change Adaptation Strategy and Action Plan Advisory Services on a National Climate Change Adaptation Strategy and Action Plan. Water Sector Assessment. 2019. Available online: https://www.moew.government.bg/en/climate/international-negotiations-and-adaptation/adaptation/ (accessed on 26 April 2022).
  42. National Institute on Meteorology and Hydrology. Assessment of the Security of Water Supply of the Town of Pernik and Rules for Management of Studena Dam. 2020. Available online: https://www.moew.government.bg/ (accessed on 26 April 2022).
  43. Stoyneva-Gärtner, M.P.; Descy, J.-P.; Latli, A.; Uzunov, B.A.; Pavlova, V.T.; Bratanova, Z.; Babica, P.; Maršálek, B.; Meriluoto, J.; Spoof, L. Assessment of cyanoprokaryote blooms and of cyanotoxins in Bulgaria in a 15-years period (2000–2015). Adv. Oceanogr. Limnol. 2017, 8, 131–152. [Google Scholar] [CrossRef] [Green Version]
  44. Jöhnk, K.D.; Huisman, J.; Sharples, J.; Sommeijer, B.; Visser, P.M.; Stroom, J.M. Summer heatwaves promote blooms of harmful Cyanobacteria. Glob. Chang. Biol. 2008, 14, 495–512. [Google Scholar] [CrossRef] [Green Version]
  45. Whitehead, P.G.; Wilby, R.L.; Battarbee, R.W.; Kernan, M.; Wade, A.J. A review of the potential impacts of climate change on surface water quality. Hydrol. Sci. J. 2009, 54, 101–123. [Google Scholar] [CrossRef]
  46. Paerl, H.W.; Paul, V.J. Climate change: Links to global expansion of harmful cyanobacteria. Water Res. 2012, 46, 1349–1363. [Google Scholar] [CrossRef]
  47. Cardoso, M.A.; Silva, M.S.; Coelho, S.T.; Almeida, M.C.; Covas, D.I. Urban water infrastructure asset management—A structured approach in four water utilities. Water Sci. Technol. 2012, 66, 2702–2711. [Google Scholar] [CrossRef] [PubMed]
  48. Mirshafiei, P.; Sadeghi-Niaraki, A.; Shakeri, M.; Choi, S.-M. Geospatial Information System-Based Modeling Approach for Leakage Management in Urban Water Distribution Networks. Water 2019, 11, 1736. [Google Scholar] [CrossRef] [Green Version]
  49. Kingdom, B.; Liemberger, R.; Marin, P. The Challenge of Reducing Non-Revenue Water (NRW) in Developing Countries. How the Private Sector Can Help: A Look at Performance-Based Service Contracting. Water Supply and Sanitation Sector Board Discussion Paper Series, Paper No 8, December 2006, p. 3. Available online: https://ppiaf.org/documents/2076/download (accessed on 10 April 2022).
  50. Feldman, M. Aspects of Energy Efficiency in Water Supply systems. Available online: https://www.miya-water.com/fotos/artigos/01_aspects_of_energy_efficiency_in_water_supply_systems_29087895a3270d5aa1bd_3921316675f181f7967c82.pdf (accessed on 21 April 2022).
  51. Nazif, S.; Karamouz, M.; Tabesh, M.; Moridi, A. Pressure Management Model for Urban Water Distribution Networks. Water Resour. Manag. 2010, 24, 437–458. [Google Scholar] [CrossRef]
  52. Ociepa, E.; Mrowiec, M.; Deska, I. Analysis of Water Losses and Assessment of Initiatives Aimed at their Reduction in Selected Water Supply Systems. Water 2019, 11, 1037. [Google Scholar] [CrossRef] [Green Version]
  53. Kofinas, D.; Ulanczyk, R.; Laspidou, C.S. Simulation of a Water Distribution Network with Key Performance Indicators for Spatio-Temporal Analysis and Operation of Highly Stressed Water Infrastructure. Water 2020, 12, 1149. [Google Scholar] [CrossRef] [Green Version]
  54. Perrone, D.; Murphy, J.; Hornberger, G.M. Gaining Perspective on theWater-Energy Nexus at the Community Scale. Environ. Sci. Technol. 2011, 45, 4228–4234. [Google Scholar] [CrossRef]
Figure 1. Methodology of the study.
Processes 10 01156 g001
Figure 2. Location of the selected WSSOs in Bulgaria.
Processes 10 01156 g002
Figure 3. Number of failures along the water supply networks: (a) Sofiyska Voda and ViK Burgas; (b) ViK Blagoevgrad and ViK Pernik.
Processes 10 01156 g003
Figure 4. Trends in NRW for (a) ViK Blagoevgrad and ViK Pernik, and (b) Sofiyska Voda and ViK Burgas.
Processes 10 01156 g004
Figure 5. Trends in the rate of implementation of pressure management for (a) Sofiyska Voda and ViK Burgas, and (b) ViK Blagoevgrad and ViK Pernik.
Processes 10 01156 g005
Figure 6. Energy demand in kWh per m3 for water intake, treatment, and distribution: (a) Sofiyska Voda and ViK Burgas; (b) ViK Blagoevgrad and ViK Pernik.
Processes 10 01156 g006
Figure 7. Energy demand in kWh per m3 treated wastewater: (a) Sofiyska Voda and ViK Burgas; (b) ViK Blagoevgrad and ViK Pernik.
Processes 10 01156 g007
Table 1. Main characteristics of the selected WSSOs (WSN—water supply network, SN—sewer network).
ParameterViK BurgasSofiyska VodaViK BlagoevgradViK Pernik
Number of serviced settlements (towns), n249 (20)38 (4)147 (10)117 (6)
Serviced population, n415,0001,319,804277,240125,000
Urban population, %7695.56078
Connection to WSN, %99.91009998
Major water sourcesKamchia Dam, Yasna Polyana DamIskar Dam,
Beli Iskar Dam
River intakes, springsStudena Dam, Krasava Dam, Baniste Dam
Existing DWTPs, n2443
WSN predominant typeGravitational and pumpingGravitationalGravitationalGravitational and pumping
Connection to SN, %76968573
Existing UWWTPs, n181171
Connection to UWWTPs, %64915268
SN predominant type (combined, separate mixed); pumping or gravitationalCombined, gravitational and pumpingCombined gravitational and pumping,Combined, gravitational and pumpingCombined, gravitational
WSSO ownership100% state77.1% private
22.9% municipal
100% state51% state
49% municipal
Table 2. Percent of population (%) with water supply regime due to water shortage.
Operator2017201820192020
ViK Burgas000.282.39
Sofiyska Voda0000
ViK Blagoevgrad00.473.773.91
ViK Pernik0084.4583.34
Average for Bulgaria2.991.075.953.92
Table 3. Total cost of water services (in EUR) and the socially affordable price for the selected WSSOs as per 2020.
ViK BurgasViK BlagoevgradViK PernikSofiyska Voda
Complex price1.581.201.241.41
Socially affordable price2.242.062.364.27
Table 4. Trends in population in the investigated WSSOs for the period 2010–2020.
ViK BurgasViK BlagoevgradViK PernikSofiyska Voda
2.7% decrease7.6% decrease10.6% decrease3.9% increase
Publisher’s Note: MDPI stays neutral with regard to jurisdictional claims in published maps and institutional affiliations.

