Review

Process Analytical Technology for the Production of Parenteral Lipid Emulsions According to Good Manufacturing Practices

by
Carsten Grumbach
1,2 and
Peter Czermak
1,2,*
1
Institute of Bioprocess Engineering and Pharmaceutical Technology, Technische Hochschule Mittelhessen, University of Applied Sciences, Wiesenstrasse 14, 35390 Giessen, Germany
2
Faculty of Biology and Chemistry, Justus-Liebig-University of Giessen, Heinrich-Buff-Ring 17–19, 35392 Giessen, Germany
*
Author to whom correspondence should be addressed.
Processes 2022, 10(6), 1174; https://doi.org/10.3390/pr10061174
Submission received: 5 May 2022 / Revised: 30 May 2022 / Accepted: 6 June 2022 / Published: 10 June 2022

Abstract

:
The good manufacturing practices (GMP) and process analytical technology (PAT) initiatives of the US Food and Drug Administration, in conjunction with International Council for Harmonisation (ICH) quality guidelines Q8, Q9, and Q10, ensure that manufacturing processes for parenteral formulations meet the requirements of increasingly strict regulations. This involves the selection of suitable process analytics for process integration and aseptic processing. In this article, we discuss the PAT requirements for the GMP-compliant manufacturing of parenteral lipid emulsions, which can be used for clinical nutrition or for the delivery of lipophilic active ingredients. There are risks associated with the manufacturing processes, including the potential for unstable emulsions and the formation of large droplets that can induce embolisms in the patient. Parenteral emulsions are currently monitored offline using a statistical approach. Inline analytics, supplemented by measurements of zeta potential, could minimize the above risks. Laser scanning technology, ultrasound attenuation spectroscopy, and photo-optical sensors combined with image analysis may prove to be useful PAT methods. In the future, these technologies could lead to better process understanding and control, thus improving production efficiency.

1. Introduction

Process analytical technology (PAT) was introduced to the pharmaceutical industry in 1996 by the US Food and Drug Administration (FDA) Office of Pharmaceutical Science. One goal of the PAT initiative was to integrate technological progress into pharmaceutical manufacturing at an earlier stage. The implementation of PAT remains a challenge in many pharmaceutical processes, but PAT is expected to become the norm for many types of products in the future, driven by the need for improved process understanding and control to increase production efficiency [1].
Several key technologies are already available for the inline observation of particle size and distribution in real time during the manufacturing of parenteral lipid emulsions, which can be used for clinical nutrition or for the delivery of lipophilic active ingredients incorporated de novo into the oil phase or added extemporaneously. There are strict particle size requirements for injectable emulsions because this affects drug stability in parenteral nutrition admixtures [2]. However, the manufacturing process generates emulsions with particle distributions characterized by tailing in the large particle size range. Large droplets can trigger embolisms in patients, so the implementation of PAT not only helps to meet regulatory guidelines but also reduces the risk to patients. FDA and equivalent EU guidelines for the aseptic manufacture of sterile products are also becoming more stringent. The most strictly regulated areas include sterile processing and product contamination, given their direct impact on patient safety. This review article sets out a requirements profile for suitable process analytics during the manufacture of parenteral lipid emulsions. We also consider the risks associated with aseptic filling during the manufacture of parenteral drugs in more detail.

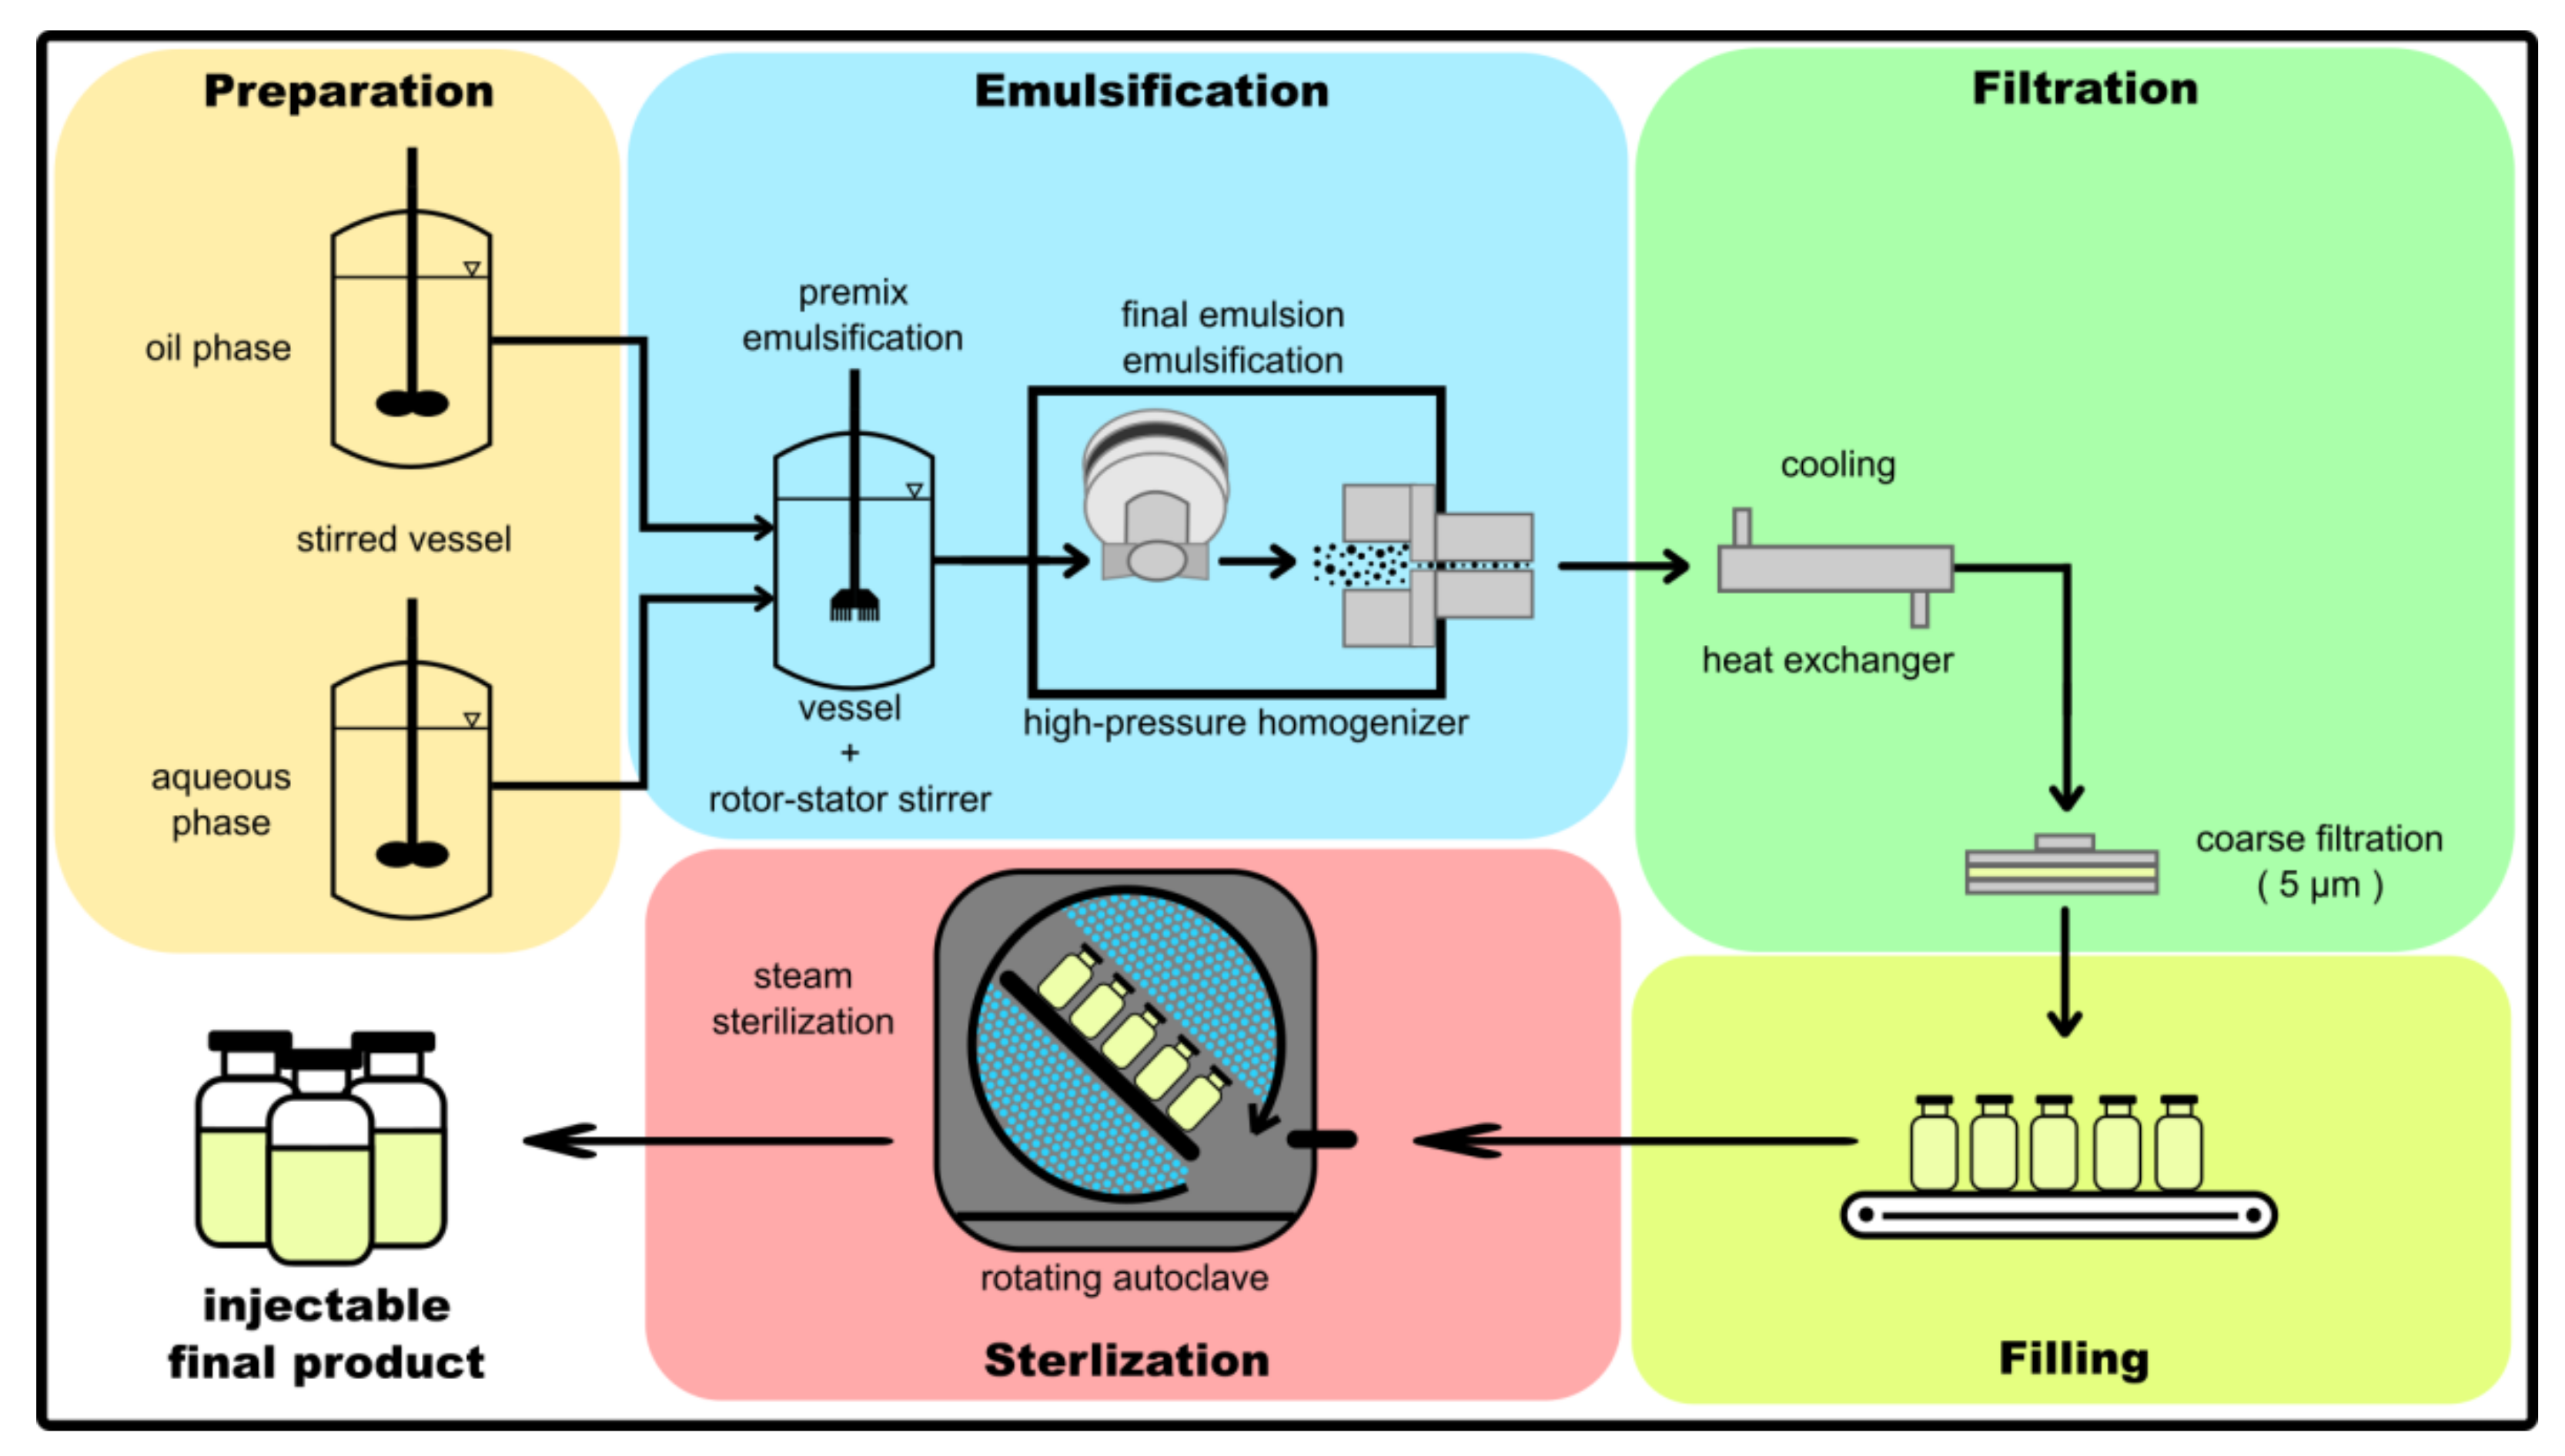
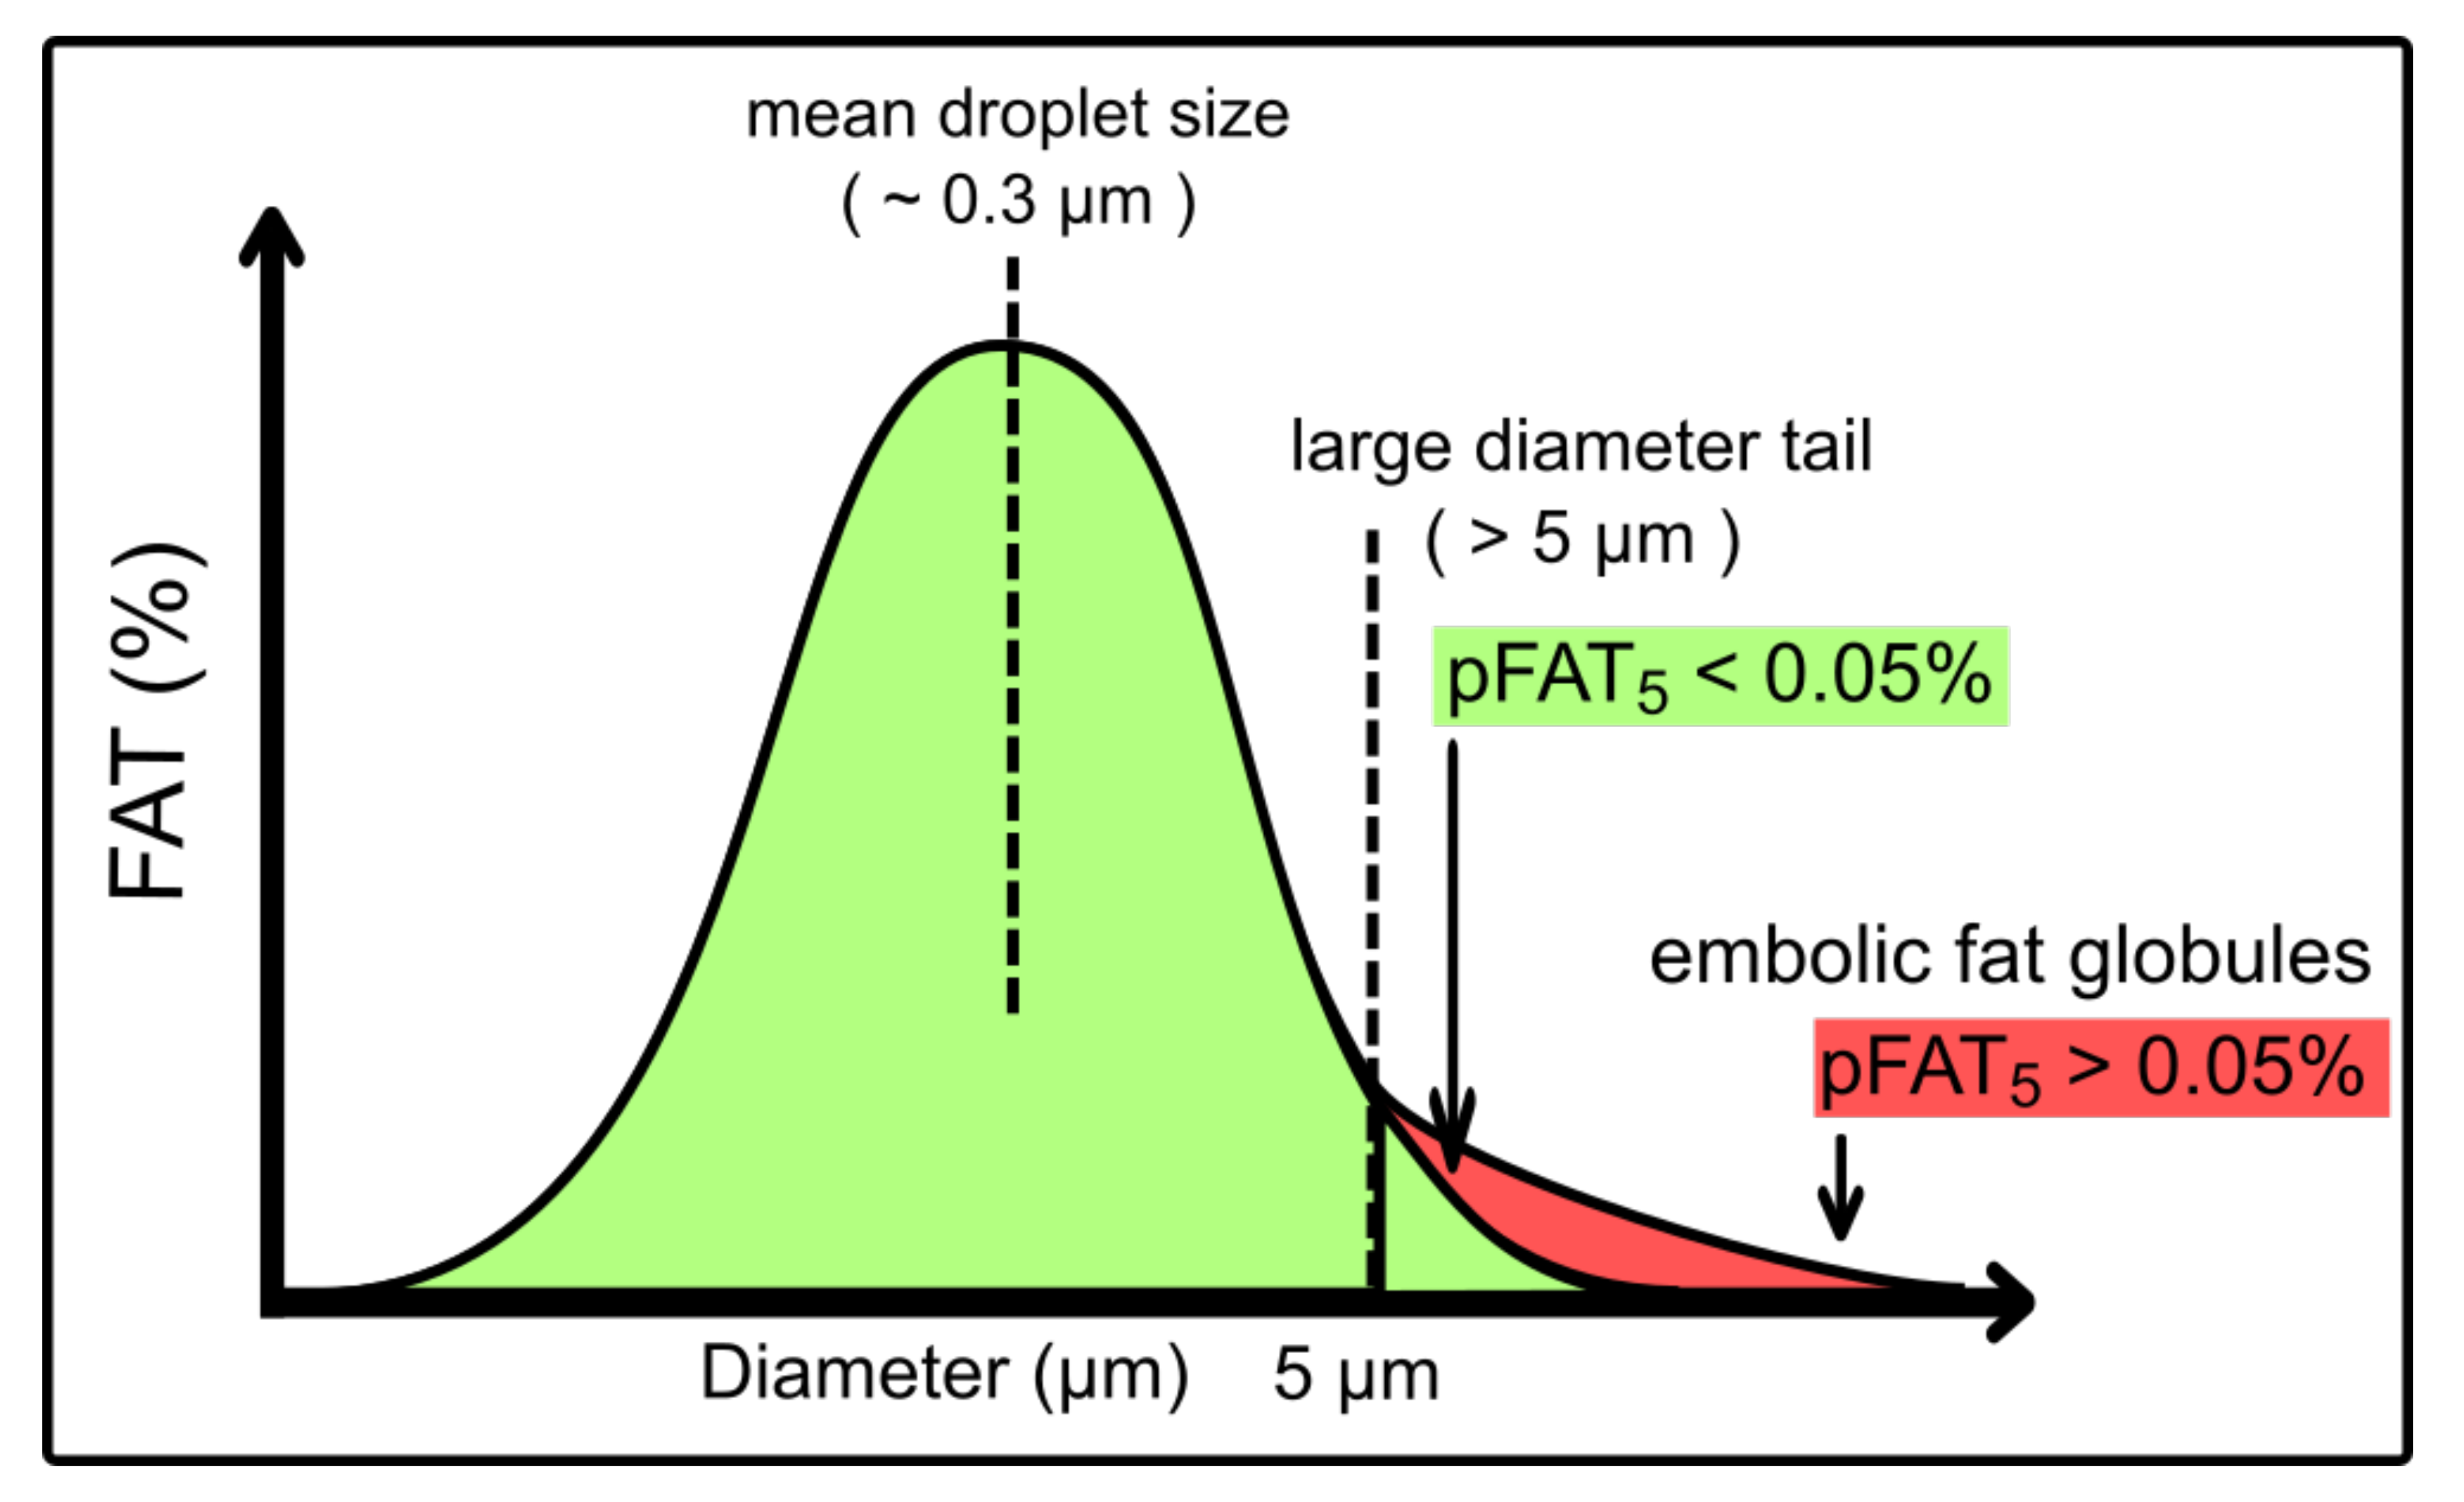
2. Considerations for the Manufacturing of Parenteral Lipid Emulsions

The formulation and manufacturing process plays a key role in the production of a stable parenteral emulsion [3]. The manufacturing process (Figure 1) can be divided into three main unit operations. The first is the preparation of the water and oil phases for this disparate dissolution of hydrophilic and lipophilic ingredients. Both phases are heated and stirred to disperse the ingredients, ensuring they dissolve completely. The second step involves the preparation of the coarse pre-emulsion (premix) by mixing the phases and agitating them using high-shear mixers at a controlled temperature and rotor speed. The third step is the conversion of the coarse emulsion into a fine emulsion by high-pressure homogenization at a defined temperature, homogenization pressure, and number of processing cycles, generating the final product [4]. After homogenization, the pH of the fine emulsion is adjusted to the desired value before filtration (1–5 µm) and packaging in United States Pharmacopoeia (USP) type I glass containers, plastic containers, or three-chamber bags containing glucose, amino acids, and a fat emulsion for parenteral nutrition. After filling the emulsion into the primary packaging under a nitrogen atmosphere, the emulsions are sterilized with steam [4].
The physicochemical stability of a lipid emulsion is an important characteristic that depends on factors such as temperature, pH, exposure to light and oxygen, peroxidation, the presence of vitamins and trace elements, the presence and relative concentration of divalent ions, and the type of container [5]. Stability issues become more complex when amino acids, vitamins, trace elements, electrolytes, or carbohydrates are added for parenteral nutrition [6]. Both glass and plastic containers are generally suitable, and they maintain the physicochemical stability of lipid emulsions, although they may differ in their effect on the same product [7]. For example, the lipid emulsion product Intralipid was unstable and failed to reach the required volume-weighted percentage of fat globules ≥5 µm (PFAT5) value when the packaging was changed from glass to plastic, but these stability issues were addressed by adjusting the formulation [8]. Instability was attributed to container triglyceride adsorption, with the plastic containers preferentially adsorbing larger globules to a greater extent than the glass containers [9].
The target globule size distribution to be achieved by high-pressure homogenization is specified in USP Chapter 729 (Globule Size Distribution in Lipid Injectable Emulsions), with a mean droplet size of ≤500 nm and a PFAT5 value set at ≤0.05% [10] (Figure 2). “The size of the lipid droplets is critical: because of mechanical filtration, larger-size fat globules (>5 µm) can be trapped in the lungs” (Chapter 729: United States Pharmacopoeia 2013). This emphasizes the need for strict control of the raw material, manufacturing process and packaging for such emulsions. According to the European Nutritional Guidelines [11], the particle diameter of injectable lipid emulsions must fall between 0.4 and 1.0 µm (the same size as natural chylomicrons) to ensure safety. The manufacturing process must guarantee this critical particle size and distribution, as well as the lasting stability of the emulsion, including the selection of appropriate packaging materials. Questions regarding the stability of emulsions reflect controversy regarding the interpretation of methods recommended in the USP. The physicochemical stability of an emulsion prepared from refined fish oil was considered for six parenteral nutrition admixtures at two concentrations stored at 4 °C, which were destabilized in the presence of calcium [12]. Particle analysis was carried out from t = 0 to t = 96 h at 24-h intervals using a light-scattering reverse-Fourier optics technique (laser granulometer). Three replicates were tested and statistical significance was determined by applying an f-test. For all admixtures, the particle diameter did not exceed the specified limit during the test provided the calcium concentration did not exceed ~4.5 mmol/L, and the narrow standard deviation confirmed the repeatability of the analysis. Otherwise, 12% of the particles exceeded the threshold of 1.0 µm and 2% were larger than 5.0 µm [13]. A similar study reported droplet sizes within the range 0.2–0.6 µmin different admixtures with and without calcium during the first 24 h of infusion [14]. Chemical and therapeutic safety was confirmed for 12 of the admixtures in the original study, although without transferability to other parenteral nutrition admixtures [12,13]. This point was addressed in a subsequent study because laser diffraction cannot detect a large-diameter tail induced by coalescence, which would only be observed during a destabilization process [15]. A complete physical stability analysis should therefore include visual inspection, microscopic observation, pH and zeta potential measurements, and the determination of globule size and characteristics by photon correlation spectroscopy [16].

3. Regulatory Considerations

3.1. Process Validation and Quality by Design

Given the intention to manufacture satisfactory products from one unit operation to the next, on different occasions or using different equipment, it is necessary to validate the preparation process before approval for routine use [17]. The FDA proposes three stages of process validation (process design, process qualification, and continued process verification) similar to the EU Annex 15 qualification and validation phases [18]. The second stage includes all process qualification steps to determine process capability and reproducibility during commercial-scale manufacturing. These GMP principles provide some key elements for manufacturing process design, containing specifications for products and materials, manufacturing formulae, directions for certain unit operations, and batch history records [19]. Product and material specifications should include the method used to confirm identity and, to a lesser extent, to demonstrate any defects [20]. The identity of the finished product in particular should refer to the concentration of an active ingredient and additional information referenced to a registered formula. The thresholds for foreign substances and defects can be detected using physical, chemical, and microbiological methods. Additional product-specific parameters that influence the product include the equipment, interactions with auxiliaries, and required therapeutic properties [21].
Defects in packing material must remain within acceptable quality levels applied to defects according to criticality. All tasks making up a manufacturing process must be defined as standard operating procedures. A batch manufacturing record ensures process traceability, describing the milestones along the critical manufacturing path including the identity of personnel and equipment, and a timestamp for each operation [17]. Before process validation, the entire validation program should be defined in a validation master plan (VMP) including the application and scope of the validation, qualification of items and equipment, the applied standards and limits, signing and addressing deviations, disposition of materials, and revalidation of the equipment or process. Furthermore, cleaning validation is a specialized aspect of overall validation that controls the effectiveness of cleaning methods, helping to address multiple risks. For example, cleaning between the manufacturing of different products reduces the risk of cross-contamination by the carryover of active ingredients, whereas cleaning between consecutive batches of the same product reduces the carryover of impurities and breakdown products. The most difficult-to-clean product must be included in the cleaning VMP, along with a product-specific method to confirm the success of cleaning. The identification of the most difficult-to-clean locations such as areas behind valves or dead-legs in the pipework should be considered in the cleaning VMP. An important post-cleaning step is the effective drying of surfaces to prevent the spread of microbes that remain after the sterilization of equipment [17].
In addition to PAT, the FDA has introduced Quality by Design (QbD) as an initiative to bake in quality during the design of processes [22]. QbD can be applied to stage 1 of FDA process validation (process design) using the principles laid down in ICH quality guidelines such as Pharmaceutical development (ICH Q8), Pharmaceutical quality risk management (ICH Q9), Pharmaceutical quality system (ICH Q10), and the Development and manufacture of a drug substance (ICH Q11) [18]. The basis of product design is the quality target product profile (QTPP) containing quality and purity requirements for the drug product as well as physical and chemical attributes that affect drug release, which can be described as the desired product quality specification [23]. The QTPP can be used to define critical quality attributes (CQAs) that must be controlled during the manufacturing process. These are physical, chemical, and microbiological characteristics that should be maintained within a given range to ensure the desired product quality [18]. The particle size of parenteral lipid emulsions can be controlled during manufacturing. The CQAs are linked to and influenced by the critical process parameters (CPPs), which must be monitored or controlled during manufacturing to ensure the desired product quality. CPPs can be monitored using tools such as PAT, statistical experimental designs (DoE) and multivariate analysis. The definition of CPPs and corresponding CQAs gives rise to the design space, which is the multidimensional combination of input variables, process parameters and their interactions. Movement within the design space is not considered as a change, whereas movement beyond the design space is considered as a change and would normally initiate post-approval change processes. In stage 2 of FDA process validation (process qualification), the process and equipment should be validated and the impact of the equipment must be evaluated. For further development, these results should be analyzed and the validated state of the process should be monitored. All additional knowledge generated during manufacturing should be used to adjust process parameters for the continual improvement of the drug product [18].

3.2. Aseptic Processing of Parenteral Lipid Emulsions

The GMP-compliant production of parenteral lipid emulsions must ensure the appropriate quality and grade of raw materials (as well as equipment design and maintenance) such that the emulsion and active ingredient are stable, sterile and free of pyrogens and particulate matter [24]. GMP covers each unit operation from the purchase of raw and input materials to the finished product [25]. GMP is designed to minimize risks, proven through the documentation of risk analysis, and sets standards for final product testing [26]. One of the most critical aspects is sterile processing due to the direct impact on patient safety. In 2012, three lots of an epidural steroid formulation packaged by the New England Compounding Center (NECC) were found to be contaminated with a fungal meningitis pathogen due to insufficient sterilization times, leading to the infection of 500 patients and 30 deaths [27]. Other similar emergencies include an outbreak of severe sepsis due to the use of contaminated propofol at a community hospital in the Netherlands [28], at three hospitals in Iran [29], and due to the bacterial contamination of propofol vials in operating rooms at a third-level hospital in Colombia [30]. Additional examples include fluid contamination in hospitalized children in Mexico [31], fungal endophthalmitis at a single California ambulatory surgical center [32], an outbreak of Serratia marcescens due to contaminated intravenous pain control fluid in a hospital in Taiwan [33], and fatal bacterial infections of four newborns at a hospital in France following the use of contaminated parenteral nutrition formulae [34].
A systematic review discussing the risk of microbial contamination in parenteral formulations prepared using aseptic techniques revealed a lower risk in pharmaceutical (0.5%) than clinical (3.7%) environments, although there was no statistically significant difference when considering the preparation of individual lots [35]. The authors recommended the use of a pharmaceutical rather than clinical environment for aseptic dose preparation, especially batch preparation, as well as the reporting of contamination rates to evaluate the competence of aseptic techniques, and a contamination/infection risk assessment for different pathogens to determine the cost-effectiveness of each production environment [35]. A subsequent meta-analysis based on more recent studies yielded similar results and similar risk-mitigating measures in the clinical environment were proposed [36].
To minimize the risk of product contamination, many process steps are carried out in a clean room. This helps to avoid the high levels of contamination that can originate from personnel, the water supply, surfaces, or the air inside the clean room [37]. Aseptic processing is a strictly regulated practice based on FDA guidance documents, EU GMP regulations, and the US Code of Federal Regulations (CFR21) [38]. Aseptic processing requires the tracking of all components from the formulation to the finished product (including the active ingredient and all buffers and excipients), as well as the process operations (holding periods, filling machine setup) and the movement of personnel [39]. The first portion of the quality risk assessment process identifies and analyzes potential hazards and risks associated with exposure to those hazards. In addition to the various aseptic processes (e.g., the aseptic assembly of devices or mixing of ingredients, aseptic crystallization, or the aseptic precipitation of a drug product), all the aseptic processes end with aseptic filling [40], which is discussed in more detail below.
The challenges that must be addressed during aseptic filling vary with the container and its closure system. For this reason, we limit the discussion to open vials, which are typically used for the aseptic filling of parenteral doses. The comparison of three types of containers to evaluate the risk of contamination from their internal surfaces revealed a risk associated with particles carried by laminar air flow [41]. This work was extended to include additional packaging types and the comparison of media filling data in normal and challenging situations, looking at critical surfaces and the degree of exposure [42]. The internal surface of the vial stopper posed a risk because it is fully exposed to the laminar airflow before closing. In addition, the surfaces are in contact with equipment parts such as bowls and ramps that may transport particles by mechanical vibration. Three potential sources of contamination during open vial packaging were identified [42]. First, the vial neck presents a risk due to particles carried by airflow through the vial opening, which are then trapped by the stopper. The exposure time increases the contamination risk, but the exposure time is limited during the removal of pyrogens because bacteria are killed as the vials cool, giving a window of ~8 min. Second, the stoppers present a risk because they are exposed to the filling area during the stopper loading and transport sequence, which lasts for ~20 min. Only 40% of the stopper surface is introduced into the vial, but this surface is a potential source of contamination. The risk is reduced because many stoppers are stacked on each other during transport. Third, the filling needle is a risk because it is exposed during the entire filling process but the risk to each vial is limited to a single filling process lasting ~1.5 s. The critical surface of the needle is the surface accessible as the drop is placed into the vial (2 mm2, standard needle). The risk is reduced by the parallel positioning of the needle in the air flow. Turbulent flow may occur under the needle holder due to an airflow angle of 30° [42].
The ranking of vial dimensions [43] based on quality risk assessment according to ICH Q9 [44] considered risks related to human interventions, including environmental contamination caused by broken glass containers or defective rubber seals and glass particles generated when the vials are opened. The highest risk was the vial entry surface due to the direct association with vial opening. The remaining vial surface indirectly affected rubber capping and sealing. The vial dimension specification is therefore directly linked to the contamination risk. The outer surface of the container is another potential source of contamination caused by laminar airflow associated with glass breakage due to contact with transport equipment such as rails and ramps. If glass breakages occur, this contamination risk is increased by the resulting personnel traffic in the clean area zone, which disrupts the laminar flow conditions. The frequency of breakage can increase due to differences in curvature at the base of the vial or underweighting resulting from an improper filling volume, both of which cause instability during transport. A systematic risk factor (RS) was introduced for risk evaluation, and is calculated from the severity, frequency, and expression of the risk (RS ≥ 5 means high risk). An evaluation of risk factors concluded that weight differences resulted in the highest risk (RS = 9.9). This was followed by the risk caused by vial dimension deviations, specifically the total vial height and the height of the mouth as well as the thickness of the vial body and base (RS = 6.6). The height of the vial body and neck were associated with a lower but still unacceptable risk (RS = 3.3). Defects in the rubber seal or cap, as opposed to glass breakage, cannot be detected by visual inspection. Acceptable risks could only be found for the entire vial diameter, the curvature of the base, and the angle of the transition elements of the vial (0 ≤ RS < 3) [43].

4. PAT for Droplet Monitoring

The continuous, real-time monitoring of manufacturing processes using PAT is central to a new generation of regulatory submissions [45]. PAT guidance is a framework that encourages innovations in pharmaceutical product development, manufacturing, and quality assurance, involving tools and principles that improve process understanding, especially the identification and management of all critical sources of variability, thus predicting product quality over the design space established for all CPPs [46]. A precise description of PAT [47] is “…a system for designing, analyzing, and controlling manufacturing through timely measurements of critical quality and performance attributes of raw and in-process materials and processes with the goal of ensuring final product quality.” In the context of particle distribution, it is necessary to measure and characterize not only the particle size and shape, but also the change of these parameters over time to increase process understanding. Particle size is a CQA for many pharmaceutical unit operations, including granulation, drying, milling, spray-drying, coating, compression, mixing and emulsification. The particle size distribution affects product quality, efficacy, and safety. In the pharmaceutical industry, particle size can be measured using technologies such as sedimentation, microscopy, a Coulter counter, laser diffraction, dynamic light scattering (DLS), ultrasonic spectroscopy, dielectric spectroscopy, and nuclear magnetic resonance (NMR) diffusometry, but only a few of these are suitable for continuous monitoring or for the analysis of emulsions with a high particle load. The opacity of such emulsions prevents the use of optical methods. The rapid quality control of droplet size during manufacturing without a pre-dilution step can be achieved using indirect spectroscopy methods. The methods that are already suitable for continuous droplet monitoring or are likely to be suitable in the future are discussed in more detail below, and summarized in Table 1.

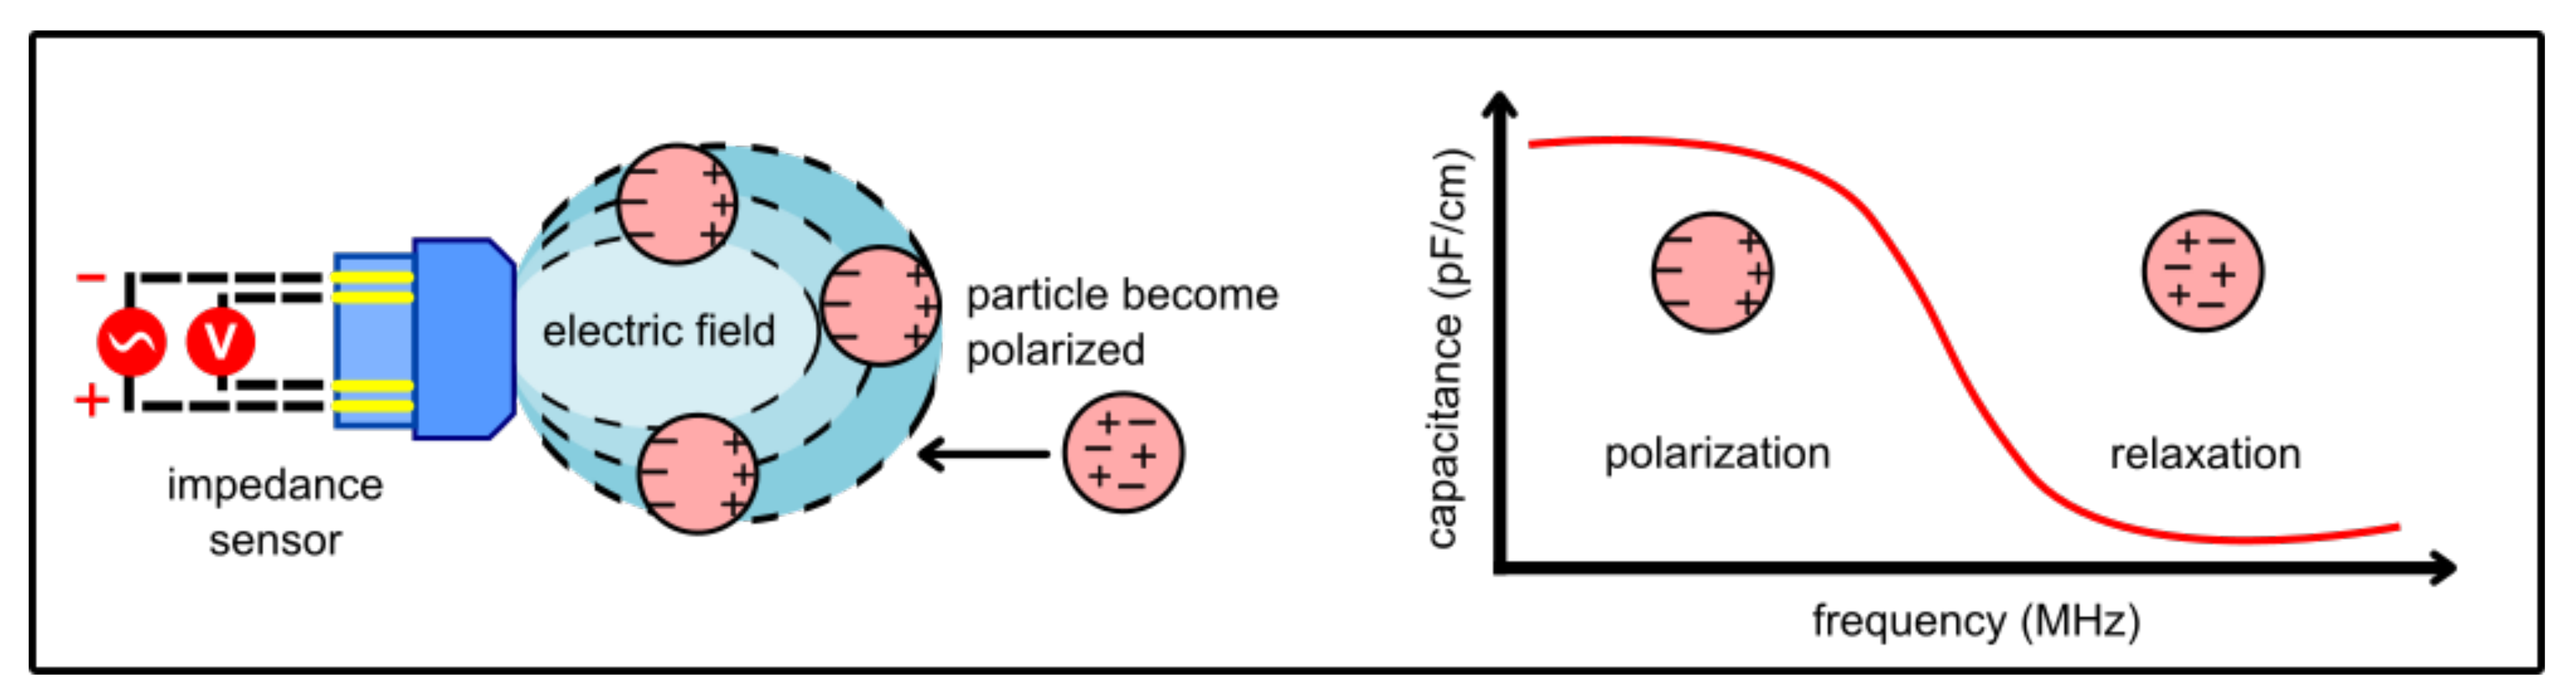
4.1. Dielectric Spectroscopy

Dielectric spectroscopy (also known as impedance spectroscopy) is a technique in which an alternating current (AC) field is applied to the particle flow at different frequencies. Certain materials become polarized in AC fields and form a dipole (Figure 3). This ability is described by the dielectric constant, which can be determined by measuring the capacitance. If there is polarizable material in the electric field, the dipole induced in the material increases the capacitance. At very high frequencies (>100 MHz), the response of polarizable material is limited because the polarity of the electric field changes too rapidly to allow charge accumulation at the interfaces. At lower frequencies, the interfaces are fully polarized, causing the capacitance signal to forma low frequency plateau. This dielectric behavior of the capacitance as a function of frequency is called dispersion. An inline/online measurement technique based on dielectric spectroscopy has been combined with principal component analysis (PCA) [48,49]. The resulting frequency-dependent dielectric relaxations provide information about the heterogeneous structure of the system [50]. A special dielectric probe has been developed to measure dielectric properties between 0.5 and 50 MHz [51]. The dielectric loss spectra are influenced by ionic conductivity, and PCA allows the complete frequency range to distinguish between the influences of the oil and salt fractions. Using this technology, the particle size and the constituent fractions were determined simultaneously for a rapeseed oil-in-water emulsion. The work was extended by studying the effects of particle distribution, the presence of ions in the continuous phase and at the boundary surface, the temperature, and temperature changes [52]. The measurement system was calibrated by assuming a constant temperature and salt concentration, and knowing the type of emulsifier and the expected modality of the emulsion. Temperature fluctuations within a tolerance range of 5 K had little impact on the measurement, but larger fluctuations led to significant measurement errors. Monovalent ions in the continuous phase at concentrations exceeding 0.03 mol/L also affected the measurement and this must be taken into account during calibration.
High salt concentrations lead to a sharp rise in the dielectric constant, and these spectra cannot be evaluated by PCA, so dielectric spectroscopy is unsuitable for such products. The use of an ionic emulsifier shifts the loss factor ε′′ in the form of peaks that migrate to lower frequencies with increasing particle size. Accordingly, the type of the emulsifier is also taken into account during calibration. The presence of bimodalities must be accommodated during calibration because these cause a shift in the dielectric spectrum correlating with the position parameters (span B), providing a means to assess the breadth of the distribution based on dielectric data. Following system calibration, measurement stability is assessed over a period of 24 h. An application based on a commercial i-Biomass 465 probe (Fogale nanotech, Nîmes, France) designed for biomass monitoring allows for the inline monitoring of dielectric behavior for multiple emulsions [53]. One major advantage of PAT is the ability to determine the end point of a manufacturing process inline. For a two-step emulsification process involving multiple emulsions, such as water-in-oil-in-water emulsions, the end point can be detected inline. The measuring probe was introduced directly into the external aqueous phase (stirring speed = 35 rpm) and continuous measurement was carried out at a fixed frequency of 1 MHz. The permittivity reaches a plateau at the minimum droplet size. The conductivity increases from this time point due to the decrease in viscosity. This allows the optimum process time to be identified for maximum viscosity and minimum droplet size.

4.2. Ultrasonic Backscattering

Ultrasonic backscattering is based on an iterative pulse–echo method, in which an ultrasonic signal of 1–150 MHz is detected as an acoustic reflection from the sample, and the backscattered waves are evaluated by statistical analysis yielding two principal parameters: the maximum amplitude of backscattering and the time-dependent decay (Figure 4). The ultrasonic waves are also scattered in other directions, yielding additional information about the dispersion [54].
Measuring the reflection or backscattering alone enables the use of an open measurement setup coupled directly to the medium, with only one transducer emitting and receiving the signal. Particle–particle interactions and multiple scattering can lead to errors in particle size estimations at high particle loads. Concentrated glass beads dispersed in water (140 µm spread over five granulometric fractions, monomodal) were analyzed using in-house equipment consisting of a pulser (6–14 MHz) and receiver with a receiving amplifier coupled to a digital oscilloscope [55]. In a logarithmic scale of the backscattering amplitude η(t), the effect of sound attenuation is approximately linear, where the linear decay Δη corresponds to the time-dependent decay of the backscattering amplitude [55]. Two measurement variables were identified, which were sensitive to variations in particle size and concentration. There was good agreement between attenuation and the time-dependent decay of the backscattering signal as long as multiple scattering was negligible. Multiple scattering causes additional signal components and the value of Δη decreases. In this case, the selected frequency should be as low as possible. The maximum backscattering amplitude could be correlated with theoretical values predicted using Faran’s model [56] for calibration, providing estimates of the mean particle size. The analysis of further attenuation yields an approximate concentration.
Spectral analysis of the backscattering amplitude could also be used to determine the mean particle size and distribution. The work was extended by measuring a concentrated suspension using the statistical feature of multiple consecutive scattered sound waves, representing the scattering amplitude and its decline over time [57]. The influence of particle size and concentration on backscattering was studied using two different kinds of glass particles at different concentrations. An empirical validation of the method for small particles and high concentrations revealed two parameters (σmax and Δσ) that can be extracted from the backscattering signal to characterize the suspension. For both kinds of glass particles, the standard deviation σmax of the maximum backscattering amplitude was significantly lower for the smaller particles. In addition, σmax increases with concentration followed by a decrease due to multiple scattering effects as previously shown [55]. If the concentration increases, the linear decay Δσ increases continuously for both particle systems. The concentration of particles with a constant size can be derived from Δσ, whereas σmax is a qualitative indicator of variations in particle size. Multiple backscattering effects were addressed in greater detail by developing a semi-empirical model that combines a model based on single scattering effects with predictions of wave interference for dispersions with a defined microstructure [58]. For concentrations up to 30% (v/v), experiments were carried out on two types of dispersion (suspensions and emulsions). This showed that backscatter could be based on two parameters sensitive to the composition, particle size and concentration of the dispersion: bmax increased in line with the particle size, whereas the decay of backscattering amplitude β was related to particle concentration. The backscattering amplitude bmax is affected by the scattering intensity of the dispersion and thus by the scattering cross-section and particle concentration. However, for a given mixture of material and a selected frequency range of measurement, multiple scattering effects can be covered empirically because the backscattering coefficient is highly sensitive to particle size. This enables the calibration of measuring equipment by comparing the squared maximum backscattering amplitude to the backscattering coefficient η. The influence of particle concentration can be reduced by evaluating β as a function of the volume concentration cV.

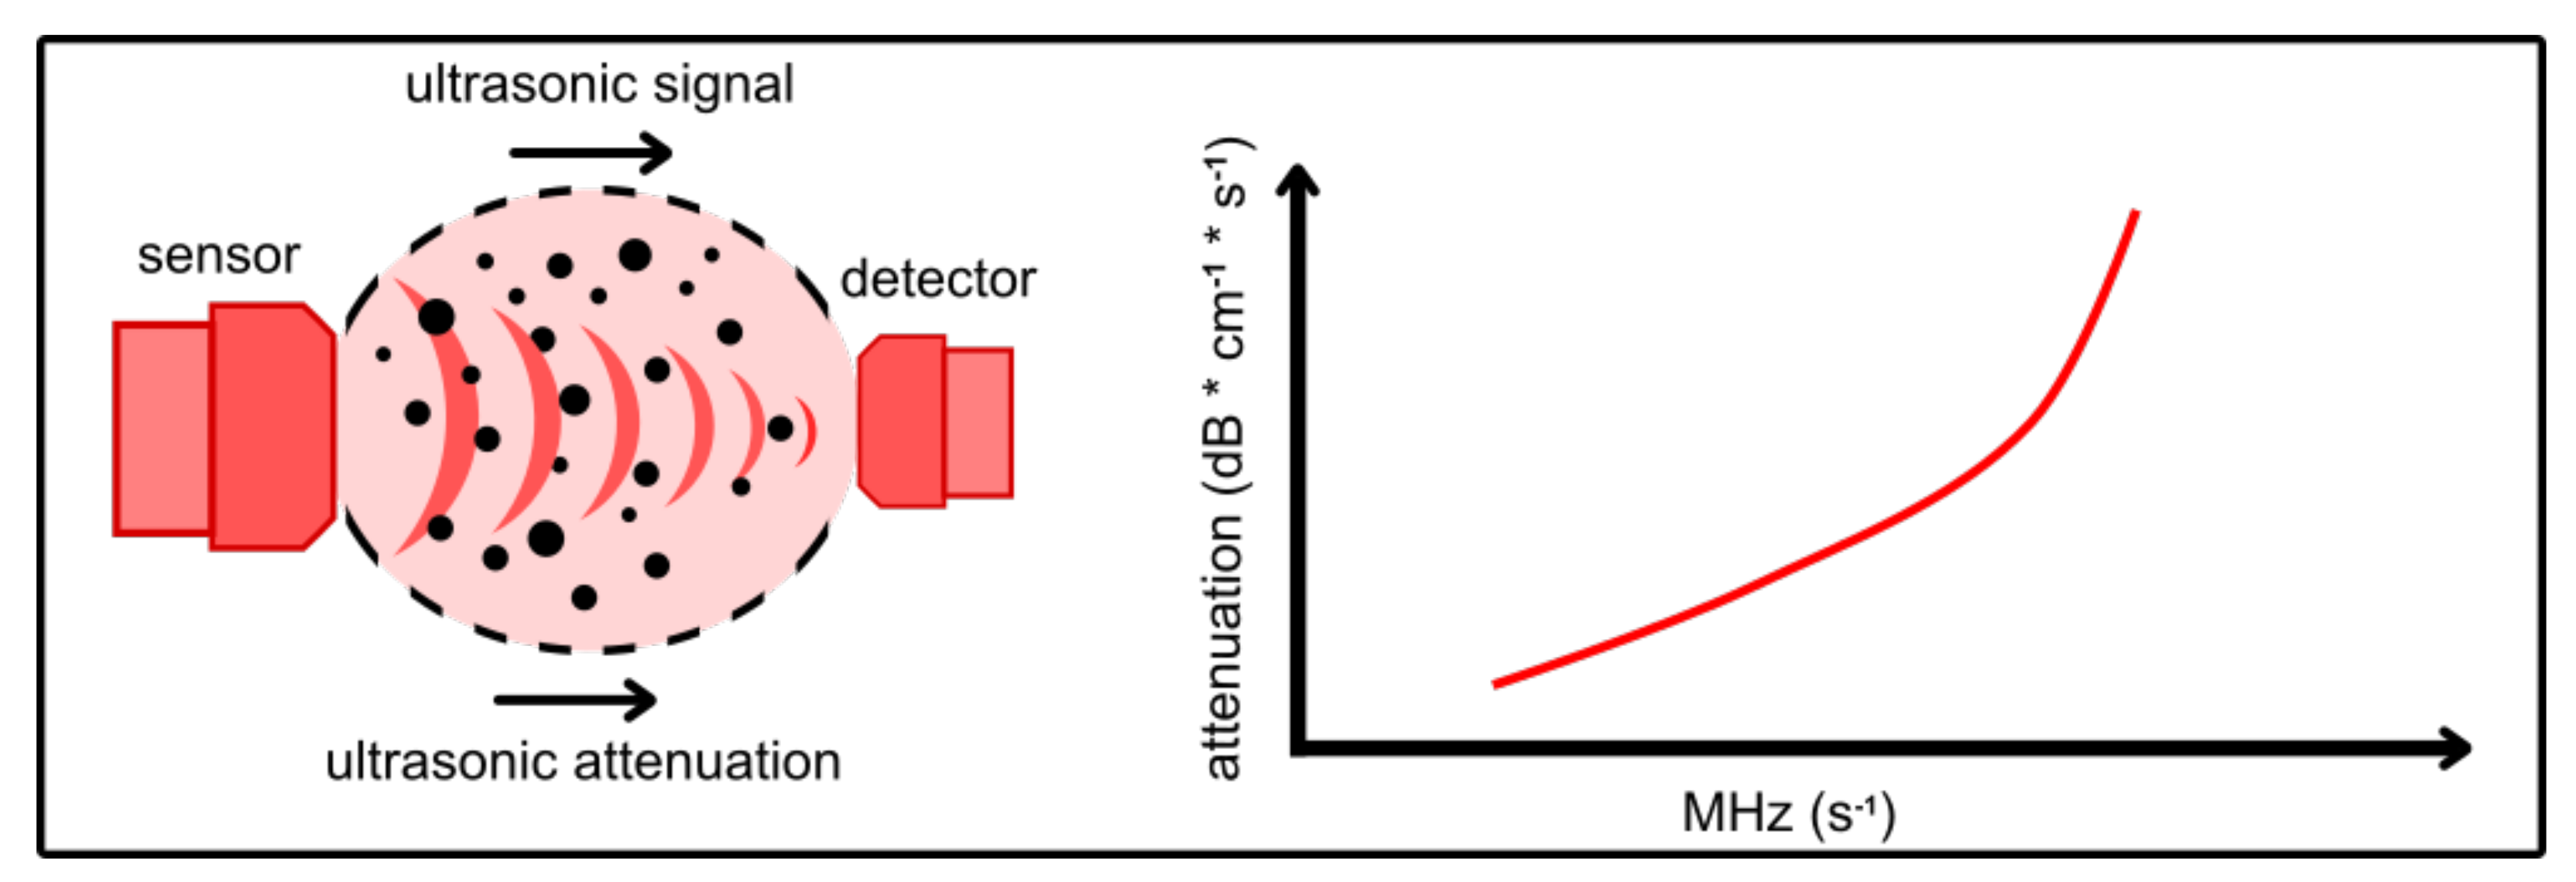
4.3. Ultrasonic Attenuation Spectroscopy

Electroacoustic spectroscopy measures the attenuation and velocity of ultrasonic pulses of a specific frequency and strength passing through the system, and is advantageous because it can monitor concentrated emulsion systems [59]. The ultrasonic pulses are produced by a wave generator. They pass through the measurement system and, following interaction with the droplet or particle, hit a detector that receives the attenuated signal (Figure 5). The resulting spectra are processed using a model that generates theoretical attenuation spectra to select the best droplet size distribution with the lowest error matching the experimental data [60,61].
Eight different ZnO powders prepared as 5% (w/v) dispersions in water were examined using a DT-1201 instrument (Dispersion Technology, Bedford Hills, NY, USA) as well as transmission electron microscopy (TEM) [62]. The nanoparticle fraction could be determined with a precision better than 2% of the total loading of all samples and showed that each of the dispersions contained a different relative content in the nanoparticle fraction. The comparison with TEM images provided a qualitative confirmation of the particle size, distinguished between samples, and indicated the presence of agglomeration, revealing no contradiction between the two methods. Droplet size was also monitored in emulsion systems containing functionalized amino-modified silicones and was compared to offline DLS in a diluted regime [63]. The general droplet size was in the same range for both techniques, but the attenuation function of the system was a better fit for a bimodal distribution (4% fitting error) compared to the unimodal distribution (15% fitting error), representing the presence of microdroplets and a larger fraction of nanodroplets for concentrated emulsions.
Online flow-through measurement was used as a process control system by splitting ultrasonic waves using stepped reflectors and/or transducer delay rods to introduce multiple measurement gaps [64]. The system can be used inline or online via a bypass. The Sympatec OPUS Particle Analyzer was used to measure the particle size of heavy oil-in-water emulsions prepared at a concentration of 70% (v/v) using a rotor-stator in a stirred vessel with surfactants [65]. In the first step, a frequency must be found that allows the continuous phase to be distinguished clearly from the dispersed phase. For the Venezuela heavy oil-in-water system, very high frequencies were needed to determine the particle size distribution of 60–178 mm. The measurement trends of the ultrasonic attenuation method also agreed with the apparent viscosity of the emulsion. A demulsification method was investigated for a phosphoric acidtributylphosphate emulsion using a hydrocyclone [66]. The droplet size distribution of the emulsion was measured before and after demulsification using the Sympatec OPUS Particle Analyzer, allowing the structural design of the cyclone to be optimized. A mathematical model that reliably predicts the average differences in droplet size under most demulsification conditions could be fitted to the experimental ultrasonic attenuation spectroscopy data. Ultrasonic spectroscopy has also been used to determine the droplet size distribution of an emulsion consisting of water and sunflower oil over a concentration range of 10–50% (v/v), considering bimodal distributions [67]. The spectra were compared with the simplest acoustic models applied for the range of media. The ultrasonic spectroscopy data agreed with laser diffraction results. The experiments indicated that ultrasonic spectroscopy can detect droplet distributions in the range 0.1–1000 µm at a concentration of 40% (v/v).

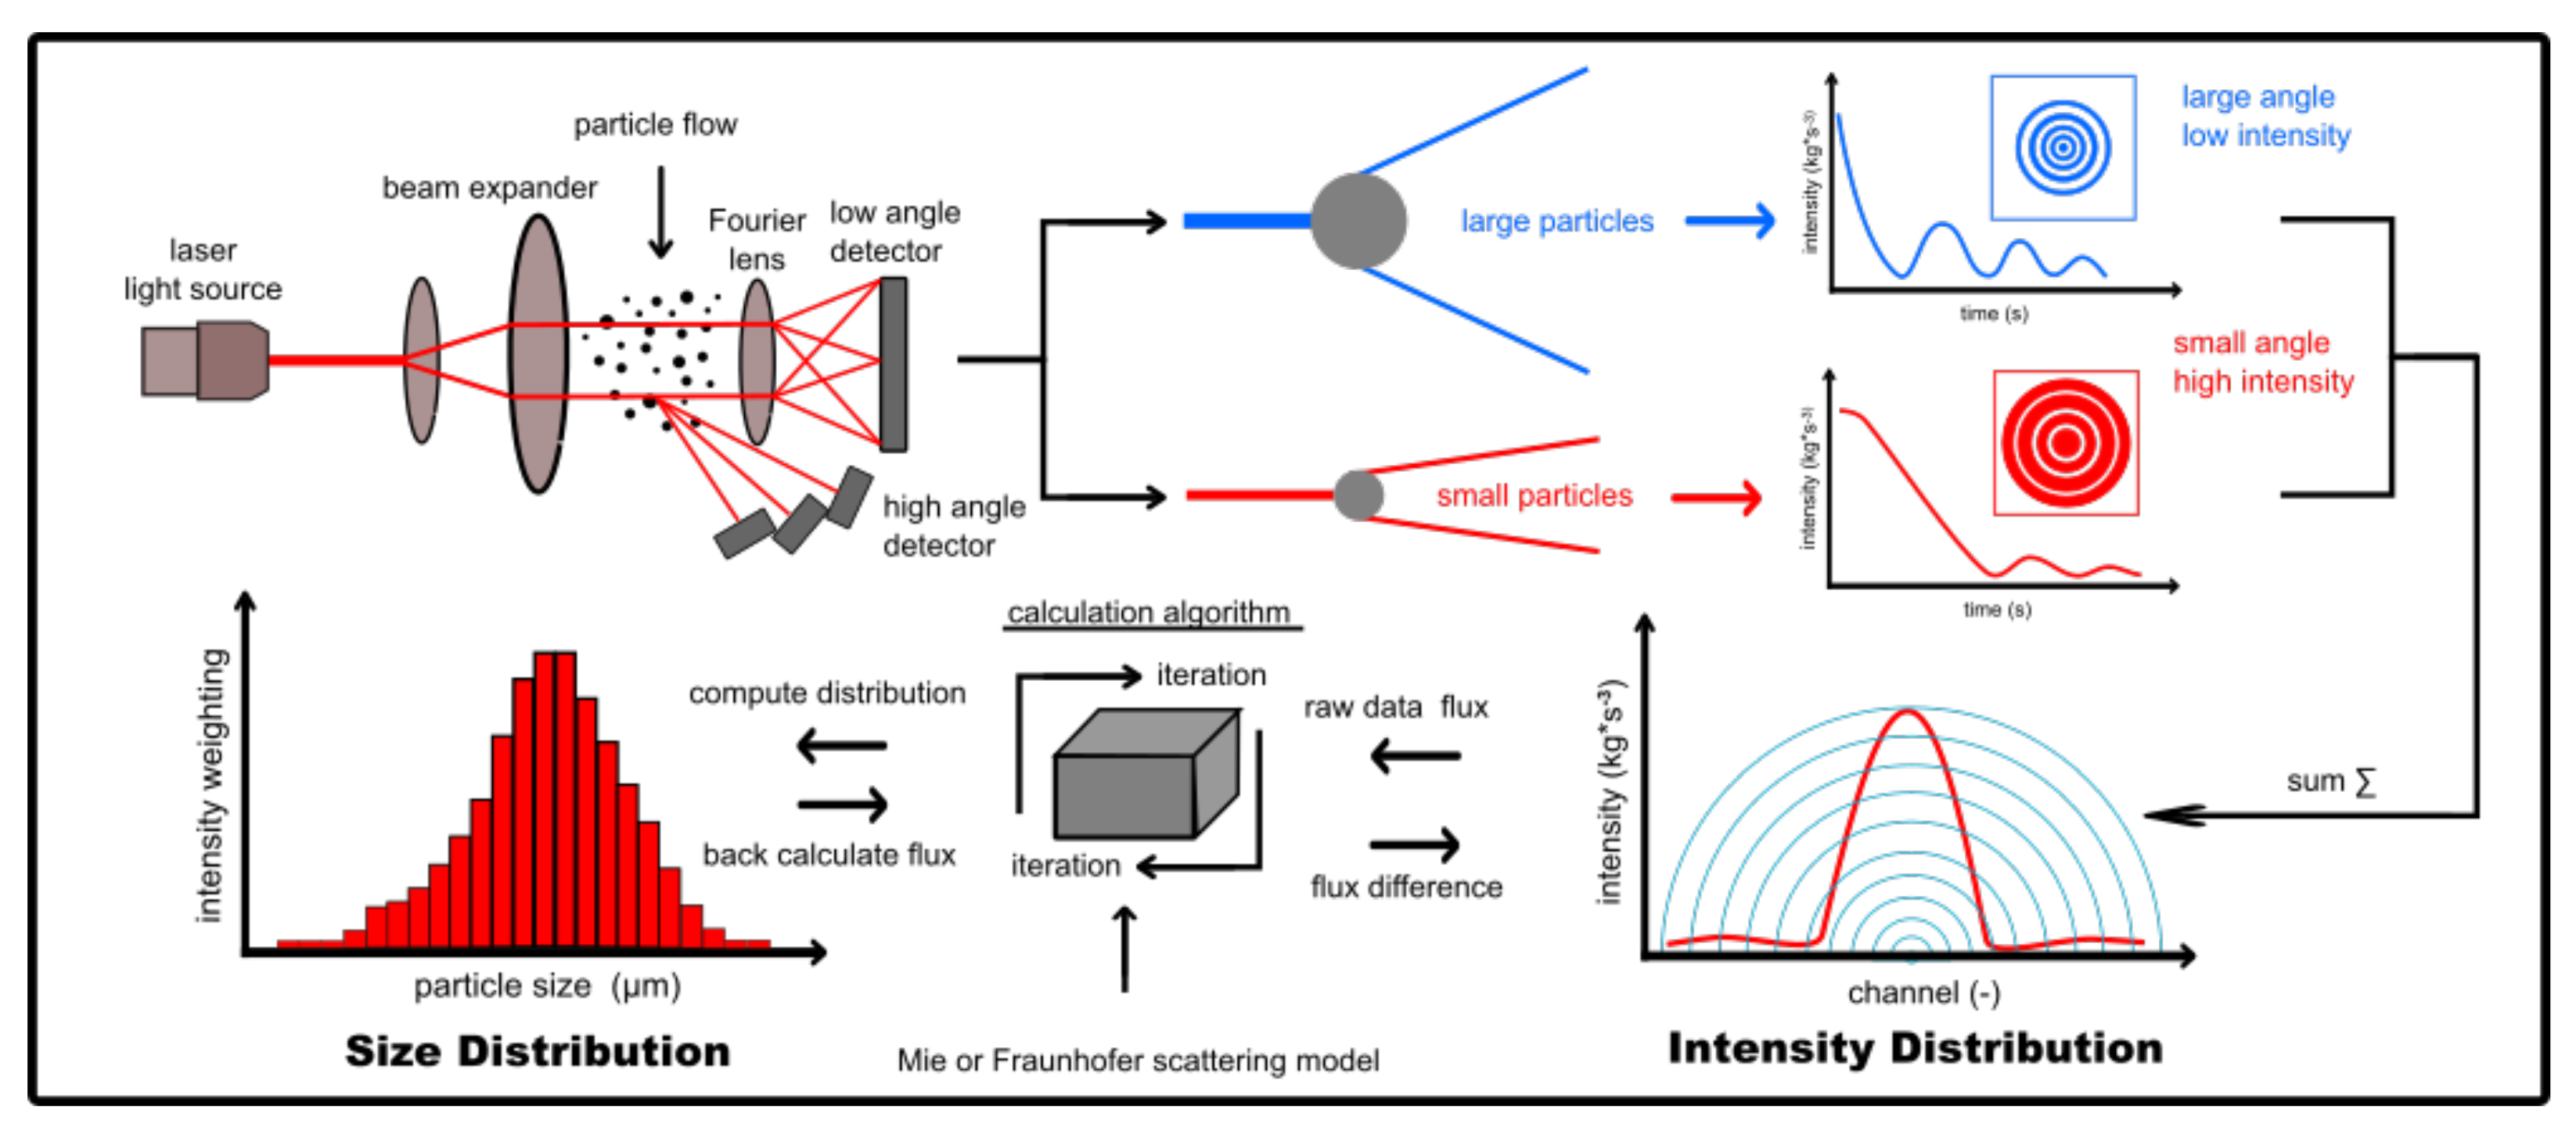
4.4. Laser Diffraction

Laser diffraction determines the size of particles by reporting their interactions with light, based on the relationship between particle size and the angle and intensity of a scattered laser beam (Figure 6). The diffraction of waves is modeled according to the Fraunhofer approximation or the Mie scattering theory, the latter offering better results for most particles. A monochromatic laser beam is expanded and converted to parallel beams in an optical lens system before passing through the stream of particles. The diffracted light passes through a Fourier lens, which ensures that the diffraction pattern of any particle of a certain size, regardless of its position in the measurement volume, is always imaged at the same position on the ring detectors. The detector system provides a scattering light distribution which is converted into a size distribution by iterative calculations.
Laser diffraction is commercially available for offline and online analysis. An online measurement system was used to study the precipitation of nickel hydroxide in a stirred reactor [68]. This revealed the effect of different process parameters on the particle size distribution and mean particle size, allowing process characterization. The Insitec system has been applied as a PAT tool for spray-drying in several studies [69]. For example, along-term maintenance strategy with an online laser diffraction probe (Malvern Insitec) was compared to an offline method (Malvern Mastersizer) for the analysis of spray-drying [70]. This showed that spray-drying can produce reproducible particle size distributions and is effective for targeted particle engineering. A comparison of 100 samples using these methods revealed a deviation of 10 µmin the d(0.5) value, which is the volume mean diameter (where 50% of the particle size distribution is larger and 50% is smaller). Increasing the number of batches moved the average offset to 20 µm without intentional changes in the manufacturing process. The Insitec measures a wider distribution and a larger particle size than the offline method. To determine whether a constant offset correction could overlay the d(0.5) from separate particle size distributions, a randomization of 10,000 iterations of the mean µ and the variance σ were generated from theoretical lognormal distributions. The results showed that a constant offset correction cannot universally align two mismatching lognormal distributions. The d(0.5) value was also the most sensitive of the metrics to the distribution difference given its higher slope compared to the d(0.1) and d(0.9) values, representing the volume mean diameters where 10% and 90%, respectively, of the particle size distribution is smaller. The d(0.1) and d(0.9) values did not follow the same linear relationship, confirming they have the ability to affect the d(0.5) value due to variability in the edge of the distribution. The Insitec and Mastersizer responded differently to a particle size shift compared to the predicted simulated distributions. The Insitec was more sensitive to larger particles and predicted a larger particle size and a wider distribution than the Mastersizer. Constant bias correction worked only as long as the d(0.5) remained constant, reflecting the good agreement between the slopes in the middle of the curve. The prediction error at the edges remained high. Using all historical data from measurements of both systems, a model was built based on a comparison over a wide range of d(0.5) values. This correction resulted in lower residuals between the two methods and responded with the same magnitude to a change in particle size. Not all points tested with the Mastersizer had corresponding points generated by the Insitec system, but the methods can be aligned with this correction as part of the control strategy and serve as surrogates for each other. For the implementation of a control strategy, data filtering is necessary before the calculation given the 8min moving-block average value for each reported d(0.5) value. Individual measurements increase the frequency of failures identified as artifacts (phantom large particle spikes) because measurement spikes were always coincident with time points and were accompanied by an upward shift in the entire particle size distribution, and each spike showed an increase and decrease in counts coincident with ghost peaks [71]. In summary the online Insitec system was more sensitive to process and raw-material variability so the pre-filtering of data as well as slope-based bias correction were necessary to align with the offline Mastersizer system.

4.5. Diffusing Wave Spectroscopy

Diffusing wave spectroscopy (DWS) is a multiple light scattering technique based on an approximation of scattered light to a diffusion equation. A laser beam is scattered from a ground glass lens and collected by a second lens before illuminating the turbid sample. The raw data are then fitted to an autocorrelation function using a correlator (Figure 7).
DWS was used as an at-line technique to monitor the manufacturing of a pharmaceutical oil-in-water emulsion containing xanthan gum, in addition to mechanical rheology, microscopy, and stability testing [72]. Xanthan gum is known for its shear-thinning properties, resulting in pseudoplastic flow. DWS enables the evaluation of emulsions in terms of their micro-rheological properties and the dynamics of scattered particles [73]. The latter, for a dilute emulsion, is determined by the rheological properties of the continuous phase as well as the size of and interactions between droplets. Inline monitoring of the emulsification process for a product containing different concentrations of xanthan gum in the aqueous phase showed a trend toward increasing process time, and the decay in the intensity correlation function was displaced toward shorter lag times. The rheological properties remained unchanged during the process, whereas the droplet size distribution changed significantly. Given the relationship between droplet size and movement (the Stokes–Einstein relation), the evolution of droplet size can be inferred from the intensity correlation function. Accordingly, the reference parameter t2/3 was introduced, describing the time over which the normalized intensity correlation function decays to 2/3 of its initial value. All emulsification processes showed a significant drop in the t2/3 value, but this stabilized during the additional process time. The t2/3 parameter reflects the internal dynamics caused by droplet size effects during the emulsification process, and changes in the rheological properties are shown by the prolonged t2/3 decay times for higher xanthan concentrations. DWS also allows the generation of the transport mean free path l*, calculated using Mie theory [74], which describes the optical properties or turbidity of a sample based on the scattering and diffusive transport of light through the sample. Unexpectedly, the t2/3 and l* values follow similar trends because there are no significant changes in rheological properties during the manufacturing process. These two values are linked to CQAs of the emulsion, and could therefore be used as control parameters for emulsion manufacturing if DWS is used as a PAT method.

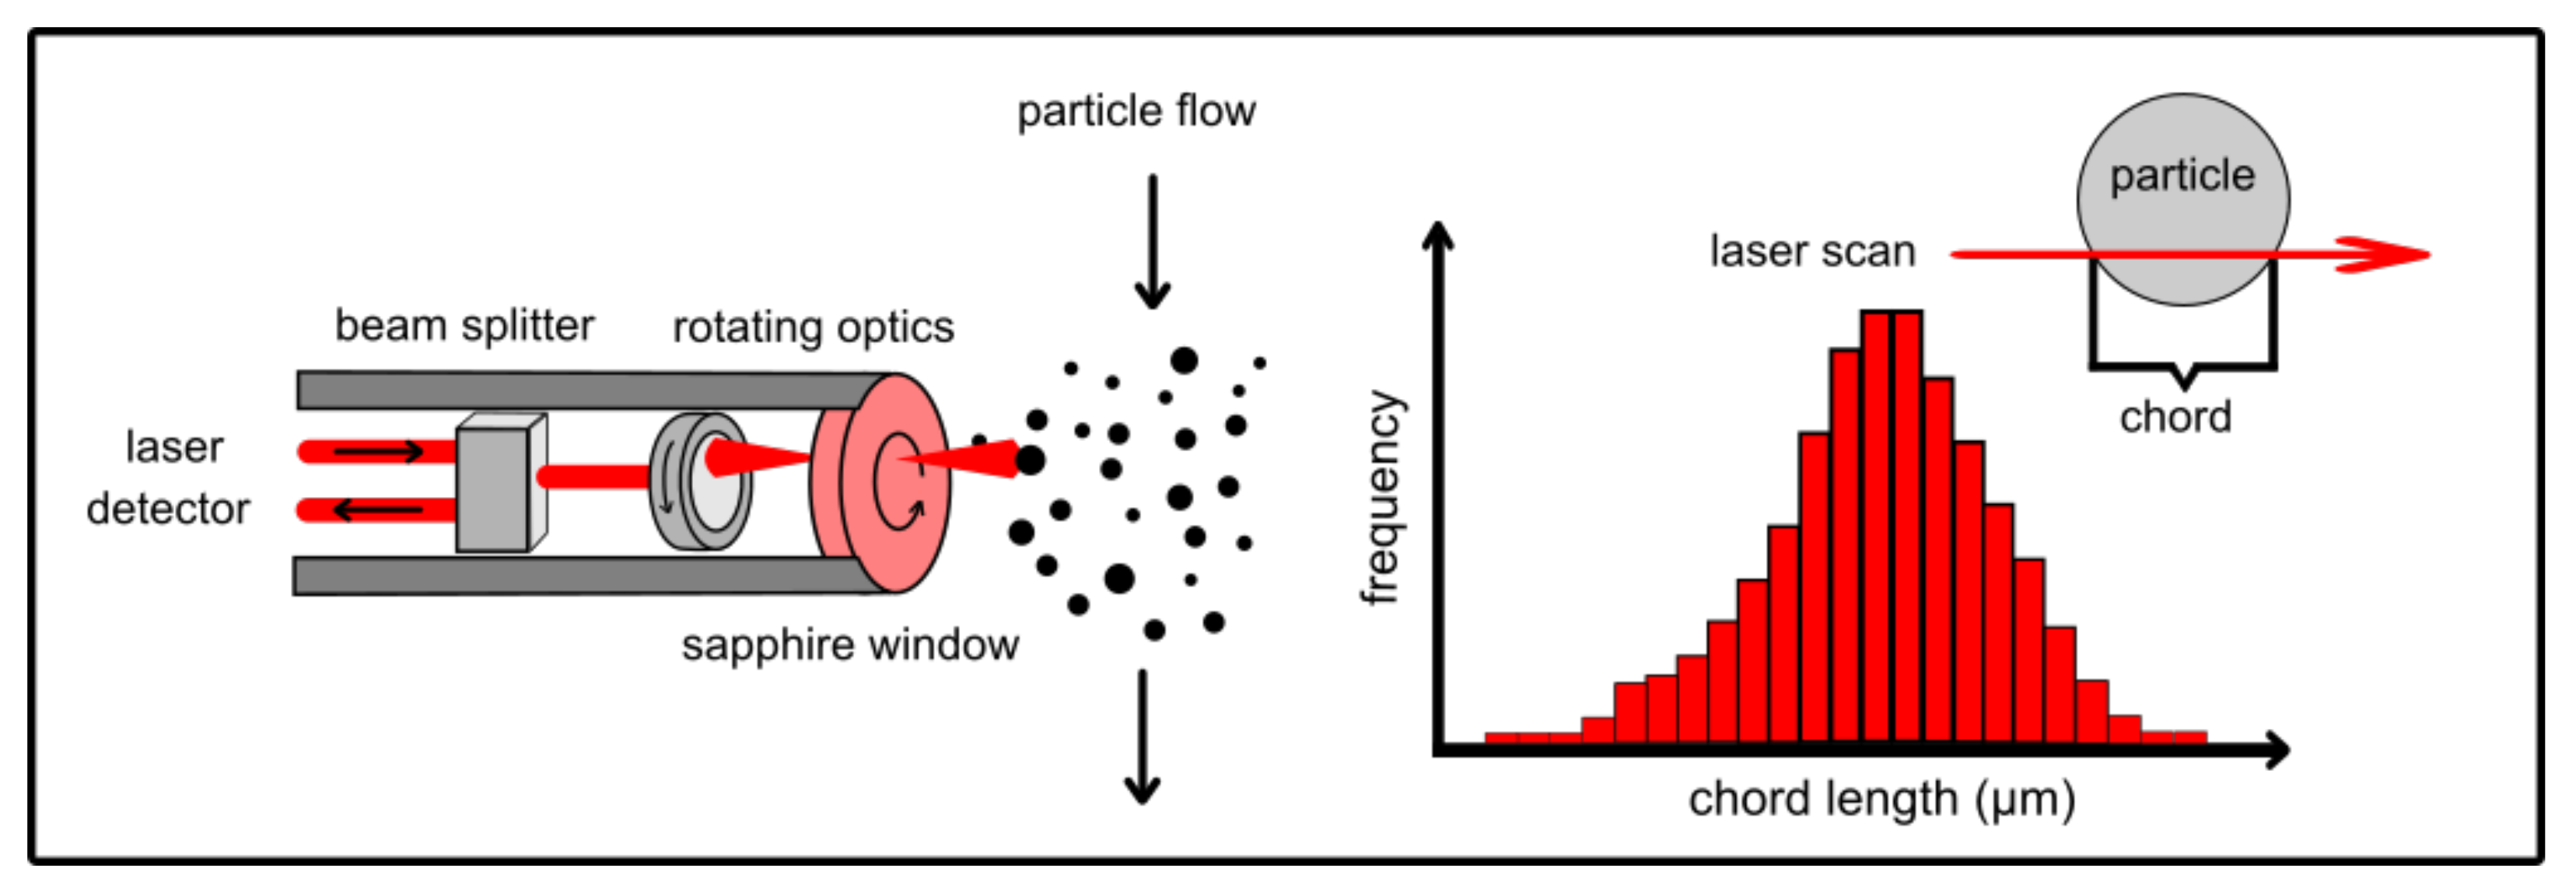
4.6. Laser Scanner Technology

In laser scanner technology, a 791.8-nm laser beam emitted by a rotating probe is transmitted by fiber optics to the probe tip and projected through a sapphire window into the emulsion, where it sweeps the particles or emulsion droplets at 4 m/s. The backscattered beam is measured as a chord length distribution (CLD) representing the number of particles in each size class (Figure 8).
This focused beam reflectance measurement (FBRM) has been used for the inline monitoring of water droplets in a bitumen emulsion to study the demulsification dynamics of ethyl cellulose [75]. The authors considered the influence of various process parameters on the size distribution of silica particles in de-ionized water in a stirred tempered vessel. In a rotation speed range of 65–740 rpm, the unweighted CLD showed matching distribution values for six stirrer speeds. When the speed exceeded 460 rpm, the square-weighted CLD included some noise representing large particles due to entrained gas bubbles [76]. For two different particle concentrations (1% and 5% w/v), FBRM detected a greater number of particles when the stirrer speed remained below 300 rpm, but the effect on the particle number became less significant when the stirrer speed exceeded 400 rpm. To confirm that FBRM can accurately determine the particle concentration and size distribution in a stirred process, particles in the concentration range 0.5–10% (w/v) were measured at a stirrer speed of 400 rpm. As expected, there was a linear relationship with the particle concentration, but the unweighted mean chord length did not vary with the changing particle concentration.
The unweighted CLD better represents finer particles whereas the square-weighted CLD better represents larger particles [77]. To determine the sensitivity of particle size distribution measurement, the CLD was measured for silica 40 and silica 15 particles as well as a 1:1 mixture, all prepared as 5% (w/v) suspensions. The measured values could be distinguished for the individual silica 40 and silica 15 particle suspensions as well as the mixture, but the square-weighted CLD achieved a cleaner separation than the unweighted CLD. The representativeness of the CLD was calculated manually based on the individual CLD values of silica 15 and silica 40 at the known mass ratio. FBRM showed that the CLD was unable to determine whether an increase in the chord length was caused by flocculation or the coalescence of the emulsified droplets. This was examined in detail by the emulsification of water in bitumen using an EC4 demulsifier. When the emulsifier was added to the water droplets (2–5 µm in size), the chord length increased for 120 s before stabilizing. Droplet counts in the size range 1–10 µm initially increased then decreased and became stable, whereas the remaining size range for larger droplets increased after adding the demulsifier and stabilizing. This phenomenon reflects the initial increase in the number of droplets in the size range 1–10 µm caused by the coalescence/flocculation of droplets <1 µm, which are outside the FBRM metering range. The subsequent stabilization of the droplets occurs because the measured chord length does not correspond to the particle diameter, given that large and irregular particles can produce several chord lengths, a phenomenon known as chord splitting [78].
An algorithm was developed to convert the CLD into a droplet diameter distribution (DDD) in a population of spherical droplets [79]. This work involved the adaptation of FBRM technology to the needs of the petroleum industry for the characterization of crude oil (dark liquid/liquid mixture). A suspension of solid polytetrafluoroethylene (PTFE) particles of known size and refractive index was analyzed by FBRM and environmental scanning electron microscopy, showing good agreement between the methods. The data revealed the absence of any light diffraction or errors induced for spheres with chord lengths exceeding 2 µm. When the particle average size increased, the relative error of the median particle length also increased, reflecting the deviation from a spherical shape. For particles in the size range 1–100 µm, the statistical indices varied by <11%. The FBRM probe was in sensitive to particle concentrations of 50–100 g/L and the increasing number of counts. Crude oil samples with various physicochemical properties were used as the continuous phase, forming a 10% (v/v) water-in-crude-oil emulsion prepared with increasing mixing power. PCA confirmed a good fit between the DDD values obtained by FBRM and microscopy. Spherical polymethylmethacrylate (PMMA) particles dispersed in water as the continuous phase were transparent to near infrared light and thus undetectable by FBRM, although the number of particle counts fulfills the sound statistic. Finally, an exact measurement of the DDD was not possible in a PMMA-in-crude-oil emulsion system.
FBRM has also been used to examine the separation of crude oil in oil-water separators under process conditions [80]. The study was conducted by installing the DDD measurement probe in a pipe spool, allowing fluid streams to be sampled at six different heights in a 45 × 4.3 m horizontal separator vessel. The fluids entering this vessel at the base were separated and the water withdrawn, so that dehydrated oil is removed from the top of the vessel. The continuous operation of the vessel therefore generates three layers: water, emulsion and oil. FBRM technology allowed the in-process measurement of the DDD for droplets ranging in size from micrometers to ~0.8 mm, capturing the decline in droplet diameter from the water/oil interface to the vessel outlet. FBRM technology opens up possibilities for the chemical screening of demulsifiers and dosage testing to optimize separation process parameters.
Another industrial application of FBRM is the monitoring of polymer-induced flocculation, as required for net-energy positive wastewater treatment [81]. The performance of 24 cationic polymers differing in size and charge was evaluated by FBRM during polymer-induced flocculation as part of an anaerobic digestion process. A comparison with capillary suction time (CST) tests showed a decreasing monotonic trend between the two methods when quantifying particle removal for all types of polymers. The molecular weight and charge density of the different polymers had no effect on either method. At the lower polymer dose range, there was a correlation between the CST and FBRM values. The percent removal determined by FBRM was similar for different substrates, whereas the CST values were higher than anticipated for food waste, suggesting that the results are not representative of the true performance of these polymers with full-scale dewatering equipment. FBRM technology is therefore suitable as a PAT tool for the real-time monitoring of polymer-induced flocculation for different digestate sources across a wide range of polymer types and dosages.
FBRM technology has been used to investigate the hydrate slurry formed from tetra-n-butylphosphonium (TBPB) in water in order to understand system phase changes and rheological behavior [82]. Hydrates are used as phase change materials for industrial thermal energy storage, air conditioning, refrigeration, natural gas hydrate transportation, the prevention of pipeline blockages, and gas capture. Before analyzing the hydrate slurry, the FBRM probe was calibrated by comparing the resulting CLD to that determined by videomicroscopy using polyamide seeding particles of 20 or 50 µm suspended in ethanol. The videomicroscope provided a particle size distribution, which was converted toa CLD using an algorithm [82]. The CLD values for both measurement techniques agreed well for both particle types, as well as the Sautermean chord length with differences of 10% for the 20-µm particles and 2% for the 50-µm particles. The greater difference for smaller particles reflects the detection limit of 5 µm for the videomicroscope, whereas FBRM overestimates for smaller particles (≥1 µm) due to the weakening of the laser beam with distance from the sapphire window [82,83,84]. In addition, the effect of stirrer speed (200–1000 rpm) on the CLD was tested using salt solutions. Without hydrates, the square weight counts were negligible (<6 µm/s) over the entire stirrer speed range, although higher stirrer speeds (400–1000 rpm) probably introduce gas bubbles into the medium. In the presence of hydrates, square weight counts of ≤800 µm/s were observed, with a weak effect of the stirring rate shifting the distribution curve [84]. Furthermore, increasing the high stirring rate too much can generate bubbles or centrifugal forces that eject particles to the beaker wall [83]. FBRM enables the evolution of TBPB-hydrate crystal chord lengths to be observed in a liquid mixture (solid fraction = 21%w/v), a growing nucleate, and at the fully developed crystal stage, which increases the total number of counted particles. For a deeper understanding of this phenomenon, the square-weighted mean chord length was converted into a particle mean size represented by a bimodal distribution. These data were correlated using a Gaussian mixture model (a linear combination of two normal distributions) yielding a method that fitted well with the experimental data.
Another interesting study used FBRM to identify phase inversion during the commercial alkylation of isobutene with light olefins [85]. A chloroaluminate ionic liquid–heptane dispersion in a stirred vessel was investigated as a model system and the phase inversion behavior of n-heptane and an acidic ionic liquid was identified by the square-weighted mean chord length [79] using FBRM and a video microscope. A pronounced increase in chord length at the transition point corresponding to phase inversion indicated the formation of a continuous dispersion in the ionic liquid [86]. The breakup-dominated dispersion was indicated by the logarithmic normal distributed dispersion of the drop size distribution (DSD) as well as the damping effect of the dispersed phase on turbulence, as revealed by the shift to a larger DSD droplet size as the holdup of heptane increased. Finally, a semi-theoretical correlation for the Sauter mean diameter based on Shinnar theory [87] and modified to include the effect of the dispersed phase holdup was proposed:
d32/D = b1(1 + b2Φ)(ReimpWeimp)−1/3
where d32 is the Sauter mean diameter, D is the diameter of the impeller, Φ is the holdup volume fraction of the dispersed phase, Reimp is the impeller Reynolds number, Weimp is the impeller Weber number, and b1 and b2 are constant values in the correlation of d32. The experimental data agreed well with the calculated d32 (coefficient of determination R2 = 0.997). This work will allow the knowledge-based development of ionic liquid-catalyzed alkylation (ILA) reactors, especially the design of the impeller region in stirred-tank reactors.
To gain insight into hydrate formation and prevention in oil flow line facilities and to determine the optimal dose of thermodynamic hydrate inhibitors, an FBRM probe and a particle vision microscope (PVM) were introduced into a model Archimedes flow loop for the scaled-down analysis of liquid/liquid flow in deep sea pipelines [88]. The emulsion (consisting of ultra-pure water, organic liquid phase material, and a low-dosage hydrate inhibitor) is formed by shear between the pipe wall and the liquid mixture. The inline sensors were installed to achieve a better understanding of methane hydrate formation (mainly agglomeration) by recording the CLD (FBRM) and PVM images of the emulsion depending on the volume fraction (90–30% v/v) and the flow rate of water and the continuous phase (200 and 400 L/h). A model was validated with experiments in which a mixture of ultra-pure water and the organic liquid (with or without the additive) was fed into the flow loop followed by FBRM and PVM analysis as well as measuring the pressure drop and density. The CLD was measured precisely by defining three FBRM results based on chord lengths of <10 µm, 10–100 µm, and >100 µm. This study showed that it is possible to deduce the nature of the emulsion continuous phase from the CLD measured by FBRM. Without the additive, the first hydrate crystals appeared at the interface of the emulsion for high and intermediate volume fractions, characterized by a pressure drop and a corresponding decrease in the CLD mainly for the intermediate classes (10–100 µm). A change in the reflective characteristics due to the formation of methane hydrate crystals modified the CLD detected by the FBRM probe. The number of particles detected by FBRM depends on the particle reflection and thus on the reflective characteristics of the external phase [89]. If oil is the continuous phase, the chord length number does not decrease during the nucleation step because hydrate formation changes the external phase. The main difference caused by the presence of the additive is a steep decrease in hydrate formation beginning around the nucleation step, caused by the oil continuous system. Evidence of growth and agglomeration were detected by a decrease in the FBRM chord length number for the smaller class (<10 µm). The major result of the study was the description of a method to deduce the nature of the continuous phase with the middle class (10–100 µm) in experiments without the additive and for the small class (<10 µm) in experiments with the additive by measuring the chord length number using an FBRM probe.
FBRM was applied in the evaluation of a 15% (v/v) hazelnut oil-in-water emulsion, including the effect of surfactants and stirring systems in a stirred tank [90]. To evaluate the effect of agitation speed on the droplet size distribution, FBRM was used to measure the CLD, focusing on the effect of surfactant type and concentration, and mixture hydrodynamics, on the emulsion stability. The dimensionless mean chord length was successfully correlated with the Weber number, resulting in a regression value of 0.971. This showed good agreement with previous empirical correlations [91,92,93] in which FBRM was used in a microcapsule production process to monitor the particle size of emulsion droplets inline during their conversion to stable particles. This can identify the parameters that must be optimized to improve drug release or encapsulation. In terms of controlling the preparation of such micro particles, it is important to determine the rate and timing of conversion from liquid droplets to solid particles. Microcapsules were prepared in a stirred reactor with a propeller stirrer (500 rpm), and the FBRM probe was placed in the turbulent region between the stirrer and the reactor wall. During solvent evaporation and emulsification of the inner organic and outer aqueous phases, the emulsion droplets solidify and the particle size changes. The objective of this study was to evaluate the ability of FBRM to monitor the shift from emulsion droplet to solid microparticle during solvent evaporation [90] compared to accepted offline methods (sieve analysis, optical microscopy and laser diffraction). Few studies thus far have monitored the formation of microparticles online. Polymeric microparticles of 51–83 µm were analyzed by FBRM and there was no difference in the reported size compared to offline methods. FBRM thus provides the same results online and in real time as offline methods that require sampling and possible sample preparation (dilution). Moreover, FBRM allows the inline observation of particles as they form without affecting the morphology or number of particles. Based on these data, the mean particle sizes measured as square-weighted mean chord lengths determined by FBRM were better than those calculated by microscopy, as indicated by the lower standard deviations.
FBRM reveals the transition of emulsion droplets into solid microparticles and agglomerates by detecting a signal shift caused by the surface features of the particles and their optical properties. This insitu measurement technique has been widely used to monitor crystallization. Models are used to predict the effects of process variables on inline measurements using FBRM technology. Two quantitative crystal size/chord length distribution (CSD/CLD) models (one theoretical, the other empirical) have been developed and validated for the continuous crystallization of carbamazepine (CBZ) during cooling [94]. The precision and robustness of FBRM, as well as the influence of process variables on the method, were evaluated using CBZ crystal sand ideal spherical bodies with a uniform distribution. Experiments were performed in a 400-mL round-bottom glass reactor with a triple upwardly directed paddle stirrer, a constant stirring speed and a constant concentration of solids. Greater precision was observed for the square-weighted mean chord length compared to CBZ total counts, but the root mean square deviation (RMSD) was less than 5%. The robustness of the instrument was evaluated by varying the stirring speed (200–400 rpm) and the solids concentration (5–50%), both of which affected the FBRM results.

4.7. Photo-Optical Sensors and Image Analysis

Photo-optical probes record images of the particle stream, which are then converted into a particle size distribution by special image processing and image analysis algorithms that detect and count the individual particles. Several different probe systems have been described, most of which consist of endoscope or microscope optics, a camera, a stroboscope for flash generation, and a control unit. Good illumination is needed to acquire sharp images of fast-moving particles. The PVM discussed above is a special form of photo-optical sensor, which uses six laser sources arranged in a circle at an angle of 60° around the objective tube. They illuminate a fixed area within the process medium (Figure 9). Image analysis combined with insitu microscopy is the only method that directly reveals the particle shape and the presence of agglomerates in suspensions.
This approach has been applied in a stirred-tank reactor to measure droplet sizes in a toluene/water system compared to three optical methods based on laser backscattering: FBRM, two-dimensional optical reflectance measurement (2D-ORM), and a fiber-optic FBRM sensor [95]. The three latter methods reported different drop size distributions for the same stirred system, but the endoscope reported much higher values (10 times higher than the FBRM sensor and 15 times larger than the 2D-ORM device). Similarly, the sizes reported by FBRM were smaller than those obtained using a PVM when applied to emulsions, but they were larger when measuring glass particles in water [83]. In comparison, the endoscope showed the clearest differentiation in drop size for a numerical density distribution. The other two sensors suggest this effect only for a distribution by means of volumetric density. For the in-process evolving Sauter mean diameter, all three sensors reflected the physical behavior of the stirred system but two effects were visible. The two rotating laser probes reported smaller drops than the endoscope, and no backscattering technique reported the transient behavior caused by breaking and coalescing effects. A comparison of the steady-state Sauter mean diameter for three different power inputs showed that the FBRM sensor remains close to the endoscope but does not report the increased power input (d32~(P/V)+0.04). The 2D-ORM method was similar in terms of proportionality (d32~(P/V)−0.08) to the endoscope probe (d32~(P/V)−0.07), reflecting the changing Sauter mean diameter at different power inputs. The FBRM sensor roughly reflected the power density in the steady-state Sauter mean diameter (d32~(P/V)−0.11). The particle surface can influence the results obtained by laser backscattering. Measuring the Sauter mean diameter by introducing TiO2 into the system shows an increase for the FBRM sensor but the endoscope results were unaffected.
For the automated counting of particles, a three-step image recognition algorithm has been developed using MATLAB [96]. The first step (pattern recognition) involves the correlation of search patterns and pre-filtered images, followed by the pre-selection of circle coordinates in the second step and classification by exact edge selection in the third. In a dilute liquid/liquid system with a low dispersed phase fraction (φ =2% for a toluene/water system), the cumulative number distribution Q0(dp) was similar for manual and automated detection. The number density distribution q0(dp) showed a narrow distribution for automatic counting, caused by doubling the number of counted particles (n = 553 by automatic counting as opposed to n = 301 by manual counting). This led to a difference of 2.7% in the Sauter mean diameter. For a highly concentrated liquid/liquid system with a high dispersed phase fraction (φ = 45% for an n-butyl chloride/water system) good agreement between manual and automated counting was achieved for the Sauter mean diameter, with a deviation of 4% (d32man. = 175.8 µm, d32autom. = 182.9 µm). Finally, drop size monitoring was carried out in a slim stirred reactor (blade impeller, H/T = 5.0, D/T = 0.6) with the same liquid/liquid system and two parallel endoscope probes with manual (top of the reactor) and automated (base of the reactor) counting. Only values of the former n-butyl chloride experiment were used for the image algorithm. Due to the slim reactor design and the difference in density between the two organic components, the continuous phase changed from an oil phase at the top to a water phase at the base of the unstirred reactor. After starting the mixing process, the continuous phase distribution became homogenous over time. The initial distribution differences were indicated as expected by the differing Sauter mean diameter reported by the two probes. In addition, the intermediate formation of multiple emulsions was detected by the probes. After reducing the stirrer speed and stabilizing the system with polyvinyl alcohol, a homogenous distribution was achieved. This system behavior could be detected using the endoscope, in good agreement with previous studies published by the same group [97,98] and others [99,100]. Both manual and automated analysis showed a size deviation of less than 10% when measuring 100 drops for each data point.
An inline microscope was also used to monitor the continuous crystallization of acetaminophen in a tubular crystallizer containing acetone–water [101]. This involved the successful use of an ultrasonic probe and also a rotor-stator mixer for nucleation. Both devices produce high shear forces and gas bubbles. For both devices, the inline microscope showed that increasing the input power significantly reduced the induction time. Another inline image monitoring system known as dynamic image analysis (DIA) was developed for the continuous crystallization of acetylsalicylic acid [102]. This system was used for the first time in a continuous mixed suspension mixed product removal (MSMPR) crystallization process. Particle size, size distribution, shape, and polymorphic shape are key parameters during the crystallization of pharmaceuticals because they strongly influence all downstream process steps, as well as bioavailability. A high-speed process camera and custom-developed software were used to capture inline images of the crystal suspension, and different camera and illumination setups were tested to obtain images with the best quality, allowing a very short exposure time of 250 μs. The data were converted to crystal size distributions and compared with offline analysis results. After a random comparison of the DIA method and conventional offline particle size measurements, both methods were shown to report similar trends for all parameters except the mean crystal size. The use of Ki-based segmentation is envisaged for the analysis of crystals using this technique.
For the crystallization of acetaminophen, a flexible and reliable image analysis algorithm was developed to monitor and control the crystallization processes [101]. The algorithm is based on the edge detection of particles using intensity thresholds combined with an advanced watershed to segment overlapping particles. A simple flow-through imaging system has also been developed, consisting of a modified optical microscope, a flow-through cell, and a stroboscopic light source to enable image blurring. To validate the algorithm, the size, number, and concentration of particles were measured over a wide range of solid concentrations using glass spheres as well as crystals of adipic acid, acetaminophen, and miconazole nitrate. The greatest challenges for the algorithm included the segmentation of overlapping particles and the quality of the image due to out-of-focus particles. The image processing steps were divided into three phases: preparation (pre-processing), segmentation, and post-processing. The preparation steps remove background artifacts such as scratches or stuck particles, thus enhancing the image for subsequent segmentation. The segmentation step separates the foreground elements from the background, using canny edge detection to mark pixels that are above a certain threshold. In the final post-processing step, the segmented binary images are processed by morphological closure, filling holes and separating overlapping particles. Subsequent image analysis then detects individual particles using specified image processing parameters, and further data analysis determines the areas and the number of particles to calculate the equivalent spherical diameter of a particle. Canny edge detection combined with thresholding and watershed detected irregular particles. Impairments of the particle size distribution were mainly caused by overlaps and aggregates, which reduced the reliability of the volume-based results. These effects were pronounced at higher concentrations of solids. In addition, the presence of air bubbles favored the formation of larger aggregates.

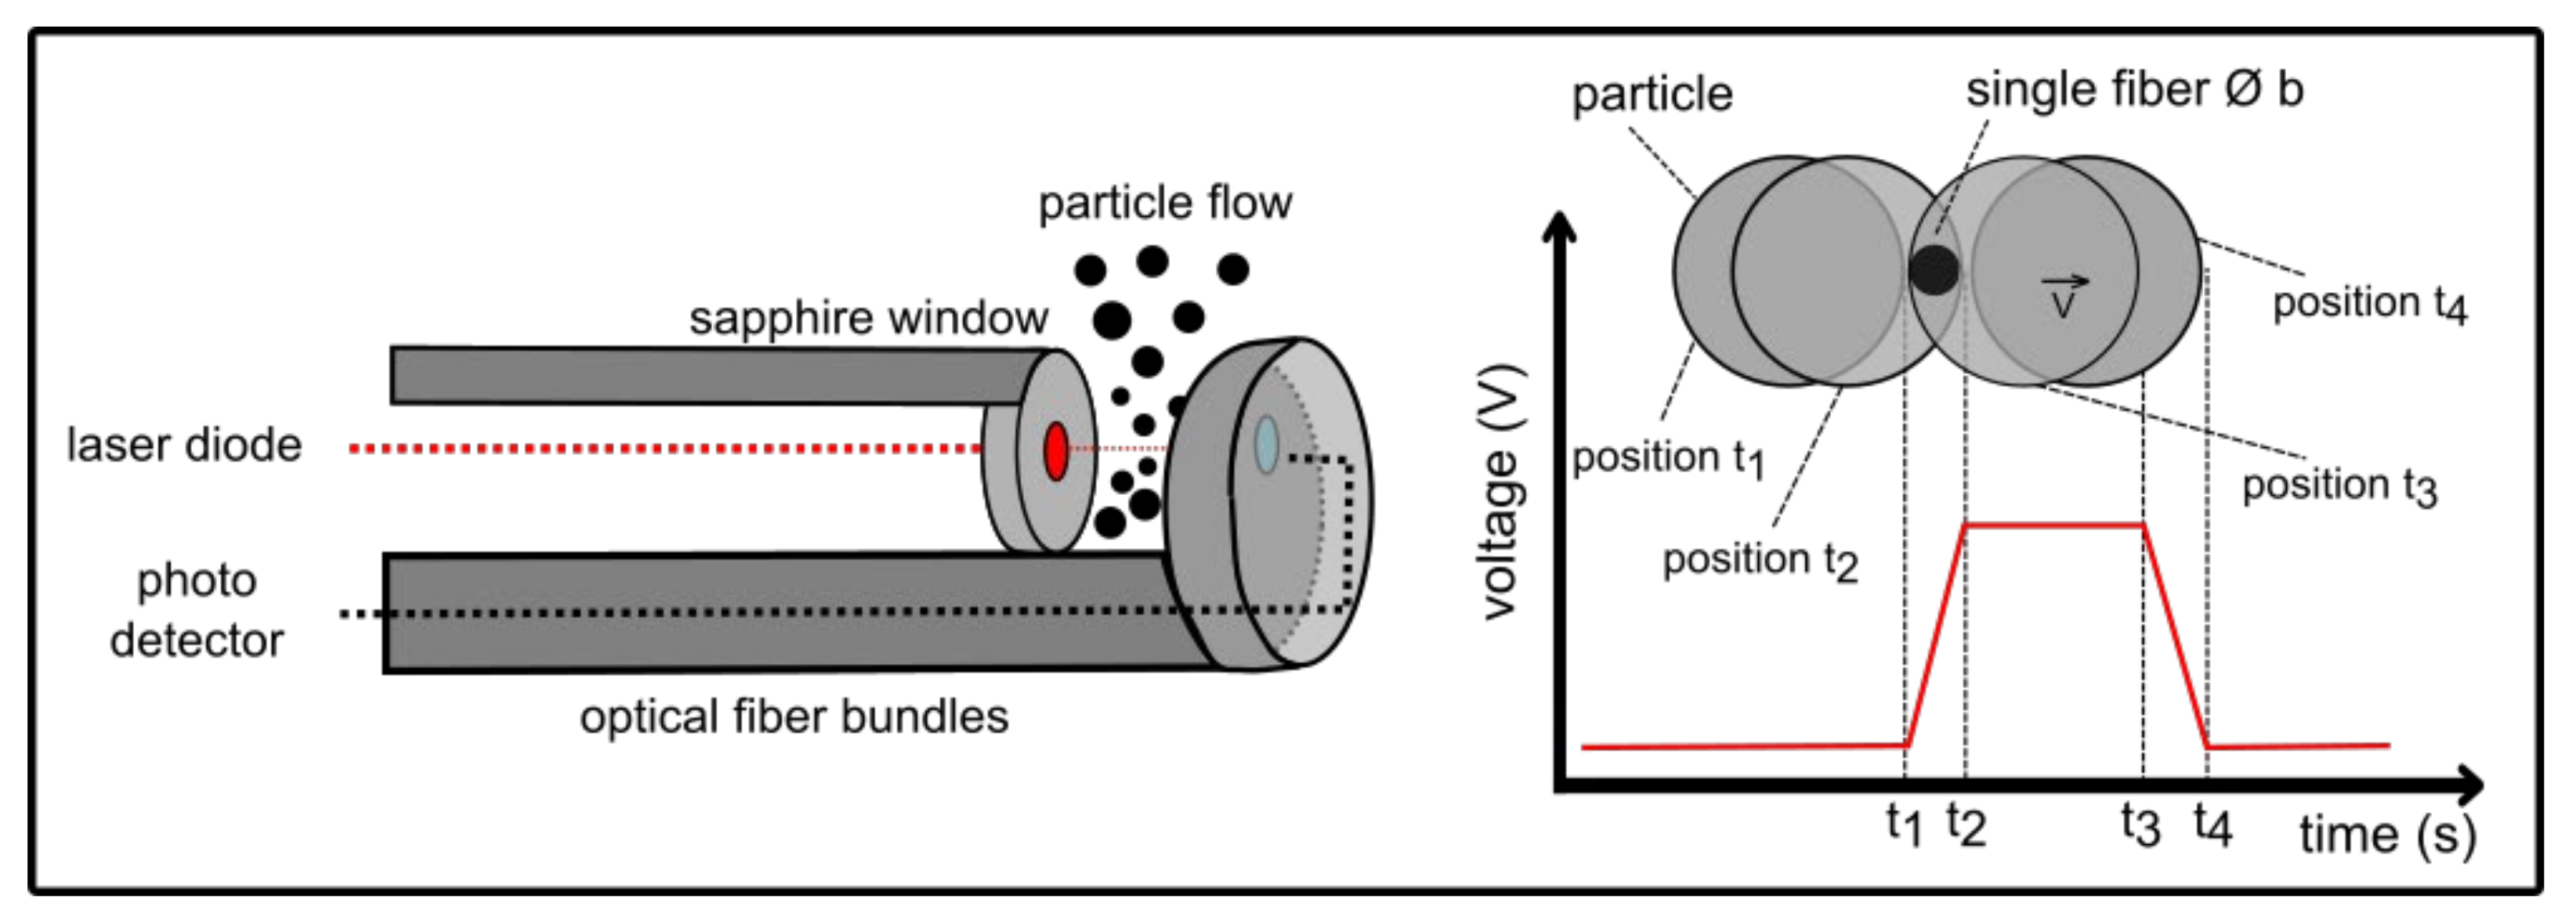
4.8. Spatial Filtering Technique

Finally, the spatial filtering technique (SFT) uses a laser source, a narrow capillary (spatial filter) and a photo detector to detect individual particles entering the capillary and thus interrupting the laser beam. Depending on the particle size and velocity, a shadow will be generated, whose size and duration can be converted to an impulse that is recorded as the particle size and velocity.
The real-time sizing of particles in different technical applications (Wurster coating, mixing, milling, spray drying, crystallization, fluid-bed granulation and high-shear wet granulation) has been descried for a modified SFT with a fiber-optic spot, which observes the shadow image of a particle moving through a single optic fiber [103]. The shadow image generates an impulse of a certain width, which is dependent on the particle size (Figure 10). The study showed the suitability of an IPP 70 inline SFT instrument (Parsum, Chemnitz, Germany) by using flushing cells and inline disperser units to measure particle sizes of 50–6000 µm with a velocity of up to 50 m/s. The feasibility of the SFT as a PAT tool was also established, using the same sensor system for a fluid bed granulation process [104]. Several process and formulation variables were studied using a two-level full factorial experimental design (DoE) to compare the inline SFT and offline laser diffraction. The results showed a consistent trend with significant deviations in the D10, D50, and D90 values (the size below which 10%, 50%, or 90% of all particles are found), but these were traced back to system errors caused by wall collisions during the laser diffraction measurement. The study suggests that the SFT is sensitive to changes in particle size during granulation. For the same process, the insertion depth, rotation angle, and sensor position were shown to affect the inline particle size determination and reliability [105]. The deceleration zone below the spraying nozzle of the granulator generates better particle count rates than the conical product container. The data were most reliable when the probe was placed 11 cm from the chamber wall, avoiding bias caused by the inlet air stream. The authors recommended the offline validation of measurements using laser diffraction for new product formulations.

5. Conclusions

5.1. Considerations for the Manufacturing of Parenteral Lipid Emulsions

The efficiency of emulsification in stirred tanks is directly related to the material flow within the vessel. For the large-scale production of highly viscous emulsions, sufficient material flow cannot be guaranteed, resulting in heterogeneous temperature zones and the uneven distribution of materials. The emulsifying shear zone in a rotor-stator stirrer is small, so the material is not processed uniformly. In slow, coalescence-controlled emulsification processes, such small emulsifying shear zones lead to a broad droplet distribution. Accordingly, the pre-emulsion is usually characterized by multimodality with pronounced instability. The target globule size as specified in the USP is therefore achieved after recirculated processing by high-pressure homogenization. However, the quality of the pre-emulsion is a decisive factor for this process step, and the presence of single large drops beyond the specification limits is a risk to patients [12]. The globule size and size distribution are therefore monitored statistically using offline techniques after high-pressure homogenization, as recommended in the USP. Inline analysis, which can detect large droplets during the process, would minimize such risks. Additional methods should be used, especially the determination of the zeta potential, in order to make statements about stability [15]. Such effects have been demonstrated by stability check-ups, which reveal the challenges between the characterization of the current size distribution and the further stability of the emulsion [2].

5.2. Regulatory Considerations for the Aseptic Processing of Parenteral Lipid Emulsions

Sterile processing directly affects patient safety and is therefore one of the most regulated areas of manufacturing. The risk of contamination in the pharmaceutical environment is lower than in the clinical environment [35]. Major sources of contamination include personnel working in cleanrooms, water as the main component of parenteral emulsions, surfaces, and the air in the cleanroom [37]. In addition, contamination rates should be reported to verify the competence of aseptic techniques, and a risk assessment is recommended for contamination and infection with different types of pathogens and different preparations, with an additional consideration of the cost-effectiveness of both production environments [35]. Additional risks of contamination arise during aseptic filling. The surfaces of the bottle neck, stoppers, and the filling needle pose risks directly related to the specifications of the container dimension [42].

5.3. PAT for Inline Droplet Monitoring

Our comprehensive literature review compared current and emerging technologies for inline particle analysis and evaluated their suitability for PAT in an emulsification process for the production of parenteral lipid emulsions. We focused on industrially relevant technology that is already commercially available or may be suitable in the future. We compared methods that allow emulsions to be characterized in terms of droplet size and distribution. Manufacturing processes for parenteral formulations have two principal requirements. First, it should be possible to sterilize and adapt the probe insitu so that inline analysis does not interfere with the aseptic process conditions. Second, the method should also provide data in real time and should distinguish particles from entrained gas bubbles (or should not be subject to interference form gas bubbles under the applied process conditions). With regard to the final properties of parenteral lipid emulsions, the following requirements can be added: the product should neither be altered by the PAT method nor require dilution, and it should be possible to measure highly concentrated emulsions. To ensure the process meets USP requirements for mean particle diameter and the pFAT5 threshold for patient safety, PAT methods must cover the wide particle size distribution in the fine emulsion (<1 µm) as well as manually detect single large droplets (>1 µm).Large droplets that fall outside the specification limits of the product can be formed early in the process during initial mixing and may cause embolism in the patient. For subsequent fine emulsification by high-pressure homogenization, the quality of the pre-emulsion is therefore a decisive factor.
Our literature review revealed a variety of technologies based on acoustics, impedance, laser backscattering, or photo-optics for inline particle characterization, which have already been applied successfully in many different processes. There is no method that completely satisfies the requirements profile discussed above. Therefore, a combination of methods is best for process analytics and patient safety. Laser scanner technology is a promising method that benefits from minimal maintenance, minimal calibration requirements, a compact size, and validity over a wide range of operating conditions [90]. It is suitable up to a volume fraction of 30% (v/v) [106], requires no sample dilution, can be used inline, and has a measurement range of 0.5–2000 µm [107]. It is ideal for monitoring during the fine emulsification of the product in the lower particle size range. However, the measurement can be influenced by many properties of the sample, including the particle shape (or a mixture of different particle shapes), the number of phases, the particle orientation, the particle concentration, the refractive indices of the continuous and dispersed phases, and the particle surface [94]. These influences are limited in emulsions due to the spherical particle shape, but must be considered for successful integration. The process conditions also influence the measurement system, particularly the agitation speed (which affects the material flow) and the formation of multiphase systems due to gas entrainment, which affects the number of particles counted and thus the measurement of chord length. The FBRM probe can detect bubbles that would otherwise affect the measurement [108]. Higher speeds increase the number of particles that are counted, which in turn influences the reported chord length. Furthermore, the backscatter of the FBRM probe is strongly dependent on the surface properties of the particles. Particles with smooth surfaces that are highly prone to reflection underestimate the actual particle size, whereas transparent emulsion droplets usually produce signals that overestimate the particle size. Therefore, care should be taken during the integration of the probe to ensure a well-mixed system and the influence of the stirring speed on the system should be investigated. In addition, the reflective properties of the droplets should be considered and the corresponding results should be evaluated critically.
Acoustic methods based on ultrasonic attenuation spectroscopy can measure the particle size distribution even in very concentrated, opaque emulsions up to 70% (v/v). However, 14 parameters pertaining to the continuous and dispersed phases must be known [106]. Photo-optical methods combine an inline microscope, which obtains image data directly from the reactor, with image analysis software that converts the data into particle distributions. This provides the highest density of information from process analytics and is the only method that can detect single droplets isolated from other signals. It is therefore able to detect single large droplets during the process as an important form of safety analytics. Image-based systems have proven superior to laser backscattering or spatial filter velocimetry for particle sizes >1 µm. However, one of the disadvantages of image analysis is the measurement of high particle concentrations, which strongly depends on the depth of field, particle size, particle shape, and the image analysis algorithm [106]. The detection of droplets requires specialized software, which must be developed uniquely for each process. The quality of the image is closely linked to the cost of the image acquisition system, with flow-through devices providing the highest quality images but these must be adapted to the system under investigation. For GMP-regulated environments, solutions must also be found to store and archive the large amounts of image data. In conclusion, today’s PAT technologies offer good opportunities to improve the manufacturing processes for parenteral lipid emulsions in terms of process understanding and patient safety.

6. Outlook and Future Perspective

In comparison to other techniques, both acoustic and optical methods are sophisticated methods for monitoring the emulsion forming process. Over the past decade, the literature review has indicated an increasing trend of research and development activities for laser scanner technology and image generating sensors. A large community of authors successfully applied FBRM technology, PVM technology, and photo-optical sensors in crystallization, flocculation, and emulsification processes. However, to date, there is no publication showing integration for the production of parenteral lipid emulsions. For the future, these methods could function as appropriate methods to increase product safety. Both methods offer the possibility to count single droplets. The counting combined with evaluation algorithms could make an inline measurement of the pFAT5 value possible. This allows the development of a control strategy that suppresses the formation of large droplets at an early stage of the production. Since PAT is expected to become the norm for many products, it is also technical possible for parenteral emulsions to use PAT technologies to increase process understanding, control and product efficiency.

Author Contributions

Conceptualization, C.G. and P.C.; validation, C.G. and P.C.; resources, P.C.; writing—original draft preparation, C.G.; writing—review and editing, C.G. and P.C.; visualization, C.G.; supervision, P.C.; project administration, P.C.; funding acquisition, P.C. All authors have read and agreed to the published version of the manuscript.

Funding

This research was financially supported by B. Braun Melsungen AG and the University of Applied Sciences Mittelhessen.

Institutional Review Board Statement

Not applicable.

Informed Consent Statement

Not applicable.

Data Availability Statement

The data that support the findings of this study are available from the corresponding author upon reasonable request.

Acknowledgments

The authors acknowledge Richard M. Twyman for editorial assistance.

Conflicts of Interest

The authors declare no conflict of interest.

References

  1. Agalloco, J.; Akers, J.; Madesen, R. The Future of parenteral manufacturing. In Parenteral Medications, 4th ed.; CRC Press: Boca Raton, FL, USA, 2019; ISBN 9781498719148. [Google Scholar] [CrossRef]
  2. Cardona, D.; Nadal, M.; Estelrich, J.; Mangues, M.A. Review of drug stability in parenteral nutrition admixtures. e-SPEN J. 2013, 8, e135–e140. [Google Scholar] [CrossRef]
  3. Driscoll, D.F. Pharmaceutical and Clinical Aspects of Lipid Injectable Emulsions. J. Parenter. Enter. Nutr. 2016, 41, 125–134. [Google Scholar] [CrossRef] [PubMed]
  4. Rosi Cappellani, M.; Perinelli, D.R.; Pescosolido, L.; Schoubben, A.; Cespi, M.; Cossi, R.; Blasi, P. Injectable nanoemulsions prepared by high pressure homogenization: Processing, sterilization, and size evolution. Appl. Nanosci. 2018, 8, 1483–1491. [Google Scholar] [CrossRef]
  5. Boullata, J.I.; Mirtallo, J.M.; Sacks, G.S.; Salman, G.; Gura, K.; Canada, T.; Maguire, A. The ASPEN Parenteral Nutrition Safety Committee Parenteral nutrition compatibility and stability: A comprehensive review. J. Parenter. Enter. Nutr. 2021, 46, 273–299. [Google Scholar] [CrossRef]
  6. Otero-Millán, L.; Rivero, N.L.; Rodicio, A.B.; Beloso, N.G.; Soto, J.L.L.; Piñeiro-Corrales, G. Stability of lipid emulsion in total parenteral nutrition: An overview of literature. Clin. Nutr. ESPEN 2021, 45, 19–25. [Google Scholar] [CrossRef]
  7. Watrobska-Swietlikowska, D. Stability of commercial parenteral lipid emulsions repacking to polypropylene syringes. PLoS ONE 2019, 14, e0214451. [Google Scholar] [CrossRef]
  8. Driscoll, D.F. The pharmacopeial evolution of intralipid injectable emulsion in plastic containers: From a coarse to a fine dispersion. Int. J. Pharm. 2009, 368, 193–198. [Google Scholar] [CrossRef]
  9. Gonyon, T.; Tomaso, A.E.; Kotha, P.; Owen, H.; Patel, D.; Carter, P.W.; Cronin, J.; Green, J.B.D. Interactions between Parenteral Lipid Emulsions and Container Surface. PDA J. Pharm. Sci. Tech. 2013, 67, 247–254. [Google Scholar] [CrossRef]
  10. Driscoll, D.F.; Ling, P.-R.; Bistrian, B.R. Pharmacopeial compliance of fish oil-containing parenteral lipid emulsion mixtures: Globule size distribution (GSD) and fatty acid analyses. Int. J. Pharm. 2009, 379, 125–130. [Google Scholar] [CrossRef]
  11. Hippalgaonkar, S.; Majumdar, S.; Kansara, V. Injectable Lipid Emulsions—Advancements, Opportunities and Challenges. AAPS PharmaSciTech 2010, 11, 1526–1540. [Google Scholar] [CrossRef]
  12. Forchielli, M.; Bonoli, A.; Bruno, L.; Piro, F.; Stancari, A.; Guarguaglini, A.; Maselli, S.; Pession, A.; Puggioli, C.; Bersani, G. Physicochemical stability assessment of parenteral nutrition admixtures for pediatric patients compounded with different kinds of fish oil-based emulsion. Nutrition 2016, 32, 403. [Google Scholar] [CrossRef]
  13. Forchielli, M.; Bonoli, A.; Preite, I.; Stancari, A.; Maselli, S.; Guarguaglini, A.; Mignini, I.; Masi, M.; Puggioli, C.; Bersani, G. Parenteral nutrition admixtures for pediatric patients compounded with highly refined fish oil-based emulsion: Assessment of physicochemical stability. Clin. Nutr. 2014, 33, 1127–1131. [Google Scholar] [CrossRef] [PubMed]
  14. Télessy, I.G.; Balogh, J.; Szabó, B.; Csempesz, F.; Zelkó, R. Kinetic stability of all-in-one parenteral nutrition admixtures in the presence of high dose Ca2+ additive under clinical application circumstances. Nutr. J. 2012, 11, 32. [Google Scholar] [CrossRef] [PubMed]
  15. Pietka, M.; Klek, S. Parenteral nutrition admixtures for pediatric patients compounded with highly refined fish oil-based emulsion: Assessment of physicochemical stability—Letter to Editor. Clin. Nutr. 2015, 34, 781–782. [Google Scholar] [CrossRef] [PubMed]
  16. Pietka, M.; Watrobska-Swietlikowska, D.; Szczepanek, K.; Szybinski, P.; Sznitowska, M. Nutritional support teams: The cooperation among physicians and pharmacists helps improve cost-effectiveness of home parenteral nutrition (HPN). NutrHosp 2015, 31, 251–259. [Google Scholar]
  17. Sandle, T. Manufacturing and validation, Pharmaceutical Microbiology, 1st ed.; Elsevier Science: Amsterdam, The Netherlands, 2015; Volume 1, pp. 247–255. ISBN 978-0-08-100044-1. [Google Scholar]
  18. Kanuri, P. Science and risk based approach to the process validation—Link from quality by design to process validation. Int. J. Pharm. Sci. Res. 2016, 7, 914–929. [Google Scholar]
  19. Abdellah, A.; Noordin, M.I.; Ismail, W.A.W. Importance and globalization status of good manufacturing practice (GMP) requirements for pharmaceutical excipients. Saudi Pharm. J. 2013, 23, 9–13. [Google Scholar] [CrossRef]
  20. Sandle, T.; Lambda, S.S. Effectively incorporating quality risk management into quality systems. In Achieving Quality and Compliance Excellence in Pharmaceuticals: A Master Class GMP Guide; Saghee, M., Ed.; Business Horizons: New Delhi, India, 2012; pp. 89–128. [Google Scholar]
  21. Muselík, J.; Franc, A.; Doležel, P.; Goněc, R.; Krondlová, A.; Lukášová, I. Influence of Process Parameters on Content Uniformity of a Low Dose Active Pharmaceutical Ingredient in a Tablet Formulation According to GMP. Acta Pharm. 2014, 64, 355–367. [Google Scholar] [CrossRef]
  22. BRiley, S.; Li, X. Quality by Desing and Process Analytical Technology for Sterile Products—Where are we now? AAPS Pharm. Sci. Tech. 2011, 12, 114–118. [Google Scholar] [CrossRef]
  23. Chaudhari, R.A.; Ashok, P.P.; Chetan, S.C.; Chetan, Y.; Kantilal, A.P. Quality by design (QbD): An emerging paradigm for development of Pharmaceuticals. Int. J. Pharm. 2014, 4, 138–146. [Google Scholar]
  24. The World Health Organization (WHO). The International Pharmacopeia, 10th ed.; Parenteral Preparations. 2020. Available online: https://digicollections.net/phint/2020/index.html#d/b (accessed on 3 May 2022).
  25. Brooker, C. Mosby’s Dictionary of Medicine. Edinburgh: Nursing and Health Professions; Elsevier: Amsterdam, The Netherlands, 2010. [Google Scholar]
  26. Sandle, T. Regulatory requirements and Good Manufacturing Practices (GMP). In Sterility, Sterilisation and Sterility Assurance for Pharmaceuticals; Elsevier: Amsterdam, The Netherlands, 2013; pp. 35–54. [Google Scholar] [CrossRef]
  27. Outterson, K. Perspective: Regulation compounding pharmacies after NECC. New Engl. J. Med. 2012, 367, 1969–1972. [Google Scholar] [CrossRef] [PubMed]
  28. Muller, A.; Huisman, I.; Roos, P.; Rietveld, A.; Klein, J.; Harbers, J.; Dorresteijn, J.; van Steenbergen, J.; Vos, M. Outbreak of severe sepsis due to contaminated propofol: Lessons to learn. J. Hosp. Infect. 2010, 76, 225–230. [Google Scholar] [CrossRef] [PubMed]
  29. Khalili, H.; Sheikhbabayi, M.; Samadi, N.; Jamalifar, H.; Dalili, D.; Samadi, N. Bacterial contamination of single- and multiple-dose vials after multiple use and intravenous admixtures in three different hospitals in Iran. Iran. J. Pharm. Res. 2013, 12, 205–209. [Google Scholar] [PubMed]
  30. Zorrilla-Veca, A.; Escandón-Vargas, K.; Brand-Giraldo, V.; León, T.; Herrera, M.; Payán, A. Bacterial contamination of propofol vials used in operating rooms of a third-level hospital. Am. J. Infect. Control. 2016, 44, e1–e3. [Google Scholar] [CrossRef]
  31. De la, T.; Huertas-Jimenez, A.; Silva, Y.; Gonzales, L.; Polanco, C. Endemic IV fluid contamination in hospitalized children in Mexico. A problem of serious public health consequences. Am. J. Infect. Control. 2012, 40, e177–e199. [Google Scholar]
  32. Centers of Disease Control and Prevention. Notes from the field: Multistate outbreak of postprocedural fungal endophthalmitis associated with a single compounding pharmacy—United States. Morb. Mortal. Wkly 2012, 61, 310–311. [Google Scholar]
  33. Ping-Cherng, C.; Wu, T.L.; Kuo, A.J.; Huang, Y.C.; Chung, T.Y.; Lin, C.S.; Leu, H.S.; Su, L.H. Outbreak of Serratia marcescens postsurgical bloodstream infection due to contaminated intravenous pain control fluids. Int. J. Infect. Dis. 2013, 17, e718–e722. [Google Scholar]
  34. Boseley, S. Questions Remain over Source of ITH Pharma Baby Feed Contamination. The Guardian. Available online: http://www.theguardian.com/society/2014/jun/05/questions-remain-source-ith-pharma-baby-feed-contamination (accessed on 5 June 2014).
  35. Austin, P.; Hand, K.; Elia, M. Systematic review and meta-analysis of the risk of microbial contamination of parenteral doses prepared under aseptic techniques in clinical and pharmaceutical environments: An update. J. Hosp. Infect. 2015, 91, 306–318. [Google Scholar] [CrossRef]
  36. Larmené-Beld, K.H.M.; Frijlink, H.W.; Taxis, K. A systematic review and meta-analysis of microbial contamination of parenteral medication prepared in a clinical versus pharmacy environment. Eur. J. Clin. Pharmacol. 2019, 75, 609–617. [Google Scholar] [CrossRef]
  37. Sandle, T. Cleanrooms, Isolators and Cleanroom Technology, Sterility, Sterilisation and Sterility Assurance for Pharmaceuticals; Woodhead Publishing: Cambridge, UK, 2013; pp. 189–207. [Google Scholar] [CrossRef]
  38. European Commission. Eudralex. The Rules Governing Medicinal Products in the European Community, Annex 1; European Commission: Brussels, Belgium, 2009. [Google Scholar]
  39. Sandle, T. Sterility, Sterilisation and Sterility Assurance for Pharmaceuticals; Elsevier: Amsterdam, The Netherlands, 2013. [Google Scholar]
  40. Gopinath, E.; Bhadauria, R.S.; Mishra, A.; Soan, V.K.; Gupta, D.P. Aseptic processing risk management: A review. IJPSR 2010, 1, 30–40. [Google Scholar]
  41. Haag, M. Calculating and Understanding Particulate Contamination Risk. Pharm. Tech. Eur. 2011, 23, 38–41. [Google Scholar]
  42. Vernjans, B.; Reed, C.H. Assessing filling technologies for contamination risk. BioPharm Int. 2012, 25, 3. [Google Scholar]
  43. Mahdiani, H.; Doroud, D.; Shahali, M.; Pouyan, N.; Brufar, F.; Rahimi, A.; Vaez, J. A practical risk-based approach to assess vial’s dimensions deviations effect on the aseptic filling processing, according to ICH Q9 guideline. Int. J. Pharm. Pharm. Sci. 2014, 6, 613–616. [Google Scholar]
  44. The International Council for Harmonisation of Technical Requirements for Pharmaceuticals for Human Use (ICH), ICH HARMONISED GUIDELINE. ICH Guideline Q9 (R1) on Quality Risk Management. 2021. Available online: https://www.gmp-navigator.com/files/guidemgr/ICHQ9.pdf (accessed on 4 May 2022).
  45. Domokos, A.; Pusztai, É.; Madarász, L.; Nagy, B.; Gyürkés, M.; Farkas, A.; Fülöp, G.; Casian, T.; Szilágyi, B.; Nagy, Z.K. Combination of PAT and mechanistic modeling tools in a fully continuous powder to granule line: Rapid and deep process understanding. Powder Technol. 2021, 388, 70–81. [Google Scholar] [CrossRef]
  46. Shah, E.B.; Gajjar, A. Process Analytical Technology (PAT) in Quality Assurance: A Detailed Review. Int. J. Pharm. Sci. Nanotechnol. 2022, 15, 5763–5770. [Google Scholar] [CrossRef]
  47. Mali, A.; Jagtap, M.; Karekar, P.; Maruska, A. A Brief review on process analytical (PAT) Review Article. Int. J. Curr. Pharm. Rev. Res. 2016, 8, 10–15. [Google Scholar]
  48. Regier, M.; Schubert, H.; Schuchmann, H. Dielectric spectroscopy—A new method for particle size- and fraction-determination. Innov. Food Sci. Emerg. Technol. 2004, 5, 199–204. [Google Scholar] [CrossRef]
  49. Regier, M. Überdielektrische und Magnetresonanz-MethodenzurCharakterisierung Disperser Systeme: Dissertation; Universität Karlsruhe: Berlin, Germany, 2003. [Google Scholar]
  50. Asami, K. Characterization of heterogeneous systems by dielectric spectroscopy. Prog. Polym. Sci. 2002, 27, 1617–1659. [Google Scholar] [CrossRef]
  51. Stuckly, S.S.; Gregory, G.; Anderson, L.; Kraszewski, A. A new sensor for dielectric measurements. IEEE Trans. Instrum. Meas. 1986, 35, 138–141. [Google Scholar] [CrossRef]
  52. Regier, M.; Schuchmann, H.P.; Danner, T. Online-Partikelgrößenmessung mittels dielektrischer Spektroskopie: Einsatzmöglichkeiten und Grenzen. Chem. Ing. Tech. 2006, 6, 78. [Google Scholar] [CrossRef]
  53. Beer, S.; Dobler, D.; Gross, A.; Ost, M.; Elseberg, C.; Maeder, U.; Schmidts, T.M.; Keusgen, M.; Fiebich, M.; Runkel, F. In line monitoring of the preparation of water-in-oil-in-water (W/O/W) type multiple emulsions via dielectric spectroscopy. Int. J. Pharm. 2013, 441, 643–647. [Google Scholar] [CrossRef] [PubMed]
  54. Volker, A.; de Kroon, M. Characterization of suspensions by ultrasonic reflection measurements. Ultrasonics 1998, 36, 283–289. [Google Scholar] [CrossRef]
  55. Weser, R.; Wöckel, S.; Wessely, B.; Hempel, U. Particle characterisation in highly concentrated dispersions using ultrasonic backscattering method. Ultrasonics 2012, 53, 706–716. [Google Scholar] [CrossRef] [PubMed]
  56. Faran, J.J. Sound Scattering by Solid Cylinders and Spheres. J. Acoust. Soc. Am. 1951, 23, 405–418. [Google Scholar] [CrossRef]
  57. Weser, R.; Wöckel, S.; Hempel, U.; Wessely, B.; Auge, J. Particle characterization in highly concentrated suspensions by ultrasound scattering method. Sens. Actuators A 2013, 202, 30–36. [Google Scholar] [CrossRef]
  58. Weser, R.; Woeckel, S.; Wessely, B.; Steinmann, U.; Babick, F.; Stintz, M. Ultrasonic backscattering method for in-situ characterisation of concentrated dispersions. Powder Technol. 2014, 268, 177–190. [Google Scholar] [CrossRef]
  59. Dukhin, A.S.; Goetz, P.J. Acoustic and electroacoustic spectroscopy for characterizing concentrated dispersions and emulsions. Adv. Colloid Interface Sci. 2001, 92, 73–132. [Google Scholar] [CrossRef]
  60. Dukhin, A.S.; Goetz, P.J. Ultrasound for Characterizing Colloids; Elsevier: Amsterdam, The Netherlands, 2004; pp. 91–119. [Google Scholar] [CrossRef]
  61. Wilhelm, P.; Stephan, D. On-line tracking of the coating of nanoscaled silica with titania nanoparticles via zeta-potential measurements. Colloid Interface Sci. 2006, 293, 88–92. [Google Scholar] [CrossRef]
  62. Dukhin, A.S.; Goetz, P.J.; Xiaohua, F.; Somasundaran, P. Monitoring nanoparticles in the presence of larger particles in liquids using acoustics and electron microscopy. J. Colloid Interface Sci. 2010, 342, 18–25. [Google Scholar] [CrossRef]
  63. Purohit, P.S.; Kulkarni, R.; Somasundaran, P. Investigation of colloidal properties of modified silicone polymers emulsified by non-ionic surfactants. J. Colloid Interface Sci. 2012, 383, 49–54. [Google Scholar] [CrossRef]
  64. DosRamos, J.G. Acoustic attenuation spectroscopy for process control of dispersed systems. IOP Conf. Series Mater. Sci. Eng. 2012, 42. [Google Scholar] [CrossRef]
  65. Ding, B.; He, L.P.; Luo, J.H.; Peng, B.L.; Geng, X.F.; Wang, P.M. Determination of particle size of heavy oil in water dispersion system by ultra sonic attenuation method. J. Pet. Sci. Eng. 2016, 146, 764–769. [Google Scholar] [CrossRef]
  66. Cao, Y.; Jin, Y.; Li, J.; Zou, D.; Chen, X. Demulsification of the phosphoric acid–tributyl phosphate (W/O) emulsion by hydrocyclone. Sep. Purif. Technol. 2016, 158, 387–395. [Google Scholar] [CrossRef]
  67. Silva, C.A.; Saraiva, S.V.; Bonetti, D.; Higuti, R.T.; Cunha, R.L.; Pereira, L.O.; Silva, F.V.; Fileti, A.M. Measurements of bimodal droplet size distribution of emulsions using ultrasonic spectroscopy in the long and intermediate wavelength regimes. Chem. Eng. Sci. 2021, 252, 117274. [Google Scholar] [CrossRef]
  68. Weiwei, E.; Jingcai, C.; Chao, Y.; Zaisha, M. Experimental study by online measurement of the precipitation of nickel hydroxide: Effect of operating conditions. Chin. J. Chem. Eng. 2015, 23, 860–867. [Google Scholar]
  69. Pinto, J.T.; Faulhammer, E.; Dieplinger, J.; Dekner, M.; Makert, C.; Nieder, M.; Paudel, A. Progress in spray-drying of protein pharmaceuticals: Literature analysis of trends in formulation and process attributes. Dry. Technol. 2021, 39, 1415–1446. [Google Scholar] [CrossRef]
  70. Medendorp, J.; Bric, J.; Connelly, G.; Tolton, K.; Warman, M. Development and beyond: Strategy for long-term maintenance of an online laser diffraction particle size method in a spray drying manufacturing process. J. Pharm. Biomed. Anal. 2015, 112, 79–84. [Google Scholar] [CrossRef]
  71. Sabin, A. Problems in particle size: Laser diffraction observations. GXP J. 2011, 15, 35–44. [Google Scholar]
  72. Reufer, M.; Machado, A.H.; Niederquell, A.; Bohnenblust, K.; Müller, B.; Völker, A.C.; Kuentz, M. Introducing Diffusing Wave Spectroscopy as a Process Analytical Tool for Pharmaceutical Emulsion Manufacturing. J. Pharm. Sci. 2014, 103, 3902–3913. [Google Scholar] [CrossRef]
  73. Kozdrach, R. The Innovative Research Methodology of Tribological and Rheological Properties of Lubricating Grease. Tribol. Ind. 2021, 43, 117–130. [Google Scholar] [CrossRef]
  74. Kolman, M.; Boland, G.; Amin, S. Exploring the Utility of Diffusing Wave Spectroscopy (DWS) as a Novel Tool for Early Detection of Stability Issues in Cosmetic Emulsions. Cosmetics 2021, 8, 99. [Google Scholar] [CrossRef]
  75. Chen, Z.; Peng, J.; Ge, L.; Xu, Z. Demulsifying water-in-oil emulsions by ethyl cellulose demulsifiers studied using focused beam reflectance measurement. Chem. Eng. Sci. 2015, 130, 254–263. [Google Scholar] [CrossRef]
  76. Dowding, P.J.; Goodwin, J.W.; Vincent, B. Factors governing emulsion droplet and solid particle size measurements performed using the focused beam reflectance technique. Colloids Surfaces A: Physicochem. Eng. Asp. 2001, 192, 5–13. [Google Scholar] [CrossRef]
  77. Li, H.; Grover, M.A.; Kawajiri, Y.; Rousseau, R.W. Development of an empirical method relating crystal size distributions and FBRM measurements. Chem. Eng. Sci. 2013, 89, 142–151. [Google Scholar] [CrossRef]
  78. Barros, L.; Gim-Krumm, M.; Seriche, G.; Quilaqueo, M.; Castillo, C.; Ihle, C.F.; Ruby-Figueroa, R.; Estay, H. In-situ and real-time aggregation size evolution of copper sulfide precipitates using focused beam reflectance measurement (FBRM). Powder Technol. 2020, 380, 205–218. [Google Scholar] [CrossRef]
  79. Less, S.; Vilagines, R. Light beam reflectance measurement of droplets diameter distribution in crude oil emulsions. Fuel 2013, 109, 542–550. [Google Scholar] [CrossRef]
  80. Less, S.; Vilagines, R.; Al-Khalifa, H. Online droplet diameter measurements to improve the crude oil dehydration process. Chem. Eng. Res. Des. 2014, 92, 2659–2667. [Google Scholar] [CrossRef]
  81. Cobbledick, J.; Nguyen, A.; Latulippe, D.R. Demonstration of FBRM as process analytical technology tool for dewatering processes via CST correlation. Water Res. 2014, 58, 132–140. [Google Scholar] [CrossRef]
  82. Ruf, A.; Worlitschek, J.; Mazzotti, M. Modeling and Experimental Analysis of PSD Measurements through FBRM. Part. Part. Syst. Charact. 2000, 17, 167–179. [Google Scholar] [CrossRef]
  83. Greaves, D.; Boxall, J.; Mulligan, J.; Montesi, A.; Creek, J.; Sloan, E.D.; Koh, C.A. Measuring the particle size of a known distribution using the focused beam reflactancemeasurment technique. Chem. Eng. Sci. 2008, 63, 5410–5419. [Google Scholar] [CrossRef]
  84. Heath, A.R.; Fawell, P.D.; Bahri, P.A.; Swift, J.D. Estimating Average Particle Size by Focused Beam Reflectance Measurement (FBRM). Part. Part. Syst. Charact. 2002, 19, 84–95. [Google Scholar] [CrossRef]
  85. Meng, X.; Qi, L.; Zhang, R.; Liu, H.; Xu, C.; Liu, Z.; Klusener, P.A. Droplet size distribution and droplet size correlation of chloroaluminate ionic liquid-heptane dispersion in a stirred vessel. Chem. Eng. J. 2015, 268, 116–124. [Google Scholar]
  86. Liu, J.; Wang, W.; Wang, P.Y.; Duan, J.M.; Gong, J. Evolution of dispersed drops during the mixing of mineral oil and water phases in a stirring tank. Chem. Eng. Sci. 2013, 91, 173–179. [Google Scholar]
  87. Calabrese, R.V.; Rueger, P.E. Dispersion of water into oil in a rotor-stator mixer. Part 1: Drop breakup in dilute systems. Chem. Eng. Des. 2013, 91, 2122–2133. [Google Scholar]
  88. Melchuna, A.; Cameirao, A.; Herri, J.-M.; Glenat, P. Topological modeling of methane hydrate crystallization from low to high water cut emulsion systems. Fluid Phase Equilibria 2016, 413, 158–169. [Google Scholar] [CrossRef]
  89. Turner, D.; Miller, K.; Sloan, E. Direct conversion of water droplets to methane hydrate in crude oil. Chem. Eng. Sci. 2009, 64, 5066–5072. [Google Scholar] [CrossRef]
  90. Mirshekari, F.; Pakzad, L.; Fatehi, P. An investigation on the stability of the hazelnut oil-water emulsion. J. Dispers. Sci. Technol. 2019, 41, 929–940. [Google Scholar] [CrossRef]
  91. Desnoyer, C.; Masbernat, O.; Gourdon, C. Experimental study of drop size distributions at high phase ratio in liquid–liquid dispersions. Chem. Eng. Sci. 2003, 58, 1353–1363. [Google Scholar] [CrossRef]
  92. El-Hamouz, A.; Cooke, M.; Kowalski, A.; Sharratt, P. Dispersion of Silicone Oil in Water Surfactant Solution: Effect on Impeller Speed, Oil Viscosity and Addition Point of Drop Size Distribution. Chem. Eng. Processing 2009, 48, 633–642. [Google Scholar] [CrossRef]
  93. Muhaimin, M.; Chaerunisaa, A.Y.; Bodmeier, R. Real-time particle size analysis using focused beam reflectance measurement as a process analytical technology tool for continuous microencapsulation process. Sci. Rep. 2021, 11, 19390. [Google Scholar] [CrossRef]
  94. Acevedo, D.; Wu, W.-L.; Yang, X.; Pavurala, N.; Mohammad, A.; O’Connor, T.F. Evaluation of focused beam reflectance measurement (FBRM) for monitoring and predicting the crystal size of carbamazepine in crystallization processes. CrystEngComm 2020, 23, 972–985. [Google Scholar] [CrossRef]
  95. Maaß, S.; Wollny, S.; Voigt, A.; Kraume, M. Experimental comparison of measurement techniques for drop size distributions in liquid/liquid dispersions. Exp. Fluids 2010, 50, 259–269. [Google Scholar] [CrossRef]
  96. Maaß, S.; Rojahn, J.; Hänsch, R.; Kraume, M. Automated drop detection using image analysis for online particle size monitoring in multiphase systems. Comput. Chem. Eng. 2012, 45, 27–37. [Google Scholar] [CrossRef]
  97. Maaß, S.; Paul, N.; Kraume, M. Influence of the dispersed phase fraction on experimental and predicted drop size distributions in breakage dominated stirred liquid-liquid systems. Chem. Eng. Sci. 2012, 76, 140–153. [Google Scholar] [CrossRef]
  98. Maaß, S.; Rehm, T.; Kraume, M. Prediction of drop sizes for liquid–liquid systems in stirred slim reactors—Part II: Multi stage impellers. Chem. Eng. J. 2011, 168, 827–838. [Google Scholar] [CrossRef]
  99. Khakpay, A.; Abolghasemi, H. The effects of impeller speed and holdup on mean drop size in a mixer settler with spiral-type impeller. Can. J. Chem. Eng. 2010, 88, 329–334. [Google Scholar] [CrossRef]
  100. Razzaghi, K.; Shahraki, F. On the effect of phase fraction on drop size distribution of liquid–liquid dispersions in agitated vessels. Chem. Eng. Res. Des. 2010, 88, 803–808. [Google Scholar] [CrossRef]
  101. Vancleef, A.; Seurs, S.; Jordens, J.; Van Gerven, T.; Thomassen, L.C.J.; Braeken, L. Reducing the Induction Time Using Ultrasound and High-Shear Mixing in a Continuous Crystallization Process. Crystals 2018, 8, 326. [Google Scholar] [CrossRef]
  102. Domokos, A.; Madarász, L.; Stoffán, G.; Tacsi, K.; Galata, D.; Csorba, K.; Vass, P.; Nagy, Z.K.; Pataki, H. Real-Time Monitoring of Continuous Pharmaceutical Mixed Suspension Mixed Product Removal Crystallization Using Image Analysis. Org. Process. Res. Dev. 2021, 26, 149–158. [Google Scholar] [CrossRef]
  103. Dieter, P.; Stefan, D.; Günter, E.; Michael, K. In-line particle sizing for real-time process control by fibre-optical spatial filtering technique (SFT). Adv. Powder Technol. 2011, 22, 203–208. [Google Scholar] [CrossRef]
  104. Burggraeve, A.; Kerkhof, T.V.D.; Hellings, M.; Remon, J.; Vervaet, C.; De Beer, T. Evaluation of in-line spatial filter velocimetry as PAT monitoring tool for particle growth during fluid bed granulation. Eur. J. Pharm. Biopharm. 2010, 76, 138–146. [Google Scholar] [CrossRef] [PubMed]
  105. Roßteuscher-Carl, K.; Fricke, S.; Hacker, M.C.; Schulz-Siegmund, M. In-line monitoring of particle size in a fluid bed granulator: Investigations concerning positioning and configuration of the sensor. Int. J. Pharm. 2014, 466, 31–37. [Google Scholar] [CrossRef] [PubMed]
  106. Vancleef, A.; Maes, D.; Van Gerven, T.; Thomassen, L.C.; Braeken, L. Flow-through microscopy and image analysis for crystallization processes. Chem. Eng. Sci. 2021, 248, 117067. [Google Scholar] [CrossRef]
  107. Emmerich, J.; Tang, Q.; Wang, Y.; Neubauer, P.; Junne, S.; Maaß, S. Optical inline analysis and monitoring of particle size and shape distributions for multiple applications: Scientific and industrial relevance. Chin. J. Chem. Eng. 2018, 27, 257–277. [Google Scholar] [CrossRef]
  108. Peña, R.; Jarmer, D.J.; Burcham, C.; Nagy, Z.K. Further Understanding of Agglomeration Mechanisms in Spherical Crystallization Systems: Benzoic Acid Case Study. Cryst. Growth Des. 2019, 19, 1668–1679. [Google Scholar] [CrossRef]
Figure 1. Manufacturing process for parenteral lipid emulsions. This starts with the preparation of aqueous and oil phases, followed by coarse and then fine emulsification, cooling, filtration, filling, and sterilization of the injectable, final product.
Processes 10 01174 g001
Figure 2. Normal globule distribution of a parenteral lipid emulsion with large diameter tailing. The shaded green area indicates the fat globule population with a lower proportion (pFAT5 < 0.05%) of large droplets (>5 µm). The shaded red area indicates the globule population with an embolic large droplet (>5 µm) amount (pFAT5 > 0.05%).
Processes 10 01174 g002
Figure 3. Dielectric spectroscopy. The sensor setup is shown on the left, and the dispersion (dielectric polarization and relaxation of particles) is shown on the right.
Processes 10 01174 g003
Figure 4. Ultrasonic backscattering. The sensor setup is shown on the left, with ultrasonic signal and particle backscattering. The backscattering signal with amplitude reflected from a particle population is shown on the right.
Processes 10 01174 g004
Figure 5. Ultrasonic attenuation. The sensor setup is shown on the left, with ultrasonic signal and attenuation, and the attenuation signal is shown on the right.
Processes 10 01174 g005
Figure 6. Schematic diagram of a laser diffraction setup with subsequent data analysis.
Processes 10 01174 g006
Figure 7. Schematic diagram of a diffusing wave spectroscopy setup with subsequent data analysis.
Processes 10 01174 g007
Figure 8. Laser scanner technology. The sensor setup is shown on the left, and the chord length distribution is shown on the right.
Processes 10 01174 g008
Figure 9. Inline microscopy with image analysis. The sensor setup is shown on the left for a particle vision microscope with inline endoscope. Image processing is shown in the middle, leading to the size distribution shown on the right.
Processes 10 01174 g009
Figure 10. Spatial filtering technique. The sensor setup is shown on the left, and voltage impulse generation by fiber-optic spot scanning is shown on the right [103].
Processes 10 01174 g010
Table 1. Overview of PAT tools for droplet monitoring.
Measurement
Technique
AdvantagesDisadvantagesCommercially Available
Dielectric spectroscopyMeasurement of concentrated emulsions possible; no dilution needed, fast measurement, Measurement is influenced by temperature and
conductivity
fluctuations, bimodalities affect the spectra; product specific calibration needed
No for emulsions. Available for biological cells from Aber
Instruments Ltd. and Hamilton Company
Ultrasonic
backscattering
Measurement of concentrated emulsions; no dilution needed;Material parameters should be well known; not suitable for nano particles No online/inline system for emulsions available
Ultrasonic attenuation
spectroscopy
Measurement of concentrated emulsions; no dilution needed; wide
measuring range 1 µm–3 mm possible
Requires data for phase concertation; not suitable for nano particlesOnline sensor available for emulsions from Dispersion Technology Inc. (DT-1202);
Inline sensor available from
Sympatec GmbH (OPUS)
Laser diffractionNo calibration needed wide measuring range 0.1 µm–1 mm possible; fast
measurement;
Not suitable for nano
particles
Available for emulsions from Malvern Panalytical Ltd. (Insitec L and SX)
Diffusing wave
spectroscopy
No product specific
calibration required;
suitable for nano particles
No inline technique; dilution of the sample requiredAvailable for emulsions from Microtrac Retsch GmbH
(Nanotrac Flex)
Laser scanner
technology
No product specific
calibration required,
suitable for nano particles; wide measurement range 0.5–2 µm
Requires sufficient material flows to provide valid dataAvailable for emulsions from Mettler Toledo GmbH (FBRM) and Sequip S + E GmbH (ECA)
Spatial filtering
technique
No product specific calibration required; wide measurement range 50 µm–6 mmOnly suitable for low
concentrations
No for emulsions. Available for powders from Parsum GmbH (IPP 70-S)
Insitu microscopeSingle large droplets
detectable; information about particle shape; wide measurement range
5 µm–10 mm
Generates large amounts of image data (data backup is a challenge)Available for emulsions from SOPAT GmbH (SOPAT-VR)
and Sequip S + E GmbH (IVM)
Publisher’s Note: MDPI stays neutral with regard to jurisdictional claims in published maps and institutional affiliations.

