Review

Thermal Stability Determination of Propylene Glycol Sodium Alginate and Ammonium Sulfate with Calorimetry Technology

1
School of Environmental and Safety Engineering, Changzhou University, No. 21, Gehu Mid-Rd., Wujin Dist., Changzhou 213164, China
2
School of Materials Science and Engineering, Changzhou University, No. 21, Gehu Mid-Rd., Wujin Dist., Changzhou 213164, China
3
Department of Civil Engineering, Texas Tech University, 2500 Broadway, Lubbock, TX 79409, USA
4
Department of Safety, Health, and Environmental Engineering, National Yunlin University of Science and Technology, No. 123, University Rd., Sec. 3, Yunlin 64002, Taiwan
5
School of Environmental and Chemical Engineering, Zhaoqing University, No. 1, Zhaoqing Blvd., Zhaoqing 526061, China
*
Authors to whom correspondence should be addressed.
Processes 2022, 10(6), 1177; https://doi.org/10.3390/pr10061177
Submission received: 21 May 2022 / Revised: 8 June 2022 / Accepted: 10 June 2022 / Published: 12 June 2022
(This article belongs to the Section Chemical Processes and Systems)

Abstract

:
Propylene Glycol Alginate Sodium Sulfate (PSS) is widely produced and used in medicine as a marine drug for treating hyperlipidemia. During the sulfonation synthesis of PSS, the sulfonation of chlorosulfonic acid is exothermic. At high temperatures, the process can easily produce a large amount of ammonium sulfate. Ammonium sulfate adheres to PSS in crystal and participates in the sulfonation reaction. In this study, the sulfonation process of commercial PSS was reproduced in the laboratory using chlorosulfonic acid and formamide. We used differential scanning calorimetry and thermogravimetric analyzer to examine the thermal stability of PSS, and we used both differential and integral conversional methods to determine the appropriate thermokinetic models for this substance. We also established an autocatalytic model to study the conversion limit time and the maximum rate time of this substance. After calculation, the activation energy of this substance is no more than 60 kJ/mol, and it has other exothermic performances at different heating rates. The results help to optimize the sulfonation process of PSS and analyze the thermal risk of PSS with ammonium sulfate.

1. Introduction

For the past 15 years, propylene glycol alginate sodium sulfate (PSS) has been a marine-sulfated polysaccharide drug produced in large quantities in China [1]. The heparin-like activity of the drug can reduce the viscosity of blood, has antithrombotic effects, and can reduce peripheral vascular dilation. It has a significant impact on treating cerebrovascular diseases [2,3]. The sulfonyl and propylene glycol groups are added by degradation, esterification, and sulfonation into the hydroxyl and carboxyl groups in Figure 1. The sodium alginate extracted from seaweed synthesizes the final product PSS.
The typical PSS production process in commercial pharmaceutical companies is to emulsify and acidify the raw materials, then add propylene oxide and sodium hydroxide to the reactor for esterification under pressure. The propylene glycol alginate (PGA) formed in the esterification reaction is fused with formamide and added to chlorosulfonic acid at low temperatures. Then the temperature is increased to promote the sulfonation reaction and obtain the crude PSS sample by washing and drying. Formamide is used as a reaction solvent because of its good solubility and high boiling point [4,5]. However, formamide is easy to decompose into ammonium and carbon monoxide at high temperatures. The ammonium is also easy to form a large amount of ammonium salt (ammonium sulfate ((NH4)2SO4)) in an acidic environment [5]. Although the products will be dissolved and precipitated with different concentrations of ethanol to remove sulfate salts at the end of the process, the products are still mixed with a large amount of (NH4)2SO4 in the process. This is prone to causing a thermal runaway reaction [6].
The process solves the problems of high raw material viscosity, incomplete reaction, and low yield. However, the actual sulfonation process is a high-risk process involving many dangerous substances, including highly corrosive chlorosulfonic acid and (NH4)2SO4. They are prone to producing harmful gas at high temperatures, which has a substantial risk [7,8,9]. In May 2012, an explosion occurred in Jiangxi Haichen Honghua Chemical Co., Ltd. (Jiangxi, China), where the cooling water of the condenser entered the sulfonation kettle and reacted violently with chlorosulfonic acid to cause an explosion. In May 2005, a chemical burn accident occurred in the production process of (NH4)2SO4 workshop of a pharmaceutical chemical enterprise with PSS production process (Henan, China), in which (NH4)2SO4 was heated and decomposed into sulfur dioxide and water, causing a chemical burn accident.
In this study, the sulfonation reaction process in the above process is performed in the laboratory to explore the potential risks in the reaction. In addition, the thermal stability of PSS + (NH4)2SO4 produced in the process is examined. Differential scanning calorimetry (DSC) and thermogravimetric analysis (TG) were adopted to conduct thermal tests. The thermokinetic models were adopted to simulate the exothermic situation of PSS + (NH4)2SO4 under different heat-flow environments. Through the calculation results of model fitting, the activation energy (Ea) of the PSS + (NH4)2SO4 was obtained. The findings imply an optimization of the sulfonation process of PSS and establishing thermal safety parameters for PSS + (NH4)2SO4.

2. Experimental Materials and Methods

2.1. Materials

In the laboratory reproduction of the sulfonation production process of commercial PSS, the used raw materials and reagents include propylene glycol alginate (PGA), formamide, and chlorosulfonic acid. The specific information of the reagents used is listed in Table 1.

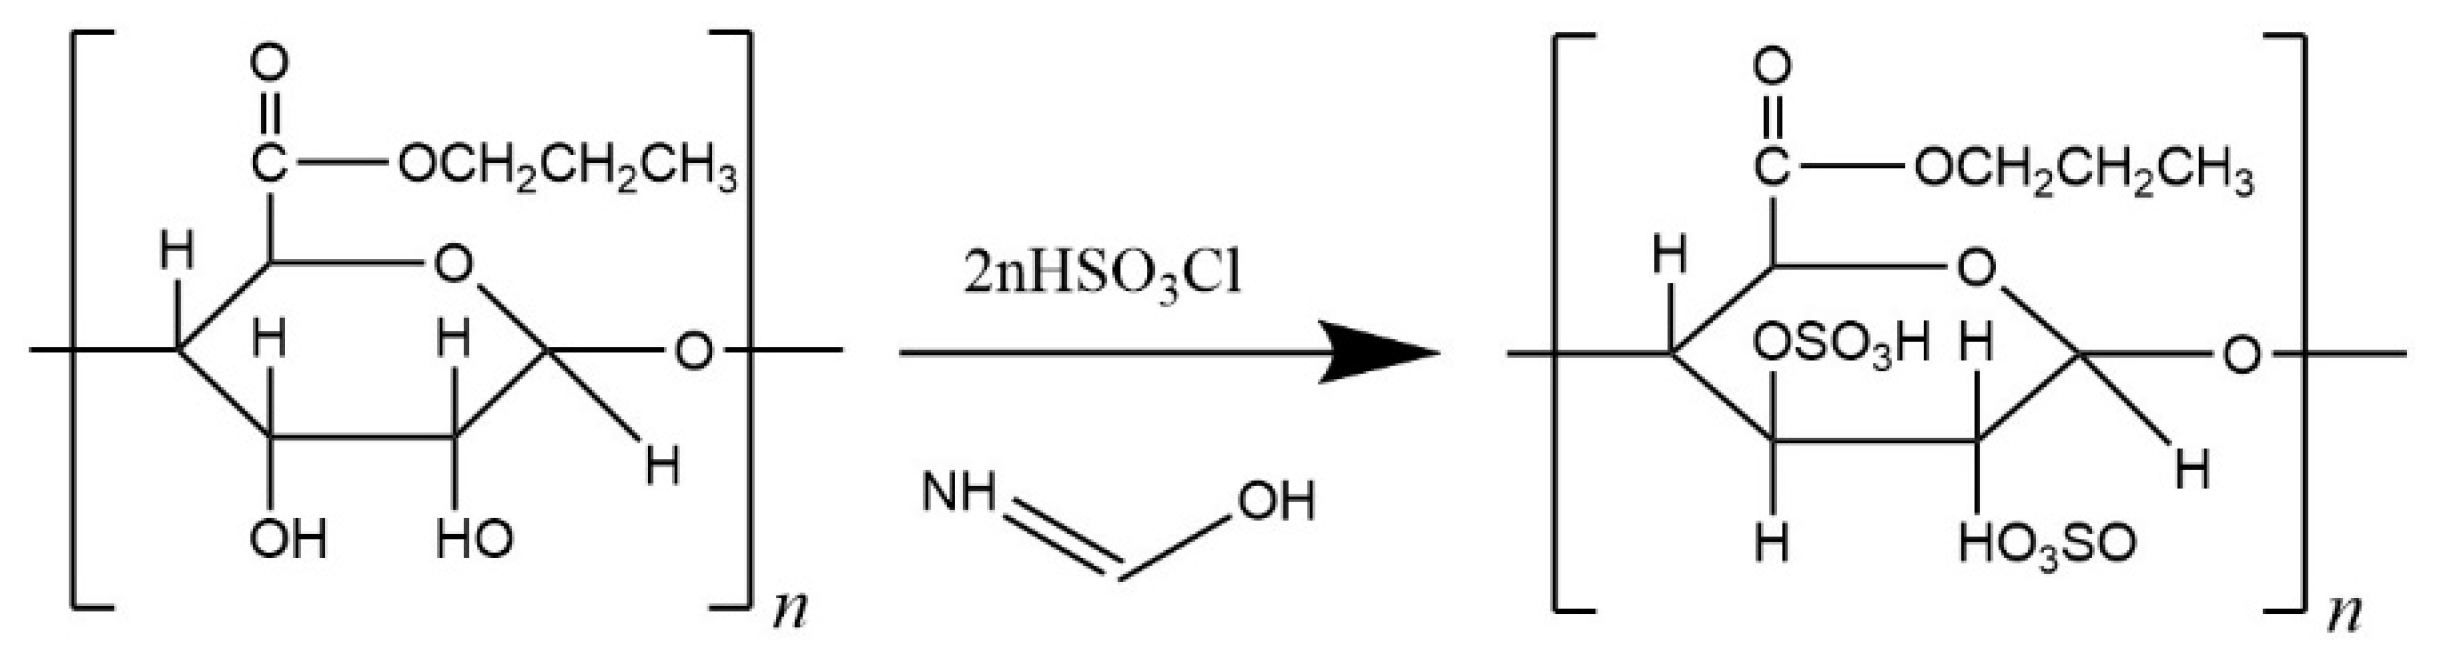
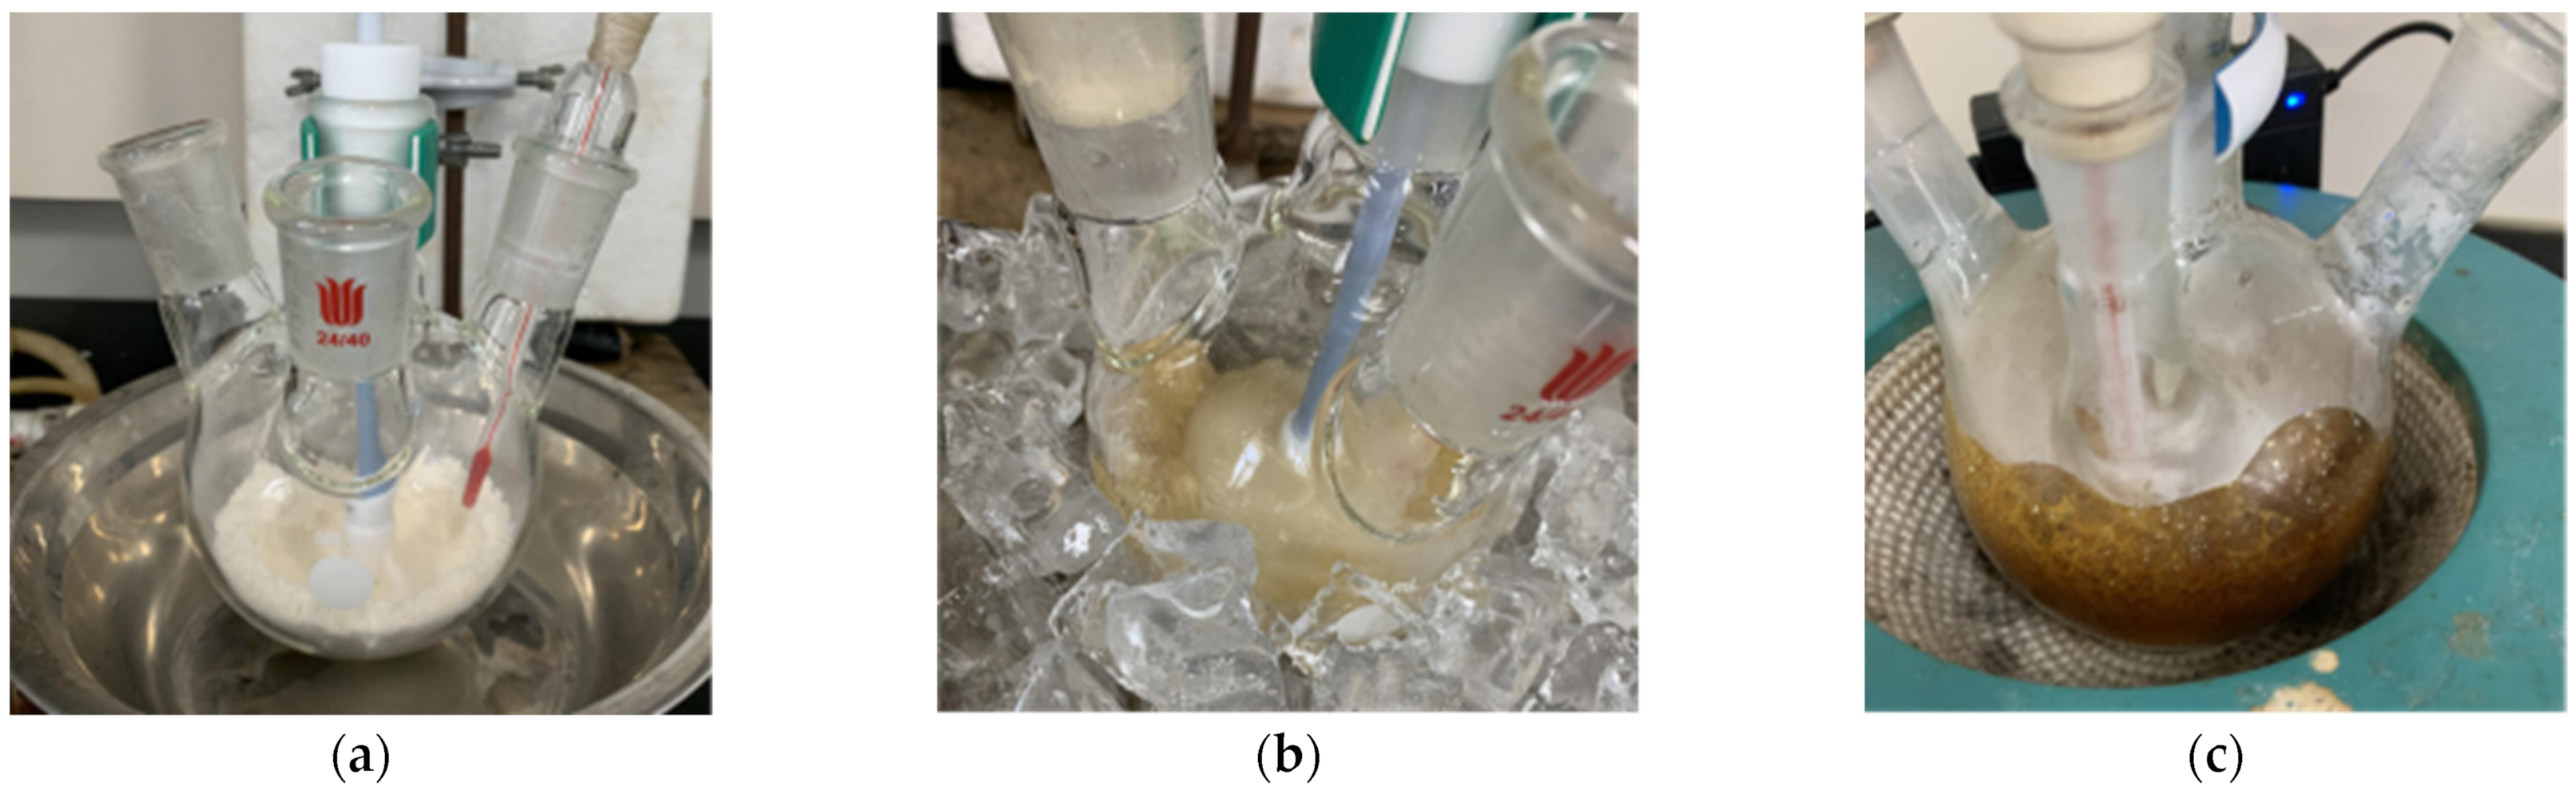
2.2. Sulfonation Synthesis of PSS

At present, the commercial production methods of PSS have quite a few risk factors. This is mainly through the hydrolysis of sodium alginate and esterification with propylene oxide to form the propylene diester alginate. Then, the propylene diester alginate is sulfonated with formamide and chlorosulfonic acid to form sodium diester alginate [2]. In the second reaction, because of the immense heat released by the sulfonation reaction, the formamide involved in the reaction can easily decompose into ammonia and CO when heated. Ammonia can easily form (NH4)2SO4 under the environment of solid acids, such as chlorosulfonic acid.
In the experiment of reproducing sulfonation synthesis, we stirred and fused 100 mL formamide with 10 g propylene alginate as solvent. The reaction temperature was controlled at about 5 °C, and the chlorosulfonic acid was added dropwise. After dropping, we raised the total temperature to 110 °C. A large amount of (NH4)2SO4 will be formed in the reaction. To further explore PSS + (NH4)2SO4 thermal safety performance, we measured it with an advanced calorimeter and fitted its Ea with the thermokinetic model [10].

2.3. Differential Scanning Calorimetry Experiments

The DSC developed by Mettler Toledo (Mettler Toledo Co., Zurich, Switzerland) was used to measure the heat release of PSS + (NH4)2SO4 produced in the sulfonation synthesis experiment under different β [11,12,13]. According to the physical and chemical properties of PSS + (NH4)2SO4, the high-density alumina crucible was selected to conduct the experience, evenly spread 5.75 ± 0.06 mg of PSS + (NH4)2SO4 in an identical alumina crucible, and calorimetric experiments with different β were carried out [10]. Combined with the suggestions of the International Federation Of Thermal Analysis And Calorimetric Algorithms and the actual situation of DSC, we calculated five groups of experiments, set to 1.0, 2.0, 3.0, 5.0, and 8.0 °C/min, respectively [14,15,16]. The characteristic thermal parameters of each series of experiments (including peak temperature (Tp), initial temperature (T0), and conversion.) were obtained through multiple experiments. These important kinetic parameters are also utilized for subsequent thermokinetic calculation.

2.4. Thermogravimetric Analysis Experiments

The TG analyzer (Mettler Toledo Co., Zurich, Switzerland) was utilized to measure the overall mass loss of PSS + (NH4)2SO4 under different β [17,18,19]. The acidity and alkalinity of the PSS + (NH4)2SO4 was tested, the pH value was 5.8. The alumina was chosen as the experimental vessel in TG experiments because of its weakly acidic [20]. According to the overall mass loss of PSS + (NH4)2SO4 in the experimental process. The five groups of experiments about 2.0, 3.0, 5.0, 8.0, and 10.0 °C/min was set under the same standard air atmosphere, respectively. The characteristic thermal parameters of each group (including mass loss rate, mass loss, Tp) were obtained through multiple experiments. These are combined with the parameters to draw the derivative thermogravimetric curve (DTG), to observe the thermal mass loss of PSS at different β.

2.5. Thermokinetic Analysis

For the study of the apparent Ea, it is a characteristic value related to temperature. When the Ea of the substance is lower, the energy required for the reaction of the substance is lower, which illustrates that reaction can occur easier [21,22]. Through the following thermokinetic calculation methods, the kinetic parameters were obtained in the measurement experiment to determine the value of Ea. This reliable calculation method is widely used in the thermal analysis experiments of various reactions or materials [23,24,25].
The Kissinger model was used to simulate the linear relationship of the data by the Tp of the reaction and the corresponding maximum heat flow. Ea of the substance and the determination coefficient (R2) of the linear relationship can be obtained through the slope. The method is illustrated in Equation (1) [26,27].
ln β T 2 = ln A R E a g α E a R 1 T
where A is the pre-exponential factor, T is the reaction temperature, R is the ideal gas constant (8.314 J/(mol·K)).
Further, the FWO model was utilized to analyze the conversion, time, and corresponding temperature and deduces their linear relationship, The Ea and R2 of the linear relationship was obtained according to the slope. The method can be expressed as Equation (2) [28,29].
lg β = lg A E R G α 2.315 0.4567 E R T
The Kissinger–Akahira–Sunose (KAS) method is derived by taking temperature as integral and using Coats–Redfern approximation. In this method, the conversion is substituted by the relationship between the conversion rate (α) and the temperature integral to improve Ea’s calculation accuracy and study the risk of the product [30,31]. The KAS method can be expressed as Equation (3).
ln β T α 2 = ln R k 0 E a G α E a R 1 T α

3. Results and discussion

3.1. Process Safety of Sulfonation Synthesis of PSS

The sulfonation synthesis process of commercial PSS was performed in the laboratory. This involved mixing propylene diester alginate with solvent formamide. A colloid with high viscosity was formed, which is not easy to stir and has poor heat transfer. This means uneven heating or high local heat can occur easily, as shown in Figure 2. After the temperature was reduced to 5 °C, chlorosulfonic acid was added dropwise. In the dropping process, chlorosulfonic acid participates in the reaction to form a sulfonation reaction, leading to exothermic and viscosity reduction of the colloid. After dropping, we raised the temperature to 110 °C for 3 h. During this period, the formamide involved in the reaction can quickly decompose into ammonia and CO when heated. Ammonia can easily form (NH4)2SO4 under the environment of solid acids [32]. In the meantime, a large amount of CO was released, and the colloid could not discharge the gas quickly. This led to many bubbles, as expressed in Figure 2, which can easily cause an increase in reactant volume, a leak of CO, and personnel poisoning.
Figure 3 shows the products after experiment (PSS + (NH4)2SO4) were obtained. Then we dissolved and precipitated the products with different concentrations of ethanol 3 times to separate the sulfate salts and dry them in a drying oven for 24 h. Finally, it is characterized by Fourier transform infrared spectrometer. Figure 4 displays the similarity of the spectral curve between the dried sulfate salts and (NH4)2SO4 is 94.86%. Therefore, the PSS is mixed with a large amount of (NH4)2SO4 in the production process.

3.2. Thermal Analysis Technology

(1)
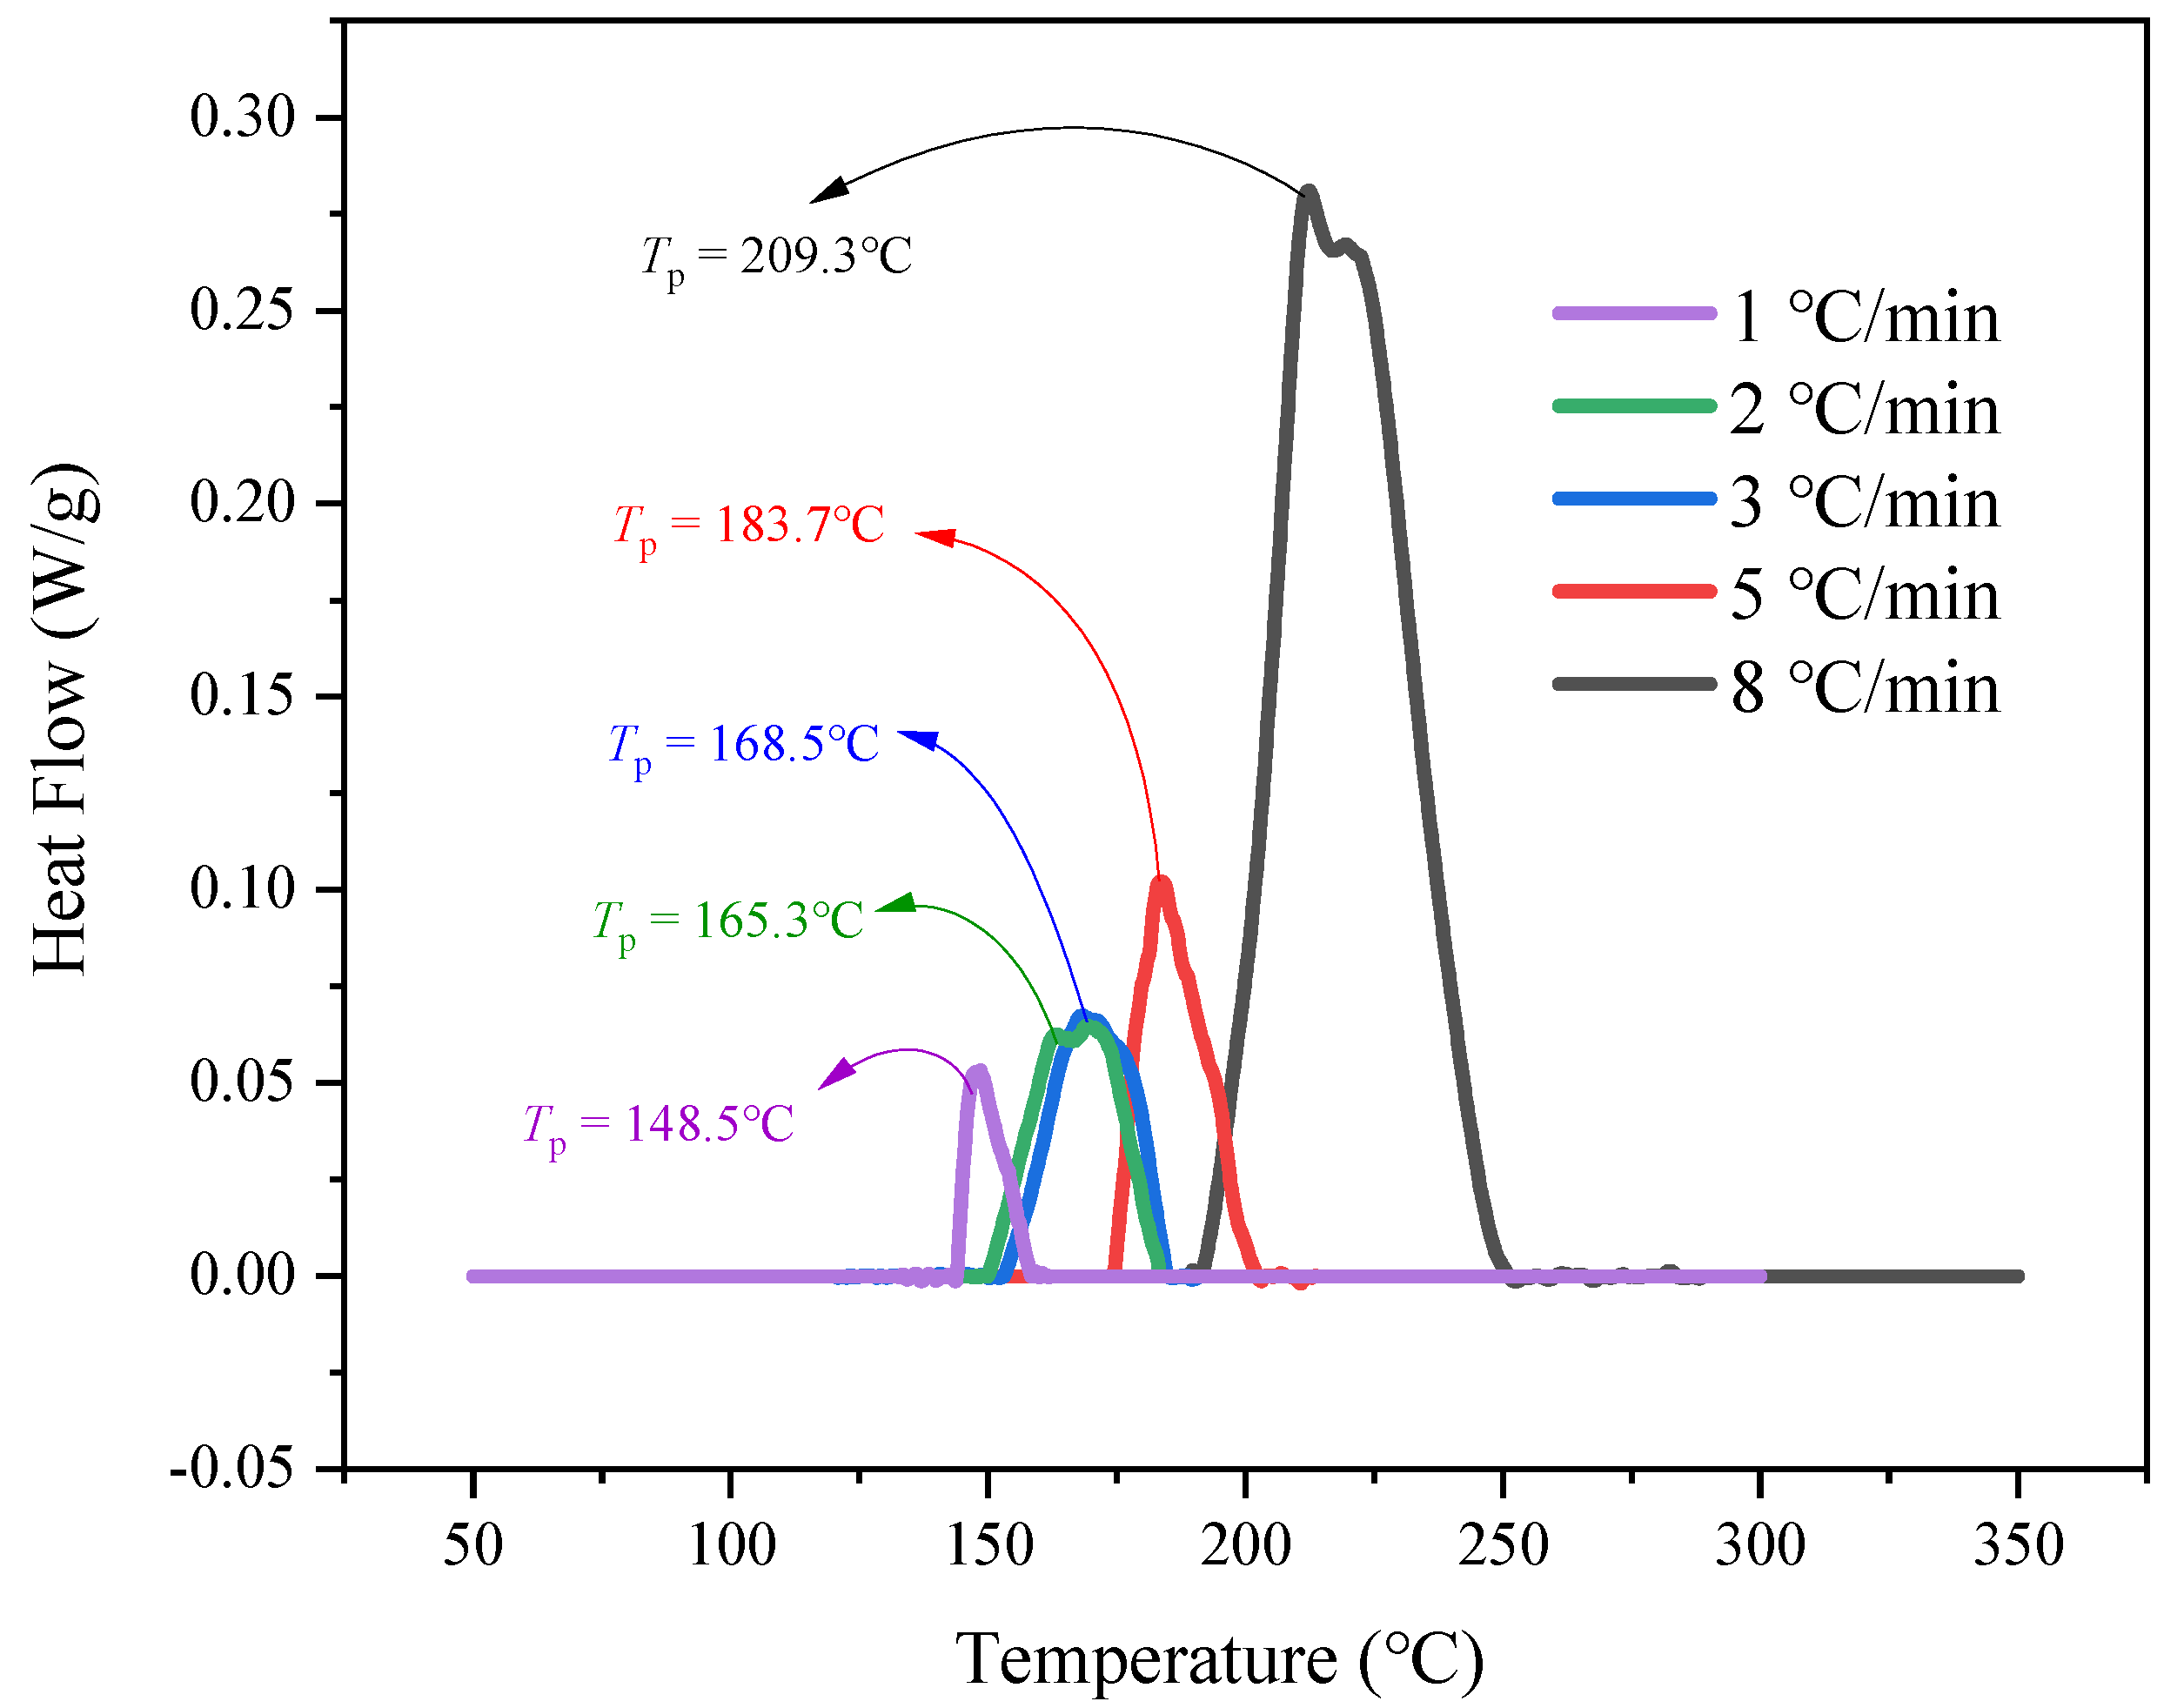
Thermal decomposition analysis by DSC
Figure 5 shows PSS + (NH4)2SO4 at different β in DSC curves. Table 2 details the thermokinetic parameters (including starting temperatures T0, Tp and Te) of the substance during DSC experiment. PSS + (NH4)2SO4 at each heating rate is stable below 130 °C. As the temperature rises, PSS + (NH4)2SO4 begins to release heat independently. Above 290 °C, the heat release ends, and the temperature change tends to be stable.
The DSC curves at different β were compared. It can be seen that the exothermic situation of PSS + (NH4)2SO4 at different β is also different. T0, Te, and Tp of PSS + (NH4)2SO4 increased with the higher β of PSS + (NH4)2SO4. When the β is 1.0, 2.0, 3.0, and 5.0, the peak value of the curve increases slowly. The largest heat flow value occurred at the β of 8.0 °C/min, the heat release is obvious, and the critical temperature parameters increase significantly. So, the β of PSS + (NH4)2SO4 has obvious effects on the initial temperature, duration and effect of heating release [33,34,35].
(2)
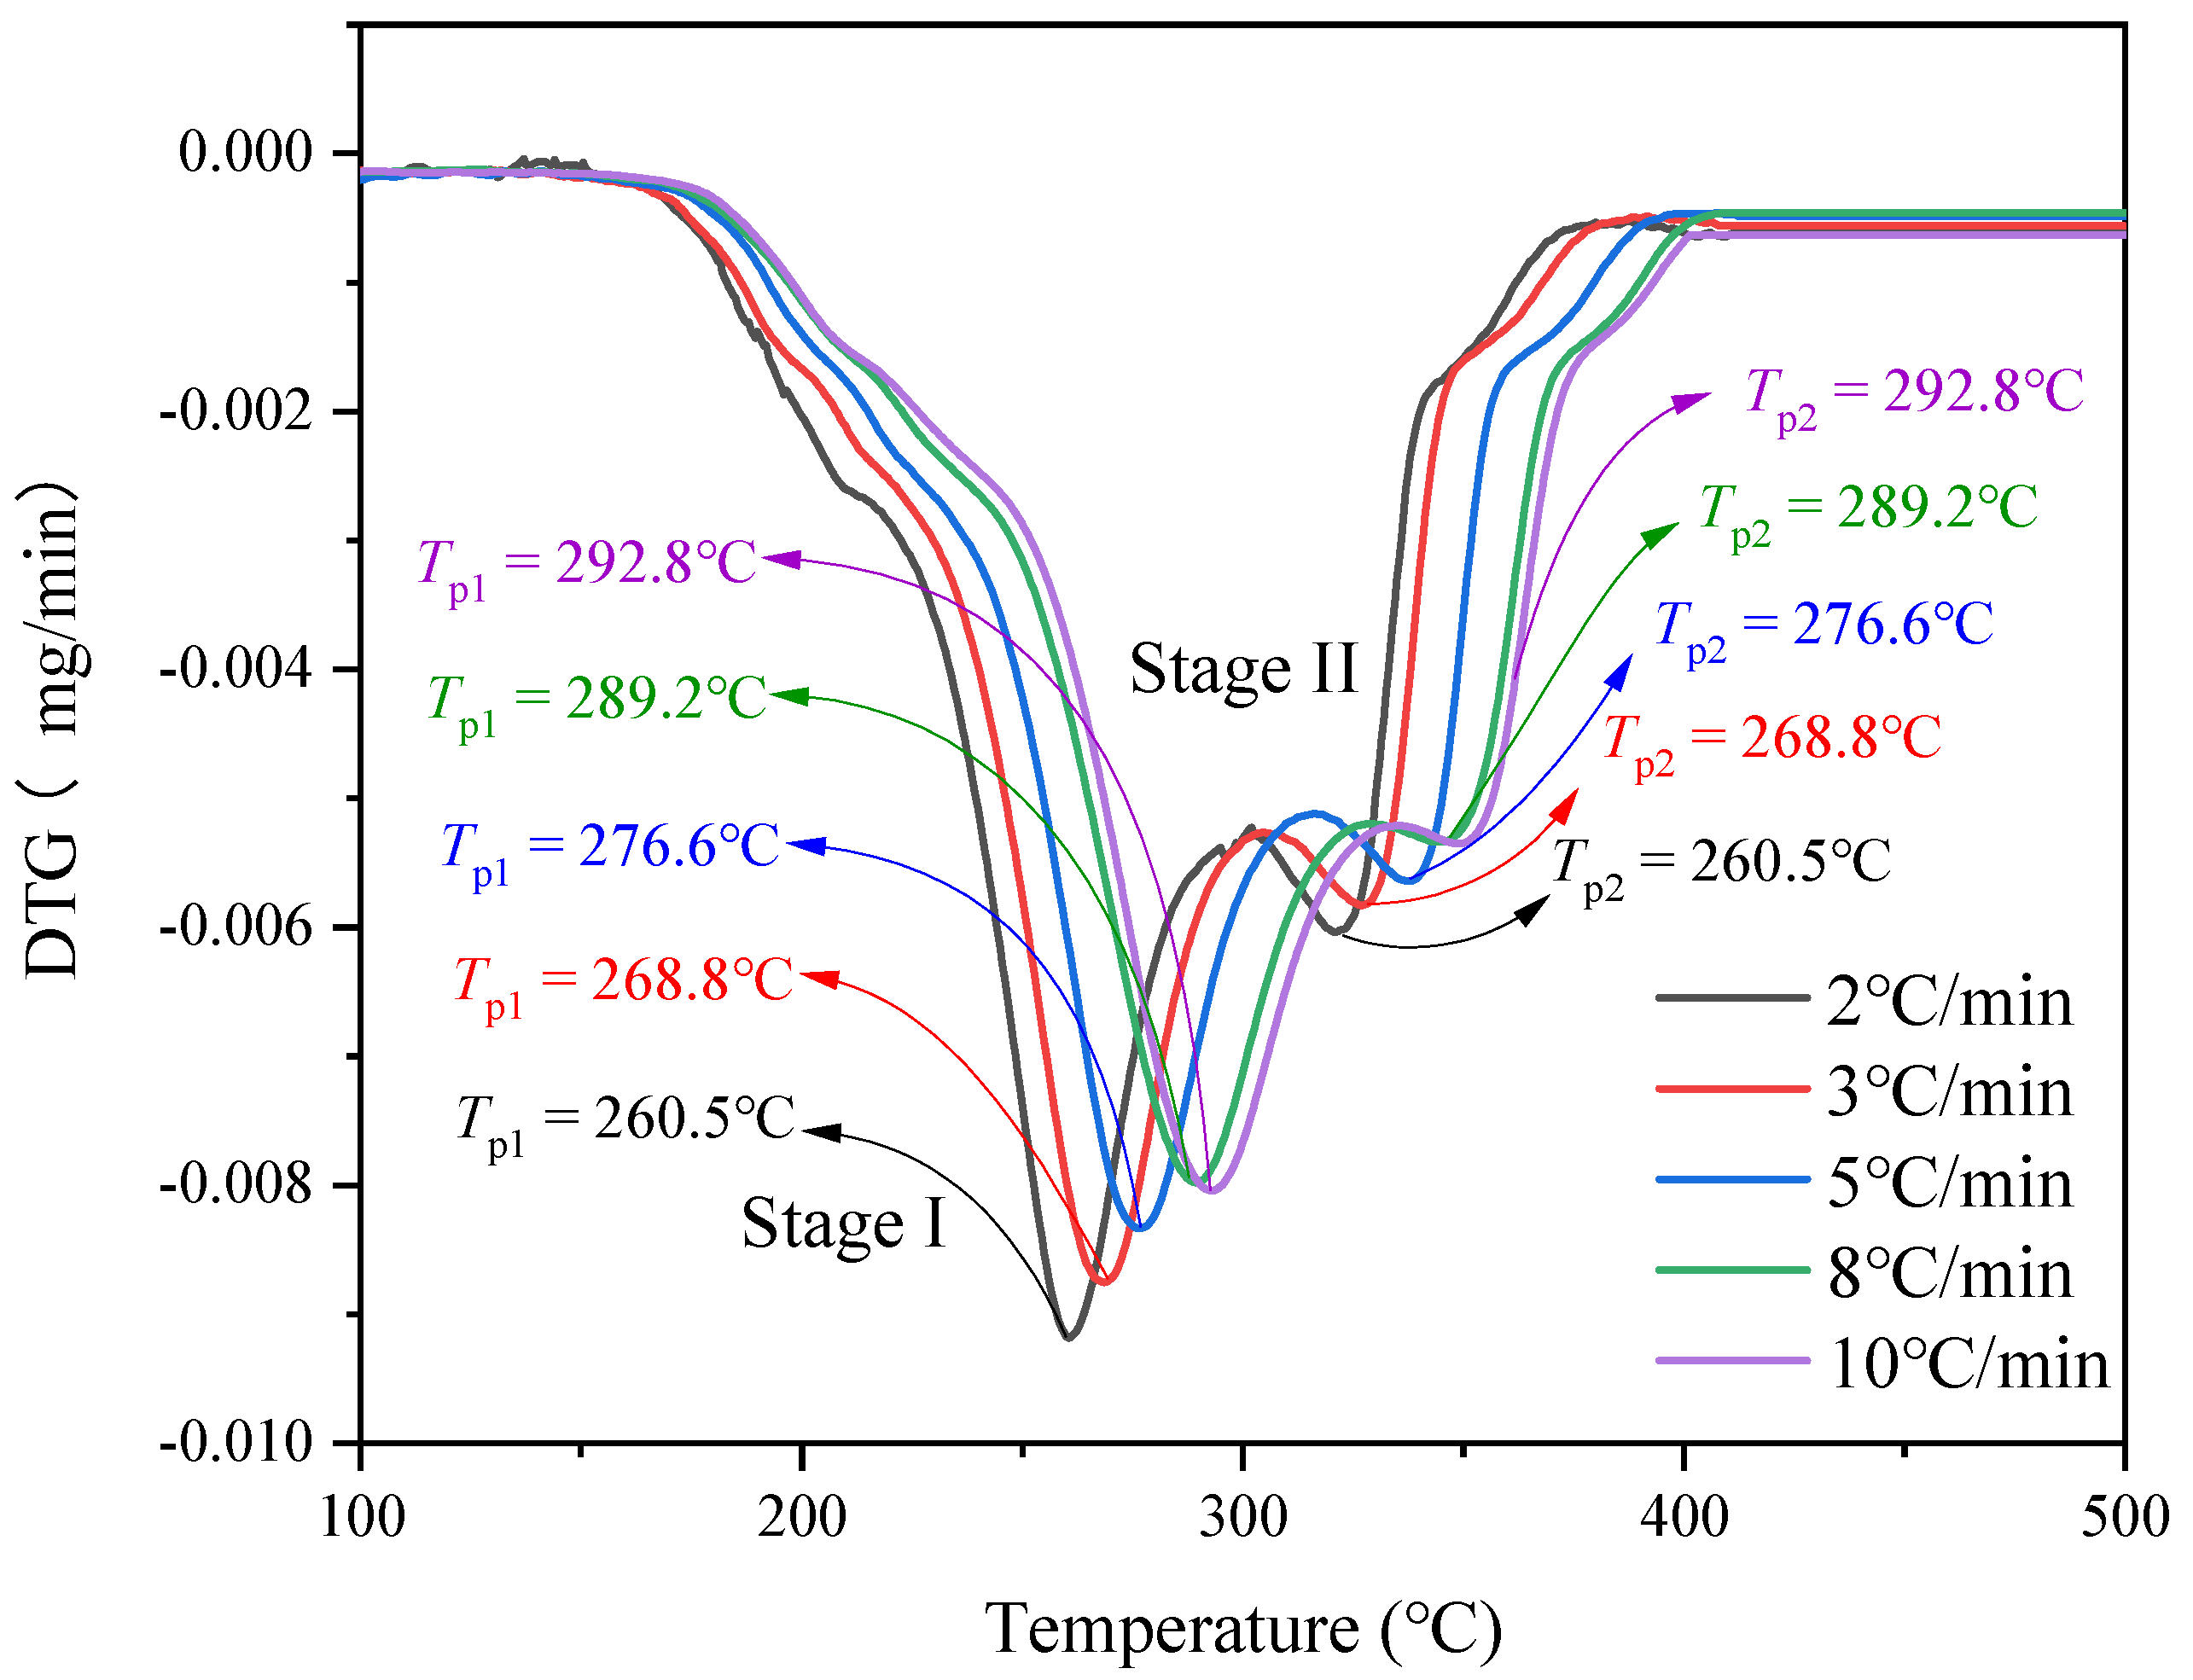
Thermal decomposition analysis by TG.
Figure 6 describes PSS + (NH4)2SO4 produced in the sulfonation synthesis process at different β in DTG curve. DTG curve is the first-order partial derivative of TG measured data, indicating the DTG of the substance. In mass reduction, the DTG increased twice and formed two mass loss peaks. Furthermore, the β varied also affect the DTG. When the β value increases, the peak value of DTG curve becomes sharper. The DTG of the substance at the two peaks and its corresponding temperatures are T1 and T2. The PSS + (NH4)2SO4 was stable before 180 °C in the standard air atmosphere environment, as listed in Table 3. After 180 °C, PSS + (NH4)2SO4 shows evident exothermic decomposition with increasing temperature. This is because it was generated into CO and water, and the mass decreased. So at the same temperature, when the β is higher, the mass loss rate of PSS + (NH4)2SO4 is also higher. The β value affected the temperature at which mass loss begins, the peak temperature in the DTG curve took place at the lower temperature with the higher β. It illustrated that at the same mass loss rate, the β value prevents an inversely proportional trend with mass loss temperature of PSS + (NH4)2SO4.
(3)
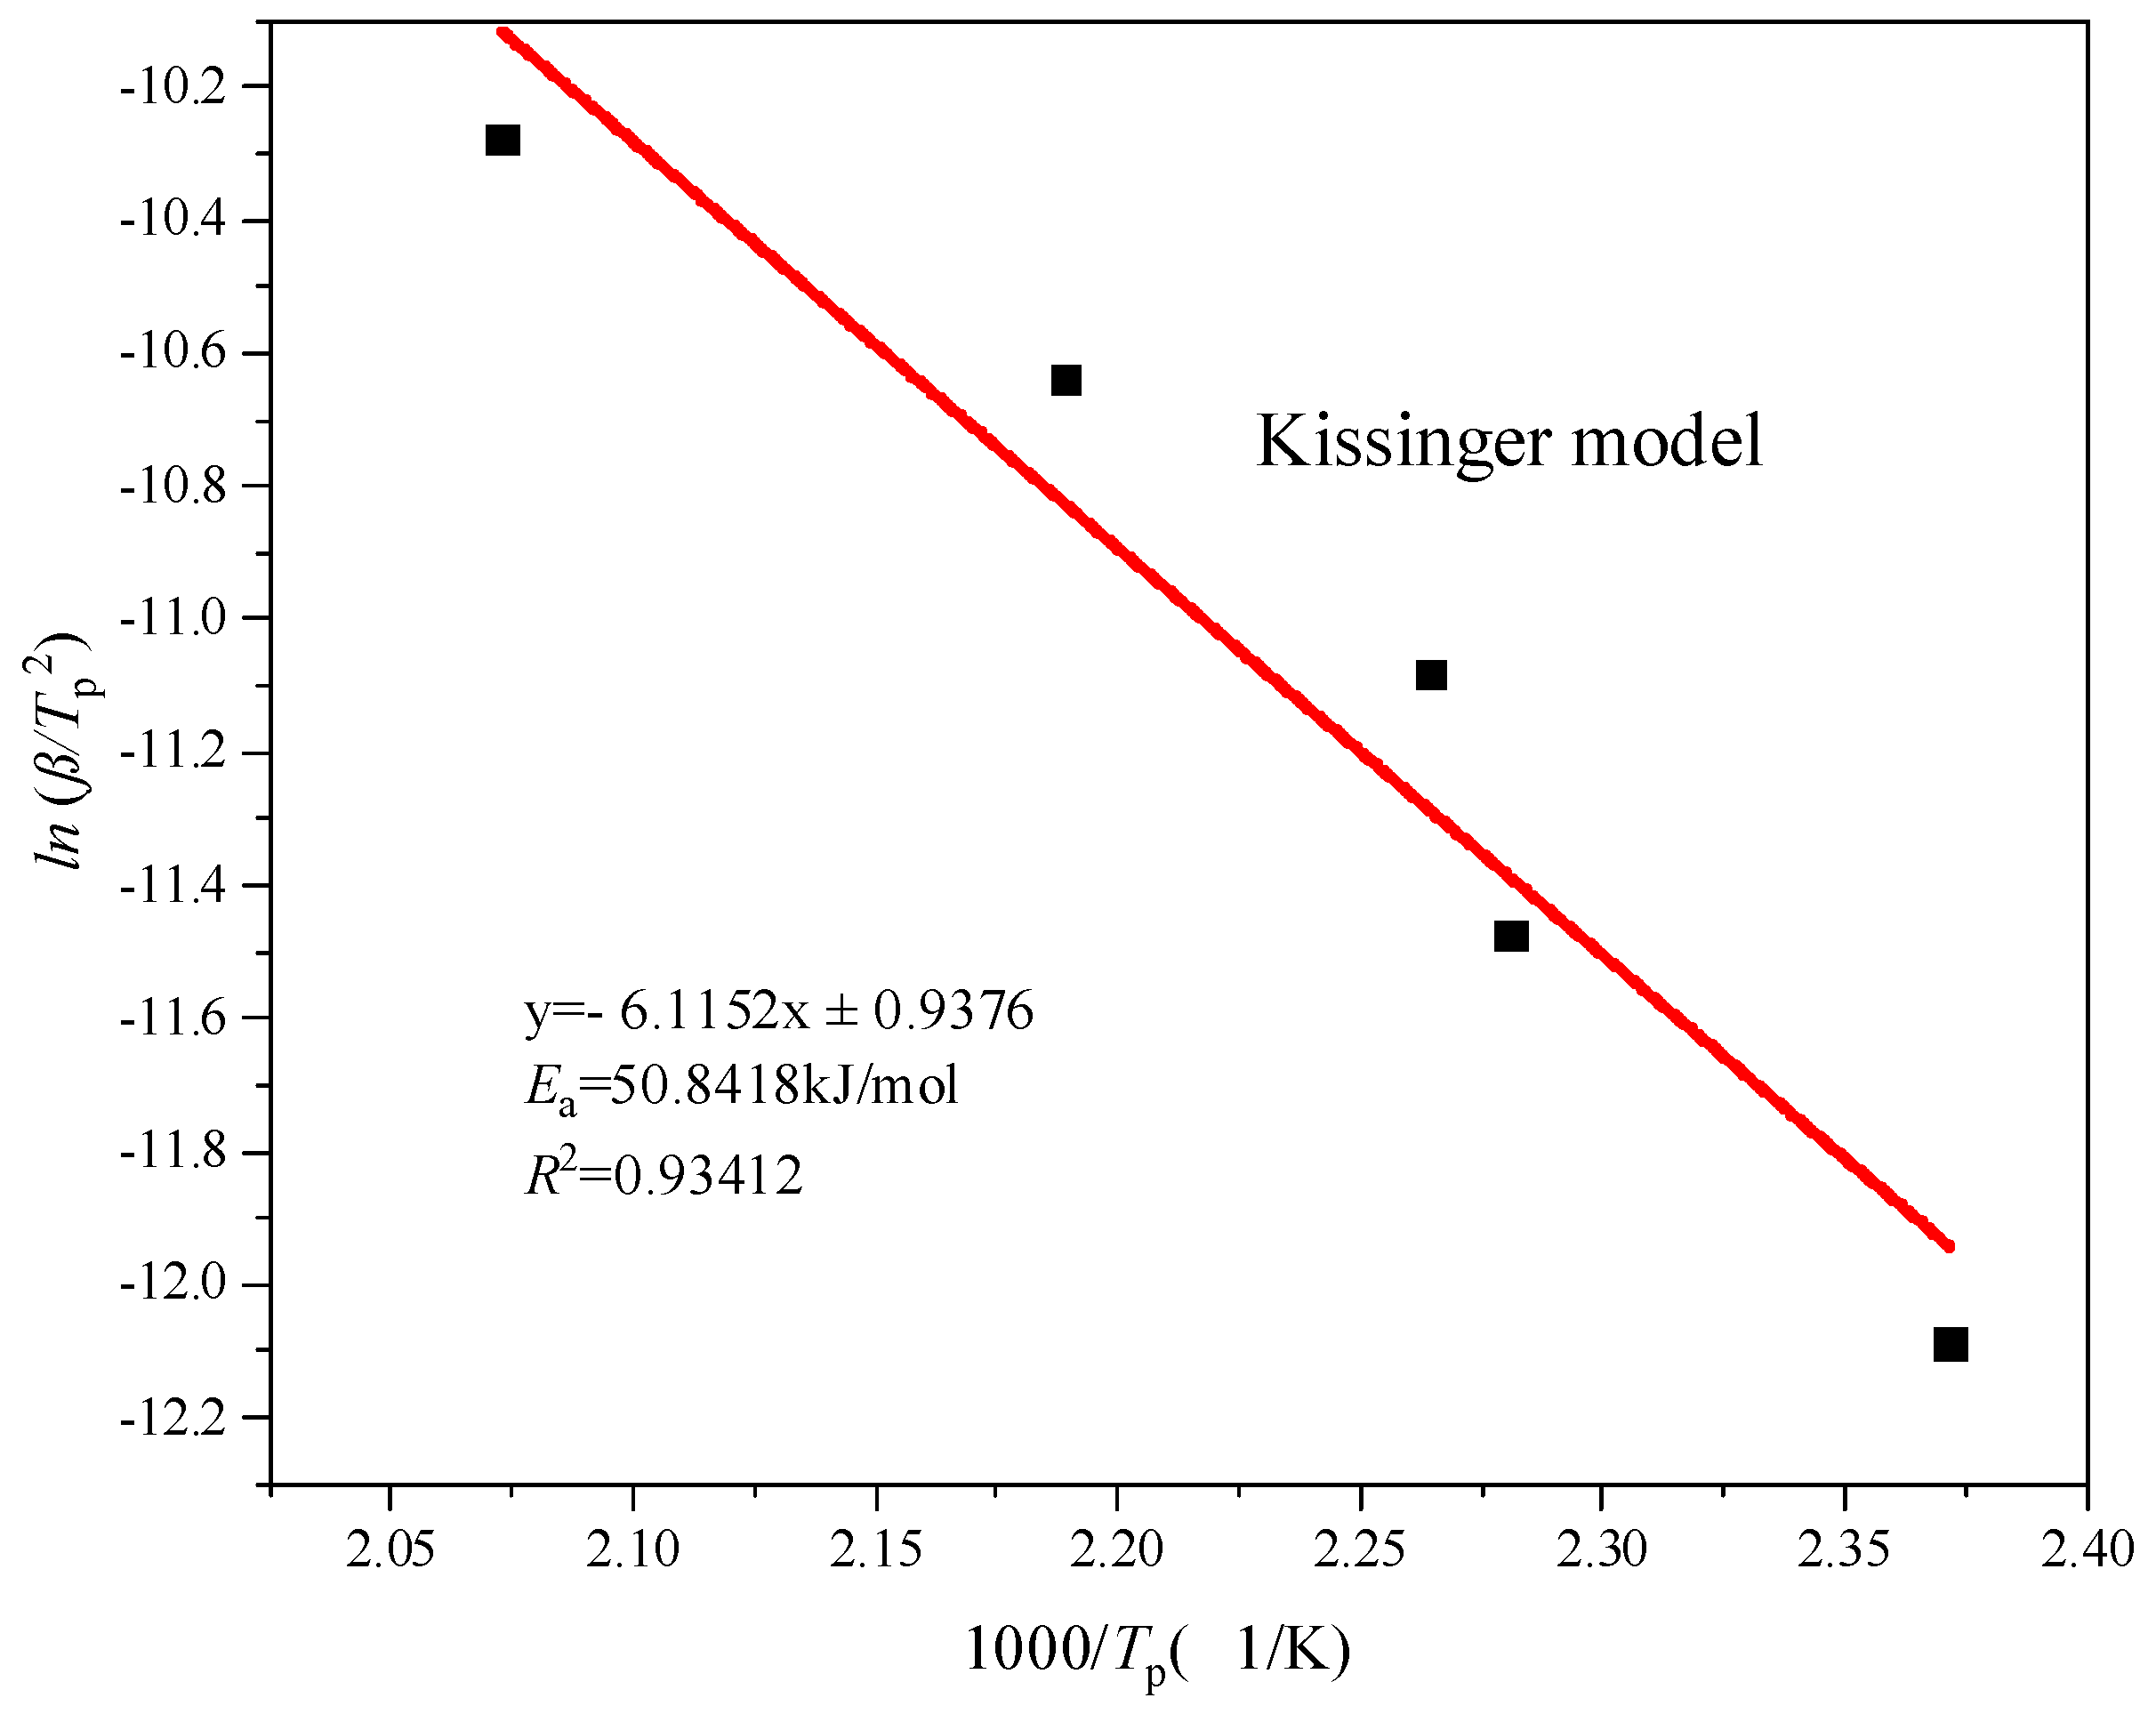
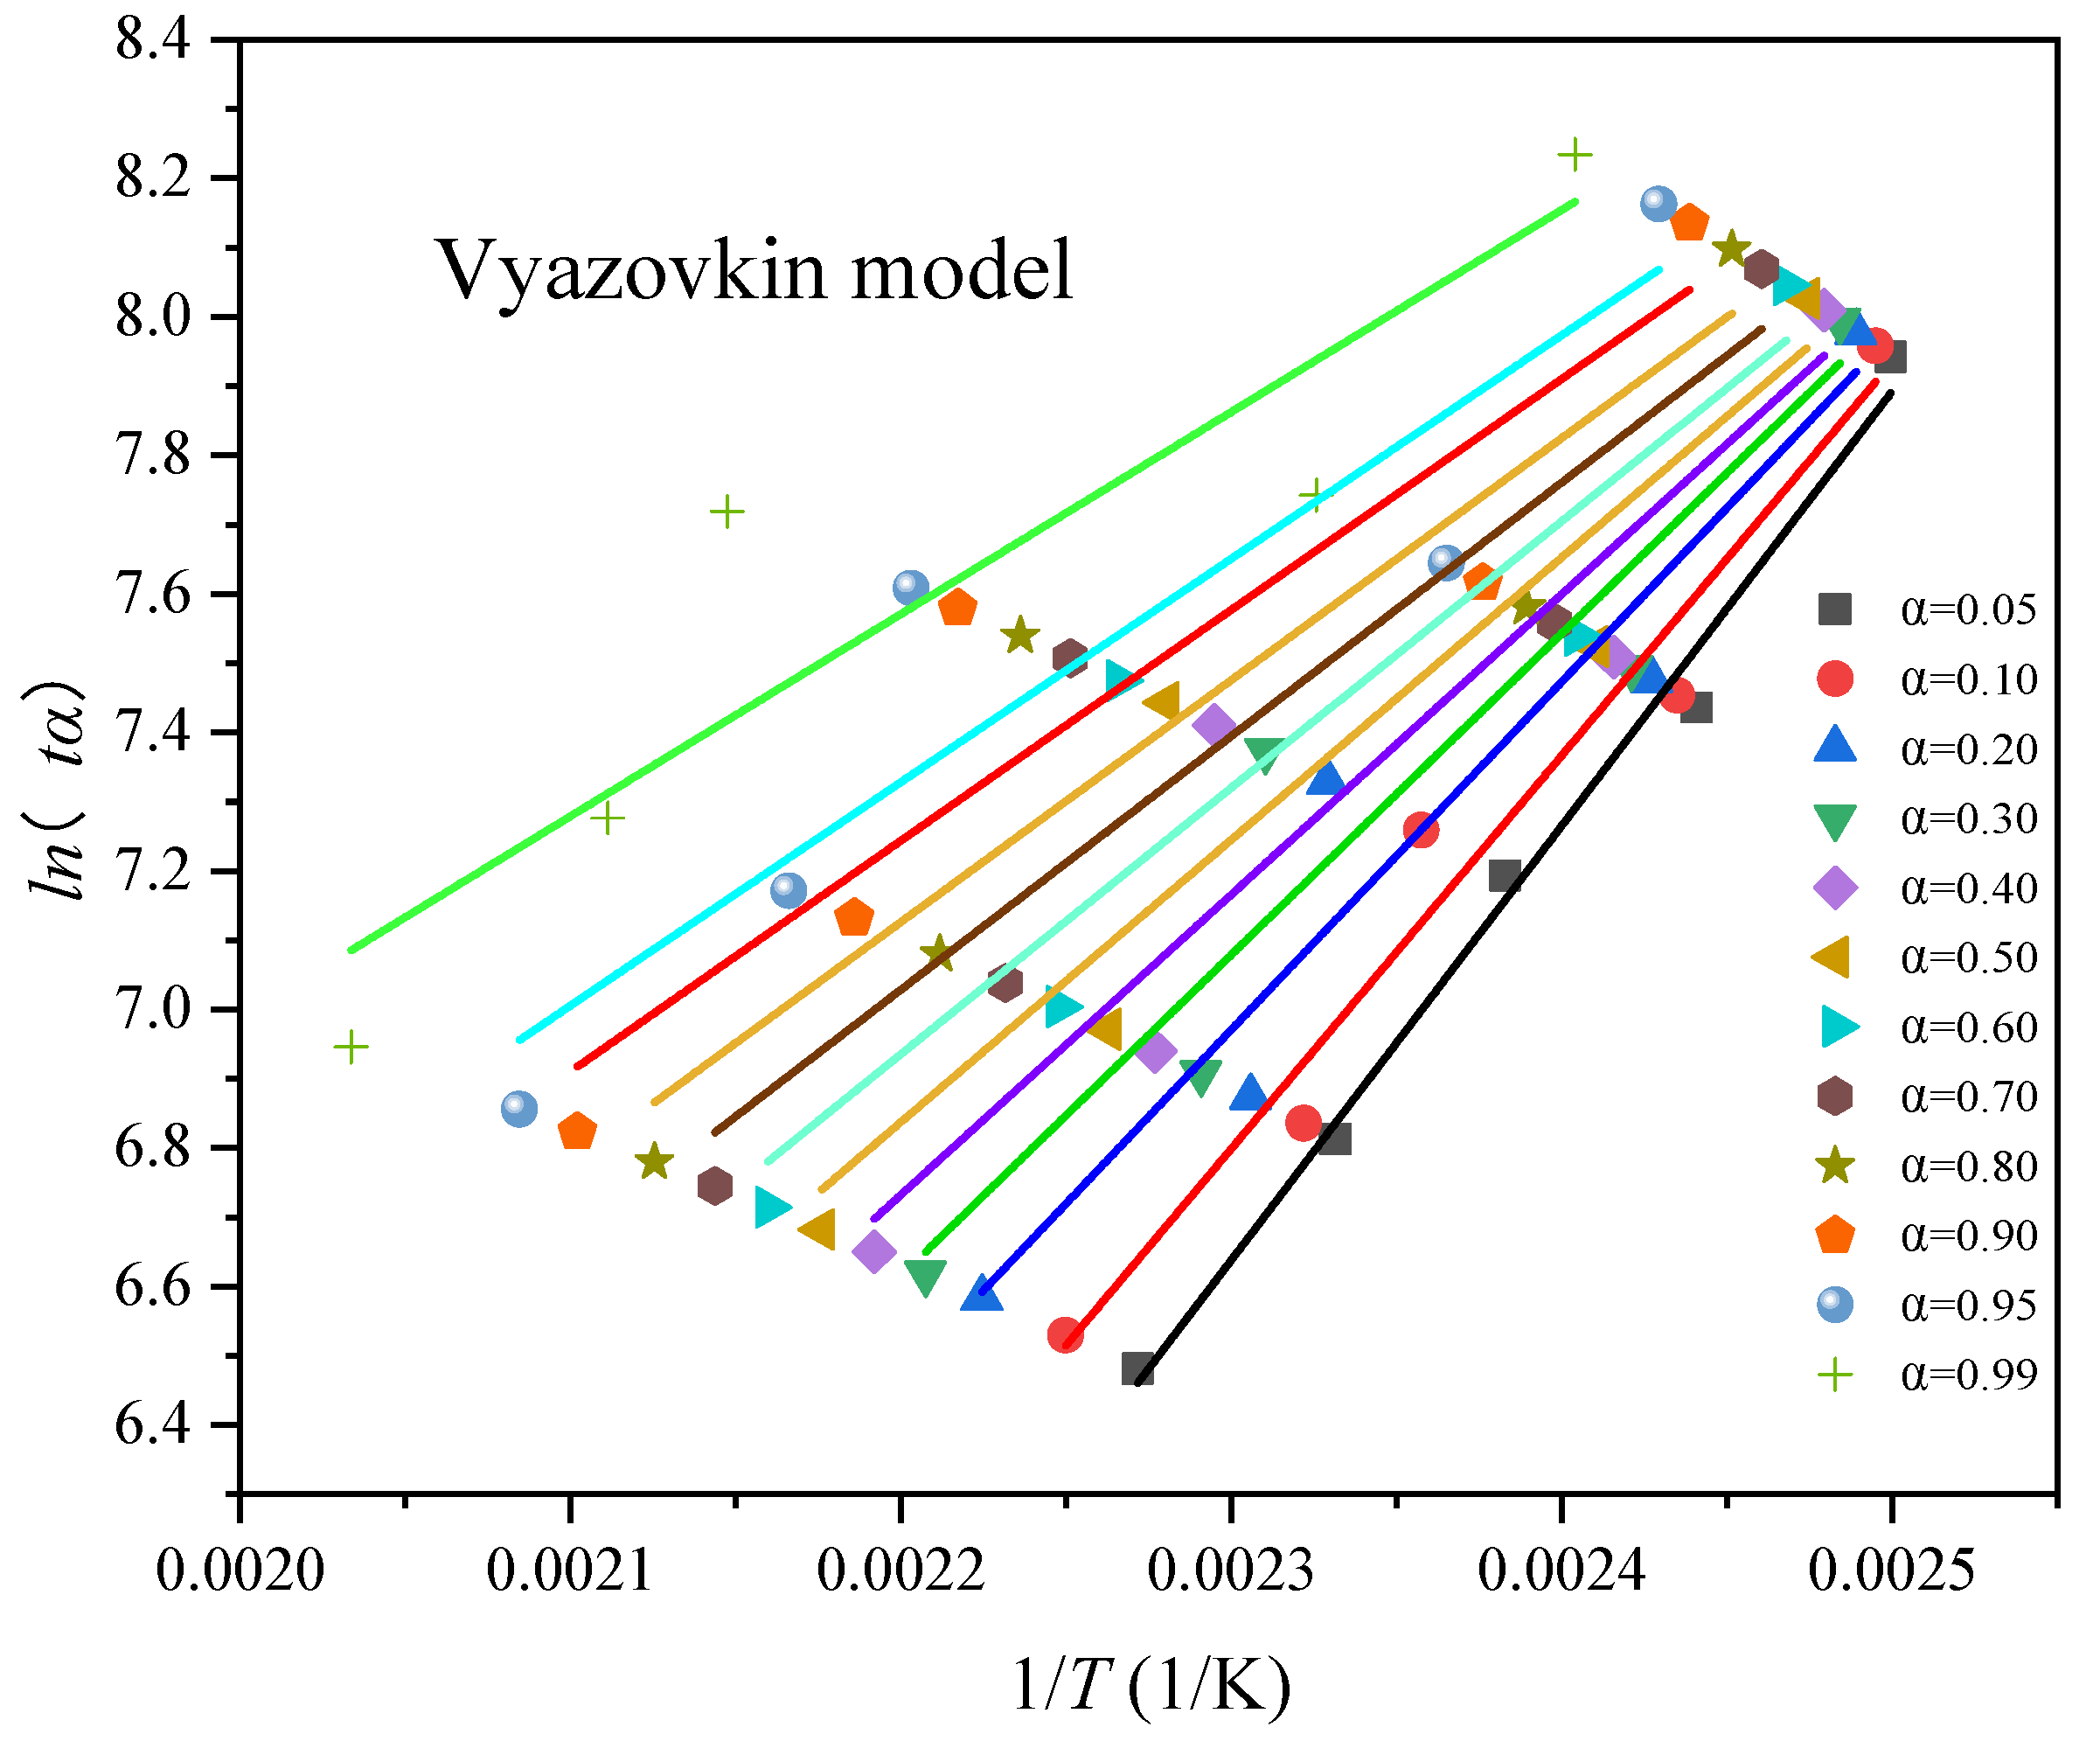
Analysis of thermokinetic results
The first exothermic peak was studied, and some thermokinetic parameters of the substance were obtained. According to the relevant research of the International Conference on Thermal Analysis and Calorimetry, we can combine several different β, establish the thermokinetic model, and the Ea of the material is solved by various model calculation methods [36,37,38]. The Kissinger model was used to establish a linear equation and solve the Ea according to the temperature parameters. In the meantime, according to the α recorded in the experimental process, FWO, Vyazovkin, and KAS models were used for calculation. This was done to achieve the effect of mutual verification, reduce errors, and improve the accuracy of the Ea [39,40,41].
Figure 7 diagrams the linear relationship between ln(β/Tp2) and 1000/T(K) by substituting β, the exothermic peak and the system temperature corresponding to the exothermic peak into the Kissinger model. According to the relevant results, the Ea of PSS + (NH4)2SO4 is 50.8418 kJ/mol, and the R2 is 0.9341.
By substituting the α, the β, and corresponding system temperature into FWO model calculation, we select the α of 0.05, 0.1, 0.2, 0.3, 0.4, 0.5, 0.6, 0.7, 0.8, 0.9, 0.95, and 0.99. the Ea for all the samples was calculated from the slope of the lines within the conversion range of 0.05–0.99 are shown in Figure 8. It can be seen from the figure that the fitting degree is not directly proportional to the Ea value. The average value Ea is 51.4959 kJ/mol, and R2 value is 0.9562.
The fitting results through the linear relationship between ln(α) and 1/T in Vyazovkin model is shown in Figure 9. Among them, the calculated value of Ea is higher with the decrease of the fitting degree. The average value of Ea is 46.9087 kJ/mol, and the R2 is 0.9006. The KAS model was used to calculate the average Ea of PSS + (NH4)2SO4—results are shown in Table 4. As the value of α is less than 0.3, the value of Ea is greater than 50 kJ/mol. On the contrary, the value of Ea decreases continuously and is less than 50 kJ/mol when the value of α is greater than 0.3. The average value of Ea is 47.0870 kJ/mol, and the R2 is 0.9417.
The Ea and R2 of PSS + (NH4)2SO4 can be obtained through the fitting calculation of four thermokinetic models. The results show the R2 is close to 1.0, and the difference of each fitted Ea is slight, which illustrates the fitting results obtained by these four methods are relatively reasonable and scientific. Finally, Table 5 presents the fitting results of the four thermokinetic models. The Ea of PSS + (NH4)2SO4 is 49.0833 kJ/mol.

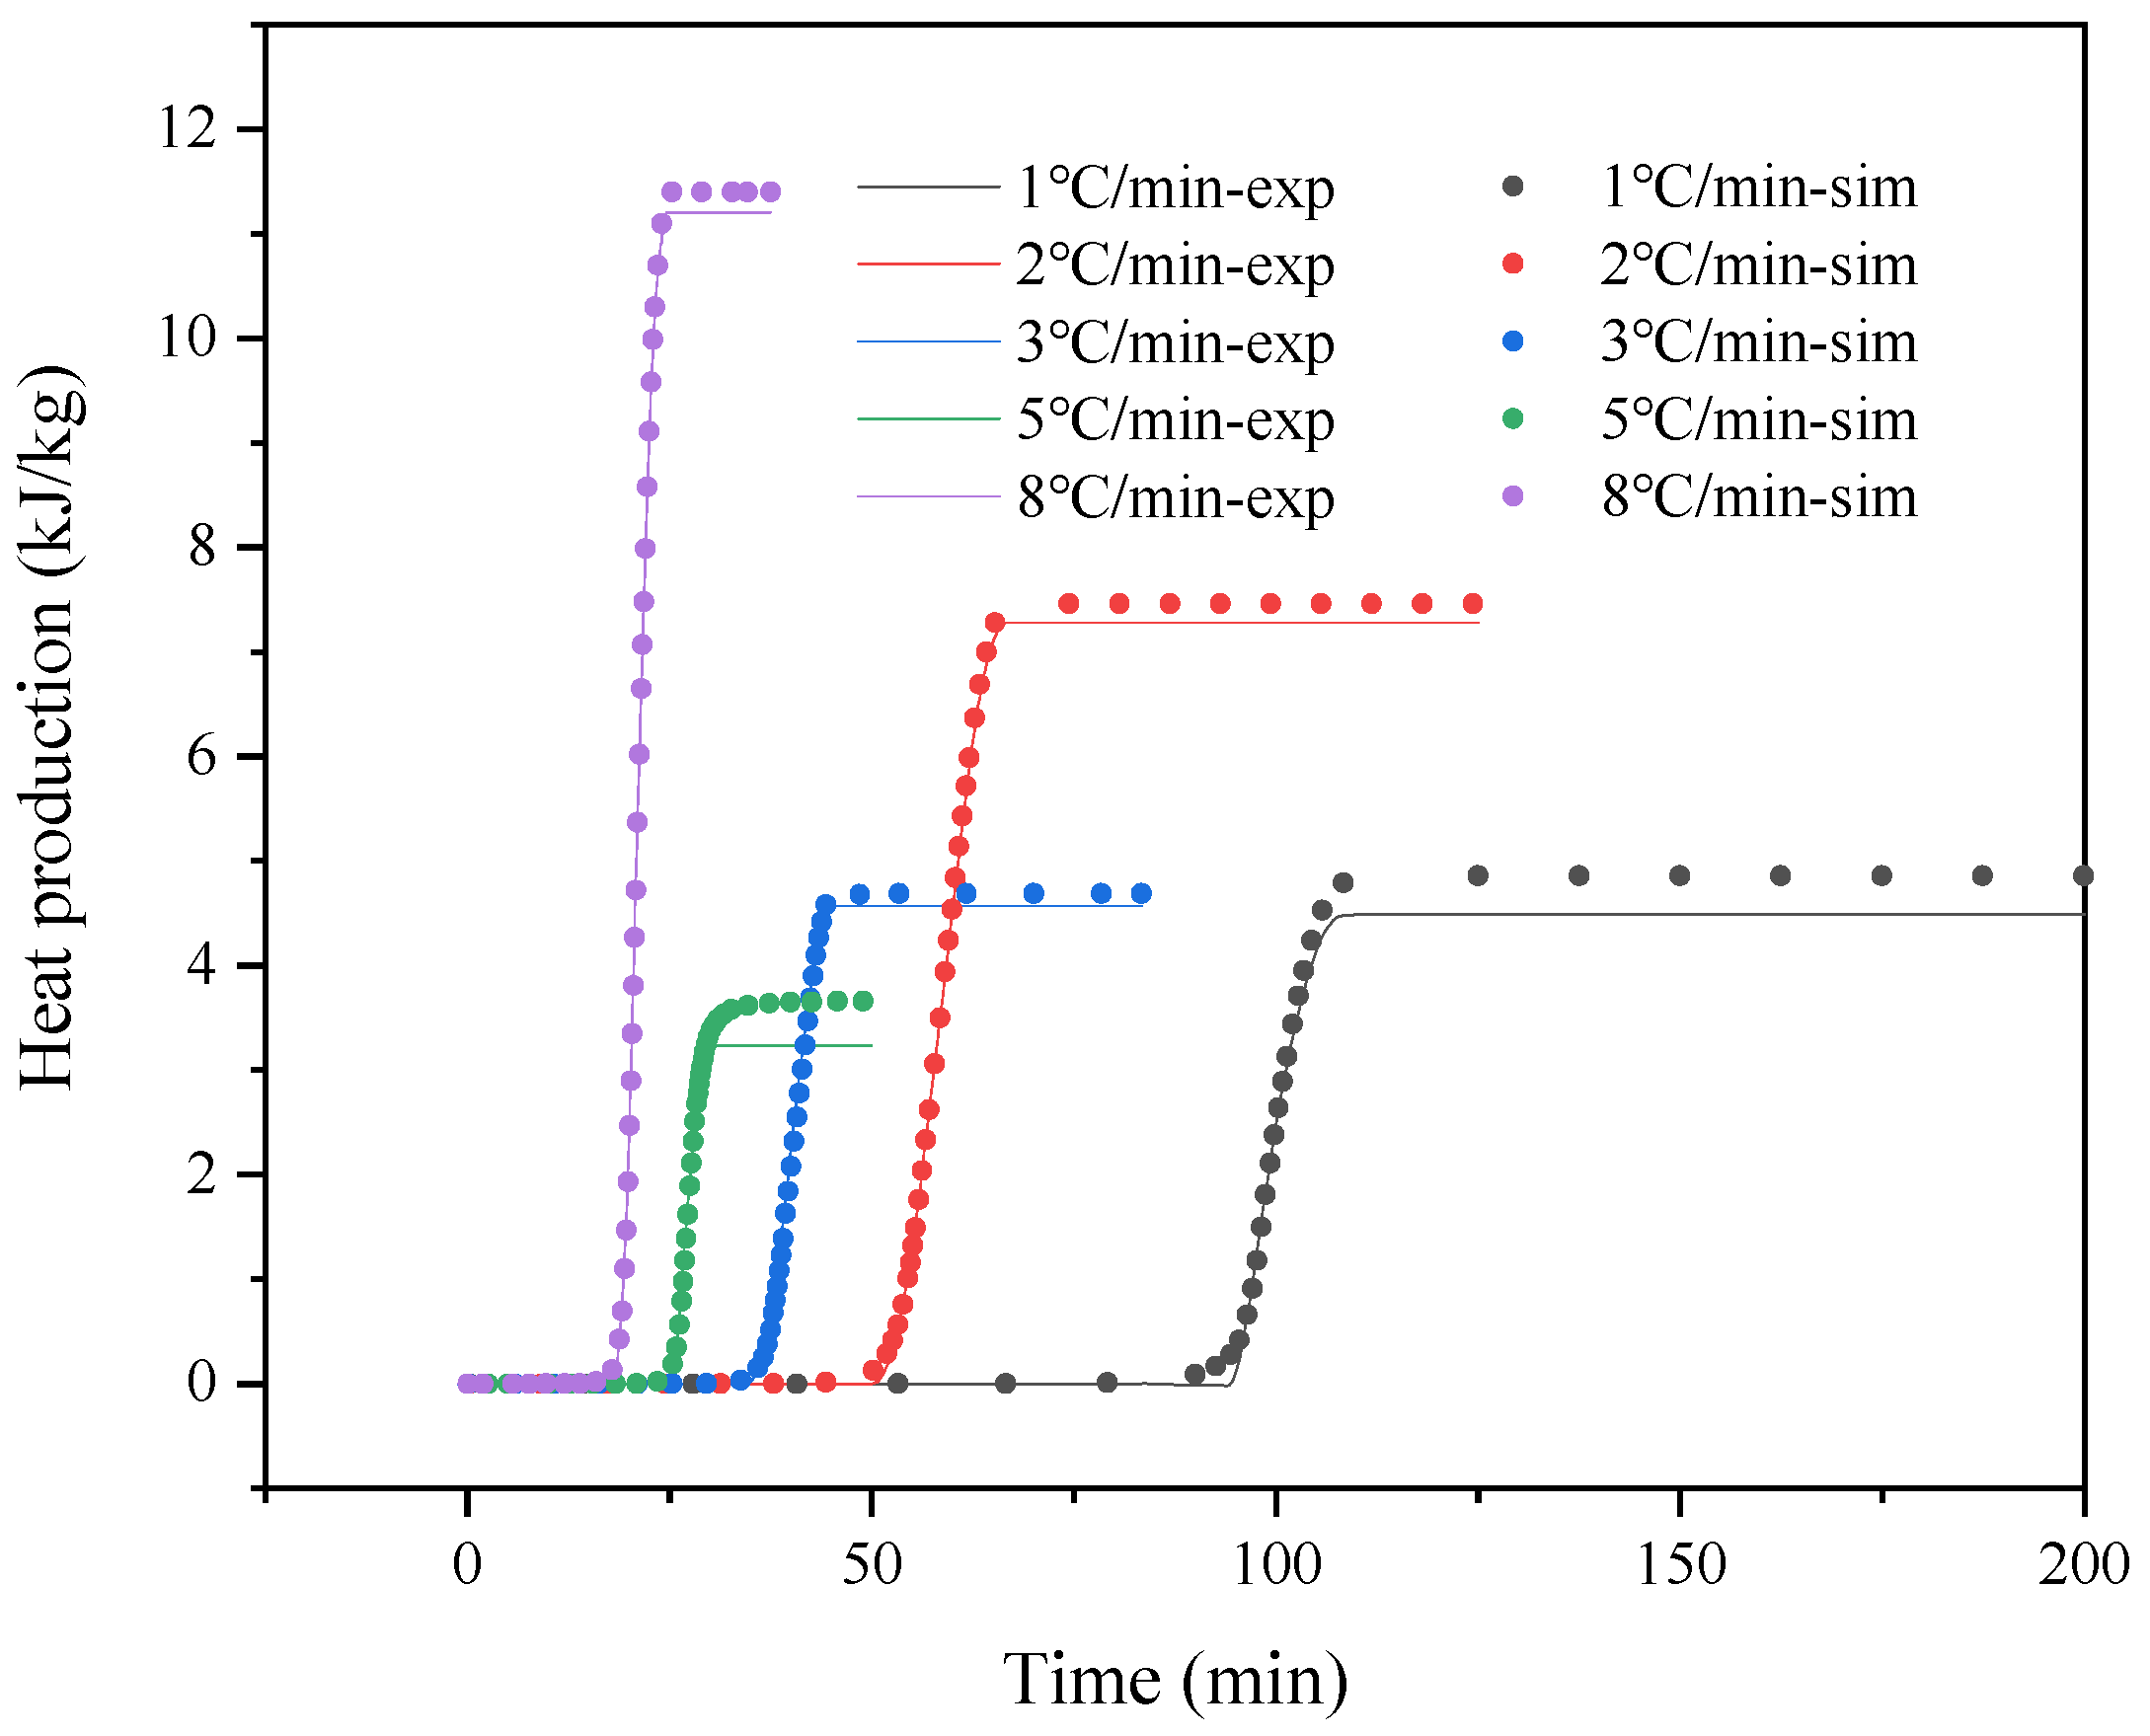
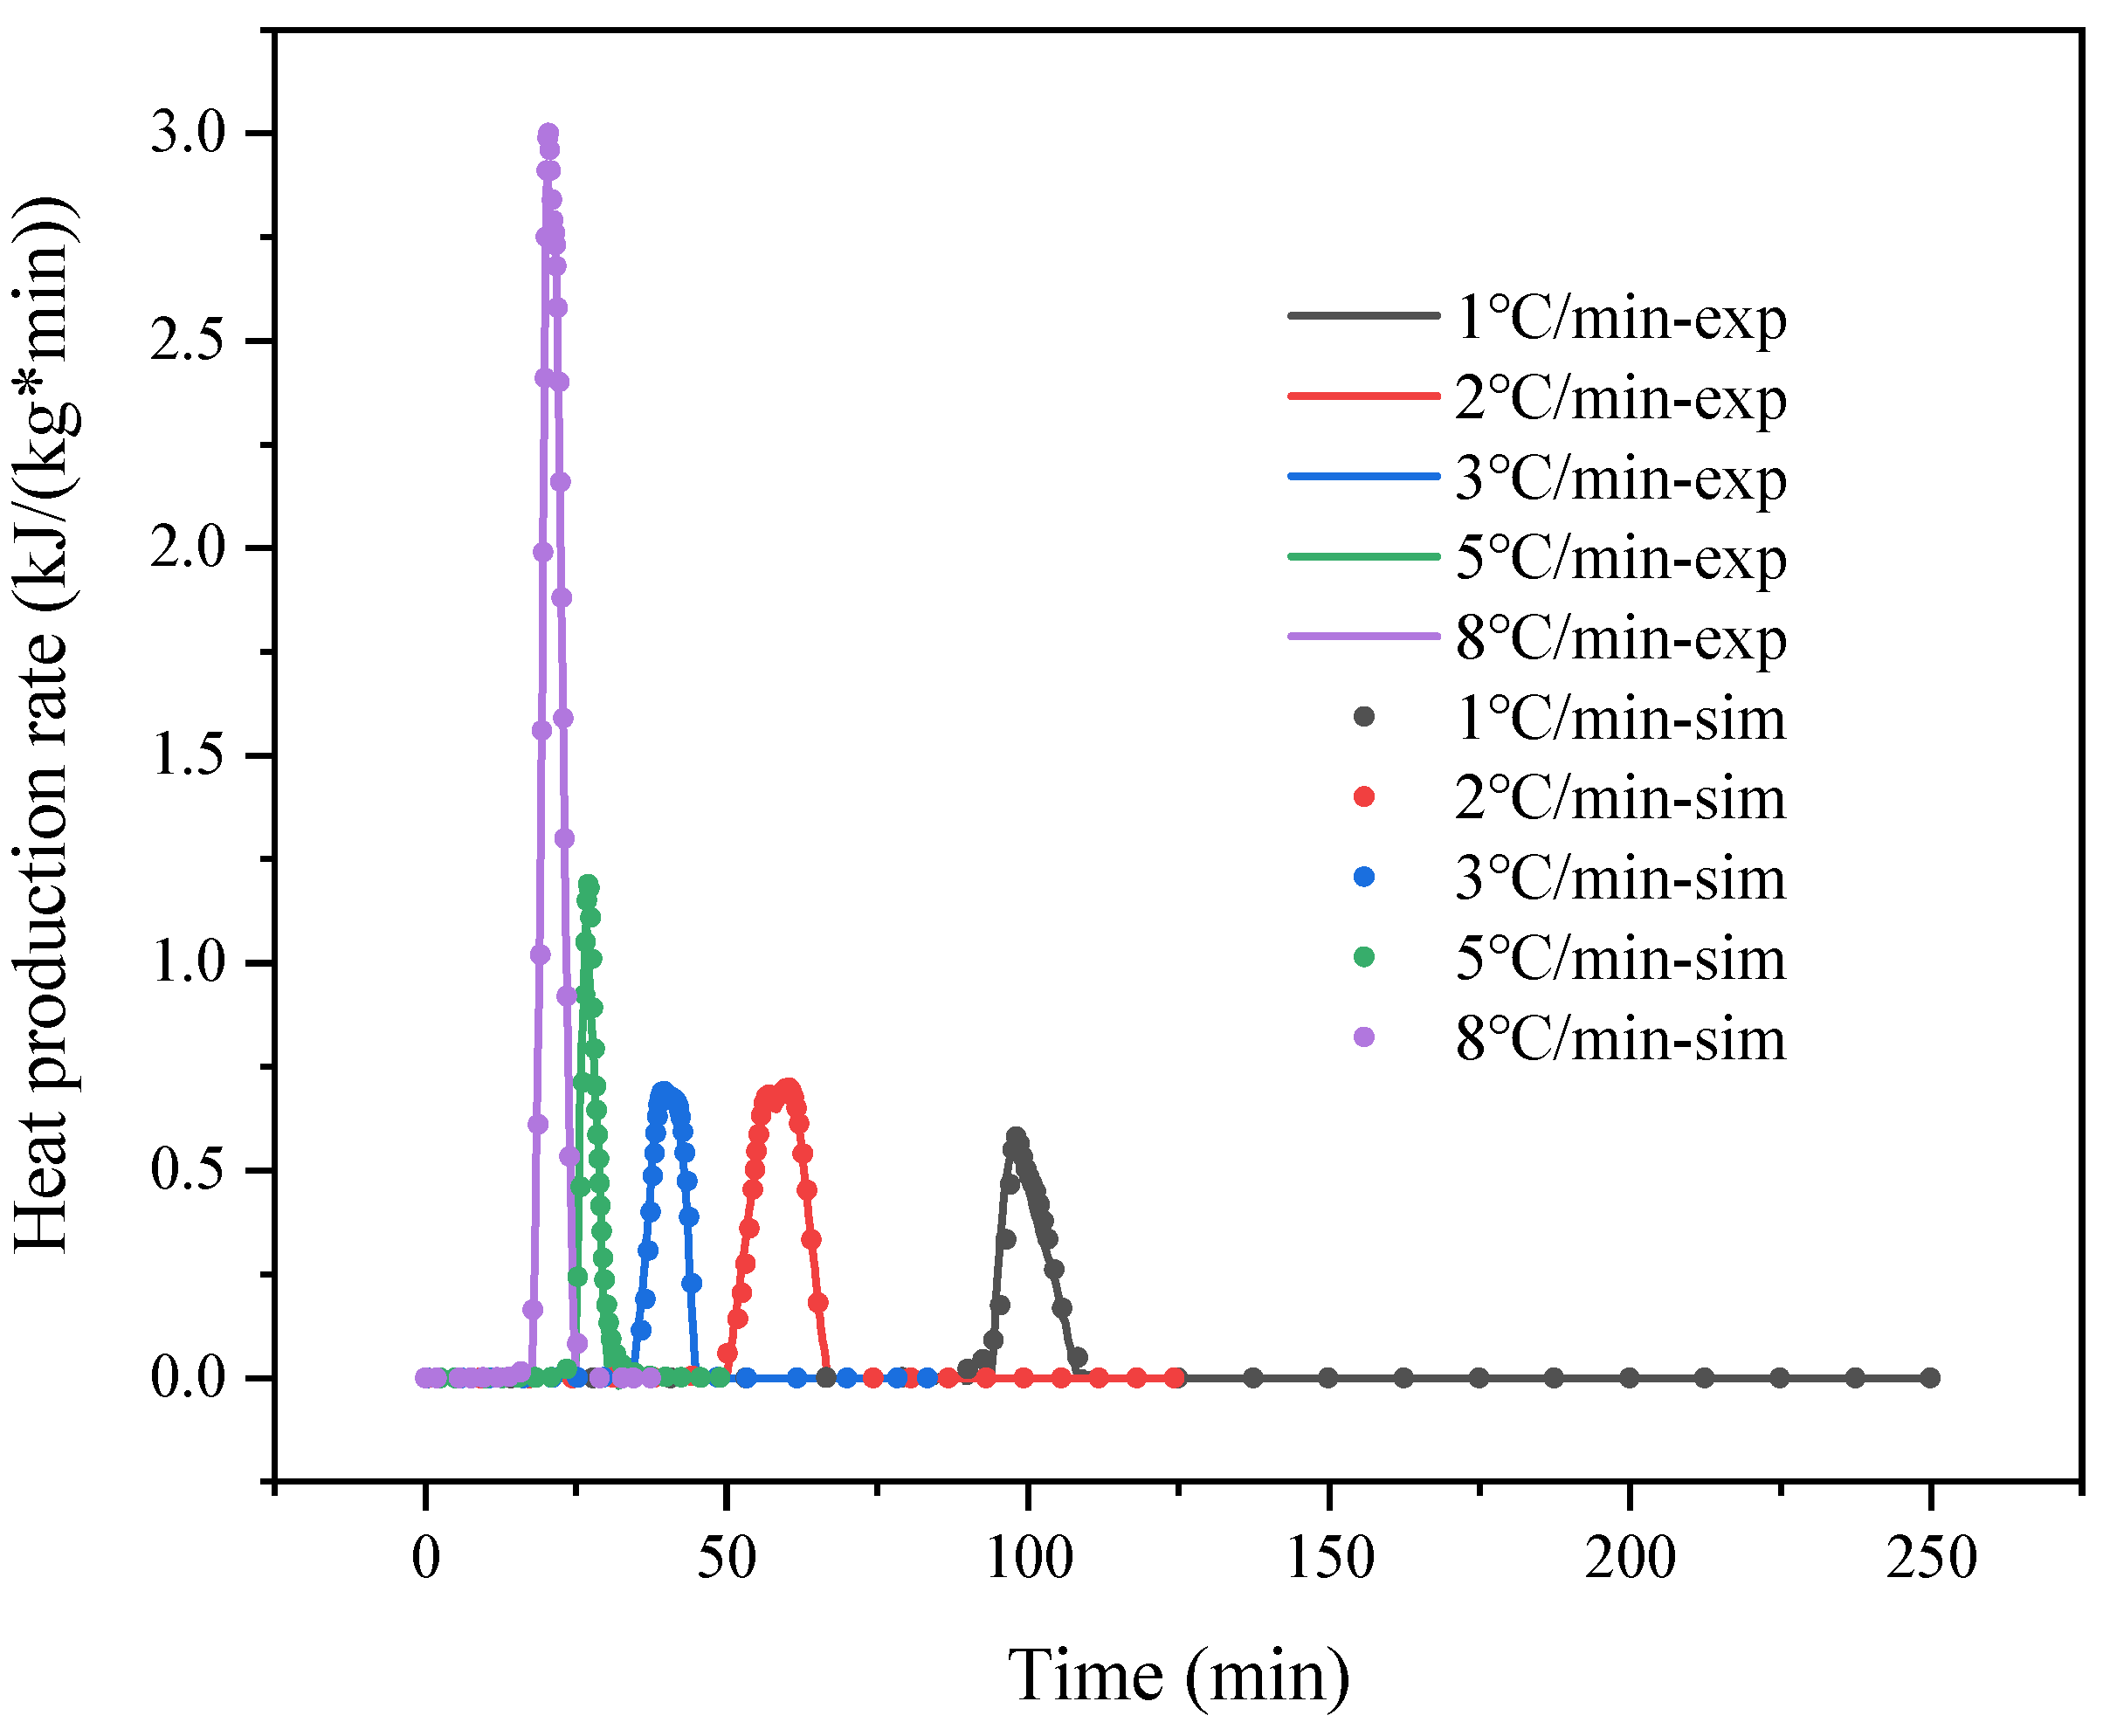
3.3. Thermokinetic Parameters Determined by Autocatalytic Model

According to the DSC curve of PSS + (NH4)2SO4 in the exothermic process (Figure 4). The curves of the initial stage of the exothermic process did not overlap, and the whole curve is biased to the side with higher temperatures. According to the empirical judgment method of spectrum and a multitude of simulation experiments. It is preliminarily concluded that the exothermic process of PSS + (NH4)2SO4 in the sulfonation process is a two-stage autocatalytic process. The following reaction formats are considered in Equations (4)–(6) [42,43].
A + n B n + 1 B
A B
B C
In this autocatalytic reaction process, the reaction is often accelerated with the rapid consumption of reaction substances, and autocatalytic substances are produced at the same time. The autocatalytic model Equation (7) is as follows:
d α d t = K 0 e E a / R T 1 α n 1 z + α n 2
where n1 and n2, respectively, represent the first and second stages of the reaction and z is the autocatalytic factor.
As listed in Table 6, In different conditions β at (1, 2, 3, 5, and 8 °C/min), the relationship between the β and time and the relationship between heat release and time are shown in Figure 10 and Figure 11, respectively, where sim and exp represent simulation and experimental data, respectively, comparing the model simulation with the actual DSC curve. The fitting results of the autocatalytic model are completely scattered on the same line as the DSC experimental data. This illustrates that the simulation results are consistent with the experimental results. The fitting results of the autocatalytic model showed the Ea fitted by autocatalytic model was 68.43 kJ/mol. Therefore, the kinetic parameters simulated by autocatalytic model are not different from those calculated by Kissinger, FWO, and KAS model.
Figure 12 shows the curve of TCL and TMRad, where TCL depends on the temperature of PSS + (NH4)2SO4 calculated according to the kinetic model. The dependence of time instant is the conversion limit time when the reaction conversion reaches a predetermined value. Therefore, estimating TCL studied the safe conversion time of the substance. Furthermore, the parameters studied can evaluate the thermal stability of PSS + (NH4)2SO4 to establish the thermal safety parameters of the substance in the production process. The results showed that in some hot areas, when the temperature reaches 42 °C, the conversion of the substance could also reach a limit value of 200 days.
The estimation of dynamic model simulation (TMRad) shows the correlation of the maximum rate time according to the kinetic model. At present, the probability evaluation standard of thermal runaway accidents in this regard is mainly based on the suggestions of Stossel [44]. When TMR < 480 min, it is considered that the probability of an accident is high. According to the simulated TMR curve, the temperature of PSS + (NH4)2SO4 in daily production and use should not be higher than 63 °C.

4. Conclusions

We reproduced the sulfonation reaction in PSS production in the laboratory and studied the thermal stability of PSS + (NH4)2SO4 produced by increasing the temperature. The experimental results of DSC show that PSS + (NH4)2SO4 caused an exothermic reaction under continuous heating. There is a positive proportional relationship between T0, Tp, and β. The PSS + (NH4)2SO4 began decomposition after reaching 160 °C. The starting temperature and rate of decomposition were consistent with β positive correlation. They were reflected in the TG experiment. Because the heat released by the substance is relatively low during the experiment, the thermal risk of this substance in daily production is not too great. Through the fitting calculation of four reliable kinetic models (Kissinger, FWO, Vyazovkin, and KAS models), the Ea of PSS + (NH4)2SO4 is 49.0834 kJ/mol, and the R2 is 0.9417. Since the value of Ea is relatively low, the substance is easy to react to when heated. In order to prevent the energy released after PSS + (NH4)2SO4 reaction. It is recommended that the substances be stored separately and avoid the temperature of the storage environment not exceeding 61 °C. The autocatalytic methods were used to study the conversion limit time and the maximum rate of PSS + (NH4)2SO4. It provides help for optimizing PSS production process and establishing thermal safety parameters of PSS + (NH4)2SO4 in the future. It also provides a basis for studying the influence of (NH4)2SO4 on the thermal stability of the system under the thermal runaway.

Author Contributions

Conceptualization, C.Y.; methodology, Y.-C.L.; software, J.W.; validation, A.-C.H.; formal analysis, Y.T.; investigation, J.Z.; writing—original draft preparation, C.Y.; writing—review and editing, A.-C.H. and C.-F.H.; visualization, C.-M.S.; supervision, J.-C.J.; project administration, Z.-X.X.; funding acquisition, Z.-X.X. All authors have read and agreed to the published version of the manuscript.

Funding

The authors thank the National Key Research and Development Plan (No. 2021YFC3001203), the National Nature Science Foundation of China (No. 21927815), the National Key Research Development Program of China (No. 2021YFC3001203) and the Postgraduate Research & Practice Innovation Program of Jiangsu Province (KYCX21_2886) for financial support.

Data Availability Statement

Not applicable.

Conflicts of Interest

The authors declare no conflict of interest.

References

  1. Xue, Y.-T.; Ren, L.; Li, S.; Wang, L.-L.; He, X.-X.; Zhao, X.; Yu, G.-L.; Guan, H.-S.; Li, C.-X. Study on quality control of sulfated polysaccharide drug, propylene glycol alginate sodium sulfate (PSS). Carbohydr. Polym. 2016, 144, 330–337. [Google Scholar] [CrossRef] [PubMed]
  2. Xin, M.; Ren, L.; Sun, Y.; Li, H.-H.; Guan, H.-S.; He, X.-X.; Li, C.-X. Anticoagulant and antithrombotic activities of low-molecular-weight propylene glycol alginate sodium sulfate (PSS). Eur. J. Med. Chem. 2016, 114, 33–40. [Google Scholar] [CrossRef]
  3. Xue, Y.-T.; Li, S.; Liu, W.-J.; Xin, M.; Li, H.-H.; Yu, G.-L.; Guan, H.-S.; He, X.-X.; Li, C.-X. The mechanisms of sulfated polysaccharide drug of propylene glycol alginate sodium sulfate (PSS) on bleeding side effect. Carbohydr. Polym. 2018, 194, 365–374. [Google Scholar] [CrossRef] [PubMed]
  4. Uma, K.; Lalithamba, H.S.; Revanasiddappa, B.C. Synthesis and characterization of biologically active N-protected formamides employing Nano TiO2 and their utilization for the synthesis of thioformamides. Chem. Data Collect. 2020, 30, 100591. [Google Scholar] [CrossRef]
  5. Norval, G.W. Analysis of a blast due to inadvertant mixing of ammonium sulfate and sodium hyplochlorite. Process Saf. Prog. 2016, 35, 92–95. [Google Scholar] [CrossRef]
  6. Sun, Q.; Jiang, L.; Li, M.; Sun, J. Assessment on thermal hazards of reactive chemicals in industry: State of the Art and perspectives. Prog. Energy Combust. Sci. 2020, 78, 100832. [Google Scholar] [CrossRef]
  7. Guan, R.; Zou, H.; Lu, D.; Gong, C.; Liu, Y. Polyethersulfone sulfonated by chlorosulfonic acid and its membrane characteristics. Eur. Polym. J. 2005, 41, 1554–1560. [Google Scholar] [CrossRef]
  8. Huang, A.-C.; Li, Z.-P.; Liu, Y.-C.; Tang, Y.; Huang, C.-F.; Shu, C.-M.; Xing, Z.-X.; Jiang, J.-C. Essential hazard and process safety assessment of para-toluene sulfonic acid through calorimetry and advanced thermokinetics. J. Loss Prev. Process Ind. 2021, 72, 104558. [Google Scholar] [CrossRef]
  9. Lin, C.-P.; Tseng, J.-M.; Chang, Y.-M.; Cheng, Y.-C.; Lin, H.-Y.; Chien, C.-Y. Green thermal analysis for predicting thermal hazard of storage and transportation safety for tert-butyl peroxybenzoate. J. Loss Prev. Process Ind. 2012, 25, 1–7. [Google Scholar] [CrossRef]
  10. Castleman, B.A.; van der Merwe, E.M.; Doucet, F.J. Thermochemical purification of talc with ammonium sulphate as chemical additive. Miner. Eng. 2021, 164, 106815. [Google Scholar] [CrossRef]
  11. Darwish, E.; Mansouri, M.; Yilmaz, D.; Leion, H. Effect of Mn and Cu Substitution on the SrFeO3 Perovskite for Potential Thermochemical Energy Storage Applications. Processes 2021, 9, 1817. [Google Scholar] [CrossRef]
  12. Tafu, N.N.; Jideani, V.A. Characterization of Novel Solid Dispersions of Moringa oleifera Leaf Powder Using Thermo-Analytical Techniques. Processes 2021, 9, 2230. [Google Scholar] [CrossRef]
  13. Mohamed, A.; Hussain, S.; Alamri, M.S.; Ibraheem, M.A.; Qasem, A.A.A.; Ababtain, I.A. Physicochemical Properties of Starch Binary Mixtures with Cordia and Ziziphus Gums. Processes 2022, 10, 180. [Google Scholar] [CrossRef]
  14. Vyazovkin, S.; Burnham, A.K.; Favergeon, L.; Koga, N.; Moukhina, E.; Pérez-Maqueda, L.A.; Sbirrazzuoli, N. ICTAC Kinetics Committee recommendations for analysis of multi-step kinetics. Thermochim. Acta 2020, 689, 178597. [Google Scholar] [CrossRef]
  15. Liu, Y.-C.; Huang, A.-C.; Tang, Y.; Ma, X.-M.; Yang, Y.-P.; Wu, Z.-H.; Shu, C.-M.; Xing, Z.-X.; Jiang, J.-C. Thermokinetic model establishment and numerical simulation of 2,4,6-trinitrophenol based on eco-friendly synthesis method. J. Energ. Mater. 2021, 1–20. [Google Scholar] [CrossRef]
  16. Liu, Y.-C.; Huang, A.-C.; Tang, Y.; Huang, C.-F.; Shen, Q.; Shu, C.-M.; Xing, Z.-X.; Jiang, J.-C. Thermokinetic analysis of the stability of acetic anhydride hydrolysis in isothermal calorimetry techniques. J. Therm. Anal. Calorim. 2021, 1–9. [Google Scholar] [CrossRef]
  17. Lv, G.; Li, K.; Shi, Y.; Zhang, R.; Tang, H.; Tang, C. Effect of Aminosilane Coupling Agent-Modified Nano-SiO2 Particles on Thermodynamic Properties of Epoxy Resin Composites. Processes 2021, 9, 771. [Google Scholar] [CrossRef]
  18. Wang, X.; Zhou, L.; Zhu, S.; Zheng, H.; Ma, Y.; Liu, Y.; Jia, C.; Zhou, C.; Bie, L.; Zhang, G. Modes of Occurrence of Chromium and Their Thermal Stability in Low-Rank Coal Pyrolysis. Processes 2022, 10, 15. [Google Scholar] [CrossRef]
  19. Jia, G. Combustion Characteristics and Kinetic Analysis of Biomass Pellet Fuel Using Thermogravimetric Analysis. Processes 2021, 9, 868. [Google Scholar] [CrossRef]
  20. Khelkhal, M.A.; Lapuk, S.E.; Buzyurov, A.V.; Krapivnitskaya, T.O.; Peskov, N.Y.; Denisenko, A.N.; Vakhin, A.V. Thermogravimetric Study on Peat Catalytic Pyrolysis for Potential Hydrocarbon Generation. Processes 2022, 10, 974. [Google Scholar] [CrossRef]
  21. Hu, X.; Zhang, T.; Qiao, X.; Yang, L.; Zhang, J.; Cui, Y.; Zhang, J. Crystal Structure and Thermal Decomposition of 5-Aminotetrazole Trinitrophloroglucinolate. Acta Phys.-Chim. Sin. 2008, 24, 576–580. [Google Scholar] [CrossRef]
  22. Huang, A.-C.; Huang, C.-F.; Tang, Y.; Xing, Z.-X.; Jiang, J.-C. Evaluation of multiple reactions in dilute benzoyl peroxide concentrations with additives using calorimetric technology. J. Loss Prev. Process Ind. 2021, 69, 104373. [Google Scholar] [CrossRef]
  23. Huang, A.-C.; Huang, C.-F.; Xing, Z.-X.; Jiang, J.-C.; Shu, C.-M. Thermal hazard assessment of the thermal stability of acne cosmeceutical therapy using advanced calorimetry technology. Process Saf. Environ. Prot. 2019, 131, 197–204. [Google Scholar] [CrossRef]
  24. JankoviĆ, B. Isothermal thermo-analytical study and decomposition kinetics of non-activated and mechanically activated indium tin oxide (ITO) scrap powders treated by alkaline solution. Trans. Nonferr. Met. Soc. China 2015, 25, 1657–1676. [Google Scholar] [CrossRef]
  25. Liu, Y.-C.; Jiang, J.-C.; Huang, A.-C.; Tang, Y.; Yang, Y.-P.; Zhou, H.-L.; Zhai, J.; Xing, Z.-X.; Huang, C.-F.; Shu, C.-M. Hazard assessment of the thermal stability of nitrification by-products by using an advanced kinetic model. Process Saf. Environ. Prot. 2022, 160, 91–101. [Google Scholar] [CrossRef]
  26. Sestak, J. (Ed.) 14—Explanation of crystallisation kinetics both during glass heating and melt cooling, while the incorrectness of the Kissinger method is indicated. In Thermal Analysis and Thermodynamic Properties of Solids, 2nd ed.; Elsevier: Amsterdam, The Netherlands, 2021; pp. 365–383. [Google Scholar] [CrossRef]
  27. Zhang, X.; Wang, H.; Liu, Z.; Liang, F.; Shen, B. Thermal kinetics analysis of polymerization reaction of styrene-ethylbenzene system. J. Loss Prev. Process Ind. 2021, 73, 104611. [Google Scholar] [CrossRef]
  28. Fatmi, M.; Ghebouli, B.; Ghebouli, M.A.; Chihi, T.; Abdul Hafiz, M. The kinetics of precipitation in Al-2.4wt% Cu alloy by Kissinger, Ozawa, Bosswel and Matusita methods. Phys. B Condens. Matter 2011, 406, 2277–2280. [Google Scholar] [CrossRef]
  29. Zhang, Z.; Xiao, C.; Dong, Z. Comparison of the Ozawa and modified Avrami models of polymer crystallization under nonisothermal conditions using a computer simulation method. Thermochim. Acta 2007, 466, 22–28. [Google Scholar] [CrossRef]
  30. Lu, Z.; Yang, L.; Guo, Y. Thermal behavior and decomposition kinetics of six electrolyte salts by thermal analysis. J. Power Sources 2006, 156, 555–559. [Google Scholar] [CrossRef]
  31. Stephy, A.; Antony, A.M.; Francis, T. Thermal decomposition kinetics of melt-mixed ethylene-co-vinyl acetate—Based bio-composites. Mater. Today Chem. 2021, 21, 100544. [Google Scholar] [CrossRef]
  32. Costamagna, P.; Giordano, A.; Lazzarini, Y.; Delucchi, M.; Busca, G. Process of ammonia removal from anaerobic digestion and associated ammonium sulphate production: Pilot plant demonstration. J. Environ. Manag. 2020, 259, 109841. [Google Scholar] [CrossRef] [PubMed]
  33. Meng, J.; Pan, Y.; Ran, Z.; Li, Y.; Jiang, J.; Wang, Q.; Jiang, J. Thermal hazard and decomposition kinetics of 1-butyl-2,3-dimethylimidazolium nitrate via TGA/DSC and FTIR. J. Loss Prev. Process Ind. 2021, 72, 104562. [Google Scholar] [CrossRef]
  34. Ben Talouba, I.; Balland, L.; Mouhab, N.; Abdelghani-Idrissi, M.A. Kinetic parameter estimation for decomposition of organic peroxides by means of DSC measurements. J. Loss Prev. Process Ind. 2011, 24, 391–396. [Google Scholar] [CrossRef]
  35. Yao, B.; Zhao, D.; Zhang, Z.; Huang, C. Safety Study on Wax Deposition in Crude Oil Pipeline. Processes 2021, 9, 1572. [Google Scholar] [CrossRef]
  36. Ryou, M.-H.; Lee, J.-N.; Lee, D.J.; Kim, W.-K.; Jeong, Y.K.; Choi, J.W.; Park, J.-K.; Lee, Y.M. Effects of lithium salts on thermal stabilities of lithium alkyl carbonates in SEI layer. Electrochim. Acta 2012, 83, 259–263. [Google Scholar] [CrossRef]
  37. Zhou, H.-L.; Jiang, J.-C.; Huang, A.-C.; Tang, Y.; Zhang, Y.; Huang, C.-F.; Liu, S.-H.; Shu, C.-M. Calorimetric evaluation of thermal stability and runaway hazard based on thermokinetic parameters of O,O–dimethyl phosphoramidothioate. J. Loss Prev. Process Ind. 2022, 75, 104697. [Google Scholar] [CrossRef]
  38. Chen, Y.; Wang, Y.; Chen, X.; Song, X.; Zhang, Y.; Tang, K. Thermal decomposition mechanism of 65% lysine sulfate powder and its thermal stability based on thermal analysis. J. Loss Prev. Process Ind. 2020, 64, 104089. [Google Scholar] [CrossRef]
  39. Tankov, I.; Yankova, R.; Mitkova, M.; Stratiev, D. Non-isothermal decomposition kinetics of pyridinium nitrate under nitrogen atmosphere. Thermochim. Acta 2018, 665, 85–91. [Google Scholar] [CrossRef]
  40. Tiwari, S.; Gehlot, C.L.; Srivastava, K.; Srivastava, D. Simulation of the thermal degradation and curing kinetics of fly ash reinforced diglycidyl ether bisphenol A composite. J. Indian Chem. Soc. 2021, 98, 100077. [Google Scholar] [CrossRef]
  41. Huang, A.-C.; Liao, F.-C.; Huang, C.-F.; Tang, Y.; Zhang, Y.; Shu, C.-M.; Xing, Z.-X.; Jiang, J.-C.; Hsieh, W.-Y. Calorimetric approach to establishing thermokinetics for cosmeceutical benzoyl peroxides containing metal ions. J. Therm. Anal. Calorim. 2021, 144, 373–382. [Google Scholar] [CrossRef]
  42. Cao, C.-R.; Liu, S.-H.; Das, M.; Shu, C.-M. Evaluation for the thermokinetics of the autocatalytic reaction of cumene hydroperoxide mixed with phenol through isothermal approaches and simulations. Process Saf. Environ. Prot. 2018, 117, 426–438. [Google Scholar] [CrossRef]
  43. Wu, S.-H.; Chi, J.-H.; Wu, Y.-T.; Huang, Y.-H.; Chu, F.-J.; Horng, J.-J.; Shu, C.-M.; Charpentier, J.-C. Thermal hazard analysis of triacetone triperoxide (TATP) by DSC and GC/MS. J. Loss Prev. Process Ind. 2012, 25, 1069–1074. [Google Scholar] [CrossRef]
  44. Wang, S.-Y.; Kossoy, A.A.; Yao, Y.-D.; Chen, L.-P.; Chen, W.-H. Kinetics-based simulation approach to evaluate thermal hazards of benzaldehyde oxime by DSC tests. Thermochim. Acta 2017, 655, 319–325. [Google Scholar] [CrossRef]
Figure 1. Chemical mechanism diagram.
Processes 10 01177 g001
Figure 2. Sulfonation synthesis process 1. (a) Propylene diester alginate; (b) propylene diester alginate add formamide; (c) after dropping chlorosulfonic acid.
Processes 10 01177 g002
Figure 3. Sulfonation synthesis process 2. (a) Temperature rise to 110 °C for reaction; (b) after the reaction; (c) washed and filtered finished products.
Processes 10 01177 g003
Figure 4. Infrared spectrum characterization.
Processes 10 01177 g004
Figure 5. DSC curves of PSS + (NH4)2SO4 at five different β.
Processes 10 01177 g005
Figure 6. DTG curves of PSS + (NH4)2SO4 at five different β.
Processes 10 01177 g006
Figure 7. Kissinger model at different β in DSC experiments for PSS + (NH4)2SO4.
Processes 10 01177 g007
Figure 8. In the DSC experiment, differential analysis of PSS + (NH4)2SO4 under FWO model.
Processes 10 01177 g008
Figure 9. In the DSC experiment, differential analysis of PSS + (NH4)2SO4 under Vyazovkin model.
Processes 10 01177 g009
Figure 10. Evolution of heating production of PSS + (NH4)2SO4 thermal decomposition reaction with time in experiment and simulation.
Processes 10 01177 g010
Figure 11. Evolution of heating production rate of PSS + (NH4)2SO4 thermal decomposition reaction with time in experiment and simulation.
Processes 10 01177 g011
Figure 12. Time to conversion limit (TCL) and adiabatic time to maximum rate (TMRad) vs. temperature of PSS + (NH4)2SO4.
Processes 10 01177 g012
Table 1. Specific information of materials used.
ReagentCASReagent PurityUsageManufacturers
Propylene glycol alginate(PGA)9005-37-2CP10 gZhejiang Yinuo Biotechnology Co., Ltd. (Hangzhou, China)
Formamide75-12-7AR100 mLYatai Chemical Co., Ltd. (Wuxi, China)
Chlorosulfonic acid7790-94-5AR30 mLQianyan Chemical Technology Co., Ltd. (Wuhan, China)
Table 2. Characteristic temperature of PSS + (NH4)2SO4 in the DSC at different β.
β (°C /min)T0 (°C)Tp (°C)Te (°C)
1132.7148.5161.7
2146.9165.3182.9
3120.5168.5190.7
5174.4183.7213.7
8189.5209.3288.7
Table 3. Characteristic temperature of PSS + (NH4)2SO4 in the DTG at different β.
Stage IStage II
β (°C/min)T1 (°C)DTG (mg/s)T2 (°C)DTG (mg/s)
2260.5−0.5511323.9−0.3587
3268.8−0.5252326.9−0.3499
5276.6−0.4999337.4−0.3385
8289.2−0.4787345.2−0.3203
10292.8−0.4825349.3−0.4821
Table 4. Ea and R2 under different α based on the KAS model.
αEa (kJ/mol)R2
0.0566.21450.9920
0.1060.92220.9789
0.2055.03610.9591
0.3051.52910.9485
0.4048.74080.9407
0.5046.27390.9348
0.6044.06050.9294
0.7042.18050.9247
0.8040.39870.9235
0.9038.56490.9242
0.9537.31250.9261
0.9933.80990.9176
Table 5. Ea and R2 values were obtained by Kissinger, FWO, Vyazovkin, and KAS methods.
Ea (kJ/mol)R2
Kissinger50.84180.9341
FWO51.49590.9562
Vyazovkin46.90870.9006
KAS47.08700.9417
average value49.08340.9332
Table 6. Thermokinetic evaluation of the multistage reaction models of PSS + (NH4)2SO4.
PSS + (NH4)2SO4 5 °C/minPSS + (NH4)2SO4 8 °C/min
Autocatalysis
A to B1
Autocatalysis
B1 to B2
Autocatalysis
A to B1
Autocatalysis
B1 to B2
ln A (ln 1/s)15.209430.934018.384120.1172
Ea (kJ/mol)70.9749132.397187.4477100.1652
Reaction order n11.39552.49471.25651.1530
Reaction order n20.99870.50870.92570.3684
Publisher’s Note: MDPI stays neutral with regard to jurisdictional claims in published maps and institutional affiliations.

