
Quantitative Structure-Property Relationship (QSPR) of Plant Phenolic Compounds in Rapeseed Oil and Comparison of Antioxidant Measurement Methods

 , ,
, ,  and
and
Abstract
:1. Introduction
2. Materials and Methods
3. Results and Discussion
3.1. Analysis of Oil Stability
3.2. Consolidated Analysis of Phenolic Subgroups
3.3. Comparision of Oil Measurement Methods with In Vitro Antioxidant Assays
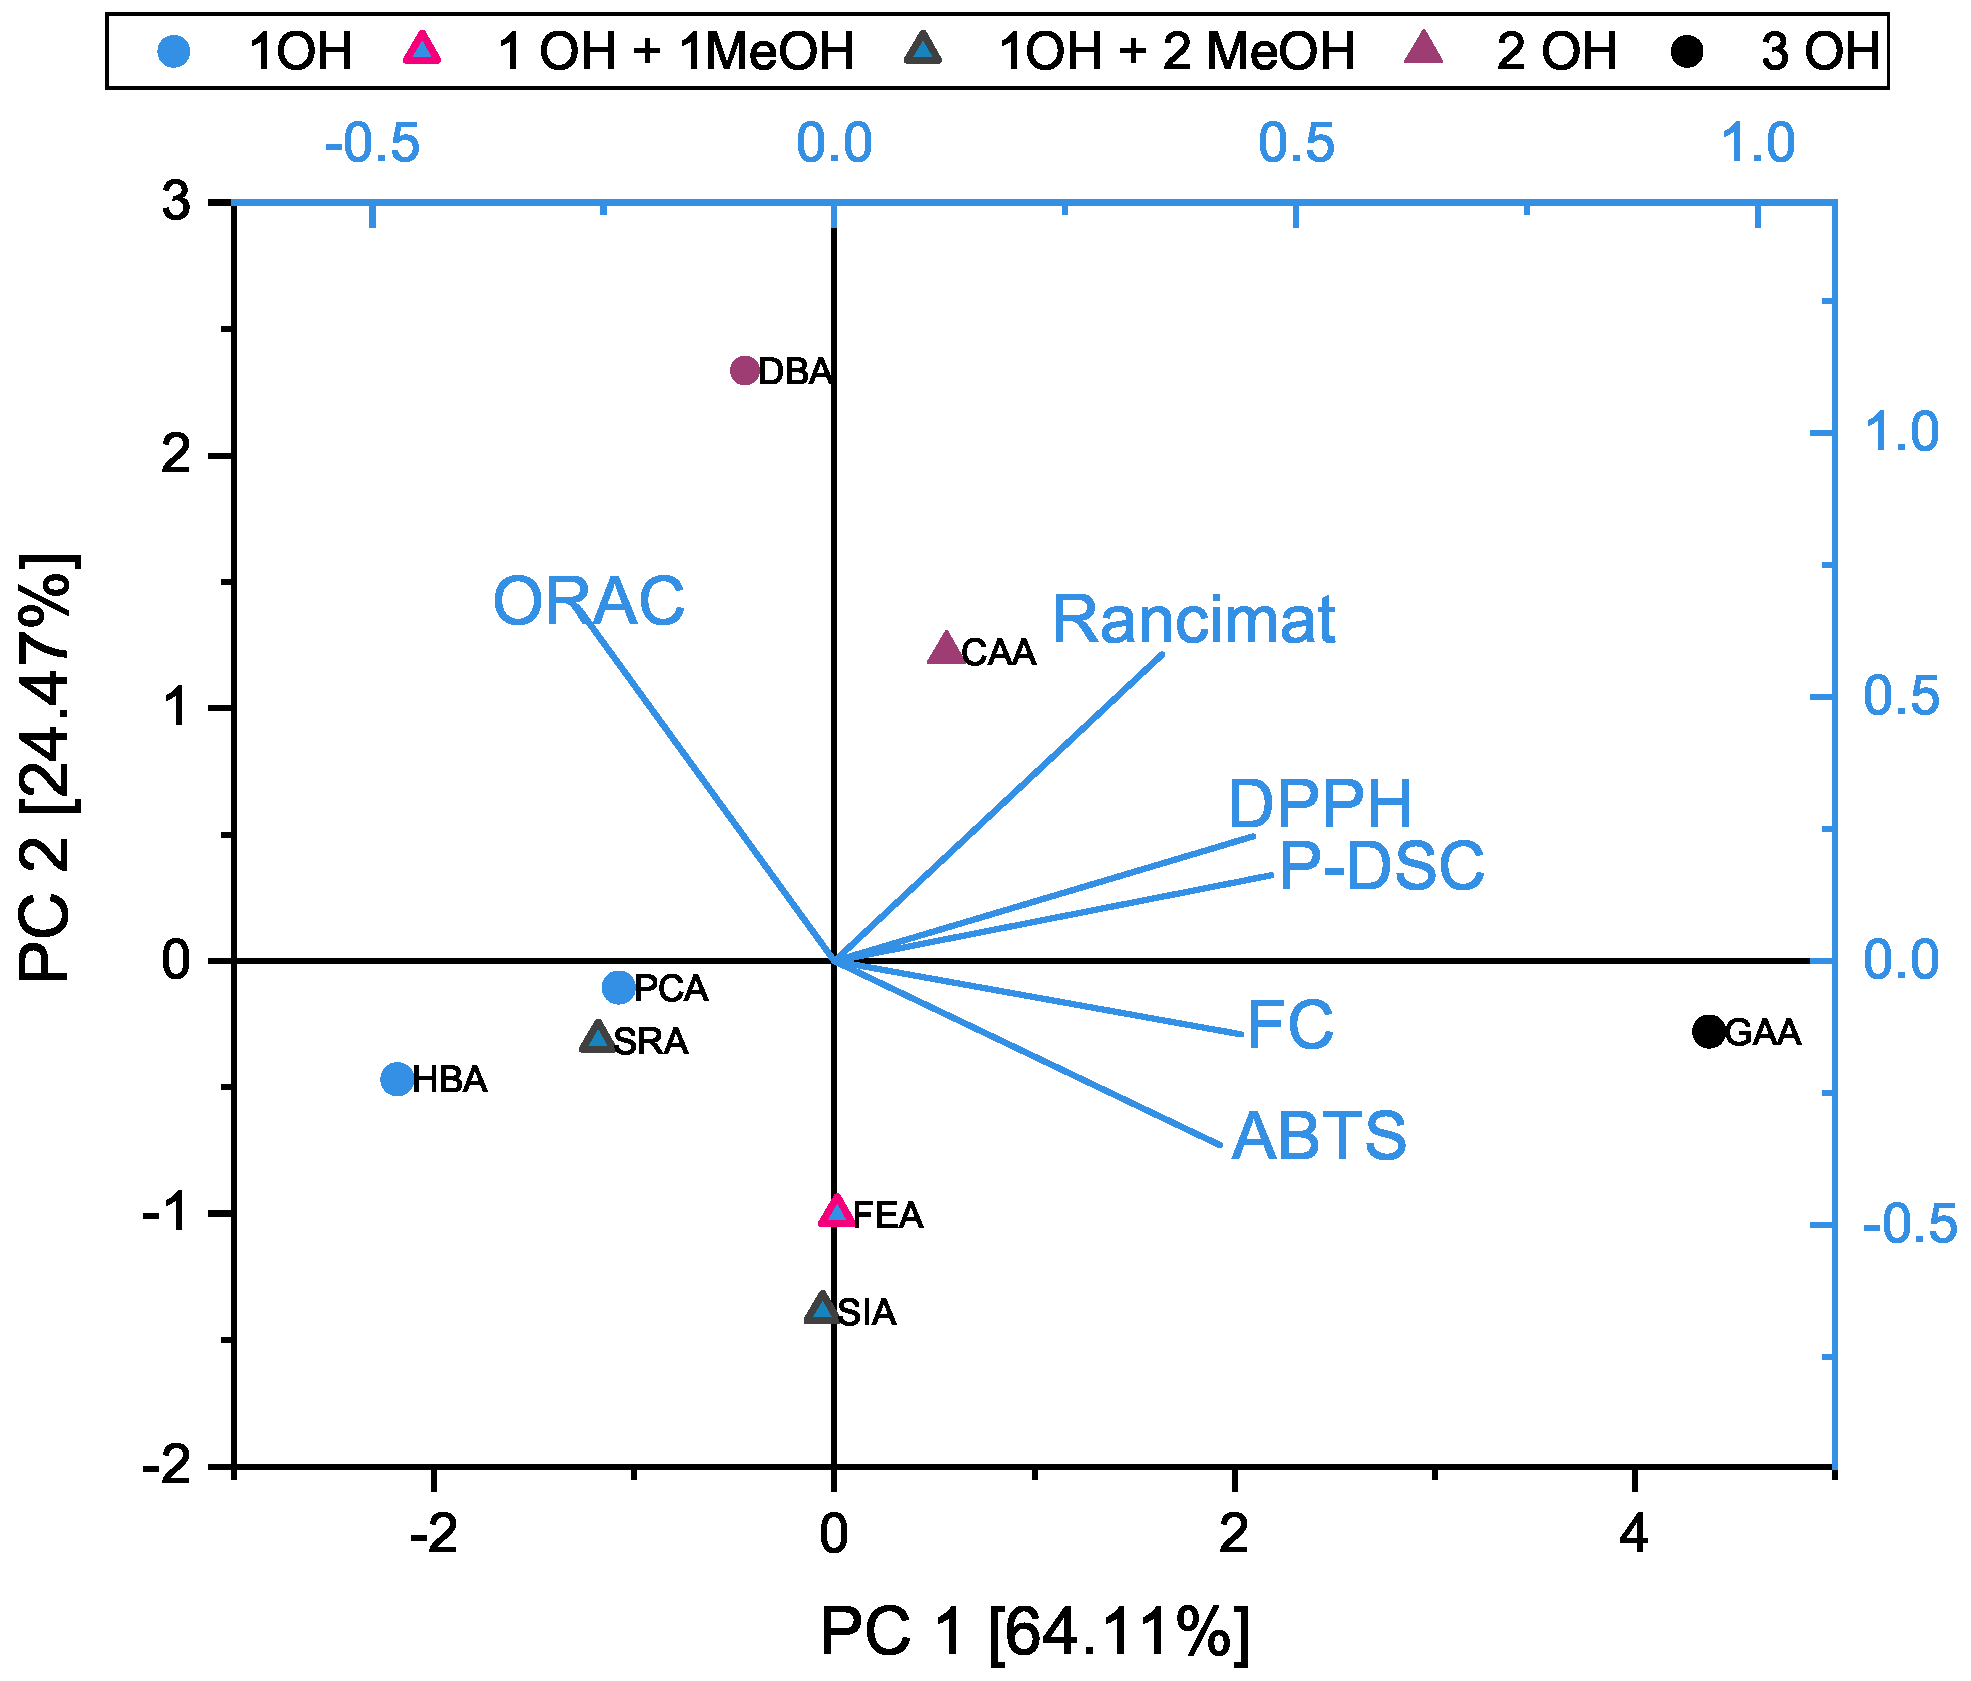
3.4. Principal Component Analysis of the DPPH, ABTS, FC, and ORAC Assays and OIT Measurements
4. Conclusions
Author Contributions
Funding
Institutional Review Board Statement
Informed Consent Statement
Data Availability Statement
Conflicts of Interest
Abbreviations
| ABTS | 2,2’-azino-bis (3-ethylbenzothiazoline-6-sulfonic acid) |
| BHT | butylhydroxytoluol |
| BHA | butylhydroxyanisol |
| CAA | caffeic acid |
| CAT | (+)-catechin |
| DBA | 3,4-dihydroxybenzoic acid |
| DPPH | 2,2-diphenyl-1-picrylhydrazyl |
| EPC | (−)-epicatechin |
| FC | Folin–Ciocalteu |
| FEA | ferulic acid |
| GAA | gallic acid |
| HAT | hydrogen atom transfer |
| HBA | 4-hydroxybenzoic acid |
| HES | hesperetin |
| KAE | kaempferol |
| MOR | morin |
| MYR | myricetin |
| NAG | naringin |
| NAN | naringenin |
| OIT | oxidation induction time |
| ORAC | oxygen radical absorbance capacity |
| P-DSC | pressurized differential scanning calorimetry |
| PC | principal component |
| PCA | p-coumaric acid |
| PHD | phloridzin |
| PHT | phloretin |
| QUR | quercetin |
| RC | reducing capacity |
| SIA | sinapic acid |
| SAR | structure-activity relationship |
| SET | single electron transfer |
| SRA | siringic acid |
| TAF | taxifolin |
References
- Jadhav, S.; Nimbalkar, S.; Kulkarni, A.; Madhavi, D. Lipid oxidation in biological and food systems. In Food Antioxidants: Technological, Toxicological, and Health Perspectives; Taylor & Francis: Abingdon, UK, 1996; pp. 5–63. [Google Scholar]
- Pegg, R.B.; Shahidi, F. Off flavors and rancidity in foods. In Handbook of Meat, Poultry and Seafood Quality; Wiley-Blackwell: Hoboken, NJ, USA, 2012; pp. 127–139. [Google Scholar]
- Rashedul, H.; Masjuki, H.H.; Kalam, M.; Teoh, Y.; How, H.; Fattah, I.R. Effect of antioxidant on the oxidation stability and combustion–performance–emission characteristics of a diesel engine fueled with diesel–biodiesel blend. Energy Convers. Manag. 2015, 106, 849–858. [Google Scholar] [CrossRef]
- Saluja, R.K.; Kumar, V.; Sham, R. Stability of biodiesel—A review. Renew. Sustain. Energy Rev. 2016, 62, 866–881. [Google Scholar] [CrossRef]
- Romola, C.J.; Meganaharshini, M.; Rigby, S.; Moorthy, I.G.; Kumar, R.S.; Karthikumar, S. A comprehensive review of the selection of natural and synthetic antioxidants to enhance the oxidative stability of biodiesel. Renew. Sustain. Energy Rev. 2021, 145, 111109. [Google Scholar] [CrossRef]
- Strayer, D. Food Fats and Oils, 10th ed.; Technical Committee of the Institute of Shortening and Edible Oils, Inc.: Washington, DC, USA, 2016. [Google Scholar]
- Shahidi, F. Bailey’s Industrial Oil and Fat Products, Industrial and Nonedible Products from Oils and Fats; John Wiley & Sons: Hoboken, NJ, USA, 2005; Volume 6. [Google Scholar]
- Reinhard Matissek, W.B. Lebensmittelchemie; Chapter Lipide; Springer-Verlag: Berlin/Heidelberg, Germany, 2016; pp. 91–129. [Google Scholar]
- Kodali, D.R. High performance ester lubricants from natural oils. Ind. Lubr. Tribol. 2002, 54, 165–170. [Google Scholar] [CrossRef]
- Frankel, E.N. Lipid Oxidation; Chapter Free Radcial Oxidaiton; WP Woodhead Publishing Limited: Cambridge, UK, 2005; pp. 15–24. [Google Scholar]
- Brodnitz, M.H. Autoxidation of saturated fatty acids. A review. J. Agric. Food Chem. 1968, 16, 994–999. [Google Scholar] [CrossRef]
- Young, I.; Woodside, J. Antioxidants in health and disease. J. Clin. Pathol. 2001, 54, 176–186. [Google Scholar] [CrossRef] [Green Version]
- Bodai, Z.; Kirchkeszner, C.; Novák, M.; Nyiri, Z.; Kovács, J.; Magyar, N.; Iván, B.; Rikker, T.; Eke, Z. Migration of Tinuvin P and Irganox 3114 into milk and the corresponding authorised food simulant. Food Addit. Contam. Part A 2015, 32, 1358–1366. [Google Scholar] [CrossRef]
- Kasza, G.; Mosnáčková, K.; Nádor, A.; Osváth, Z.; Stumphauser, T.; Szarka, G.; Czaniková, K.; Rychlỳ, J.; Chmela, Š.; Iván, B.; et al. Synthesis of hyperbranched poly (ethyleneimine) based macromolecular antioxidants and investigation of their efficiency in stabilization of polyolefins. Eur. Polym. J. 2015, 68, 609–617. [Google Scholar] [CrossRef] [Green Version]
- Wang, Y.W.; Li, Y.N.; Lin, Q.B.; Wang, X.; Li, Z.H.; Wu, K.X. Functional and Antioxidant Properties of Plastic Bottle Caps Incorporated with BHA or BHT. Materials 2021, 14, 4545. [Google Scholar] [CrossRef]
- Zheng, W.; Wang, S.Y. Antioxidant activity and phenolic compounds in selected herbs. J. Agric. Food Chem. 2001, 49, 5165–5170. [Google Scholar] [CrossRef]
- Dragland, S.; Senoo, H.; Wake, K.; Holte, K.; Blomhoff, R. Several culinary and medicinal herbs are important sources of dietary antioxidants. J. Nutr. 2003, 133, 1286–1290. [Google Scholar] [CrossRef]
- Wang, S.Y. Antioxidant Capacity of Berry Crops and Herbs. In Oriental Food and Herbs–Chemistry and Health Effects; ACS Publications: Washington, DC, USA, 2003. [Google Scholar]
- Wu, X.; Beecher, G.R.; Holden, J.M.; Haytowitz, D.B.; Gebhardt, S.E.; Prior, R.L. Lipophilic and hydrophilic antioxidant capacities of common foods in the United States. J. Agric. Food Chem. 2004, 52, 4026–4037. [Google Scholar] [CrossRef]
- Maleki, M.H.; Daneshniya, M.; Latifi, Z.; Zarrin, Y.P.; Behzadinia, M.; Morakabati, N. Evaluating the Potential of Phytochemicals as Natural Substitute for Synthetic Antioxidant: A. Asian J. Res. Biochem. 2022, 10, 36–62. [Google Scholar] [CrossRef]
- Latifi, Z.; Daneshniya, M.; Khademi, F. Effect of preservative of Anarijeh (Froriepia subpinnata) extract on shelf life of silver carp fish (Hypophthalmichthys molitrix) at superchilling temperature (−3 °C). In Proceedings of the 4th International Conference on Applied Researches in Science and Engineering, Jinan, China, 18–21 October 2019. [Google Scholar]
- Strack, D. Chapter 10: Phenolic Metabolism. In Plant Biochemistry; Academic Press: London, UK, 1997; p. 387. [Google Scholar]
- D Archivio, M.; Filesi, C.; Di Benedetto, R.; Gargiulo, R.; Giovannini, C.; Masella, R. Polyphenols, dietary sources and bioavailability. Ann. -Ist. Super. Sanita 2007, 43, 348. [Google Scholar]
- Moure, A.; Cruz, J.M.; Franco, D.; Dominguez, J.M.; Sineiro, J.; Dominguez, H.; Nunez, M.J.; Parajo, J.C. Natural antioxidants from residual sources. Food Chem. 2001, 72, 145–171. [Google Scholar] [CrossRef]
- Frei, B. Natural Antioxidants in Human Health and Disease; Academic Press: Cambridge, MA, USA, 2012. [Google Scholar]
- Efenberger-Szmechtyk, M.; Nowak, A.; Czyzowska, A. Plant extracts rich in polyphenols: Antibacterial agents and natural preservatives for meat and meat products. Crit. Rev. Food Sci. Nutr. 2021, 61, 149–178. [Google Scholar] [CrossRef]
- Stagos, D. Antioxidant activity of polyphenolic plant extracts. Antioxidants 2019, 9, 19. [Google Scholar] [CrossRef] [Green Version]
- Hussain, S.A.; Hameed, A.; Ajmal, I.; Nosheen, S.; Suleria, H.A.R.; Song, Y. Effects of sesame seed extract as a natural antioxidant on the oxidative stability of sunflower oil. J. Food Sci. Technol. 2018, 55, 4099–4110. [Google Scholar] [CrossRef]
- Farag, R.S.; Mahmoud, E.A.; Basuny, A.M. Use crude olive leaf juice as a natural antioxidant for the stability of sunflower oil during heating. Int. J. Food Sci. Technol. 2007, 42, 107–115. [Google Scholar] [CrossRef]
- Carelli, A.A.; Franco, I.C.; Crapiste, G.H. Effectiveness of added natural antioxidants in sunflower oil. Grasas Y Aceites 2005, 56, 303–310. [Google Scholar] [CrossRef]
- Aluyor, E.O.; Ori-Jesu, M. The use of antioxidants in vegetable oils—A review. Afr. J. Biotechnol. 2008, 7, 4836–4842. [Google Scholar]
- Kiokias, S.; Varzakas, T.; Oreopoulou, V. In vitro activity of vitamins, flavonoids, and natural phenolic antioxidants against the oxidative deterioration of oil-based systems. Crit. Rev. Food Sci. Nutr. 2008, 48, 78–93. [Google Scholar] [CrossRef]
- Yanishlieva, N.V.; Marinova, E.M. Stabilisation of edible oils with natural antioxidants. Eur. J. Lipid Sci. Technol. 2001, 103, 752–767. [Google Scholar] [CrossRef]
- Erkan, N.; Ayranci, G.; Ayranci, E. A kinetic study of oxidation development in sunflower oil under microwave heating: Effect of natural antioxidants. Food Res. Int. 2009, 42, 1171–1177. [Google Scholar] [CrossRef]
- Redondo-Cuevas, L.; Castellano, G.; Raikos, V. Natural antioxidants from herbs and spices improve the oxidative stability and frying performance of vegetable oils. Int. J. Food Sci. Technol. 2017, 52, 2422–2428. [Google Scholar] [CrossRef]
- Martínez, M.L.; Penci, M.C.; Ixtaina, V.; Ribotta, P.D.; Maestri, D. Effect of natural and synthetic antioxidants on the oxidative stability of walnut oil under different storage conditions. LWT-Food Sci. Technol. 2013, 51, 44–50. [Google Scholar] [CrossRef]
- Yanishlieva, N.V.; Marinova, E.M. Antioxidative effectiveness of some natural antioxidants in sunflower oil. Z. Für Lebensm.-Unters. Und Forsch. 1996, 203, 220–223. [Google Scholar] [CrossRef]
- Kreivaitis, R.; Gumbytė, M.; Kazancev, K.; Padgurskas, J.; Makarevičienė, V. A comparison of pure and natural antioxidant modified rapeseed oil storage properties. Ind. Crop Prod. 2013, 43, 511–516. [Google Scholar] [CrossRef]
- Saoudi, S.; Chammem, N.; Sifaoui, I.; Bouassida-Beji, M.; Jiménez, I.A.; Bazzocchi, I.L.; Silva, S.D.; Hamdi, M.; Bronze, M.R. Influence of Tunisian aromatic plants on the prevention of oxidation in soybean oil under heating and frying conditions. Food Chem. 2016, 212, 503–511. [Google Scholar] [CrossRef]
- Taghvaei, M.; Jafari, S.M. Application and stability of natural antioxidants in edible oils in order to substitute synthetic additives. J. Food Sci. Technol. 2015, 52, 1272–1282. [Google Scholar] [CrossRef] [PubMed] [Green Version]
- Shahidi, F.; Wanasundara, U. Effect of natural antioxidants on the stability of canola oil. In Developments in Food Science; Elsevier: Amsterdam, The Netherlands, 1995; Volume 37, pp. 469–479. [Google Scholar]
- O’Sullivan, A.; Mayr, A.; Shaw, N.; Murphy, S.; Kerry, J. Use of natural antioxidants to stabilize fish oil systems. J. Aquat. Food Prod. Technol. 2005, 14, 75–94. [Google Scholar] [CrossRef]
- Taghvaei, M.; Jafari, S.M.; Mahoonak, A.S.; Nikoo, A.M.; Rahmanian, N.; Hajitabar, J.; Meshginfar, N. The effect of natural antioxidants extracted from plant and animal resources on the oxidative stability of soybean oil. LWT-Food Sci. Technol. 2014, 56, 124–130. [Google Scholar] [CrossRef]
- Bera, D.; Lahiri, D.; Nag, A. Studies on a natural antioxidant for stabilization of edible oil and comparison with synthetic antioxidants. J. Food Eng. 2006, 74, 542–545. [Google Scholar] [CrossRef]
- Chen, X.; Zhang, Y.; Zu, Y.; Yang, L.; Lu, Q.; Wang, W. Antioxidant effects of rosemary extracts on sunflower oil compared with synthetic antioxidants. Int. J. Food Sci. Technol. 2014, 49, 385–391. [Google Scholar] [CrossRef]
- Abd-ElGhany, M.; Ammar, M.; Hegazy, A. Use of olive waste cake extract as a natural antioxidant for improving the stability of heated sunflower oil. World Appl. Sci. J. 2010, 11, 106–113. [Google Scholar]
- Isbell, T.; Abbott, T.; Carlson, K. Oxidative stability index of vegetable oils in binary mixtures with meadowfoam oil. Ind. Crop Prod. 1999, 9, 115–123. [Google Scholar] [CrossRef]
- Das, L.; Bora, D.K.; Pradhan, S.; Naik, M.K.; Naik, S. Long-term storage stability of biodiesel produced from Karanja oil. Fuel 2009, 88, 2315–2318. [Google Scholar] [CrossRef]
- Jain, S.; Sharma, M. Stability of biodiesel and its blends: A review. Renew. Sustain. Energy Rev. 2010, 14, 667–678. [Google Scholar] [CrossRef]
- Sarin, R.; Sharma, M.; Sinharay, S.; Malhotra, R.K. Jatropha–palm biodiesel blends: An optimum mix for Asia. Fuel 2007, 86, 1365–1371. [Google Scholar] [CrossRef]
- Sharma, B.K.; Stipanovic, A.J. Development of a new oxidation stability test method for lubricating oils using high-pressure differential scanning calorimetry. Thermochim. Acta 2003, 402, 1–18. [Google Scholar] [CrossRef]
- Gamlin, C.D.; Dutta, N.K.; Choudhury, N.R.; Kehoe, D.; Matisons, J. Evaluation of kinetic parameters of thermal and oxidative decomposition of base oils by conventional, isothermal and modulated TGA, and pressure DSC. Thermochim. Acta 2002, 392, 357–369. [Google Scholar] [CrossRef]
- Riga, A.; Collins, R.; Mlachak, G. Oxidative behavior of polymers by thermogravimetric analysis, differential thermal analysis and pressure differential scanning calorimetry. Thermochim. Acta 1998, 324, 135–149. [Google Scholar] [CrossRef]
- Yao, J. Evaluation of sodium acetylacetonate as a synergist for arylamine antioxidants in synthetic lubricants. Tribol. Int. 1997, 30, 795–799. [Google Scholar] [CrossRef]
- Zeman, A.; Sprengel, A.; Niedermeier, D.; Späth, M. Biodegradable lubricants—Studies on thermo-oxidation of metal-working and hydraulic fluids by differential scanning calorimetry (DSC). Thermochim. Acta 1995, 268, 9–15. [Google Scholar] [CrossRef]
- Zeman, A.; Becker, V.; Peper, K. Deposit formation in aero engines—Investigation by pressure differential scanning calorimetry (PDSC). Thermochim. Acta 1993, 219, 305–313. [Google Scholar] [CrossRef]
- Dunn, R. Analysis of oxidative stability of methyl soyate bypressurized-differential scanning calorimetry. Trans. ASAE 2000, 43, 1205. [Google Scholar]
- Dunn, R.O. Oxidative stability of biodiesel by dynamic mode pressurized-differential scanning calorimetry (P-DSC). Trans. ASABE 2006, 49, 1633–1641. [Google Scholar] [CrossRef]
- Dunn, R.O. Effect of antioxidants on the oxidative stability of methyl soyate (biodiesel). Fuel Process. Technol. 2005, 86, 1071–1085. [Google Scholar] [CrossRef]
- Tan, C.; Man, Y.C. Recent developments in differential scanning calorimetry for assessing oxidative deterioration of vegetable oils. Trends Food Sci. Technol. 2002, 13, 312–318. [Google Scholar] [CrossRef]
- Cebula, D.J.; Smith, K.W. Differential scanning calorimetry of confectionery fats: Part II—Effects of blends and minor components. J. Am. Oil Chem. Soc. 1992, 69, 992–998. [Google Scholar] [CrossRef]
- Huang, D.; Ou, B.; Prior, R.L. The chemistry behind antioxidant capacity assays. J. Agric. Food Chem. 2005, 53, 1841–1856. [Google Scholar] [CrossRef] [PubMed]
- Forman, H.J.; Davies, K.J.; Ursini, F. How do nutritional antioxidants really work: Nucleophilic tone and para-hormesis versus free radical scavenging in vivo. Free Radic. Biol. Med. 2014, 66, 24–35. [Google Scholar] [CrossRef] [PubMed] [Green Version]
- Granato, D.; Shahidi, F.; Wrolstad, R.; Kilmartin, P.; Melton, L.D.; Hidalgo, F.J.; Miyashita, K.; van Camp, J.; Alasalvar, C.; Ismail, A.B.; et al. Antioxidant activity, total phenolics and flavonoids contents: Should we ban in vitro screening methods? Food Chem. 2018, 264, 471–475. [Google Scholar] [CrossRef] [PubMed]
- Alves, A.M.; Dias, T.; Hassimotto, N.M.A.; Naves, M.M.V. Ascorbic acid and phenolic contents, antioxidant capacity and flavonoids composition of Brazilian Savannah native fruits. Food Sci. Technol. 2017, 37, 564–569. [Google Scholar] [CrossRef] [Green Version]
- Granato, D.; Santos, J.S.; Maciel, L.G.; Nunes, D.S. Chemical perspective and criticism on selected analytical methods used to estimate the total content of phenolic compounds in food matrices. TrAC Trends Anal. Chem. 2016, 80, 266–279. [Google Scholar] [CrossRef]
- Guo, Y.J.; Sun, L.Q.; Yu, B.Y.; Qi, J. An integrated antioxidant activity fingerprint for commercial teas based on their capacities to scavenge reactive oxygen species. Food Chem. 2017, 237, 645–653. [Google Scholar] [CrossRef]
- Lv, H.p.; Zhang, Y.; Shi, J.; Lin, Z. Phytochemical profiles and antioxidant activities of Chinese dark teas obtained by different processing technologies. Food Res. Int. 2017, 100, 486–493. [Google Scholar] [CrossRef]
- Farhoosh, R. A kinetic approach to evaluate the structure-based performance of antioxidants during lipid oxidation. J. Food Sci. 2018, 83, 101–107. [Google Scholar] [CrossRef]
- Li, X.; Long, Q.; Gao, F.; Han, C.; Jin, P.; Zheng, Y. Effect of cutting styles on quality and antioxidant activity in fresh-cut pitaya fruit. Postharvest Biol. Technol. 2017, 124, 1–7. [Google Scholar] [CrossRef]
- Bunaciu, A.A.; Danet, A.F.; Fleschin, Ş.; Aboul-Enein, H.Y. Recent applications for in vitro antioxidant activity assay. Crit. Rev. Anal. Chem. 2016, 46, 389–399. [Google Scholar] [CrossRef]
- Badarinath, A.; Rao, K.M.; Chetty, C.M.S.; Ramkanth, S.; Rajan, T.; Gnanaprakash, K. A review on in-vitro antioxidant methods: Comparisions, correlations and considerations. Int. J. PharmTech Res. 2010, 2, 1276–1285. [Google Scholar]
- Singh, S.; Singh, R. In vitro methods of assay of antioxidants: An overview. Food Rev. Int. 2008, 24, 392–415. [Google Scholar] [CrossRef]
- Shahidi, F.; Zhong, Y. Measurement of antioxidant activity. J. Funct. Foods 2015, 18, 757–781. [Google Scholar] [CrossRef]
- Moharram, H.; Youssef, M. Methods for determining the antioxidant activity: A review. Alex. J. Food Sci. Technol. 2014, 11, 31–42. [Google Scholar]
- Platzer, M.; Kiese, S.; Herfellner, T.; Schweiggert-Weisz, U.; Miesbauer, O.; Eisner, P. Common trends and differences in antioxidant activity analysis of phenolic substances using single electron transfer based assays. Molecules 2021, 26, 1244. [Google Scholar] [CrossRef]
- Platzer, M.; Kiese, S.; Herfellner, T.; Schweiggert-Weisz, U.; Eisner, P. How Does the Phenol Structure Influence the Results of the Folin-Ciocalteu Assay? Antioxidants 2021, 10, 811. [Google Scholar] [CrossRef]
- Platzer, M.; Kiese, S.; Tybussek, T.; Herfellner, T.; Schneider, F.; Schweiggert-Weisz, U.; Eisner, P. Radical scavenging mechanisms of phenolic compounds: A quantitative structure-property relationship (QSPR) study. Front. Nutr. 2022, 9, 663. [Google Scholar] [CrossRef]
- Brand-Williams, W.; Cuvelier, M.E.; Berset, C. Use of a free radical method to evaluate antioxidant activity. LWT-Food Sci. Technol. 1995, 28, 25–30. [Google Scholar] [CrossRef]
- Re, R.; Pellegrini, N.; Proteggente, A.; Pannala, A.; Yang, M.; Rice-Evans, C. Antioxidant activity applying an improved ABTS radical cation decolorization assay. Free Radic. Biol. Med. 1999, 26, 1231–1237. [Google Scholar] [CrossRef]
- Huang, D.; Ou, B.; Hampsch-Woodill, M.; Flanagan, J.A.; Prior, R.L. High-throughput assay of oxygen radical absorbance capacity (ORAC) using a multichannel liquid handling system coupled with a microplate fluorescence reader in 96-well format. J. Agric. Food Chem. 2002, 50, 4437–4444. [Google Scholar] [CrossRef]
- Singleton, V.L.; Rossi, J.A. Colorimetry of total phenolics with phosphomolybdic-phosphotungstic acid reagents. Am. J. Enol. Vitic. 1965, 16, 144–158. [Google Scholar]
- Antony, A.; Farid, M. Effect of Temperatures on Polyphenols during Extraction. Appl. Sci. 2022, 12, 2107. [Google Scholar] [CrossRef]
- Lang, G.H.; da Silva Lindemann, I.; Ferreira, C.D.; Hoffmann, J.F.; Vanier, N.L.; de Oliveira, M. Effects of drying temperature and long-term storage conditions on black rice phenolic compounds. Food Chem. 2019, 287, 197–204. [Google Scholar] [CrossRef] [PubMed]
- Mokrani, A.; Madani, K. Effect of solvent, time and temperature on the extraction of phenolic compounds and antioxidant capacity of peach (Prunus persica L.) fruit. Sep. Purif. Technol. 2016, 162, 68–76. [Google Scholar] [CrossRef]
- Larrauri, J.A.; Rupérez, P.; Saura-Calixto, F. Effect of drying temperature on the stability of polyphenols and antioxidant activity of red grape pomace peels. J. Agric. Food Chem. 1997, 45, 1390–1393. [Google Scholar] [CrossRef]
- Larrauri, J.A.; Sánchez-Moreno, C.; Saura-Calixto, F. Effect of temperature on the free radical scavenging capacity of extracts from red and white grape pomace peels. J. Agric. Food Chem. 1998, 46, 2694–2697. [Google Scholar] [CrossRef]
- Howard, L.; Pandjaitan, N. Pressurized liquid extraction of flavonoids from spinach. J. Food Sci. 2008, 73, C151–C157. [Google Scholar] [CrossRef]
- Casazza, A.A.; Aliakbarian, B.; Sannita, E.; Perego, P. High-pressure high-temperature extraction of phenolic compounds from grape skins. Int. J. Food Sci. Technol. 2012, 47, 399–405. [Google Scholar] [CrossRef]
- Santos, D.T.; Veggi, P.C.; Meireles, M.A.A. Optimization and economic evaluation of pressurized liquid extraction of phenolic compounds from jabuticaba skins. J. Food Eng. 2012, 108, 444–452. [Google Scholar] [CrossRef] [Green Version]
- Maillard, M.N.; Berset, C. Evolution of antioxidant activity during kilning: Role of insoluble bound phenolic acids of barley and malt. J. Agric. Food Chem. 1995, 43, 1789–1793. [Google Scholar] [CrossRef]
- Chen, M.L.; Yang, D.J.; Liu, S.C. Effects of drying temperature on the flavonoid, phenolic acid and antioxidative capacities of the methanol extract of citrus fruit (Citrus sinensis (L.) Osbeck) peels. Int. J. Food Sci. Technol. 2011, 46, 1179–1185. [Google Scholar] [CrossRef]
- Teh, S.S.; Birch, E.J. Effect of ultrasonic treatment on the polyphenol content and antioxidant capacity of extract from defatted hemp, flax and canola seed cakes. Ultrason. Sonochem. 2014, 21, 346–353. [Google Scholar] [CrossRef] [PubMed]
- Dorta, E.; Lobo, M.G.; Gonzalez, M. Reutilization of mango byproducts: Study of the effect of extraction solvent and temperature on their antioxidant properties. J. Food Sci. 2012, 77, C80–C88. [Google Scholar] [CrossRef] [PubMed]
- Wang, L.F.; Kim, D.M.; Lee, C.Y. Effects of heat processing and storage on flavanols and sensory qualities of green tea beverage. J. Agric. Food Chem. 2000, 48, 4227–4232. [Google Scholar] [CrossRef] [PubMed]
- Sakurai, S.; Kawakami, Y.; Kuroki, M.; Gotoh, H. Structure-antioxidant Activity (Oxygen Radical Absorbance Capacity) Relationships of Phenolic Compounds. Struct. Chem. 2022, 33, 1055–1062. [Google Scholar] [CrossRef]
- Atala, E.; Aspée, A.; Speisky, H.; Lissi, E.; López-Alarcón, C. Antioxidant capacity of phenolic compounds in acidic medium: A pyrogallol red-based ORAC (oxygen radical absorbance capacity) assay. J. Food Compos. Anal. 2013, 32, 116–125. [Google Scholar] [CrossRef]
- Cai, Y.Z.; Sun, M.; Xing, J.; Luo, Q.; Corke, H. Structure–radical scavenging activity relationships of phenolic compounds from traditional Chinese medicinal plants. Life Sci. 2006, 78, 2872–2888. [Google Scholar] [CrossRef]
- Jing, P.; Zhao, S.J.; Jian, W.J.; Qian, B.J.; Dong, Y.; Pang, J. Quantitative studies on structure-DPPH• scavenging activity relationships of food phenolic acids. Molecules 2012, 17, 12910–12924. [Google Scholar] [CrossRef]
- Van Acker, S.A.; Tromp, M.N.; Griffioen, D.H.; Van Bennekom, W.P.; Van Der Vijgh, W.J.; Bast, A. Structural aspects of antioxidant activity of flavonoids. Free Radic. Biol. Med. 1996, 20, 331–342. [Google Scholar] [CrossRef]
- Rasulev, B.F.; Abdullaev, N.D.; Syrov, V.N.; Leszczynski, J. A quantitative structure-activity relationship (QSAR) study of the antioxidant activity of flavonoids. QSAR Comb. Sci. 2005, 24, 1056–1065. [Google Scholar] [CrossRef]
- van Acker, S.A.; de Groot, M.J.; van den Berg, D.J.; Tromp, M.N.; Donné-Op den Kelder, G.; van der Vijgh, W.J.; Bast, A. A quantum chemical explanation of the antioxidant activity of flavonoids. Chem. Res. Toxicol. 1996, 9, 1305–1312. [Google Scholar] [CrossRef] [PubMed]
- Burton, G.W.; Doba, T.; Gabe, E.; Hughes, L.; Lee, F.; Prasad, L.; Ingold, K.U. Autoxidation of biological molecules. 4. Maximizing the antioxidant activity of phenols. J. Am. Chem. Soc. 1985, 107, 7053–7065. [Google Scholar] [CrossRef]
- Alov, P.; Tsakovska, I.; Pajeva, I. Computational studies of free radical-scavenging properties of phenolic compounds. Curr. Top. Med. Chem. 2015, 15, 85–104. [Google Scholar] [CrossRef] [PubMed] [Green Version]
- Foti, M.C. Antioxidant properties of phenols. J. Pharm. Pharmacol. 2007, 59, 1673–1685. [Google Scholar] [CrossRef]
- Spiegel, M.; Kapusta, K.; Kołodziejczyk, W.; Saloni, J.; Żbikowska, B.; Hill, G.A.; Sroka, Z. Antioxidant Activity of Selected Phenolic Acids–Ferric Reducing Antioxidant Power Assay and QSAR Analysis of the Structural Features. Molecules 2020, 25, 3088. [Google Scholar] [CrossRef]
- Olszowy, M. What is responsible for antioxidant properties of polyphenolic compounds from plants? Plant Physiol. Biochem. 2019, 144, 135–143. [Google Scholar]
- Cuvelier, M.E.; Richard, H.; Berset, C. Comparison of the antioxidative activity of some acid-phenols: Structure-activity relationship. Biosci. Biotechnol. Biochem 1992, 56, 324–325. [Google Scholar] [CrossRef] [Green Version]
- Rice-Evans, C.A.; Miller, N.J.; Paganga, G. Structure-antioxidant activity relationships of flavonoids and phenolic acids. Free Radic. Biol. Med. 1996, 20, 933–956. [Google Scholar] [CrossRef]
- Shahidi, F.; Janitha, P.; Wanasundara, P. Phenolic antioxidants. Crit. Rev. Food Sci. Nutr. 1992, 32, 67–103. [Google Scholar]
- Ma, Y.T.; Cheung, P.C. Spectrophotometric Determination of Phenolic Compounds by Enzymatic and Chemical Methods A Comparison of Structure- Activity Relationship. J. Agric. Food Chem. 2007, 55, 4222–4228. [Google Scholar]
- Shang, Y.J.; Qian, Y.P.; Liu, X.D.; Dai, F.; Shang, X.L.; Jia, W.Q.; Liu, Q.; Fang, J.G.; Zhou, B. Radical-scavenging activity and mechanism of resveratrol-oriented analogues: Influence of the solvent, radical, and substitution. J. Org. Chem. 2009, 74, 5025–5031. [Google Scholar] [CrossRef] [PubMed]
- Piazzon, A.; Vrhovsek, U.; Masuero, D.; Mattivi, F.; Mandoj, F.; Nardini, M. Antioxidant activity of phenolic acids and their metabolites: Synthesis and antioxidant properties of the sulfate derivatives of ferulic and caffeic acids and of the acyl glucuronide of ferulic acid. J. Agric. Food Chem. 2012, 60, 12312–12323. [Google Scholar] [CrossRef] [PubMed]
- Dávalos, A.; Gómez-Cordovés, C.; Bartolomé, B. Extending applicability of the oxygen radical absorbance capacity (ORAC- fluorescein) assay. J. Agric. Food Chem. 2004, 52, 48–54. [Google Scholar] [CrossRef] [PubMed]
- Ronsisvalle, S.; Panarello, F.; Longhitano, G.; Siciliano, E.A.; Montenegro, L.; Panico, A. Natural flavones and flavonols: Relationships among antioxidant activity, glycation, and metalloproteinase inhibition. Cosmetics 2020, 7, 71. [Google Scholar] [CrossRef]
- Bors, W.; Heller, W.; Michel, C.; Saran, M. Radical chemistry of flavonoid antioxidants. In Antioxidants in Therapy and Preventive Medicine; Springer: Berlin/Heidelberg, Germany, 1990; pp. 165–170. [Google Scholar]
- Wolfe, K.L.; Liu, R.H. Structure- activity relationships of flavonoids in the cellular antioxidant activity assay. J. Agric. Food Chem. 2008, 56, 8404–8411. [Google Scholar] [CrossRef]
- Zhang, D.; Liu, Y.; Chu, L.; Wei, Y.; Wang, D.; Cai, S.; Zhou, F.; Ji, B. Relationship between the structures of flavonoids and oxygen radical absorbance capacity values: A quantum chemical analysis. J. Phys. Chem. A 2013, 117, 1784–1794. [Google Scholar] [CrossRef]
- Freeman, B.L.; Eggett, D.L.; Parker, T.L. Synergistic and antagonistic interactions of phenolic compounds found in navel oranges. J. Food Sci. 2010, 75, C570–C576. [Google Scholar] [CrossRef]
- Pietta, P.G. Flavonoids as antioxidants. J. Nat. Prod. 2000, 63, 1035–1042. [Google Scholar] [CrossRef]
- Vellosa, J.C.R.; Regasini, L.O.; Khalil, N.M.; Bolzani, V.d.S.; Khalil, O.A.; Manente, F.A.; Pasquini Netto, H.; Oliveira, O.M. Antioxidant and cytotoxic studies for kaempferol, quercetin and isoquercitrin. Eclética Quim. 2011, 36, 07–20. [Google Scholar] [CrossRef]
- Promden, W.; Monthakantirat, O.; Umehara, K.; Noguchi, H.; De-Eknamkul, W. Structure and antioxidant activity relationships of isoflavonoids from Dalbergia parviflora. Molecules 2014, 19, 2226–2237. [Google Scholar] [CrossRef] [Green Version]
- Alcalde, B.; Granados, M.; Saurina, J. Exploring the antioxidant features of polyphenols by spectroscopic and electrochemical methods. Antioxidants 2019, 8, 523. [Google Scholar] [CrossRef] [PubMed] [Green Version]
- Csepregi, K.; Neugart, S.; Schreiner, M.; Hideg, É. Comparative evaluation of total antioxidant capacities of plant polyphenols. Molecules 2016, 21, 208. [Google Scholar] [CrossRef] [PubMed] [Green Version]
- Bendary, E.; Francis, R.; Ali, H.; Sarwat, M.; El Hady, S. Antioxidant and structure–activity relationships (SARs) of some phenolic and anilines compounds. Ann. Agric. Sci. 2013, 58, 173–181. [Google Scholar] [CrossRef] [Green Version]
- Apak, R.; Güçlü, K.; Demirata, B.; Özyürek, M.; Çelik, S.E.; Bektaşoğlu, B.; Berker, K.I.; Özyurt, D. Comparative evaluation of various total antioxidant capacity assays applied to phenolic compounds with the CUPRAC assay. Molecules 2007, 12, 1496–1547. [Google Scholar] [CrossRef] [Green Version]
- Velkov, Z.A.; Kolev, M.K.; Tadjer, A.V. Modeling and statistical analysis of DPPH scavenging activity of phenolics. Collect. Czechoslov. Chem. Commun. 2007, 72, 1461–1471. [Google Scholar] [CrossRef]
- Ishimoto, H.; Tai, A.; Yoshimura, M.; Amakura, Y.; Yoshida, T.; Hatano, T.; Ito, H. Antioxidative properties of functional polyphenols and their metabolites assessed by an ORAC assay. Biosci. Biotechnol. Biochem. 2012, 76, 395–399. [Google Scholar] [CrossRef] [Green Version]
- Ratusz, K.; Popis, E.; Ciemniewska-Żytkiewicz, H.; Wroniak, M. Oxidative stability of camelina (Camelina sativa L.) oil using pressure differential scanning calorimetry and Rancimat method. J. Therm. Anal. Calorim. 2016, 126, 343–351. [Google Scholar] [CrossRef] [Green Version]
- Symoniuk, E.; Ratusz, K.; Krygier, K. Comparison of the oxidative stability of linseed (Linum usitatissimum L.) oil by pressure differential scanning calorimetry and Rancimat measurements. J. Food Sci. Technol. 2016, 53, 3986–3995. [Google Scholar] [CrossRef] [Green Version]
- Symoniuk, E.; Ratusz, K.; Ostrowska-Ligkeza, E.; Krygier, K. Impact of selected chemical characteristics of cold-pressed oils on their oxidative stability determined using the rancimat and pressure differential scanning calorimetry method. Food Anal. Methods 2018, 11, 1095–1104. [Google Scholar] [CrossRef] [Green Version]
- Dantas, M.; Albuquerque, A.; Soledade, L.; Queiroz, N.; Maia, A.; Santos, I.; Souza, A.; Cavalcanti, E.; Barro, A.; Souza, A. Biodiesel from soybean oil, castor oil and their blends: Oxidative stability by PDSC and rancimat. J. Therm. Anal. Calorim. 2011, 106, 607–611. [Google Scholar] [CrossRef]
- Velasco, J.; Andersen, M.L.; Skibsted, L.H. Evaluation of oxidative stability of vegetable oils by monitoring the tendency to radical formation. A comparison of electron spin resonance spectroscopy with the Rancimat method and differential scanning calorimetry. Food Chem. 2004, 85, 623–632. [Google Scholar] [CrossRef]
- Ciemniewska-Żytkiewicz, H.; Ratusz, K.; Bryś, J.; Reder, M.; Koczoń, P. Determination of the oxidative stability of hazelnut oils by PDSC and Rancimat methods. J. Therm. Anal. Calorim. 2014, 118, 875–881. [Google Scholar] [CrossRef] [Green Version]
- Symoniuk, E.; Ratusz, K.; Krygier, K. Comparison of the oxidative stability of cold-pressed rapeseed oil using Pressure Differential Scanning Calorimetry and Rancimat methods. Eur. J. Lipid Sci. Technol. 2017, 119, 1600182. [Google Scholar] [CrossRef]
- Stevanato, R.; Fabris, S.; Momo, F. New enzymatic method for the determination of total phenolic content in tea and wine. J. Agric. Food Chem. 2004, 52, 6287–6293. [Google Scholar] [CrossRef]
- Dudonne, S.; Vitrac, X.; Coutiere, P.; Woillez, M.; Mérillon, J.M. Comparative study of antioxidant properties and total phenolic content of 30 plant extracts of industrial interest using DPPH, ABTS, FRAP, SOD, and ORAC assays. J. Agric. Food Chem. 2009, 57, 1768–1774. [Google Scholar] [CrossRef]
- Zhang, Q.; Yang, W.; Liu, J.; Liu, H.; Lv, Z.; Zhang, C.; Chen, D.; Jiao, Z. Identification of six flavonoids as novel cellular antioxidants and their structure-activity relationship. Oxidative Med. Cell. Longev. 2020, 2020, 4150897. [Google Scholar] [CrossRef]
- Cao, G.; Sofic, E.; Prior, R.L. Antioxidant and prooxidant behavior of flavonoids: Structure-activity relationships. Free Radic. Biol. Med. 1997, 22, 749–760. [Google Scholar] [CrossRef]
- Heim, K.E.; Tagliaferro, A.R.; Bobilya, D.J. Flavonoid antioxidants: Chemistry, metabolism and structure-activity relationships. J. Nutr. Biochem. 2002, 13, 572–584. [Google Scholar] [CrossRef]
- Bhutto, A.A.; Kalay, Ş.; Sherazi, S.; Culha, M. Quantitative structure–activity relationship between antioxidant capacity of phenolic compounds and the plasmonic properties of silver nanoparticles. Talanta 2018, 189, 174–181. [Google Scholar] [CrossRef]
- de Lima Cherubim, D.J.; Buzanello Martins, C.V.; Oliveira Fariña, L.; da Silva de Lucca, R.A. Polyphenols as natural antioxidants in cosmetics applications. J. Cosmet. Dermatol. 2020, 19, 33–37. [Google Scholar] [CrossRef]
- Arranz, S.; Cert, R.; Pérez-Jiménez, J.; Cert, A.; Saura-Calixto, F. Comparison between free radical scavenging capacity and oxidative stability of nut oils. Food Chem. 2008, 110, 985–990. [Google Scholar] [CrossRef] [PubMed] [Green Version]

| Subgroups | Reference Standards | Code | Position and Substituents | ||||||
|---|---|---|---|---|---|---|---|---|---|
| Phenolic acids | 1 | 3 | 4 | 5 | |||||
| Caffeic acid | CAA | (CH)COOH | OH | OH | H | ||||
| 3,4-dihydroxybenzoic acid | DBA | COOH | OH | OH | H | ||||
| Ferulic acid | FEA | (CH)COOH | OCH | OH | H | ||||
| Gallic acid | GAA | COOH | OH | OH | OH | ||||
| 4-hydroxybencoic acid | HBA | COOH | H | OH | H | ||||
| p-coumaric acid | PCA | (CH)COOH | H | OH | H | ||||
| Sinapic acid | SIA | (CH)COOH | OCH | OH | OCH | ||||
| Syringic acid | SRA | COOH | OCH | OH | OCH | ||||
| Flavonols | 2’ | 3’ | 4’ | 5’ | 3 | 5 | 7 | ||
| Kaempferol | KAE | H | H | OH | H | OH | OH | OH | |
| Morin | MOR | OH | H | OH | H | OH | OH | OH | |
| Myricetin | MYR | H | OH | OH | OH | OH | OH | OH | |
| Quercetin | QUR | H | OH | OH | H | OH | OH | OH | |
| Flavanones | 3’ | 4’ | 3 | 5 | 7 | ||||
| Hesperetin | HES | OH | OCH | H | OH | OH | |||
| Naringin | NAG | H | OH | H | OH | Rham, Glc | |||
| Naringenin | NAN | H | OH | H | OH | OH | |||
| Taxifolin | TAF | OH | OH | OH | OH | OH | |||
| Dihydrochalcones | 4 | 2’ | 4’ | 6’ | |||||
| Phloridzin | PHD | OH | OH | OH | Glc | ||||
| Phloretin | PHT | OH | OH | OH | OH | ||||
| Flavanols | 3’ | 4’ | 3 | 4 | 5 | 7 | |||
| (+)-catechin | CAT | OH | OH | OH | H | OH | OH | ||
| (−)-epicatechin | EPC | OH | OH | OH | H | OH | OH | ||
Publisher’s Note: MDPI stays neutral with regard to jurisdictional claims in published maps and institutional affiliations. |
© 2022 by the authors. Licensee MDPI, Basel, Switzerland. This article is an open access article distributed under the terms and conditions of the Creative Commons Attribution (CC BY) license (https://creativecommons.org/licenses/by/4.0/).
Share and Cite
Platzer, M.; Kiese, S.; Asam, T.; Schneider, F.; Tybussek, T.; Herfellner, T.; Schweiggert-Weisz, U.; Eisner, P. Quantitative Structure-Property Relationship (QSPR) of Plant Phenolic Compounds in Rapeseed Oil and Comparison of Antioxidant Measurement Methods. Processes 2022, 10, 1281. https://doi.org/10.3390/pr10071281
Platzer M, Kiese S, Asam T, Schneider F, Tybussek T, Herfellner T, Schweiggert-Weisz U, Eisner P. Quantitative Structure-Property Relationship (QSPR) of Plant Phenolic Compounds in Rapeseed Oil and Comparison of Antioxidant Measurement Methods. Processes. 2022; 10(7):1281. https://doi.org/10.3390/pr10071281
Chicago/Turabian StylePlatzer, Melanie, Sandra Kiese, Tobias Asam, Franziska Schneider, Thorsten Tybussek, Thomas Herfellner, Ute Schweiggert-Weisz, and Peter Eisner. 2022. "Quantitative Structure-Property Relationship (QSPR) of Plant Phenolic Compounds in Rapeseed Oil and Comparison of Antioxidant Measurement Methods" Processes 10, no. 7: 1281. https://doi.org/10.3390/pr10071281
APA StylePlatzer, M., Kiese, S., Asam, T., Schneider, F., Tybussek, T., Herfellner, T., Schweiggert-Weisz, U., & Eisner, P. (2022). Quantitative Structure-Property Relationship (QSPR) of Plant Phenolic Compounds in Rapeseed Oil and Comparison of Antioxidant Measurement Methods. Processes, 10(7), 1281. https://doi.org/10.3390/pr10071281