Abstract
Pore structure is the key factor affecting reservoir accumulation and enrichment behavior. Due to the complex mineral components and pore structure of shale oil reservoirs and strong heterogeneity, it is necessary to explore the micro-pore structure characteristics of inter-salt shale. In this study, in order to qualitatively and quantitatively analyze the pore structure of inter-salt shale reservoirs, as well as evaluate the mineral composition and its spatial distribution characteristics, three shale samples from the 10th cyclothem of the Eq3 (Eq34–10 cyclothem) inter-salt shale were selected to acquire 2D and 3D grayscale images by modular automated processing system (MAPS) and X-ray micro-computed tomography (Micro-CT), respectively. The color map of the inlaid characteristics of mineral aggregates was established by Quantitative Evaluation of Minerals by Scanning Electron Microscopy (QEMSCAN), and different mineral types in the grayscale image were determined. After that, the digital core technology was used to reconstruct the core in 3D, and the maximum sphere method was used to extract the pore network model, so as to realize the quantification of micron pore throats and the 3D visualization of inter-shale samples. Meanwhile, in order to compare the fractal characteristics of the pores of the samples, the two-dimensional and three-dimensional fractal dimensions of the three cores were calculated by combining the digital core technique with fractal theory. The study yielded several notable results: the pore structure of inter-salt shale reservoirs is complex and multi-scale, and the CT scanning digital core technology can effectively realize 3D visualization of rock microstructure without damage. The pore types of rock samples are mainly intergranular pores, interparticle pores, and dissolved pores, and the minerals are mainly dolomite, calcite, and glauberite. The micron pore throat radius of the rock sample is 0.5–13.9 μm, the distribution of coordination number is mainly in the range of 1–4, and the shape of the pore throat is mainly triangular and square. The pore space of inter-salt shale has suitable fractal characteristics, and the three-dimensional fractal dimension of the three cores is in the range of 2.41–2.49. In sum, this work used digital core technology to study the microscopic pore structure of inter-salt shale oil, establishing a basis for further understanding of the seepage characteristics and exploration and development of shale oil.
1. Introduction
In recent years, with the continuous development of global oil and gas resources, conventional energy has faced the dilemma of increasing consumption [,,]. In order to alleviate the problem of energy shortage, the unconventional oil and gas resources represented by tight oil, shale oil, and shale gas have become an important research topic for scholars due to their considerable recoverable resource base [,]. Different from conventional reservoirs, shale oil reservoirs develop micro-nano-scale pores, complex pore structures, and strong heterogeneity, which brings great challenges to the characterization of pore structures [,]. The micropore structure of reservoir rock is the core point of reservoir characteristics research. It is a representation of the basic properties and reservoir capacity of rock pores and throats and is closely related to the differential distribution of oil and gas reservoir productivity. At the same time, the micropore throat structure is also the most important factor affecting the macro-reservoir quality and fluid flow of shale. Therefore, quantitative evaluation and characterization of the micropore structure of the reservoir, including pore geometry, pore size distribution, and pore connectivity, are of great significance for maintaining and enhancing oil recovery [].
The strong heterogeneity of shale is characterized by complex pore space structure and wide pore size distribution [,,]. In order to comprehensively and intuitively clarify the complex microstructure of shale reservoirs, scholars have carried out considerable research. Generally speaking, research methods can be divided into two categories: qualitative and quantitative research.
Quantitative research mainly characterizes the pore diameter and specific surface area of shale pores through experimental data. Among them, the experimental means mainly include high-pressure mercury intrusion (HPMI), constant-rate mercury intrusion (CRMI), gas adsorption, nuclear magnetic resonance (NMR), small-angle neutron scattering (SANS), and ultra-small-angle neutron scattering (USANS). HPMI experiments can determine the throat size of the rock and pore throat volume distribution according to the rock capillary pressure curve [,]. The maximum mercury inlet pressure in the experiment is 413.8 MPa, and the minimum pore diameter that can be tested is about 2 nm. However, due to the limitation of mercury intrusion pressure, HPMI cannot fully reflect the reservoir pore space. CRMI is mainly used to measure the porosity and permeability of shale samples and is regarded as a quasi-static process. The principle of this method is to determine the number distribution of pores and roars according to the natural pressure fluctuations generated by the meniscus at the mercury inlet when passing through different microscopic pore shapes [,]. CRMI cannot measure diameter less than 0.12 μm, and the constant velocity mercury intrusion test takes a long time. This method can obtain the quantity distribution of pores in the pore structure, rather than the volume distribution, which can better characterize the seepage characteristics of the reservoir. Gas physical adsorption methods such as nitrogen and carbon dioxide adsorption are common methods to quantitatively characterize the pore structure of shale. It is often used to analyze the pore structure of porous materials with an effective pore size between 0.35 nm and 200 nm, but it cannot determine the closed micropores, and when measuring compact rocks with a small specific surface area, the error is large []. The gas physical adsorption method, such as HPMI, cannot obtain the complete pore size distribution and characteristics from micropores to macropores in shale samples. NMR, as a non-invasive physical technology, can identify 3 nm small holes by shortening the echo interval, but its ability to identify large holes is low. In addition, NMR is an indirect test technology, which is easily affected by the test environment, conversion coefficient, and magnetic minerals such as pyrite contained in shale, resulting in errors in the measurement results []. SANS and USANS have been used to characterize the pore structure of shale due to their nondestructive, total porosity detection, sensitivity to light elements, identification of isotopes, and strong scattering of magnetic moment []. These two methods are powerful tools for studying micropores, mesopores, and macropores ranging in size from 1 nm to10 μm in disordered systems and can be combined with fluid invasion methods to achieve a comprehensive understanding of shale pore space.
Qualitative research includes the 2D image analysis method and the 3D digital core reconstruction method. The 2D image analysis technology is to collects core profile images through high-resolution instruments, which can intuitively, conveniently, and quickly obtain the characteristics of pore morphology, so as to qualitatively analyze the mineral morphology, pore throat size distribution, and connectivity of rocks. The 3D digital core reconstruction method is divided into a physical experiment method and a numerical reconstruction method. The physical experiment method is to use a high-resolution scanning electron microscope to scan the core to obtain three-dimensional information. The numerical reconstruction method is based on the two-dimensional images obtained by scanning and uses relevant algorithms and software to reconstruct the core [,]. At present, the commonly used scanning instruments include optical microscopes (OM), scanning electron microscopes (SEM), atomic force microscopes (AFM), field-emission scanning electron microscopy (FESEM), environmental scanning electron microscopes (ESEM), and focused ion beam scanning electron microscopes (FIB-SEM) [,,]. According to previous research [,,,,], the resolution of OM is low, and it is mainly used for the study of mesopores and macropores; the resolution of SEM is about 6 nm, which is mainly used for the observation of pore surface morphology. At present, it has become a common method for the qualitative characterization of reservoir pore structure; AFM has a resolution of 0.1 nm, and according to the interaction between the measured samples, the morphological and structural characteristics of the sample surface are obtained; FESEM and ESEM further improve the resolution based on the ordinary scanning electron microscope technology, which can reach 0.5–2 nm, which is more suitable for the characterization of pore structure of tight reservoirs. The resolution of ESEM can reach about 3 nm, and it is mainly aimed at the samples containing water and oil in the natural state to analyze the properties of the fluid and further understand the occurrence state of oil and water in the reservoir. FIB-SEM can more clearly observe the nanopore distribution and connectivity of unconventional tight rocks such as natural gas shale and fine sandstone. However, due to the high cost of sample preparation, there are certain limitations in its wide application.
The average pore size of shale oil is only on the micro-nano scale, and conventional methods cannot effectively describe the pore structure characteristics of shale. Therefore, with the continuous improvement of characterization requirements, reservoir characterization technology has gradually developed from 2D plane characterization to 3D space characterization, and 3D reconstruction technology based on CT scanning is also the focus of current research. The 3D digital core technology can finely characterize the rock microstructure at the pore scale, so as to analyze the rock microstructure information [,,,,,]. In this study, three inter-salt shale core samples that were extracted from the Qianjiang Depression, Jianghan Basin are used to carry out microscopic scanning of rock composition and digital characterization of pore structure in low-permeability reservoirs through digital core scanning and simulation technology. In this way, the mineral composition and its spatial distribution characteristics can be evaluated, and the microscopic pore structure and fractal characteristics can be analyzed according to the reconstructed 3D digital core model and pore network model. At the same time, it provides theoretical support for the subsequent improvement of shale reservoirs and the later optimization of water flooding to enhance oil recovery.
2. Samples and Methods
2.1. Sample Collection
The Qianjiang Depression of the Jianghan Basin in mid-eastern China is formed under the environment of strong evaporation and high salinity deposition, which has a salt layer approximately 300–600 m in thickness and covering 193 sets of rock-salt rhythms vertically layered. The inter-salt shale oil reservoir is separated by the upper and lower salt rocks, resulting in poor vertical transport conditions, thus creating good hydrocarbon source and storage conditions and forming a unique shale oil system and great prospects for exploration.
In this study, the three cores selected in this experiment were taken from Well X and Well Y in the Q34-10 rhythm layer in the Jianghan Basin, and they were representative to a certain extent. Samples were taken from 2800–2820 m depth, and the TOC content is between 0.9–2.65% with an average of 1.72% (Figure 1). Among them, samples A and C are both dolomite, but their porosity and permeability are quite different, which are distributed at 3.1–18.9% and 1.5–8.6 mD, respectively. Meanwhile, sample C contains the reservoir-specific mineral glauberite in its mineral composition. Sample B is limestone, and its porosity and permeability parameters are similar to those of sample A, but in contrast, sample B has higher porosity and lower permeability.
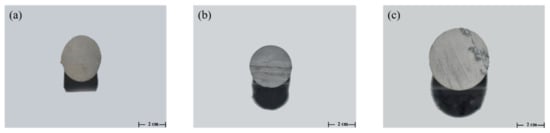
Figure 1.
Images of inter-salt shale samples: A (a), B (b), and C (c).
2.2. Methods
2.2.1. QEMSCAN
QEMSCAN is mainly used to analyze sample morphology and distribution, such as observing micro- and nano-pore structure, size, type, and micro-cracks. At the same time, it can also realize the qualitative and semi-quantitative analysis of different components in the sample []. The working principle of this technology is based on X-ray energy spectrum analysis. The sample surface is scanned by a high-energy electron beam accelerated by the set grating scanning mode, and it identifies the mineral type represented by the pixel point according to the elemental composition of rock minerals. After automatically scanning the sample end face point by point, a color map of the inlaid features of the two-dimensional mineral aggregates is obtained. At the same time, the X-ray energy spectrum emitted by the instrument provides information on the element content at each measurement point, and the element content can be obtained by combining the scanned grayscale image with the intensity of the X-ray, which is converted into a mineral phase.
2.2.2. Micro-CT Scans
CT scanning technology has been widely used in the research field of unconventional reservoir structure with the continuous expansion of application fields since its conception in the 1960s. CT imaging technology is an important means of constructing three-dimensional digital core. It can image and digitize the pore space and mineral matrix of natural rock; realize the quantitative characterization of pore type, size, and connectivity more quickly and accurately; and has greater advantages in the characterization of rock pore structure without damaging the sample [].
Due to the development of micro-fractures and serious rock core cracking in inter-salt shale oil reservoirs, it is difficult to drill the plunger, and the relevant physical property test results also have certain errors. Therefore, the three-dimensional reconstruction and calculation results have guiding significance for in-depth understanding of the pore structure of the reservoir. In this study, the samples were prepared in the direction of vertical bedding, and the rock samples were scanned at two scales. First, in order to expand the scanning area of the samples, a rough scan of the core samples with a resolution of 13 μm was performed. Secondly, in order to observe the pore structure inside the core in more detail, the samples were finely scanned with a resolution of 1 μm so as to achieve fine characterization of samples at different scales. The principle of scanning electron microscopy is to use conical X-rays to penetrate the object and enlarge the image through an objective lens with different magnifications. During CT scanning, the transverse translation and vertical lifting of the sample are used to change the scanning area. The turntable drives the sample to rotate. Every one or two degrees of rotation, the X-ray irradiates the sample to obtain the projection map. After a series of projection maps obtained after 360 degrees of rotation are reconstructed, the three-dimensional image of the core sample is obtained.
2.2.3. MAPS
Since the image fields obtained by traditional scanning electron microscope are small and non-representative, the cores were tested in this study using MAPS produced by FEI (Lincoln, NE, USA). This technology uses the primary electron incident to collide the extranuclear electrons of the sample to produce secondary electrons and back-reflected electrons. The detector obtains the image through the reception and analysis of secondary electrons and back-scattered electrons. After each grid scanning of the whole picture is completed, a series of high-resolution two-dimensional images will be obtained for splicing, which will be combined into two-dimensional images with high precision and wide field of vision, which can better observe the pores.
2.2.4. Fractal Dimension
The main idea of fractal theory is that objective things have self-similar hierarchical structure, and the part and the whole are identical or statistically similar in form, function, information, time, and space []. In the early 20th century, the German mathematician Hausdorff put forward the concept of fractal dimension. By 1975, the French mathematician Mandelbrot first proposed fractal geometry to explain the phenomena of irregular, unstable and highly complex structures in nature; that is, fractal dimension is a measure of the degree of geometric irregularity [,].
As an effective framework, fractal theory can describe the pore structure in complex two-dimensional and complex space. There are three common fractal dimension calculation methods: box dimension method, Brownian motion method, and area measurement method []. The box-counting dimension method used here is also called the box dimension or the Minkowski dimension. It is a calculation method for measuring the fractal dimension in the distance space (Figure 2), and due to its simple principle and precise expression, it is widely used.
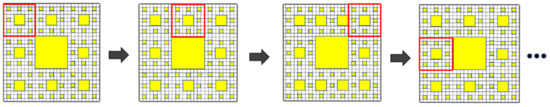
Figure 2.
Box-counting method dimension operation process.
The principle of box-counting dimension is to divide the fractal into each evenly distributed grid. Suppose SRn is a nonempty bounded set in space. Use a lattice or cube with edge length of a to cover the set of S. When a0, there is a positive number Z that satisfies the following equation, and the fractal dimension D can be obtained [].
In the formula, Na(S) represents the number of boxes needed to cover the two-dimensional space each time. a represents the space step size of covering the two-dimensional space, and D represents the fractal dimension.
3. Results and Discussion
3.1. Mineral Composition and Pore Structure Type
3.1.1. Mineral Composition
The mineral composition and distribution of rock are key parameters to characterize rock. By clarifying the type and distribution form of each mineral component, one can more accurately carry out the numerical model of rock physics based on a digital core.
In this work, MAPS rough scan and fine scan are performed on the selected scanning area of the target samples, and the resolutions are 1 μm and 25 μm, respectively. The target area is divided into a series of regular grids, the secondary electron imaging mode is used and the SEM image of each grid is automatically acquired, and a large field of view and high-precision MAPS images are formed by stitching. As shown in Figure 3, the upper and lower layers represent the rough and fine scan MAPS images, respectively. In grayscale images, different grayscale values represent different minerals, and the intensity of brightness reflects the number of atoms in the minerals.
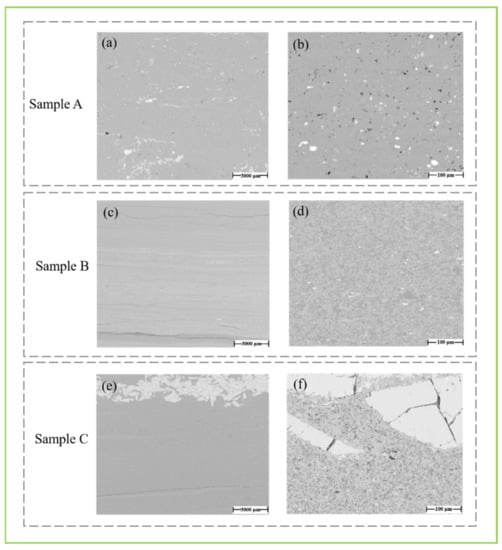
Figure 3.
MAPS crude (a,c,e) and fine (b,d,f) scanning test results of sample A, sample B, and sample C.
Mineral analysis of the prepared samples was carried out by QEMSCAN. The scanning area is 27 mm × 27 mm with a pixel resolution of 25 μm, and the EDS of the scanned pixels are corresponding to the minerals to form a color map of the embedding characteristics of mineral aggregates. In Figure 4, the mineral composition of Sample A is similar to that of rough scanning maps. In the rough sweep diagram (Figure 4a), dolomite is the main mineral with nearly 80%, and quartz is distributed in patch, strip, and amorphous shapes. In the fine scanning image (Figure 4b), quartz is only distributed in patches. In the rough sweep diagram of Sample B (Figure 4c), the strips include calcite and glauberite, in which dissolved pores are more developed in calcite, and in other areas, calcite is the matrix, and illite, pyrite, and albite are mixed. In the fine scan (Figure 4d), the matrix area is also uniformly distributed with calcite, followed by albite, and illite is distributed among the particles, and pyrite and quartz particles are also widely distributed. In the rough scan of Sample C (Figure 4e), dolomite is the main mineral with a content of 62.72%, glauberite content exceeds 16%, and minerals such as quartz, illite, and albite are mixed in. The dolomite and glauberite are still the main minerals In the fine scan picture (Figure 4f), and the particles are large and distributed in the sample in large blocks, with the contents of 45.75% and 32.8%, respectively. In addition, the contents of illite, albite, and quartz are not much different, about 4–6%. From the above comprehensive mineral content data results, it can be seen that compared with other reservoirs, the inter-salt shale reservoir has lower clay mineral content, lower quartz content, and higher carbonate content. The reason for this result is due to the fact that the inter-salt shale reservoir belongs to the lacustrine high-salt sedimentary facies, formed at high salinity and under strong evaporation environment. At the same time, due to the occurrence of these special minerals such as dolomitic, glauberite, and sodium chloride, the porosity of shale oil is higher on average. Some previous studies have shown that the average porosity of inter-salt shale samples measured by the low-temperature nitrogen adsorption method is 6.37–18.58% []. This is similar to the porosity of the samples used in this work. Therefore, it can be proved that the inter-salt shale sample selected in this study is representative.
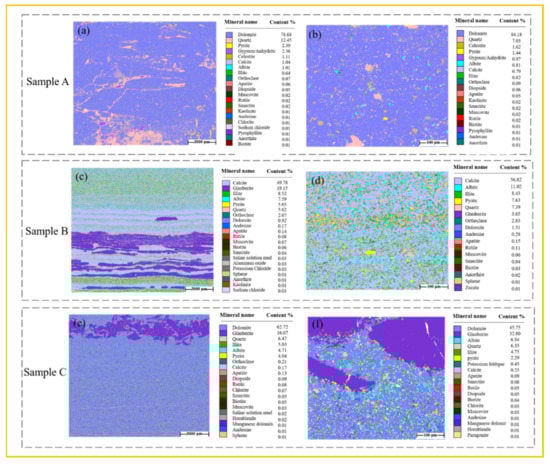
Figure 4.
QEMSCAN crude (a,c,e) and fine (b,d,f) scanning test results of sample A, sample B, and sample C.
3.1.2. Pore Structure Type
Identifying pore types is the basis for studying the microscopic pore structure of reservoirs. Some previous studies have pointed out that most pore systems in shale are micro pores, so they can not be seen by OM [,,]. However, different types of pores can be revealed by high-precision scanning images. In this work, the target scanning area is scanned by MAPS (maximum resolution-10 nm) to identify the pores, so as to understand the microscopic characteristics of the sample.
The MAPS statistical analysis of three inter-salt shale samples shows that there are four main types of pores in rock samples: intergranular pores, intergranular dissolved pores, interparticle pores, dissolved pores. Among them, the pore types of Sample A are mainly intergranular dissolved pores and intergranular pores and contains some intraparticle/intragranular pores. In this, the intergranular dissolved pores are larger, and the radius can reach 20–30 μm. Intergranular pores are widely developed, the pores are smaller, and most of the radii are less than 1 μm, up to 4–5 μm. The pore radius in the intraparticle/intragranular pores is minimal, mostly less than 50 nm. Sample B is mainly composed of interparticle pores and dissolved pores, and intraparticle pores are secondary pores (Figure 5d,e). Interparticle pores are mainly developed in calcite particles and also in albite particles, and dissolved pores are mainly developed in calcite bands. Sample C is represented by dolomite intergranular pores and interparticle pores between different mineral particles, and a large number of granular clay minerals are filled in the pores (Figure 5f).
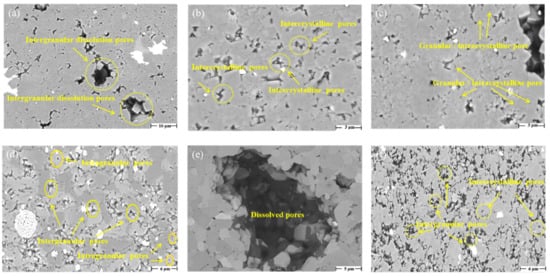
Figure 5.
MAPS scan of sample A (a–c), B (d,e), and C (f).
3.2. Microscopic Pore Structure from CT Scans
3.2.1. Pore Structure Type Image of Core Based on CT Scans
Considering the high heterogeneity and complex reservoir structure of shale, scholars encountered many difficulties in traditional petrophysical experiments [,]. For example, shale has the characteristics of low porosity and low permeability, which makes rock displacement difficult. At the same time, it is difficult to obtain representative cores from fractures developed in salt rocks and to conduct petrophysical experiments. This results in the inability of petrophysical experiments to quantitatively study the influence of reservoir microscopic parameters on the macroscopic physical properties of rocks. Therefore, based on CT scanning, this work builds a bridge between the microstructure and macroscopic physical properties of the core, makes up for the limitations of the experiment, and also achieves a comprehensive multi-scale imaging of shale samples.
In this work, we firstly selected the range of the scanning field of 25.4 mm × 26 mm for rough scanning, and the resolution was 13 μm. Next, a range of 2 mm × 2 mm was selected for fine scanning, and the scanning accuracy was 2 μm. The three inter-salt shale samples were scanned layer by layer to obtain 800 scanned images.
It can be seen from Figure 6 that the dark areas of Sample A are dolomite and quartz, and the bright areas are pyrite, gypsum, and lapis lazuli. Micro-pores are relatively developed, and a small amount of intergranular dissolution pores and intergranular pores can be identified. The bright areas of Sample B are pyrite and glauberite, and the dark areas are illite, albite, and quartz. The bright area of Sample C is pyrite, and other areas are mainly dolomite, in addition to a small amount of quartz and albite.
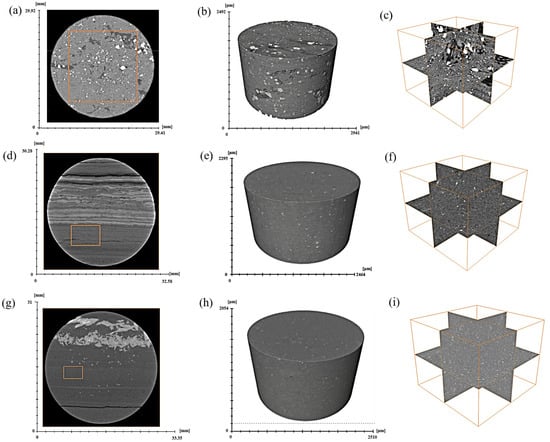
Figure 6.
Micron CT scan of sample A (a–c), B (d–f) and C (g–i).
3.2.2. Three-Dimensional Coal Structure Reconstruction
The construction process of shale digital core is based on the two-dimensional image of the real core and uses relevant mathematical methods to reconstruct the core on the spatial plane. Digital core technology can maintain the statistical characteristics of the original two-dimensional image and provide a new way for rapid analysis of reservoir physical properties.
However, in the process of converting a two-dimensional image into a three-dimensional analog image, to a certain extent, due to the influence of internal and external factors, problems such as noisy pixels and discontinuity of image edges occur, so it is necessary to preprocess the scanned image using denoising, enhancement, filtering, and other methods to obtain 3D volume data of pore structure that meet the analysis requirements. The 3D digital core image after image enhancement and filtering is shown in Figure 7.
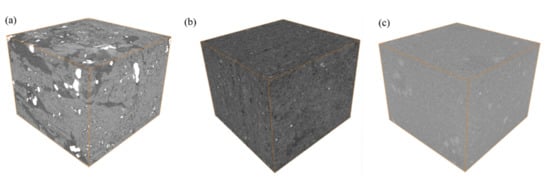
Figure 7.
3D digital cores of sample A (a), sample B (b), and sample C (c).
3.3. Three-Dimensional Pore Structure and Visualization
3.3.1. 3D Visualization of Pore Space
Pore connectivity is extremely important to shale, determining whether and how fluids move through the reservoir. Previous experiments have shown the existence of a large number of disconnected pores in shale, but for a long time, the connection between space and connectivity within shale reservoirs has not been intuitively reflected, especially the lack of analysis of the connectivity of core pore space at the microscopic scale []. Therefore, this work uses the three-dimensional visualization technology of digital cores to truly depict the pore space in the target rock sample, and accurately locate the distribution state of the pore space. In this study, the rock Sample C is taken as an example after the core reconstruction is completed through the data volume obtained by CT scanning. The image was segmented using binary image technology to separate the pores from the solid skeleton. The complex pore space is transformed into connected and disconnected states to reflect the connectivity of pores. In Figure 8, the transparent colorless area represents the skeleton, and the pore space is divided into three parts: the blue, silver, and purple parts represent the three-dimensional pore model, connected pore model, and disconnected pore model.
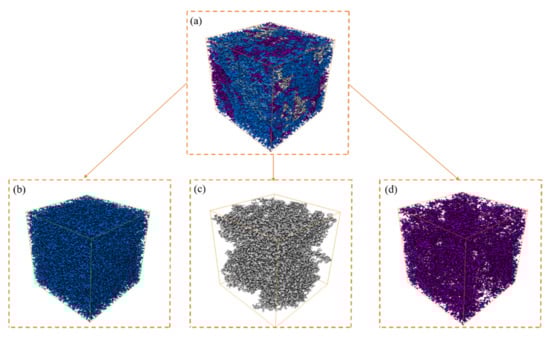
Figure 8.
3D digital core model (a). visualization of the pores(b), connected pores(c) and non-connected pores (d) of sample C.
The proportion of connected pores in total pores can reflect the relationship between effective porosity and total porosity. This work calculated the ratio of connected pores to non-connected pores for the three cores, respectively (Figure 9). Among them, Sample A has the largest proportion of connected pores, reaching 79.32%; Sample B is the second largest, with connected pores accounting for 78.05%; Sample C has the smallest proportion of connected pores, with a probability of 62.07%, while isolated pores account for the largest proportion.
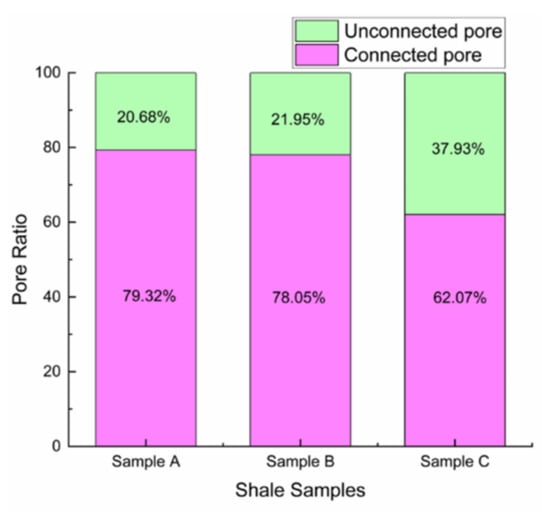
Figure 9.
Pore connectivity analysis of three shale samples.
3.3.2. Pore Network Model
In the process of reservoir evaluation, the study of microscopic pore structure is an important step to reveal reservoir properties. Among them, the distribution characteristics and configuration of pores and throats have an important influence on the reservoir performance and physical properties of the reservoir. In this work, the “Maxima-Ball” method is used to extract the pore network model from the 3D digital core image after binarization, which can not only realize the quantitative characterization of rock micro pore structure, such as calculating the distribution of pore throat radius, coordination number, and other parameters, but also provide a basis for the subsequent calculation of porosity and permeability. Meanwhile, some previous studies compared the pore size calculated by the pore network model method with that calculated by the conventional mercury intrusion method. It can be found that the mercury intrusion method can only measure the connected pore throats, and the high-precision scanning device can identify micropores []. Therefore, in the later calculation, the pore network model method can make up for the disadvantages of low calculation results and low accuracy of the conventional mercury intrusion method. As shown in Figure 10, the extraction results of the pore network model of the three rock samples are represented by the spherical tube model to represent the pores and channels.
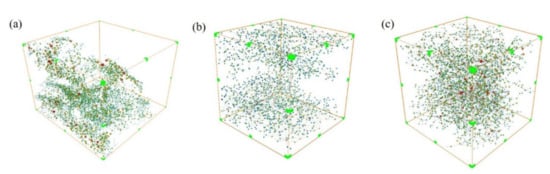
Figure 10.
Pore network model of sample A (a), sample B (b), and sample C (c).
The obtained pore and throat characteristics were analyzed by Avizo pore network model module software, and the pore throat radius, shape factor coordination number, and other structural parameters were calculated. The results show that the pore throat radius and pore throat volume distribution of the three core samples have certain differences (Figure 11a,b). Among them, the pore throat radius of Sample B has the widest distribution range, mainly between 0.5–13.9 μm, and the average radius of the pore throat is 4.3 μm. The pore throat radius distributions of Sample A and Sample C are similar, about 0.5–8.9 μm and 0.5–6.66 μm, respectively, but the average radius of Sample C is smaller. Similarly, the size of the pore coordination number reflects the quality of pore connectivity, and the coordination number of different samples is also different (Figure 11c). Sample A has the widest distribution of coordination numbers, indicating the best connectivity, with an average value of 2.53; Sample B has the next best connectivity, with an average value of 1.62; and Sample C has the narrowest distribution of coordination numbers and the worst connectivity, with an average value of 1.35. The shape factor uses cross-section cylinders to replace the pores and throats in the real core. The main distribution ranges of the shape factors of the three samples are roughly the same, primarily triangles and squares, with average values of 0.0535, 0.0508, and 0.0531, respectively (Figure 11d).
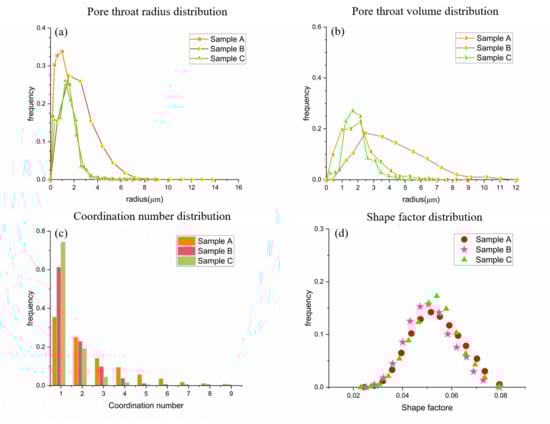
Figure 11.
Pore structure parameter distribution. (a) pore throat radius distribution statistics; (b) pore throat volume distribution statistics; (c) pore coordination number statistical histogram; and (d) shape factor distribution statistics.
3.3.3. Fractal Dimension Analysis of Pore Structure
In order to further validate the accuracy of the pore network model extraction results, this work introduces the fractal dimension to qualitatively describe the complexity of the pore structure of inter-salt shale, thus making our research results more reliable and convincing. In this study, the calculation method of box-counting dimension is used to describe the fractal dimension characteristics of the pore space. In the fractal dimension calculation of images, the irregularity of the pore boundary under different layers can be understood by the size of the fractal dimension. As an important parameter to characterize the heterogeneity of pore structure in porous media, fractal dimension can accurately reflect the development degree of each pore. In the calculation of fractal dimension of two-dimensional images, it should be noted that the size should be considered when selecting the box to avoid a situation in which the picture cannot be divided into whole parts. The relevant steps are as follows:
- The acquired two-dimensional images of the three cores are processed by grayscale adjustment, feature detection, boundary recognition;
- Image binarization: strengthen the target information in the image, and convert the image into a two-dimensional matrix represented by numbers “0” and “1”;
- Divide the binarized image with boxes of size a × a (a > 0), and count the number of boxes to be covered N;
- Count the dimension of pores under different box sizes and fit the data of points drawn in double logarithmic coordinates with the data composed of grid size and number of covered grids.
The 400 representative 2D scan pictures selected in this study were used to calculate the 2D fractal dimension of the three cores through code compilation. In Figure 12, the relationship curves of log a-log N are established in the coordinate system, and it can be seen that the fractal dimensions of the three cores are different. The fractal dimensions of samples A, B, and C are 1.35–1.53, 1.29–1.46, and 1.36–1.49, respectively. At the same time, it can be seen from the amplitude of the change in the 2D fractal dimension of different scanned images of the same sample that the amplitude of change of sample A and sample B is larger, and the amplitude of sample C is smaller. The reason for this phenomenon may be the strong heterogeneity of the reservoirs. Moreover, the pore throat distribution of sample A and sample B is wider than that of sample C, which also explains why the variation amplitude of sample A and sample B is larger than that of sample C.
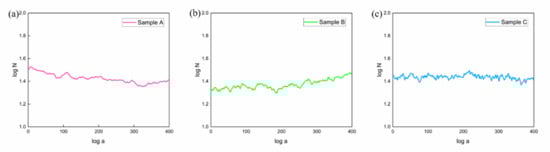
Figure 12.
Calculation results of 2D fractal dimension of sample A (a), sample B (b) and sample C (c).
In the calculation of fractal dimension of 3D images, the CT scanning image is regarded as three-dimensional space {(x, y, z)}. Cubes with different side lengths in the core area are selected to cover the image. The cube side length a decreases by 1/2n, and the number of pore facies with different side length a is calculated. Like 2D fractal, 3D fractal is calculated by drawing double logarithmic coordinates and fitting a straight line, and the slope of the straight line is the value of the three-dimensional fractal dimension. At the same time, the larger the fractal dimension, the greater the roughness of the pore surface.
It can be seen from Figure 13 that the pore shape of the three samples is irregular and the pore distribution is uneven. The region in the upper half shows that the pore space is in the middle, and the linear region fitted in the region in the lower half is the fractal dimension of the target core. According to the slope value, the pore space of the rock sample is in a non-fractal state, the distribution range of fractal dimension is 2.41–2.49, and the coefficient of determination is more than 0.99, so the calculated fractal dimension is effective. At the same time, comparing the three-dimensional fractal dimension of the three cores with the pore size calculated through the pore network, it can be found that the average pore size of sample C is the smallest and the fractal dimension is the largest. On the contrary, sample B has the largest average pore size and the smallest fractal dimension. Therefore, the accuracy of the above results is also further verified.
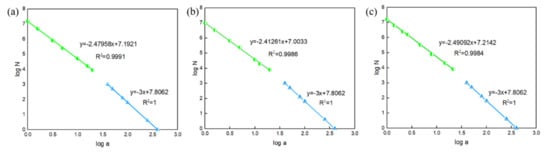
Figure 13.
Calculation results of 3D fractal dimension of sample A (a), sample B (b) and sample C (c).
4. Conclusions
In view of the traditional experimental methods such as low-temperature nitrogen adsorption or high-pressure mercury intrusion, there are problems such as low accuracy of experimental results, inability to identify micropores, and large damage to cores. In this study, MAPS, CT scanning, QEMSCAN, digital core, and other techniques are combined; meanwhile, the concept of fractal dimension is introduced to systematically study the pore structure characteristics of inter-salt shale reservoirs and quantitatively characterize the pore type, mineral composition, pore size distribution, and other parameters in the pore space of inter-salt shale reservoirs. The calculation results of pore structure parameters show that the average radii of the micron pore throats of the three target rock samples are 2.08 μm, 4.3 μm, and 1.88 μm, and the overall average is 2.75 μm. In terms of coordination number distribution, the coordination number is the microscopic parameter that characterizes the connectivity of the reservoirs. Sample A has the widest coordination number distribution, indicating the best connectivity, with an average value of 2.53. The connectivity of Sample B is the second best, with an average value of 1.62. Sample C has the narrowest coordination number distribution range and the worst connectivity, with an average value of 1.35. In terms of shape factors, the main distribution ranges of shape factors of the three samples are roughly the same, mainly triangular and square. In terms of pore connectivity, Sample A has the largest proportion of connected pores, and Sample C has the largest proportion of disconnected pores. The pore space of the three inter-salt shale samples has suitable fractal characteristics, and the distribution range of fractal dimension is 2.41–2.49. The complexity of pore space can be explored through fractal dimension, which lays a foundation for the subsequent exploration and development of low-permeability shale reservoirs.
Author Contributions
Conceptualization, J.Z. and Z.M.; methodology, J.Z.; software, J.Z. and C.W.; validation, J.Z. and Z.M.; formal analysis, J.Z. and Z.M.; investigation, J.Z., L.Y. and R.H.; resources, J.Z. and C.W.; data curation, Z.M.; writing—original draft preparation, J.Z.; writing—review and editing, J.Z. and Z.M.; visualization, J.Z. and Z.M.; supervision, Y.Z., L.Y. and Y.L.; project administration, Y.Z. and M.Z.; funding acquisition, Y.Z., C.W. and R.H. All authors have read and agreed to the published version of the manuscript.
Funding
This work was supported by the National Science and Technology Major Project during the 13th Five-Year Plan under grant number No. 2016ZX05060-026 and No. 2017ZX05049005-010. National Natural Science Foundation of China (No. 51704033, No. 51804038, and No. 52004032).
Data Availability Statement
The data presented in this study are available on request from the corresponding author.
Conflicts of Interest
The authors declare that they have no conflict of interest to report regarding the present study.
References
- Tong, X.G.; Zhang, G.Y.; Wang, Z.J.; Wen, Z.X.; Tian, Z.J.; Wang, H.J.; Ma, F.; Wu, Y.P. Distribution and potential of global oil and gas resources. Pet. Explor. Dev. 2018, 45, 779–789. [Google Scholar] [CrossRef]
- Sorrell, S.; Speirs, J.; Bentley, R.; Brandt, A.; Miller, R. Global oil depletion: A review of the evidence. Energy Policy 2010, 38, 5290–5295. [Google Scholar] [CrossRef]
- Zou, C.N.; Yang, Z.; He, D.B.; Wei, Y.S.; Li, J.; Jia, A.L.; Chen, J.J.; Zhao, Q.; Li, Y.L.; Li, J.; et al. Theory, technology and prospects of conventional and unconventional natural gas. Pet. Explor. Dev. 2018, 45, 575–587. [Google Scholar] [CrossRef]
- Zhou, Q.F. Discussion on key issues of shale oil/gas resource assessment. Oil Gas Geol. 2022, 43, 26–33. [Google Scholar]
- Tong, X.G.; Li, D.H.; Wang, H.J.; Wang, B.; Liu, Z.D.; Xie, Y.F.; Zhang, X.S.; Yang, L.Y.; Ma, F.; Wu, Z.Z. Assessment of global unconventional oil and gas resources. Pet. Explor. Dev. 2016, 43, 925–940. [Google Scholar]
- Feng, Q.H.; Xu, S.Q.; Xing, X.D.; Zhang, W.; Wang, S. Advances and challenges in shale oil development: A critical review. Adv. Geo-Energy Res. 2020, 4, 406–418. [Google Scholar] [CrossRef]
- Yan, L.; Chen, F.L.; Wang, Z.P.; Yan, Y.Q.; Cao, J.J.; Wang, K.Q. Challenges and Technical Countermeasures for Effective Development of Shale Oil in China. Pet. Drill. Technol. 2020, 48, 63–69. [Google Scholar]
- Lai, J.; Wang, G.W.; Wang, Z.Y.; Chen, J.; Pang, X.J.; Wang, S.C.; Zhou, Z.L.; He, Z.B.; Qin, Z.Q.; Fan, X.Q. A review on pore structure characterization in tight sandstones. Earth-Sci. Rev. 2018, 177, 436–457. [Google Scholar] [CrossRef]
- Song, W.H.; Wang, D.Y.; Yao, Y.; Li, Y.; Sun, H.; Yang, Y.F.; Zhang, L. Multiscale image-based fractal characteristic of shale pore structure with implication to accurate prediction of gas permeability. Fuel 2019, 241, 522–532. [Google Scholar] [CrossRef]
- Li, Z.Q.; Wang, W.; Wang, X.M.; Bai, Y.W.; Qin, D.T.; Zhao, Y. Study on fractal characteristics of micro-nano pore structure of shale. Pet. Geol. Exp. 2018, 26, 494–503. [Google Scholar]
- Dou, J.A.; Lin, L.Q.; Shao, F.; Dong, H.M. Advances in characterization techniques and experimental methods of shale gas reservoir pore structure. J. Xi’an Univ. Sci. Technol. 2020, 40, 1019–1030. [Google Scholar]
- Gong, X.P.; Tang, H.M.; Zhao, F.; Wang, J.J.; Xiong, H. Quantitative characterization of pore structure of shale reservoir of Longmaxi Formation in Sichuan Basin. Lithol. Reserv. 2016, 28, 48–57. [Google Scholar]
- Wu, Y.Q.; Tahmasebi, P.; Lin, C.Y.; Zahid, M.A.; Dong, C.M.; Golab, A.; Ren, L.H. A comprehensive study on geometric, topological and fractal characterizations of pore systems in low-permeability reservoirs based on SEM, MICP, NMR, and X-ray CT experiments. Mar. Pet. Geol. 2019, 103, 12–28. [Google Scholar] [CrossRef]
- Feng, D.J.; Xiao, K.H. Constant velocity mercury injection and nuclear magnetic resonance in evaluation of tight sandstone reservoirs in western Sichuan Basin. Pet. Geol. Exp. 2021, 43, 368–376. [Google Scholar]
- Wang, J.K.; Zhang, J.L.; Shen, W.L.; Liu, H.Y. Comparison of the Pore Structure of Ultralow-Permeability Reservoirs Between the East and West Subsags of the Lishui Sag Using Constant-Rate Mercury Injection. J. Ocean Univ. China 2021, 20, 315–328. [Google Scholar] [CrossRef]
- Wang, Y.M.; Huang, J.L.; Li, X.J.; Dong, D.Z.; Wang, S.F.; Guan, Q.Z. Quantitative characterization of fractures and pores in shale beds of the Lower Silurian, Longmaxi Formation, Sichuan Basin. Nat. Gas Ind. B 2015, 2, 481–488. [Google Scholar] [CrossRef][Green Version]
- Sun, M.D.; Yu, B.S.; Hu, Q.H.; Yang, R.; Zhang, Y.F.; Li, B.; Yuri, M.; Gang, G. Pore structure characterization of organic-rich Niutitang shale from China: Small angle neutron scattering (SANS) study. Int. J. Coal Geol. 2018, 186, 115–125. [Google Scholar] [CrossRef]
- Wu, J.G.; Yuan, Y.; Niu, S.Y.; Wei, X.F.; Yang, J.J. Multiscale characterization of pore structure and connectivity of Wufeng-Longmaxi shale in Sichuan Basin, China. Mar. Pet. Geol. 2020, 120, 104514. [Google Scholar] [CrossRef]
- Ni, H.Y.; Liu, J.F.; Huang, B.X.; Pu, H.; Meng, Q.B.; Wang, Y.G.; Sha, Z.H. Quantitative analysis of pore structure and permeability characteristics of sandstone using SEM and CT images. J. Nat. Gas Sci. Eng. 2021, 88, 103861. [Google Scholar] [CrossRef]
- Bai, B.; Zhu, R.K.; Wu, S.T.; Yang, W.J.; Gelb, J.; Gu, A.; Zhang, X.X.; Su, L. Multi-scale method of Nano (Micro)-CT study on microscopic pore structure of tight sandstone of Yanchang Formation, Ordos Basin. Pet. Explor. Dev. 2013, 40, 354–358. [Google Scholar] [CrossRef]
- Deng, H.C.; Hu, X.F.; Li, H.A.; Luo, B.; Wang, W. Improved pore-structure characterization in shale formations with FESEM technique. J. Nat. Gas Sci. Eng. 2016, 35, 309–319. [Google Scholar] [CrossRef]
- Gao, H.; Li, H.A. Pore structure characterization, permeability evaluation and enhanced gas recovery techniques of tight gas sandstones. J. Nat. Gas Sci. Eng. 2016, 28, 536–547. [Google Scholar] [CrossRef]
- Li, J.L.; Cheng, B.Y.; Liu, R.J.; Meng, F.L.; Liu, Y.; Gao, Y.; Ma, K.; Jiang, H.Q. Micro mechanism of water sensitivity of pore scale glutenite based on digital core. Acta Pet. Sin. 2019, 40, 594–603. [Google Scholar]
- Bai, Y.; Berezovsky, V.; Popov, V. Digital Core 3D Reconstruction Based on Micro-CT images via a Deep Learning Method. In Proceedings of the 2020 International Conference on High Performance Big Data and Intelligent Systems (HPBD&IS), IEEE, Shenzhen, China, 23 May 2020; pp. 1–6. [Google Scholar]
- Sakhaee, P.A.; Li, W.F. Fractal dimensions of shale. J. Nat. Gas Sci. Eng. 2016, 30, 578–582. [Google Scholar] [CrossRef]
- Xia, Y.X.; Cai, J.C.; Perfect, E.; Wei, W.; Zhang, Q.; Meng, Q.B. Fractal dimension, lacunarity and succolarity analyses on CT images of reservoir rocks for permeability prediction. J. Hydrol. 2019, 579, 124198. [Google Scholar] [CrossRef]
- Wang, L.C. Research on Fractal Characteristic of Pore Structure and Permeability Model in Sandstone Reservoirs; China University of Petroleum: Beijing, China, 2018. [Google Scholar]
- Nayak, S.R.; Mishra, J.; Palai, G. Analysing roughness of surface through fractal dimension: A review. Image Vis. Comput. 2019, 89, 21–34. [Google Scholar] [CrossRef]
- Panigrahy, C.; Seal, A.; Mahato, N.K.; Bhattacharjee, D. Differential box counting methods for estimating fractal dimension of gray-scale images: A survey. Chaos Solitons Fractals 2019, 126, 178–202. [Google Scholar] [CrossRef]
- Li, W.H.; Lu, S.F.; Xue, H.T.; Zhang, P.F.; Hu, Y. Microscopic pore structure in shale reservoir in the argillaceous dolomite from the Jianghan Basin. Fuel 2016, 181, 1041–1049. [Google Scholar] [CrossRef]
- Loucks, R.G.; Reed, R.M.; Ruppel, S.C.; Jarvie, D.M. Morphology, genesis, and distribution of nanometer-scale pores in siliceous mudstones of the Mississippian Barnett Shale. J. Sediment. Res. 2009, 79, 848–861. [Google Scholar] [CrossRef]
- Sui, W.J.; Tian, Y.Y.; Yao, C.H. Investigation of microscopic pore structure variations of shale due to hydration effects through SEM fixed-point observation experiments. Pet. Explor. Dev. 2018, 45, 955–962. [Google Scholar] [CrossRef]
- Tiwari, P.; Deo, M.; Lin, C.L.; Miller, J.D. Characterization of oil shale pore structure before and after pyrolysis by using X-ray micro CT. Fuel 2013, 107, 547–554. [Google Scholar] [CrossRef]
- Sun, D.L.; Zou, C.N.; Jia, A.L.; Wei, Y.S.; Zhu, R.K.; Wu, S.T.; Guo, Z. Development characteristics and orientation of tight oil and gas in China. Pet. Explor. Dev. 2019, 46, 1015–1026. [Google Scholar] [CrossRef]
- Jia, C.Z.; Zou, C.N.; Yang, Z.; Zhu, R.K.; Chen, Z.X.; Jiang, L. Significant progress of continental petroleum geology theory in basins of Central and Western. Pet. Explor. Dev. 2018, 45, 546–560. [Google Scholar] [CrossRef]
- Zhao, B.; Shang, Y.J. Characterizing connectivity of nano-sized pores of shale based on complex network theory. J. Eng. Geol. 2018, 26, 504–509. [Google Scholar]
Publisher’s Note: MDPI stays neutral with regard to jurisdictional claims in published maps and institutional affiliations. |
© 2022 by the authors. Licensee MDPI, Basel, Switzerland. This article is an open access article distributed under the terms and conditions of the Creative Commons Attribution (CC BY) license (https://creativecommons.org/licenses/by/4.0/).