Article

Research on Mobile Machinery NOx Emission Control Based on a Physical Model and Closed-Loop Control

1
School of Transportation and Vehicle Engineering, Shandong University of Technology, Zibo 255000, China
2
National Engineering Laboratory for Mobile Source Emission Control Technology, Tianjin 300300, China
3
China Automotive Technology & Research Center Co., Ltd., Tianjin 300300, China
4
Zibo Agricultural Machinery Research Institute, Zibo 255086, China
*
Author to whom correspondence should be addressed.
Processes 2022, 10(7), 1374; https://doi.org/10.3390/pr10071374
Submission received: 21 June 2022 / Revised: 12 July 2022 / Accepted: 12 July 2022 / Published: 14 July 2022

Abstract

:
Mobile machinery means a power-driven vehicle that is specifically designed and constructed to perform work on or off the road. To reduce the nitrogen oxide (NOx) emissions that come from mobile machinery, a combination of a physical model and closed-loop control is applied to the selective catalytic reduction (SCR) system. Based on the design of the variable cross-section extended exhaust structure, the differential pressure measurement was achieved, and the physical model of the exhaust flow based on the differential pressure was established. Based on the analysis of the heat and mass transfer process of the SCR catalyst, a prediction model for the internal temperature field of the catalyst was established by combining the upstream and downstream exhaust temperature sensors. Using the SCR downstream nitrogen oxides signal and the proportional–integral–derivative (PID) closed-loop control algorithm, segmented PID closed-loop control under the large hysteresis response of the SCR system was realized. The above algorithms were used to form the control code through MATLAB/Simulink and downloaded to the embedded microprocessor. The test results show that the established model can realize the real-time calculation of the exhaust gas flow rate and the internal temperature of the catalyst. Under steady-state conditions, the calculation error of the exhaust flow rate is less than ±3%, and the calculation error of the catalyst temperature is less than ±5%. Under transient conditions, the calculation error of the exhaust flow rate is less than ±9%, and the calculation error of the catalyst temperature is less than ±8%. The nitrogen–oxygen signal-based PID closed-loop algorithm can improve the nitrogen–oxygen conversion efficiency and control accuracy of the model.

1. Introduction

Mobile pollution sources, also known as mobile machinery, refer to nonstationary pollution sources that emit exhaust gas during the movement process; mainly diesel-powered mechanical devices [1]. In 2019, the amount of nitrogen oxides emitted by road vehicles nationwide was 6.356 million tons, and the NOx emissions from nonroad mobile machinery reached 4.933 million tons in China [2]. Mobile machines are one of the main sources of nitrogen oxide emissions in the transportation sector. The selective catalytic reduction (SCR) of urea is one of the mainstream technologies for the purification of nitrogen oxides from mobile machinery [3]. With the upgrading of emission regulations in China, the nitrogen oxides emissions limit per unit power has been greatly reduced, and the pressure on SCR is increasing. Diesel engines that reach China IV emission regulations require the NOx conversion efficiency to be above 75% [4]. VI emission regulations require a NOx conversion efficiency of between 90 and 95% [5]. The main factors affecting the NOx conversion efficiency of the SCR system are the temperature of the catalyst [6] and the space velocity [7,8], and the high-efficiency temperature window corresponding to different catalysts is also different [9]. Due to the limitations of the system’s structure and cost, the temperature and gas hourly space velocity (GHSV) inside the mobile SCR catalyst after offline measurement cannot be directly measured [10]. Generally, the temperature inside the catalyst is replaced by the weighted calculation of the inlet temperature and the outlet temperature of the catalyst. The variation pattern of the outlet temperature and the inlet temperature is inconsistent, and the weighted average temperature cannot truly reflect the internal temperature of the catalyst [11]. Many researchers have analysed the heat transfer process of the catalyst and established a physical model to predict the temperature of the catalyst, but the effect of vehicle speed on the temperature of the catalyst is not mentioned. The GHSV has a direct impact on the conversion efficiency of the catalyst [12]. The GHSV can be calculated based on the exhaust gas flow rate and the catalyst volume. The exhaust gas flow is generally calculated using the engine speed and displacement, and the calculation accuracy of this method needs to be further improved. With the popularization of the application of nitrogen oxide sensors, the SCR control method has also transitioned from open-loop control to closed-loop control [13], and closed-loop control using a downstream nitrogen oxides signal has been applied in SCR systems [14]. Because the SCR system has a relatively large delay on the time scale [15] and the working scenario of the mobile machinery has changed, the direct use of a single PID closed-loop control will lead to the periodic oscillation of the system [16], and a new closed-loop control method must be adopted [17,18].
In this paper, a pressure difference-based exhaust gas flow calculation model was established based on the gas flow equation to improve the calculation accuracy of the GHSV. Based on the heat transfer process of the SCR catalyst, a physical model of the temperature field of the catalyst was established, and a correction factor based on the vehicle speed was designed according to the actual operating characteristics of the mobile machinery. The segmented PID closed-loop control with a large hysteresis response is designed based on the downstream nitrogen oxides signal to form a control strategy based on the physical model and the closed-loop control. The above algorithms were all generated by MATLAB/Simulink to generate the embedded code of the single-chip microcomputer, and the algorithm was verified through the whole vehicle.

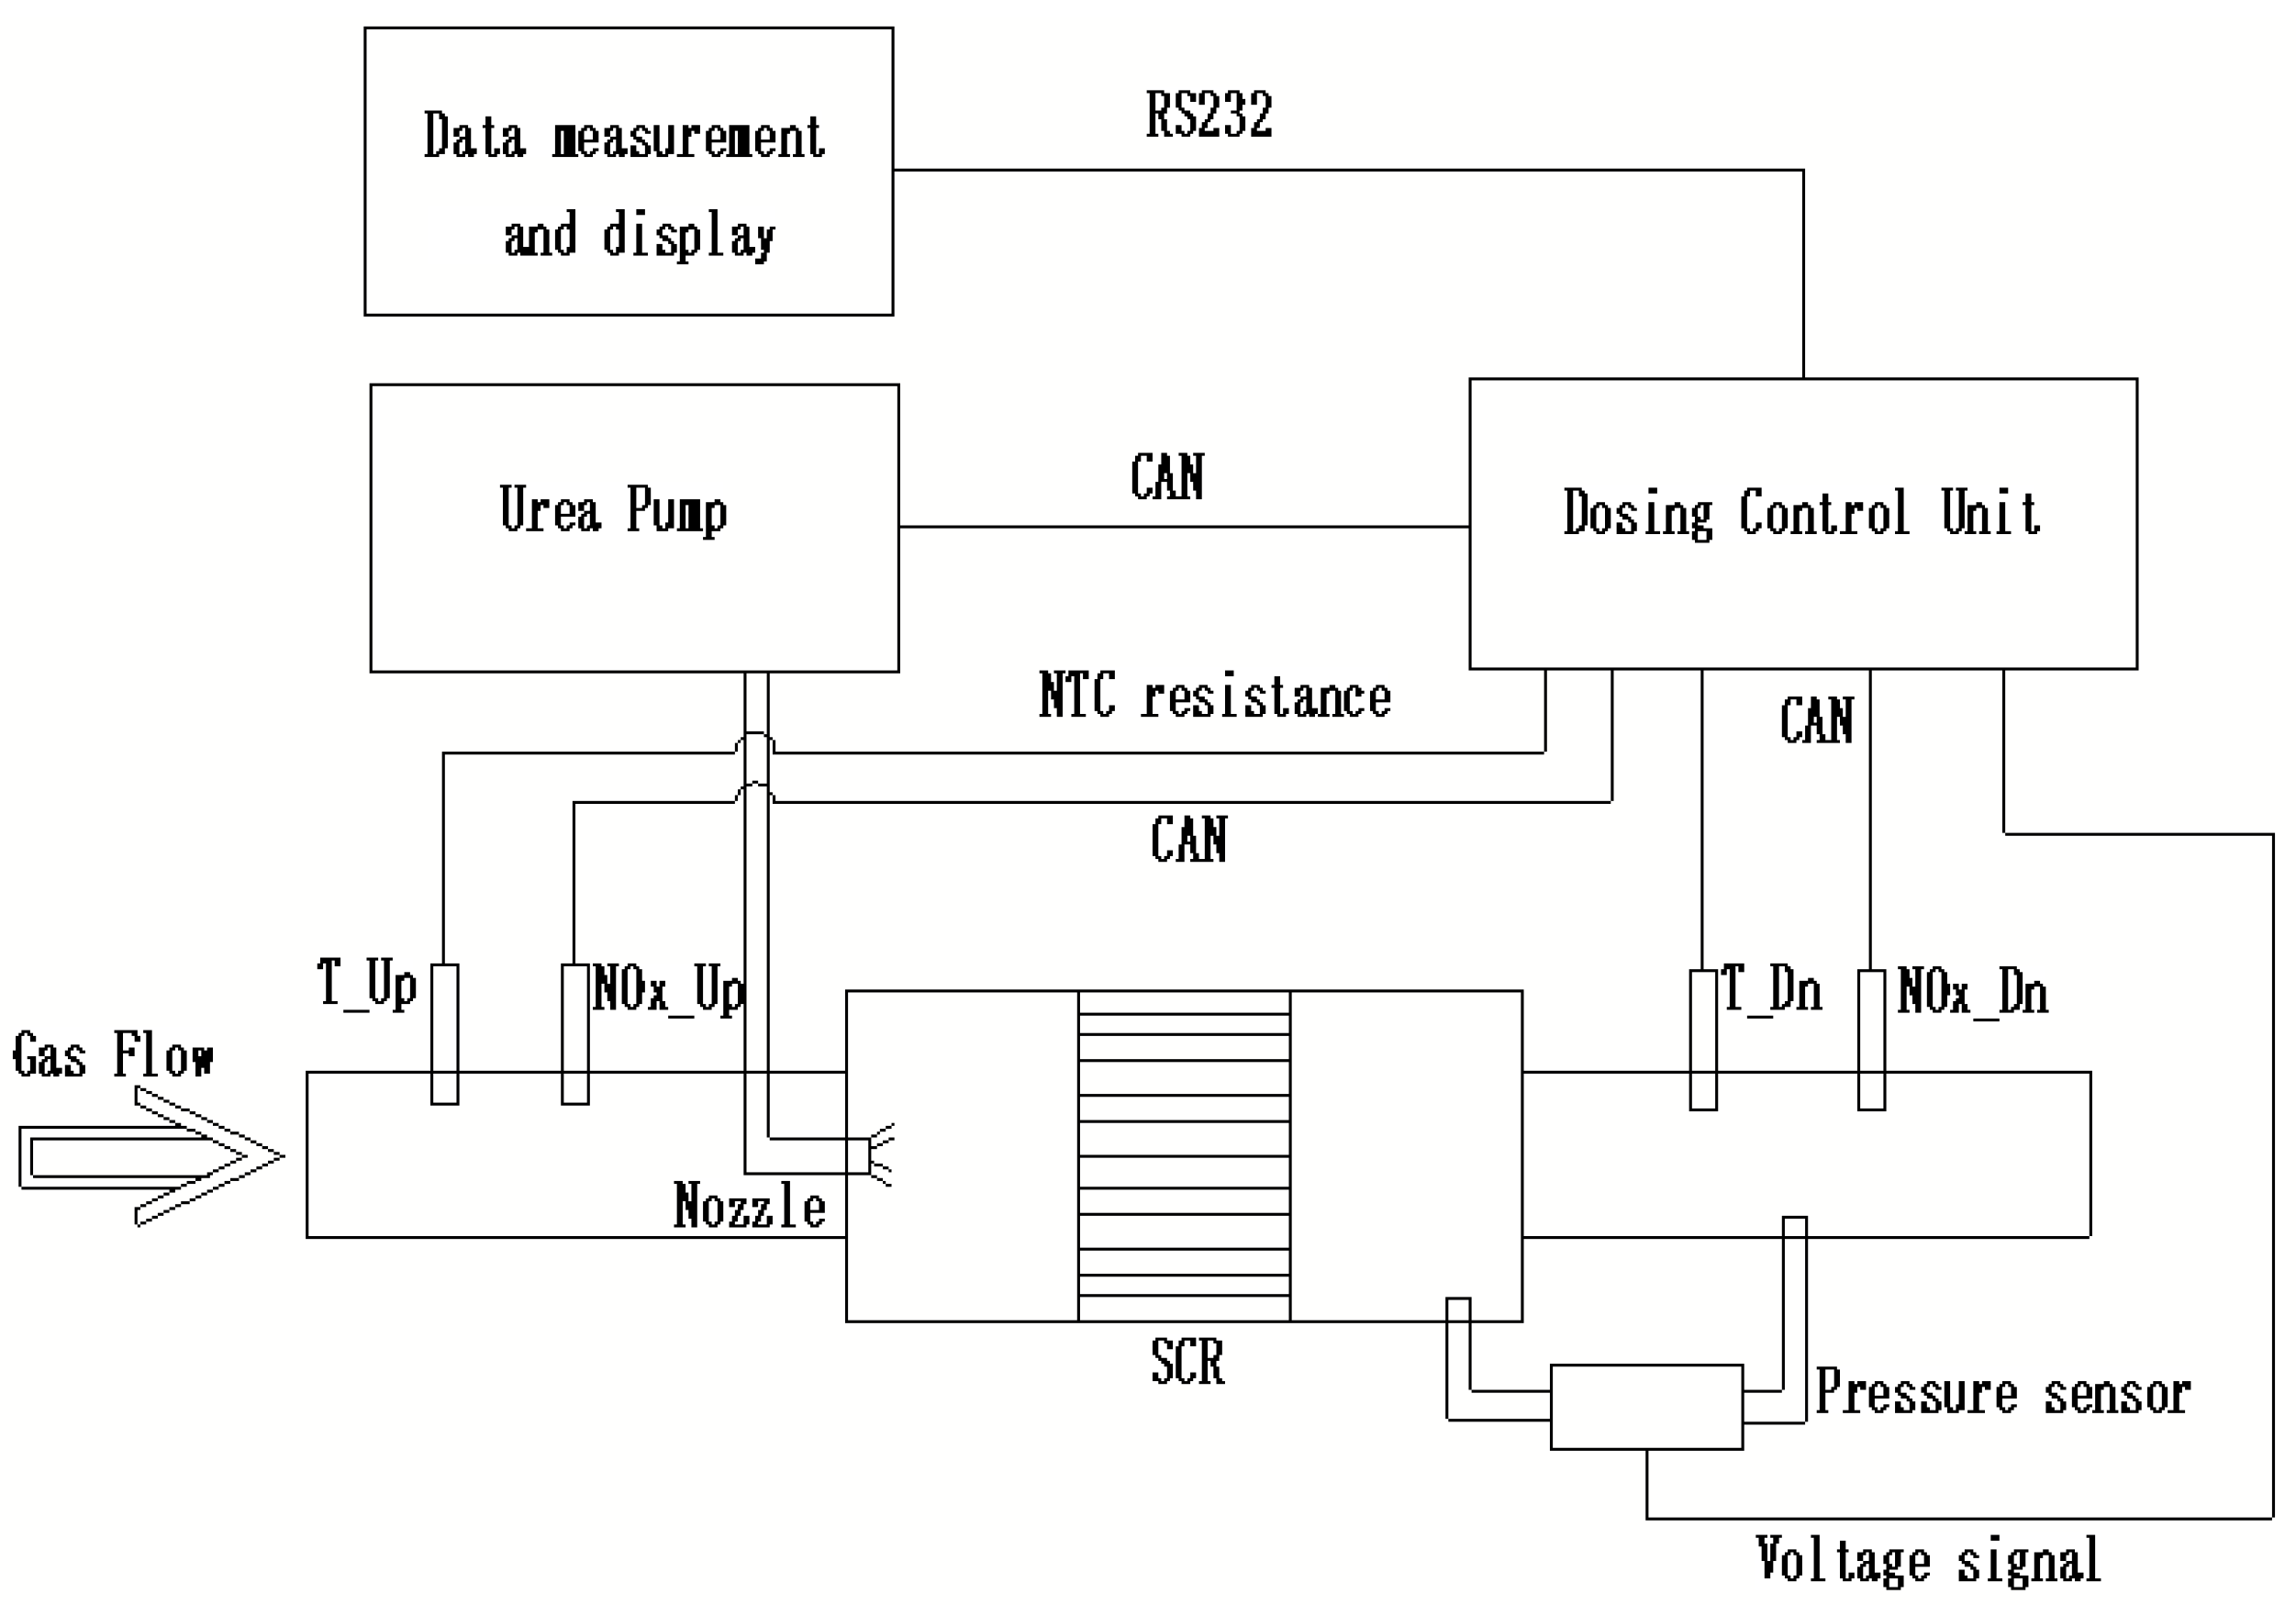
2. Scheme and Experimental Design

The experimental system is used mainly to test the calculation accuracy of the physical model and the closed-loop control effect. Figure 1 shows a schematic diagram of the test principle. An exhaust temperature sensor and a nitrogen–oxygen sensor were installed before and after the catalytic converter to measure the exhaust gas temperature and nitrogen–oxygen concentration at the inlet and outlet of the SCR. In addition, a variable cross-section structure was designed at the end of the catalytic reaction, and a differential pressure sensor was installed to calculate the exhaust gas flow rate based on this structure. The emitec urea injection system was used, which consists of dosing pump unit, electronic control unit, urea tank, air tank, pipeline, urea injector nozzle, and sensors. Before the experiment, the control algorithm was downloaded to the urea injection control unit. The control unit used the upstream exhaust temperature, exhaust gas flow rate, ambient temperature, and catalyst parameters to perform comprehensive calculations to obtain the temperature of the catalyst.
This control system mainly implements the functions of the urea metering injection and monitoring display. Therefore, the composition of the system includes a set of urea injection control systems and a set of display terminals, which are used for data transmission through universal synchronous receiver transmitters (RS232). The urea metering injection system mainly includes a controller, a urea pump, an SCR reaction box, an upstream and downstream exhaust temperature sensor, an upstream and downstream nitrogen oxides sensor, a differential pressure sensor, a display module, and a connecting wiring harness. The whole vehicle experiment mainly used a heavy truck loading test, and the heavy truck load was 42 tons. Through this experiment, the calculation accuracy of the model was tested and analysed. The SCR used a vanadium-based catalyst, and the exhaust gas analyser was NOx/NH3 5240 analyser manufactured by ECM.

3. Physical Model and Classical Control Algorithm

The selective catalytic reduction system is one of the main technical routes to reducing nitrogen signals emissions for mobile machinery. When offline, it is difficult to retrofit mobile machinery to obtain exhaust flow signal. The exhaust gas flow rate and the exhaust gas temperature inside the catalyst are the key parameters of the SCR catalytic reaction. Therefore, in this paper, the exhaust gas temperature of the mobile source vehicle and the pressure difference of the SCR catalyst were collected through the sensor, and the exhaust flow rate was calculated by combining the dimensional parameters of the SCR catalyst. The exhaust gas flow rate was combined with the upstream nitrogen oxides of the SCR to calculate the required amount for urea injection. Then, the temperature inside the catalytic reaction was calculated using the basic theory of heat and mass transfer in the catalytic reaction. The amount of urea injection was corrected according to the temperature conditions inside the catalytic reaction box and the characteristics of the catalyst. All the above steps require a high degree of participation of the electronic control system to complete; otherwise, unreasonable urea injection will lead to substandard nitrogen oxides emission or urea crystallization. To improve the calculation accuracy of the exhaust flow rate and catalyst temperature, a physical model and a mathematical model were established, and, finally, an executable control code for the controller was formed.

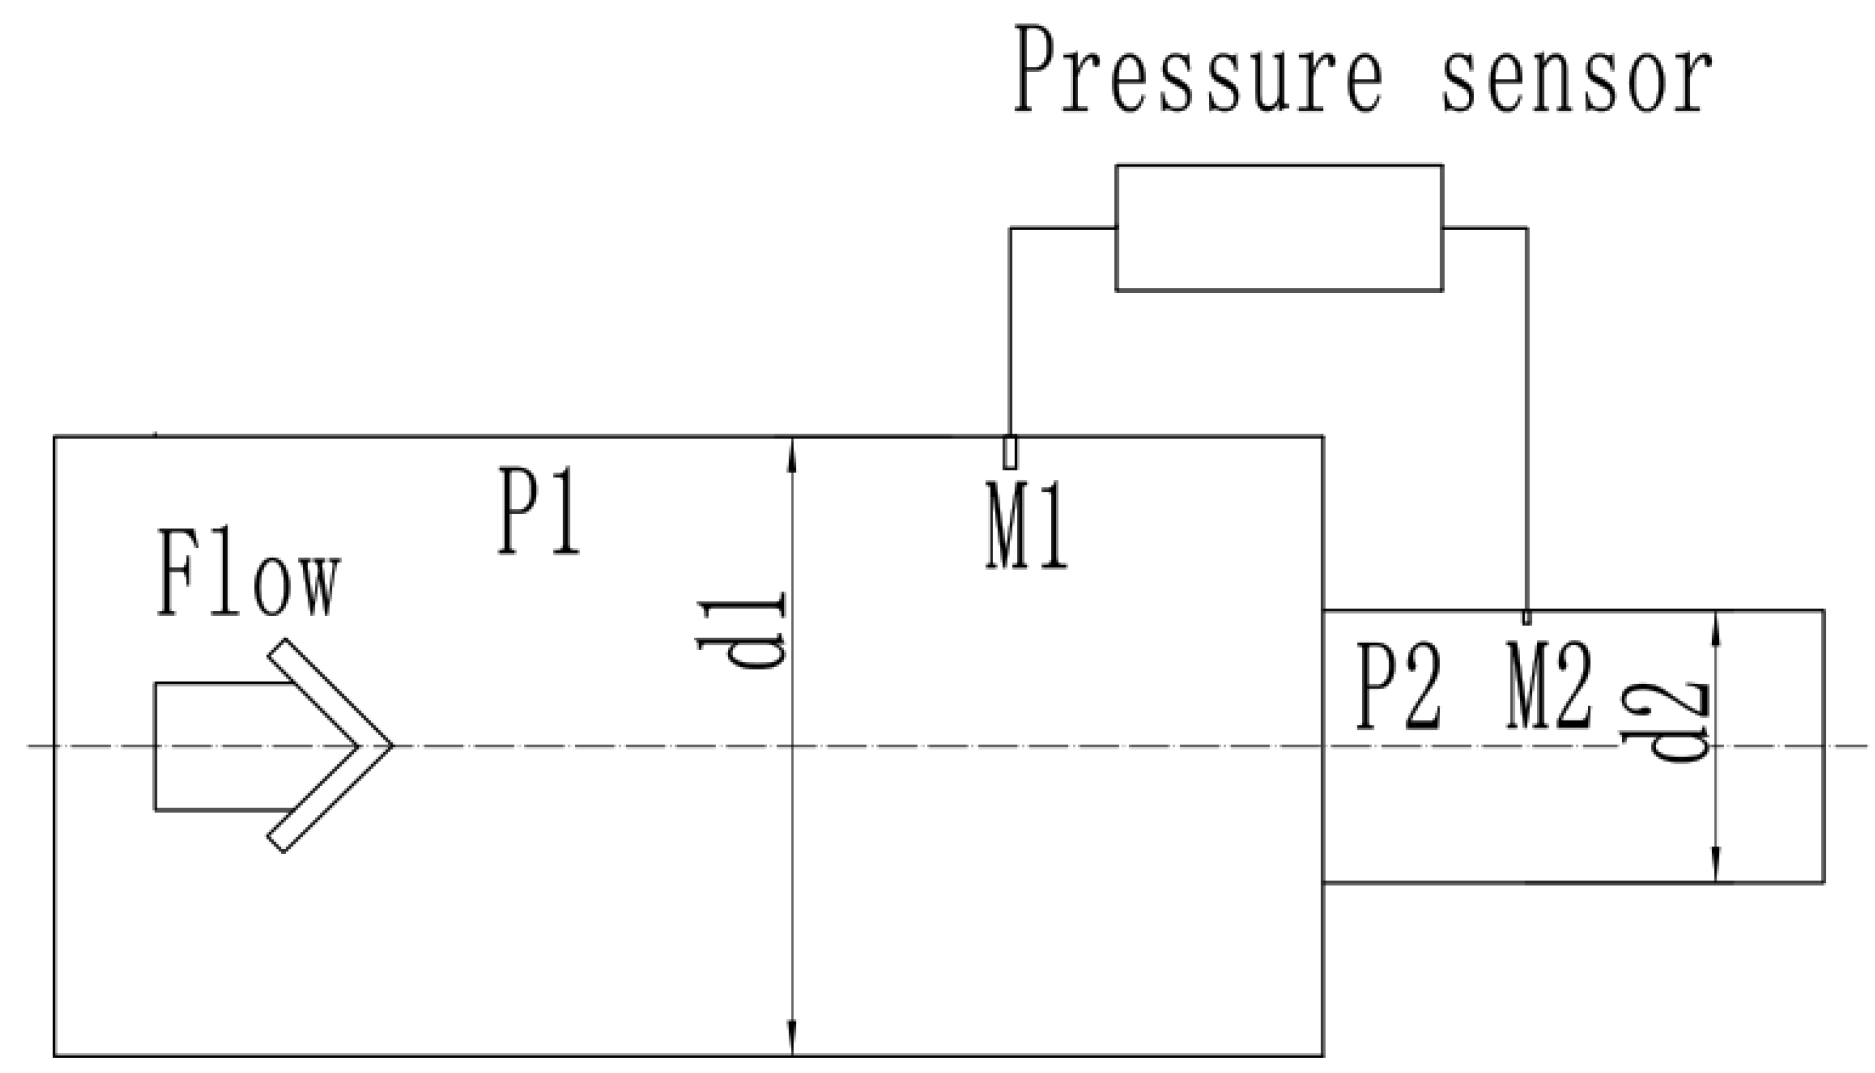
3.1. Calculation of Exhaust Flow Based on Differential Pressure

Differential pressure is a key parameter for calculating exhaust gas flow. Figure 2 shows a schematic diagram of the differential pressure measurement. Based on the structural design of the catalytic reaction box and the differential pressure sensor data, the exhaust flow can be calculated. In the design of the scheme, the variable cross-section characteristics of the catalytic reaction box were directly used to obtain the exhaust gas flow rate by measuring the pressure difference.
In addition, the calculated theoretical exhaust flow rate also needs to be corrected by the temperature signal, the physical model is abstracted into a mathematical model, and the calculation of the exhaust flow rate is achieved through simulation. The calculation method is shown in Equations (1)–(7). The Bernoulli Equation (1) for the variable cross-section pipeline is established. According to the gas mass density equations, the gas mass flow rate (2) can be calculated. The SCR catalytic reaction box was installed horizontally, so the gravitational potential energy of the gas is ignored. In addition, the size before and after the variable cross-section is sufficient for the gas flow, and the gas density is assumed to be the same. Based on the above assumptions, Equations (1) and (2) are combined to obtain the differential pressure Equation (3). Further simplification and considering the geometric dimensions of differential pressure sampling point 1 and sampling point 2, Equation (5) was obtained. Finally, the required exhaust gas flow rate Equation (7) can be obtained so that the exhaust gas flow rate can be calculated according to the size, pressure difference, and gas density of the catalytic reaction box.
P 1 + 1 2 ρ 1 v 1 2 + ρ 1 g h 1 = P 2 + 1 2 ρ 2 v 2 2 + ρ 2 g h 2
m = ρ 1 s 1 v 1 = ρ 2 s 2 v 2
Δ P = P 1 P 2 = m 2 2 ρ ( 1 s 2 2 1 s 1 2 )
m 2 = 2 ρ Δ P 1 s 2 2 1 s 1 2
m 2 = π 2 8 ρ Δ p d 1 4 d 2 4 d 1 4 d 2 4
dm = 3600 m 2
dm = 36 π d 1 2 d 2 2 ρ Δ p 1250 ( d 1 2 + d 2 2 ) ( d 1 2 d 2 2 )
where P1 is the static pressure at measuring point 1 of the differential pressure sensor, in units of Pa; P2 is the static pressure at measuring point 2 of the differential pressure sensor, in units of Pa; ρ 1 is the gas density at measuring point 1 of the differential pressure sensor, in units of kg/m3; ρ 2 is the gas density at measuring point 2 of the differential pressure sensor, in units of kg/m3; s 1 is the cross-sectional area of gas flow at measuring point 1 of the differential pressure sensor, in units of m2; s 2 is the cross-sectional area of gas flow at measurement point 2 of the differential pressure sensor, in units of m2; v 1 is the gas flow rate at measuring point 1 of the differential pressure sensor, in units of m/s; v 2 is the gas flow rate at measuring point 2 of the differential pressure sensor, in units of m/s; d 1 is the diameter of the gas flow cross-section at measuring point 1 of the differential pressure sensor, in units of m; d 2 is the diameter of the gas flow cross-section at measuring point 2 of the differential pressure sensor, in units of m; m is the gas mass flow rate per unit time, in units of kg/s; dm is the exhaust gas flow rate, in units of kg/h.

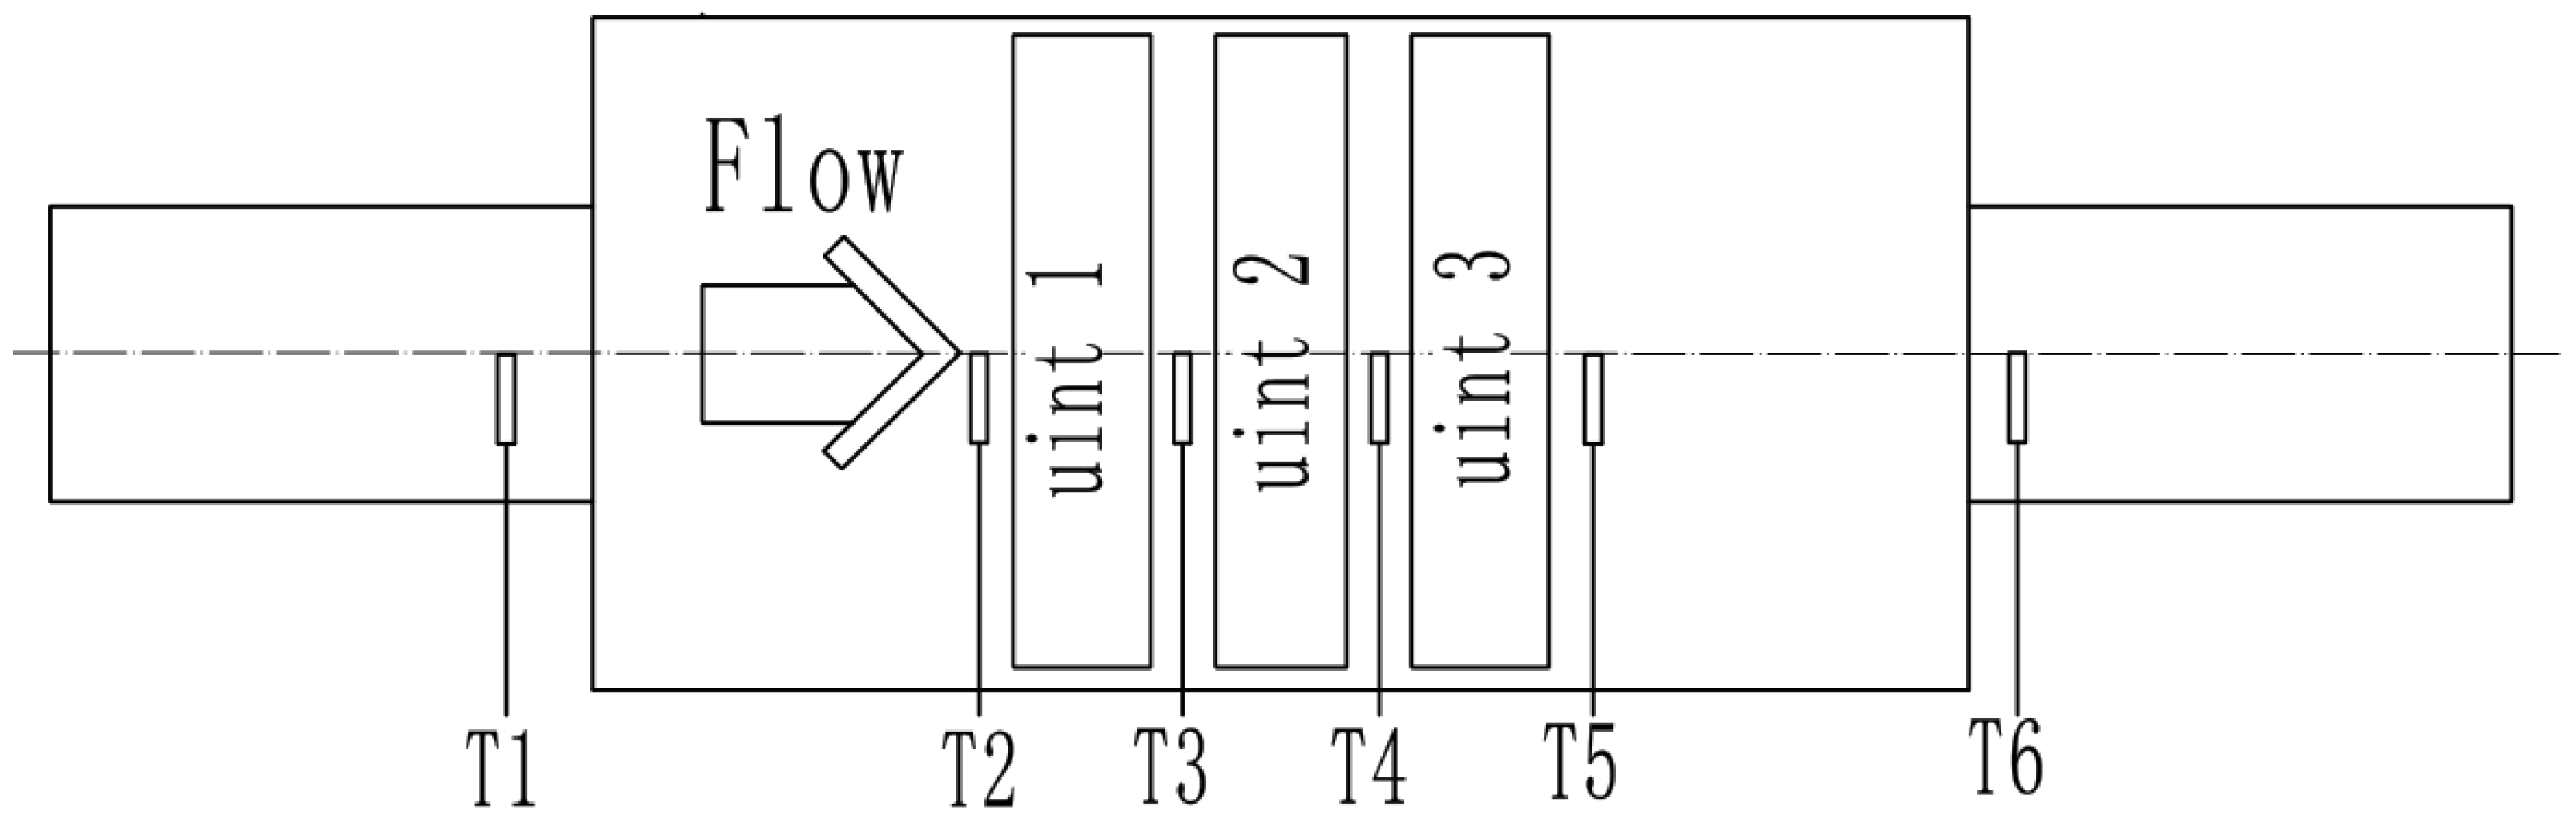
3.2. Calculation of the Internal Temperature of the Catalytic Converter

The internal carrier of the SCR catalyst carries the SCR catalyst, which plays a key role in the reaction rate of NOx and NH3. The temperature inside the catalyst is critical to the activity of the catalyst, and it is generally difficult to place the temperature sensor inside the catalyst. In this paper, the temperature inside the catalyst was calculated using the upstream and downstream temperature sensors of the SCR, the exhaust gas flow rate, and the SCR structural parameters. The carrier of the SCR catalyst is a porous medium structure, and the carrier and the exhaust gas need to be treated as a whole. Based on the energy conservation equation, the catalyst is divided into three equal parts along the airflow direction, which is named unit1, unit2, and unit3.The heat transfer equations for each part of the catalyst are established in turn. Figure 3 shows a schematic diagram of the temperature field structure of the catalytic converter, in which T1 is the temperature measured by the upstream temperature sensor, T6 is the temperature measured by the downstream temperature sensor, T2, T3, and T4 are the calculated temperatures at the inlet of the three stages of the carrier, respectively, and T5 is the calculated temperature at the outlet of the three-stage carrier.
When modelling the temperature field, the temperature model is simplified to apply it to the embedded system, and T2 is calculated based on T1. By analysing the structure of the SCR catalyst, this part can be seen as a hollow pipe, and T2 is directly calculated using the law of thermodynamics.
T 2 = T 1 h a m b ( T 1 T a m b ) c P m g
where T 1 is the measured value of the upstream exhaust temperature sensor of the SCR, in units of K. T 2 is the inlet temperature of the SCR catalyst, in units of K. h a m b is the heat transfer coefficient, in units of W/(m2·K). T a m b is the ambient temperature in K, and c P is the constant pressure specific heat of the catalytic reaction box, in units of J/kg. m g is the mass of exhaust gas, in units of kg.
Based on calculating T2, we can further use the energy conservation equation to calculate T3 and then obtain the calculated temperature at the positions of T4, T5, and T6 by analogy. T2, T3, T4, and T5 will be used by Equations (9)–(12). Taking the three calculation units of the catalytic reaction box as the object, the change in the system energy of each unit is affected mainly by the following factors: the heat difference between the inlet and outlet gases, the heat conduction of the catalyst carrier, the heat release from the chemical reaction, and the radiation heat release. Since the effect of the heat transfer of the catalyst carrier and the heat release of the chemical reaction on the system are small, they are ignored. The heat difference between the inlet and outlet of the catalyst calculation unit is
Δ E g = C pg m g ( T g , in T g , out )
The radiation exothermic energy equation is
Δ E rad = f ε σ A a ( T s 4 T amb 4 )
The increased internal energy is
Δ E = m s c p g T g t
The above equations are combined to obtain the expression
m s c P g T g t = c P g m ˙ g ( T g , i n T g , o u t ) f ε σ A a ( T s 4 T a m b 4 )
where ΔEg is the energy difference caused by the gas at the inlet and outlet of the catalyst in J/s, and c P g is the constant pressure specific heat of the catalytic reaction box in J/kg·K; mg is the mass of the exhaust gas in kg; Tg,in and T g , o u t are the upstream temperature and downstream temperature of the catalyst, respectively, in K; Δ E rad is the radiative heat release in J/s; f is a correction factor based on vehicle speed, which needs to be calibrated according to vehicle speed; ε is the emissivity of the catalyst; σ is the Stephan Boltzmann constant in W/(m2·K4); A a is the thermal radiation surface area of the catalyst, in m2; T s is the temperature of the catalyst, in K; T a m b is the ambient temperature in K.

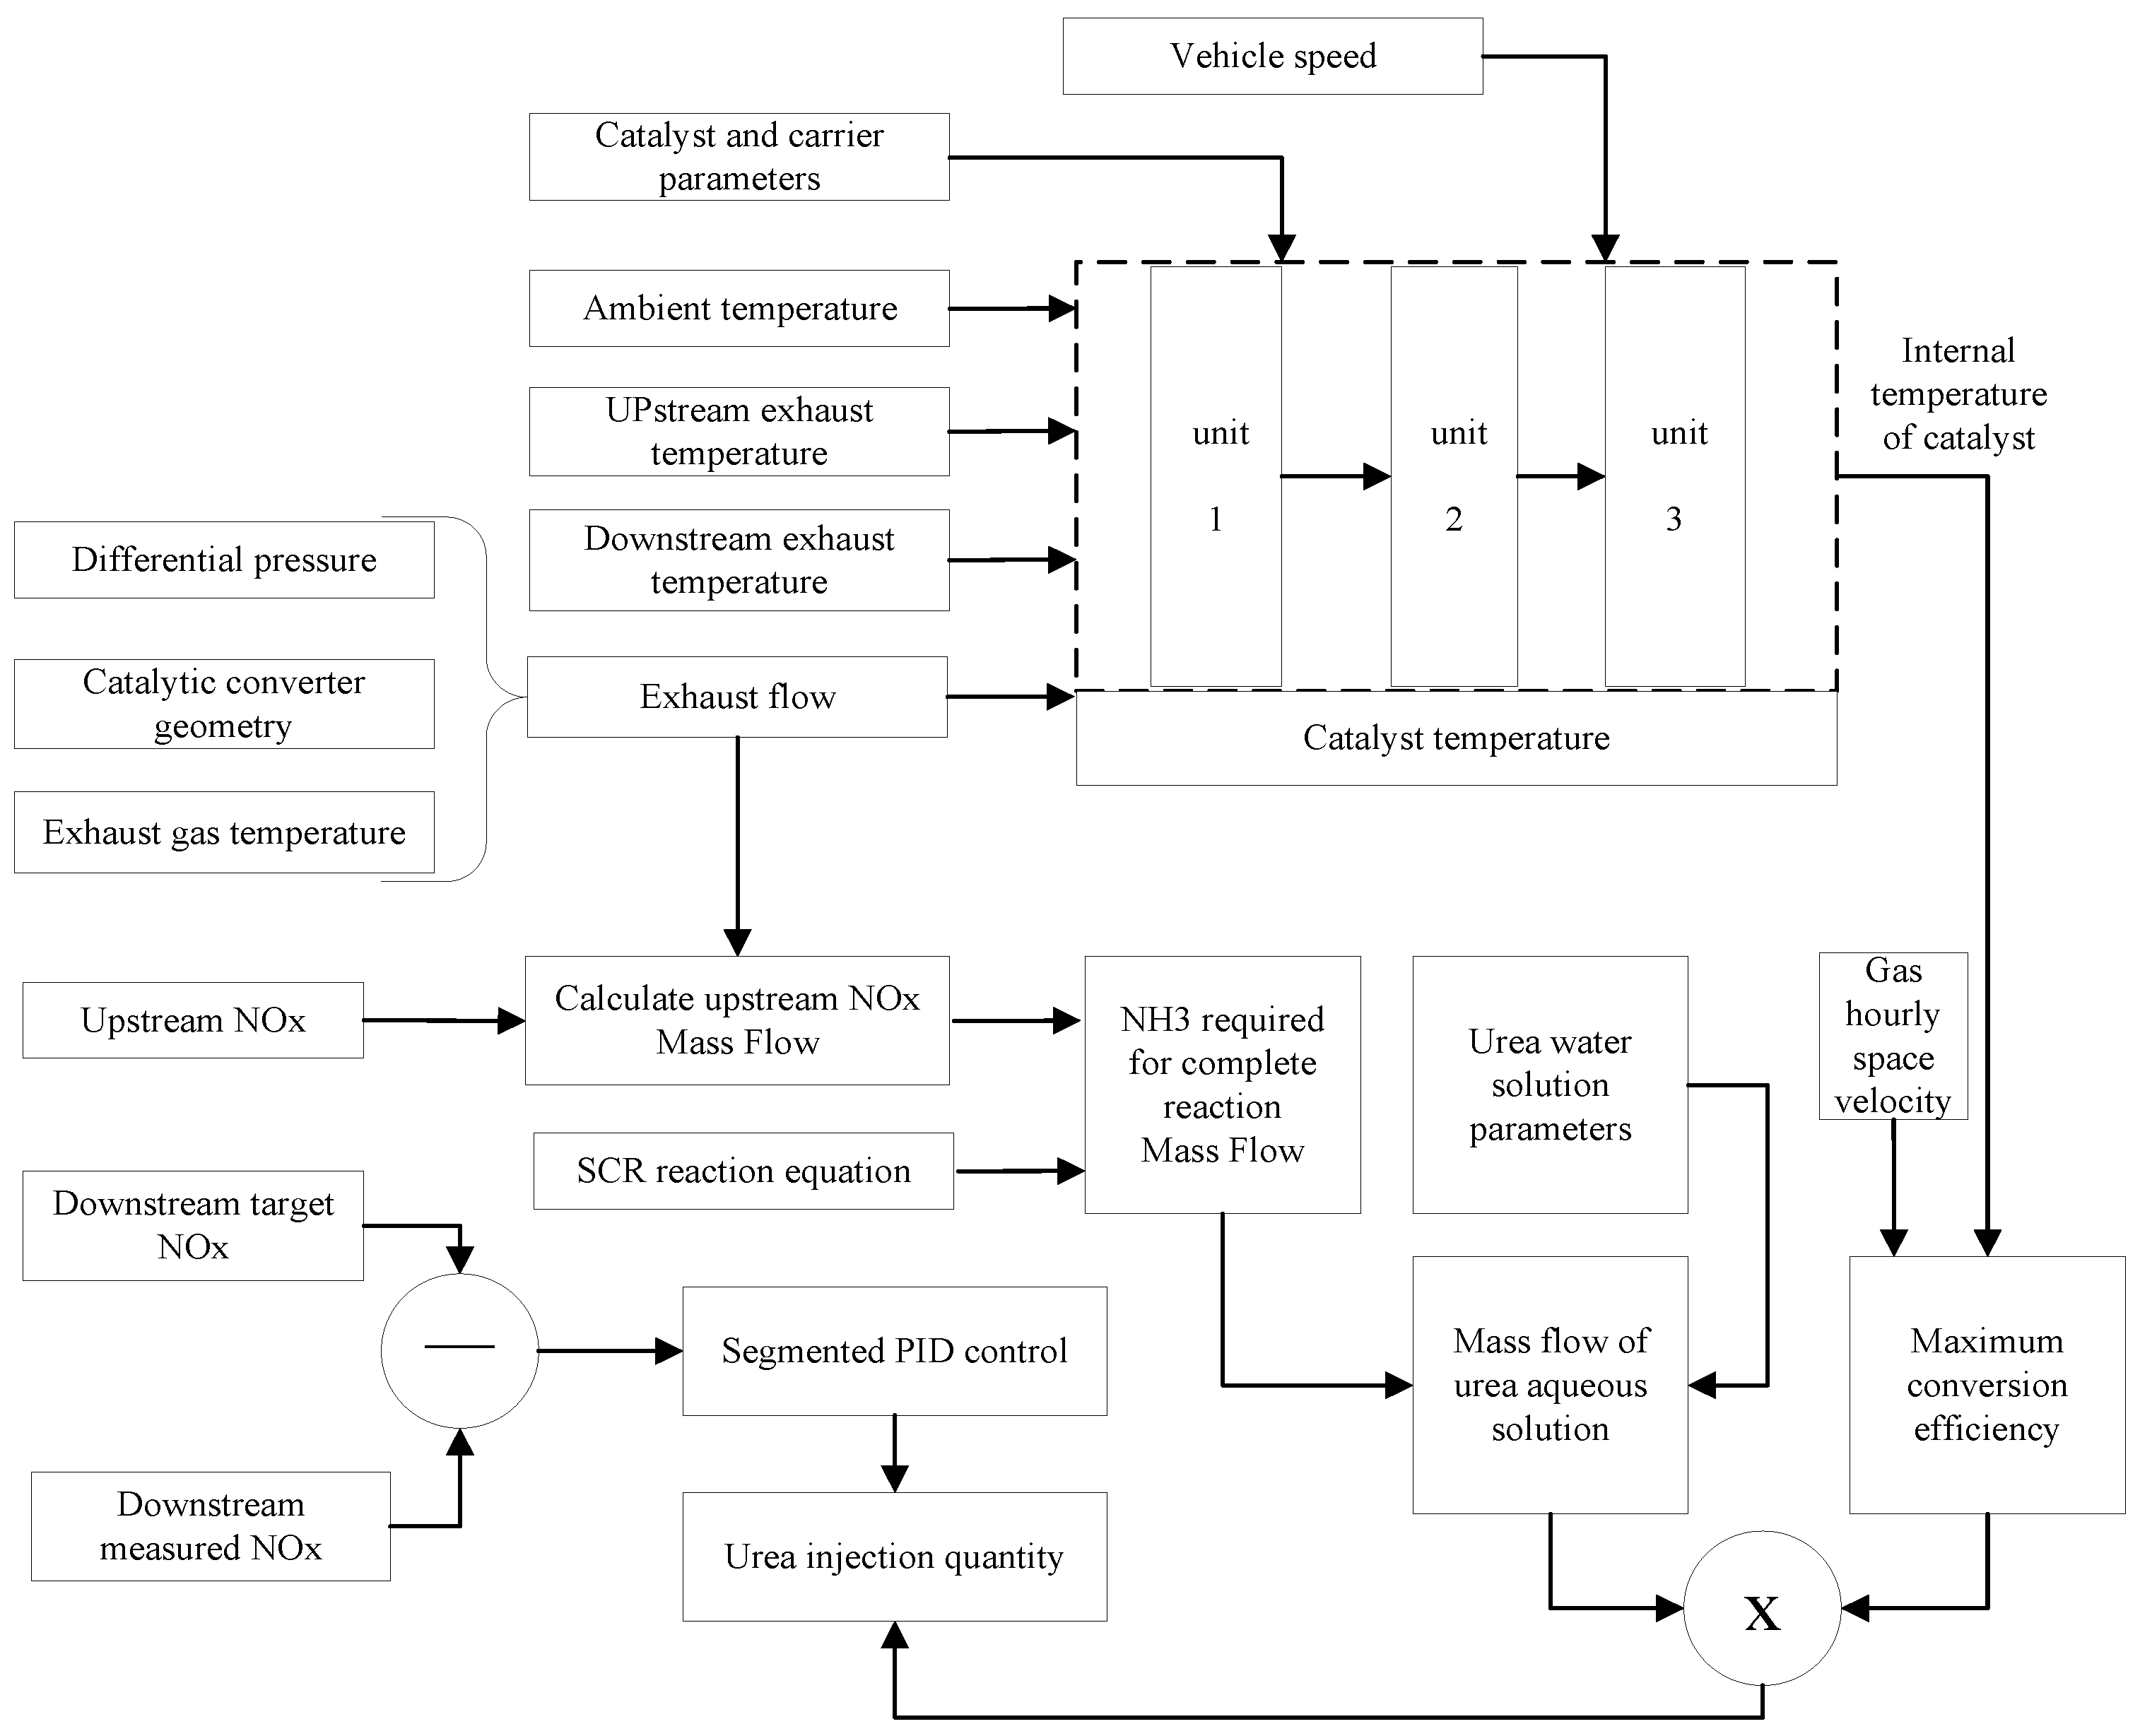
3.3. Closed-Loop Control Method

Due to the presence of ammonia storage characteristics of the catalyst in the SCR system, there is a certain time difference between the change in the amount of urea injected and the change in the downstream nitrogen oxide concentrations under steady-state conditions. Due to this feature of the SCR system, the use of the upstream and downstream NOx signals to carry out closed-loop control easily leads to the phenomenon of large hysteresis overshoot in the system. However, when ammonia storage reaches a certain level and the catalytic reaction box is working in the high-efficiency temperature window, the catalytic reaction speed is accelerated, and segmented PID closed-loop control can be used at this time. Since the speed of the catalytic reaction is variable in different temperature windows, the PID parameters can be adjusted accordingly to adapt to the SCR reaction rate. In view of the above characteristics, this paper adopts the segmented integral PID closed-loop control strategy based on the combination of the temperature window and control error. For the high-temperature stage, the amount of ammonia stored is small, the catalytic reaction rate is high, and the integral coefficient takes a large value, which accelerates the control feedback speed. For the low-temperature stage, there is no catalytic conversion efficiency at all, and the value of the integral coefficient is zero at this time. When the temperature is in the low efficiency working range of the catalytic reaction, the value of the integral coefficient is small, which reduces the control feedback speed. In this paper, the stepwise integral PID control method based on the temperature window and control error and the integral stepwise correction coefficient is as follows
y ( t ) = K p e ( t ) + K I Fac e ( t ) dt + K D ( e ( t ) e ( t 1 ) )
c = { 0   T Rec 210   ° C 0.2   210   ° C < T Rec < 250   ° C 1.2   T Rec 250   ° C
where y(t) is control parameter of PID outputting. e(t) is the control deviation of the downstream nitrogen oxide concentrations at time t, which is subtracted from the measured value from the set value. K p is the proportional coefficient of PID control. K I is the integral coefficient of PID control. K D is the differential coefficient of PID control. Fac is the integral correction coefficient based on the internal temperature of the catalyst.

3.4. Closed-Loop Control Method

According to the control model derived from the above physical model and classical control algorithm, the control model of each functional module is established using MATLAB/Simulink. For the exhaust flow model, the calculation equations from differential pressure to flow strictly follows. For the temperature field model, the characteristics of the catalyst were fully considered in the modelling process, and the temperature model of three single catalyst units was established, in which the outlet temperature of the first carrier was the inlet temperature of the second carrier. The mass flow rate of NOx was calculated using the upstream NOx concentration and the exhaust gas flow rate. Finally, the segmented PID closed-loop control algorithm was used to correct the urea injection volume, thereby forming a complete control strategy. Figure 4 shows the control strategy of the SCR system, which includes a differential pressure-based exhaust flow calculation model, a three-stage catalytic converter temperature calculation model, and a NOx-based segmented PID closed-loop control model.
The control algorithm established through MATLAB/Simulink cannot be directly downloaded to the single-chip microcomputer. It is necessary to use the MATLAB Real-Time Workshop (RTW) tool to generate the compilable C code, which is then compiled in the CodeWarrior environment and downloaded to the single-chip microcomputer.

4. Discussion

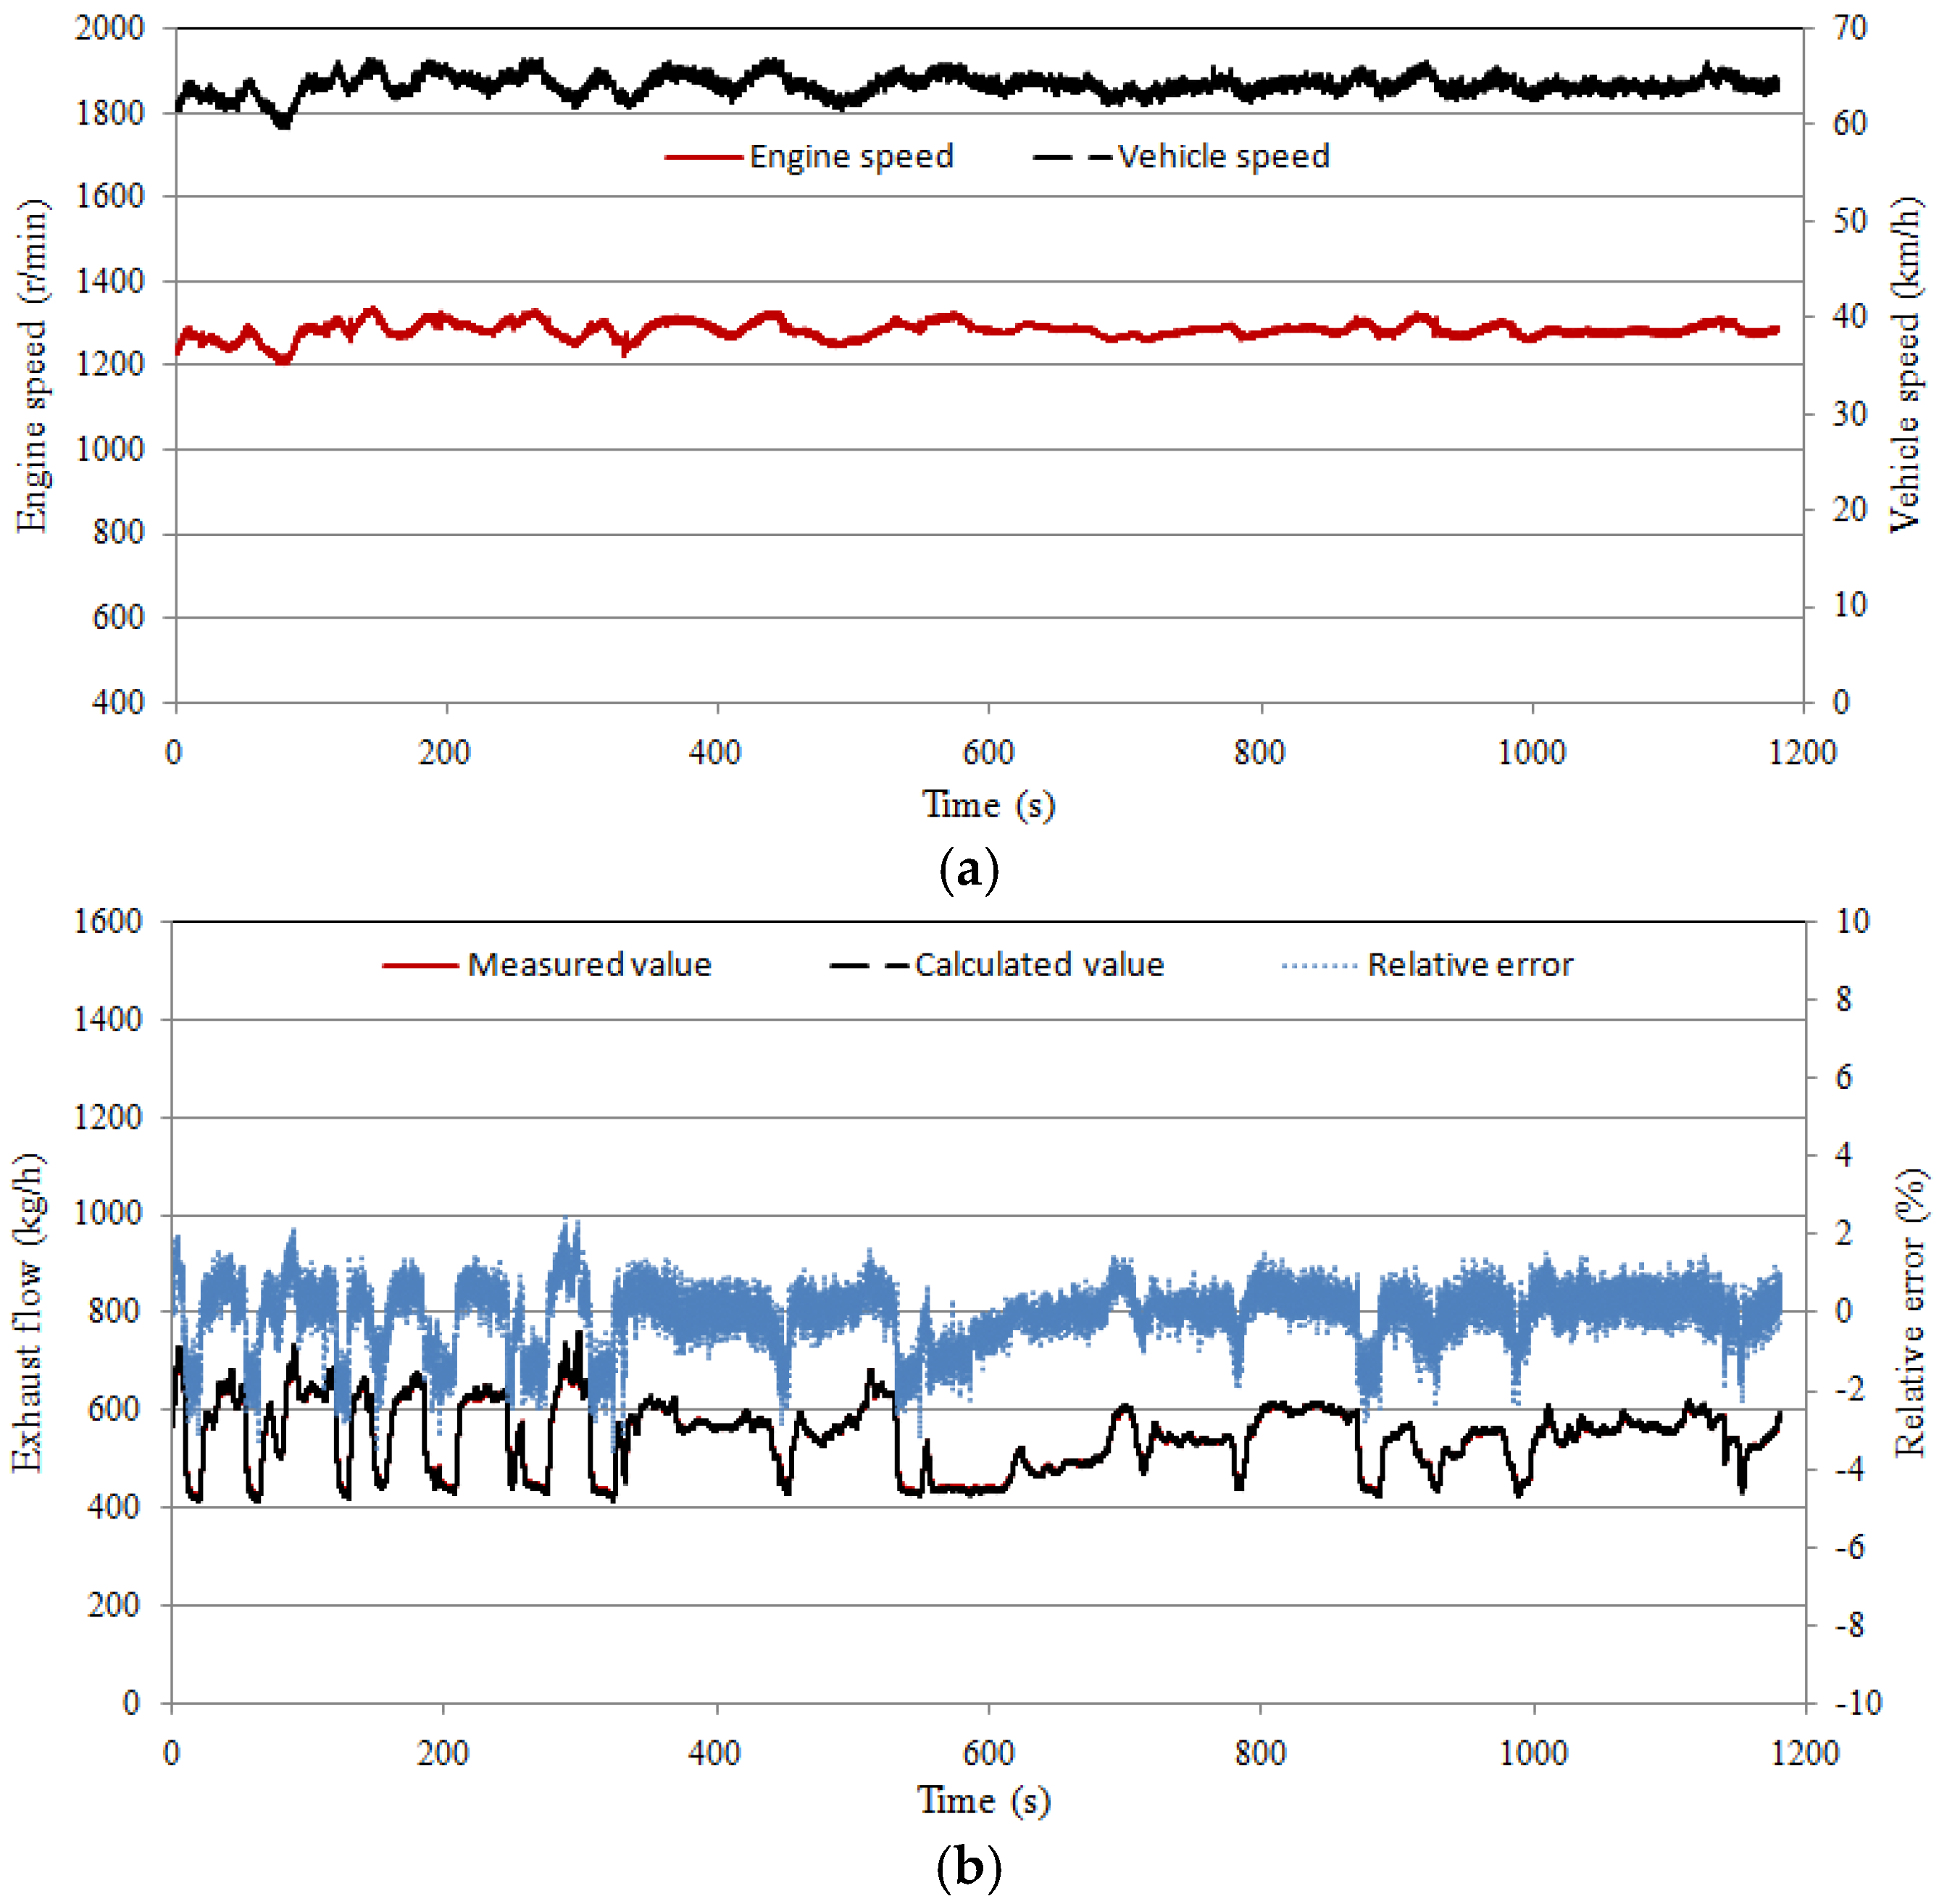
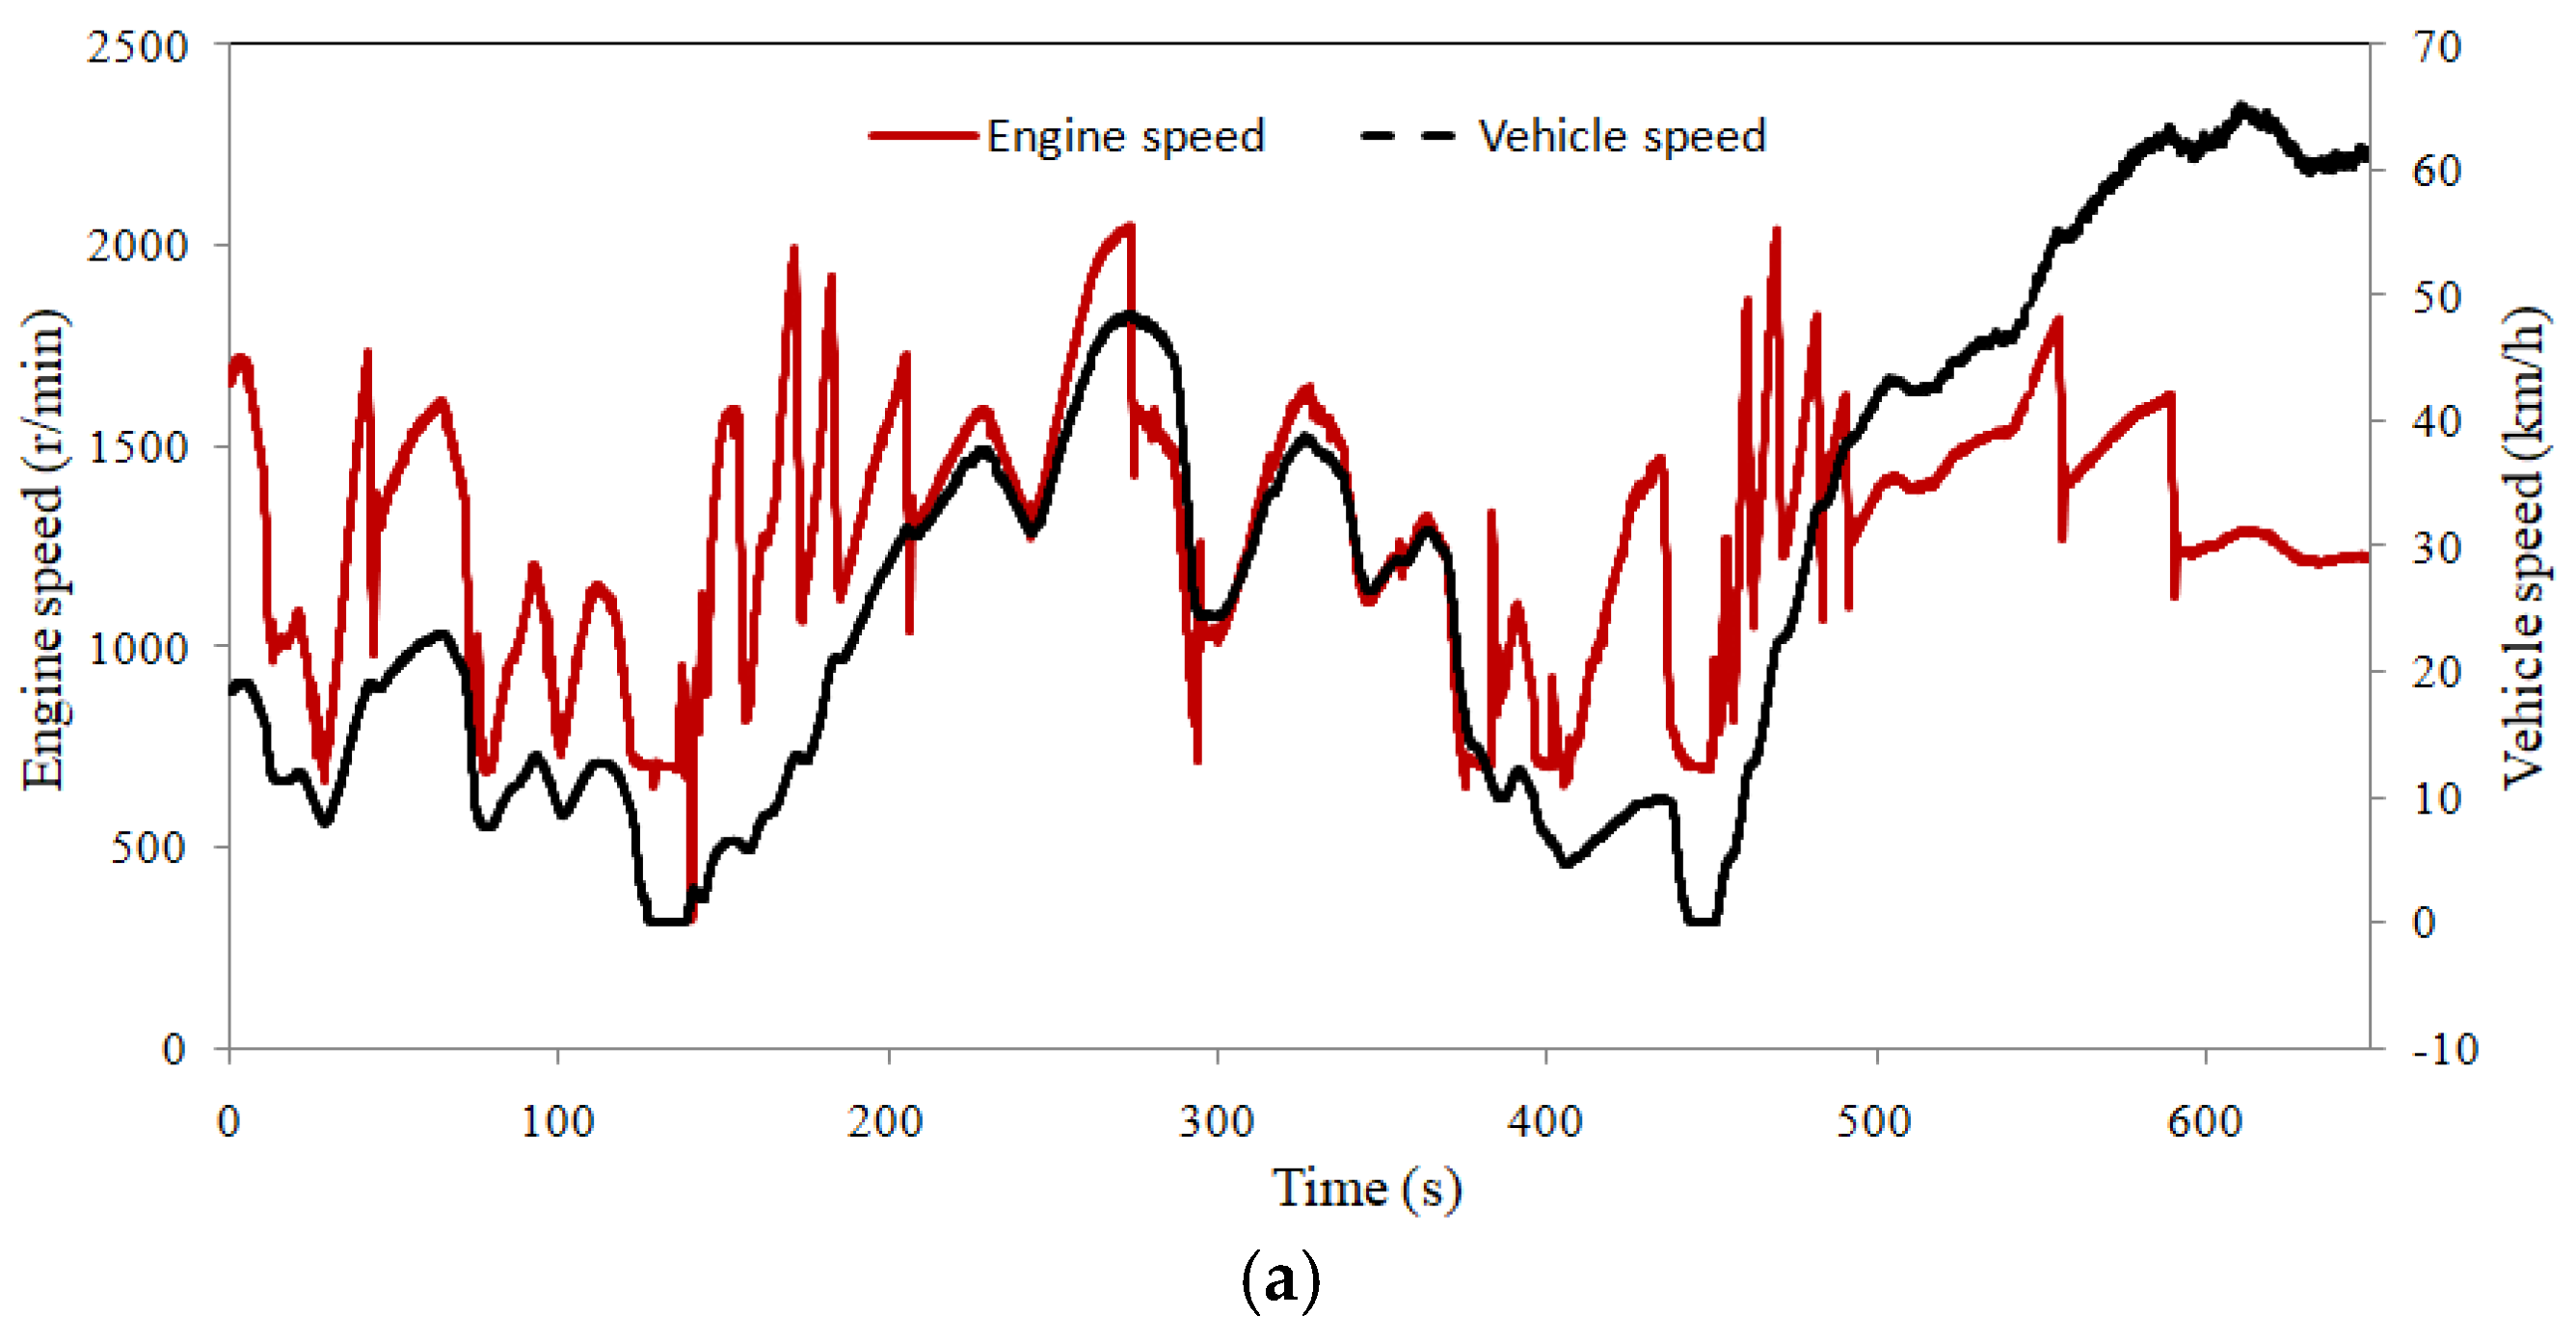
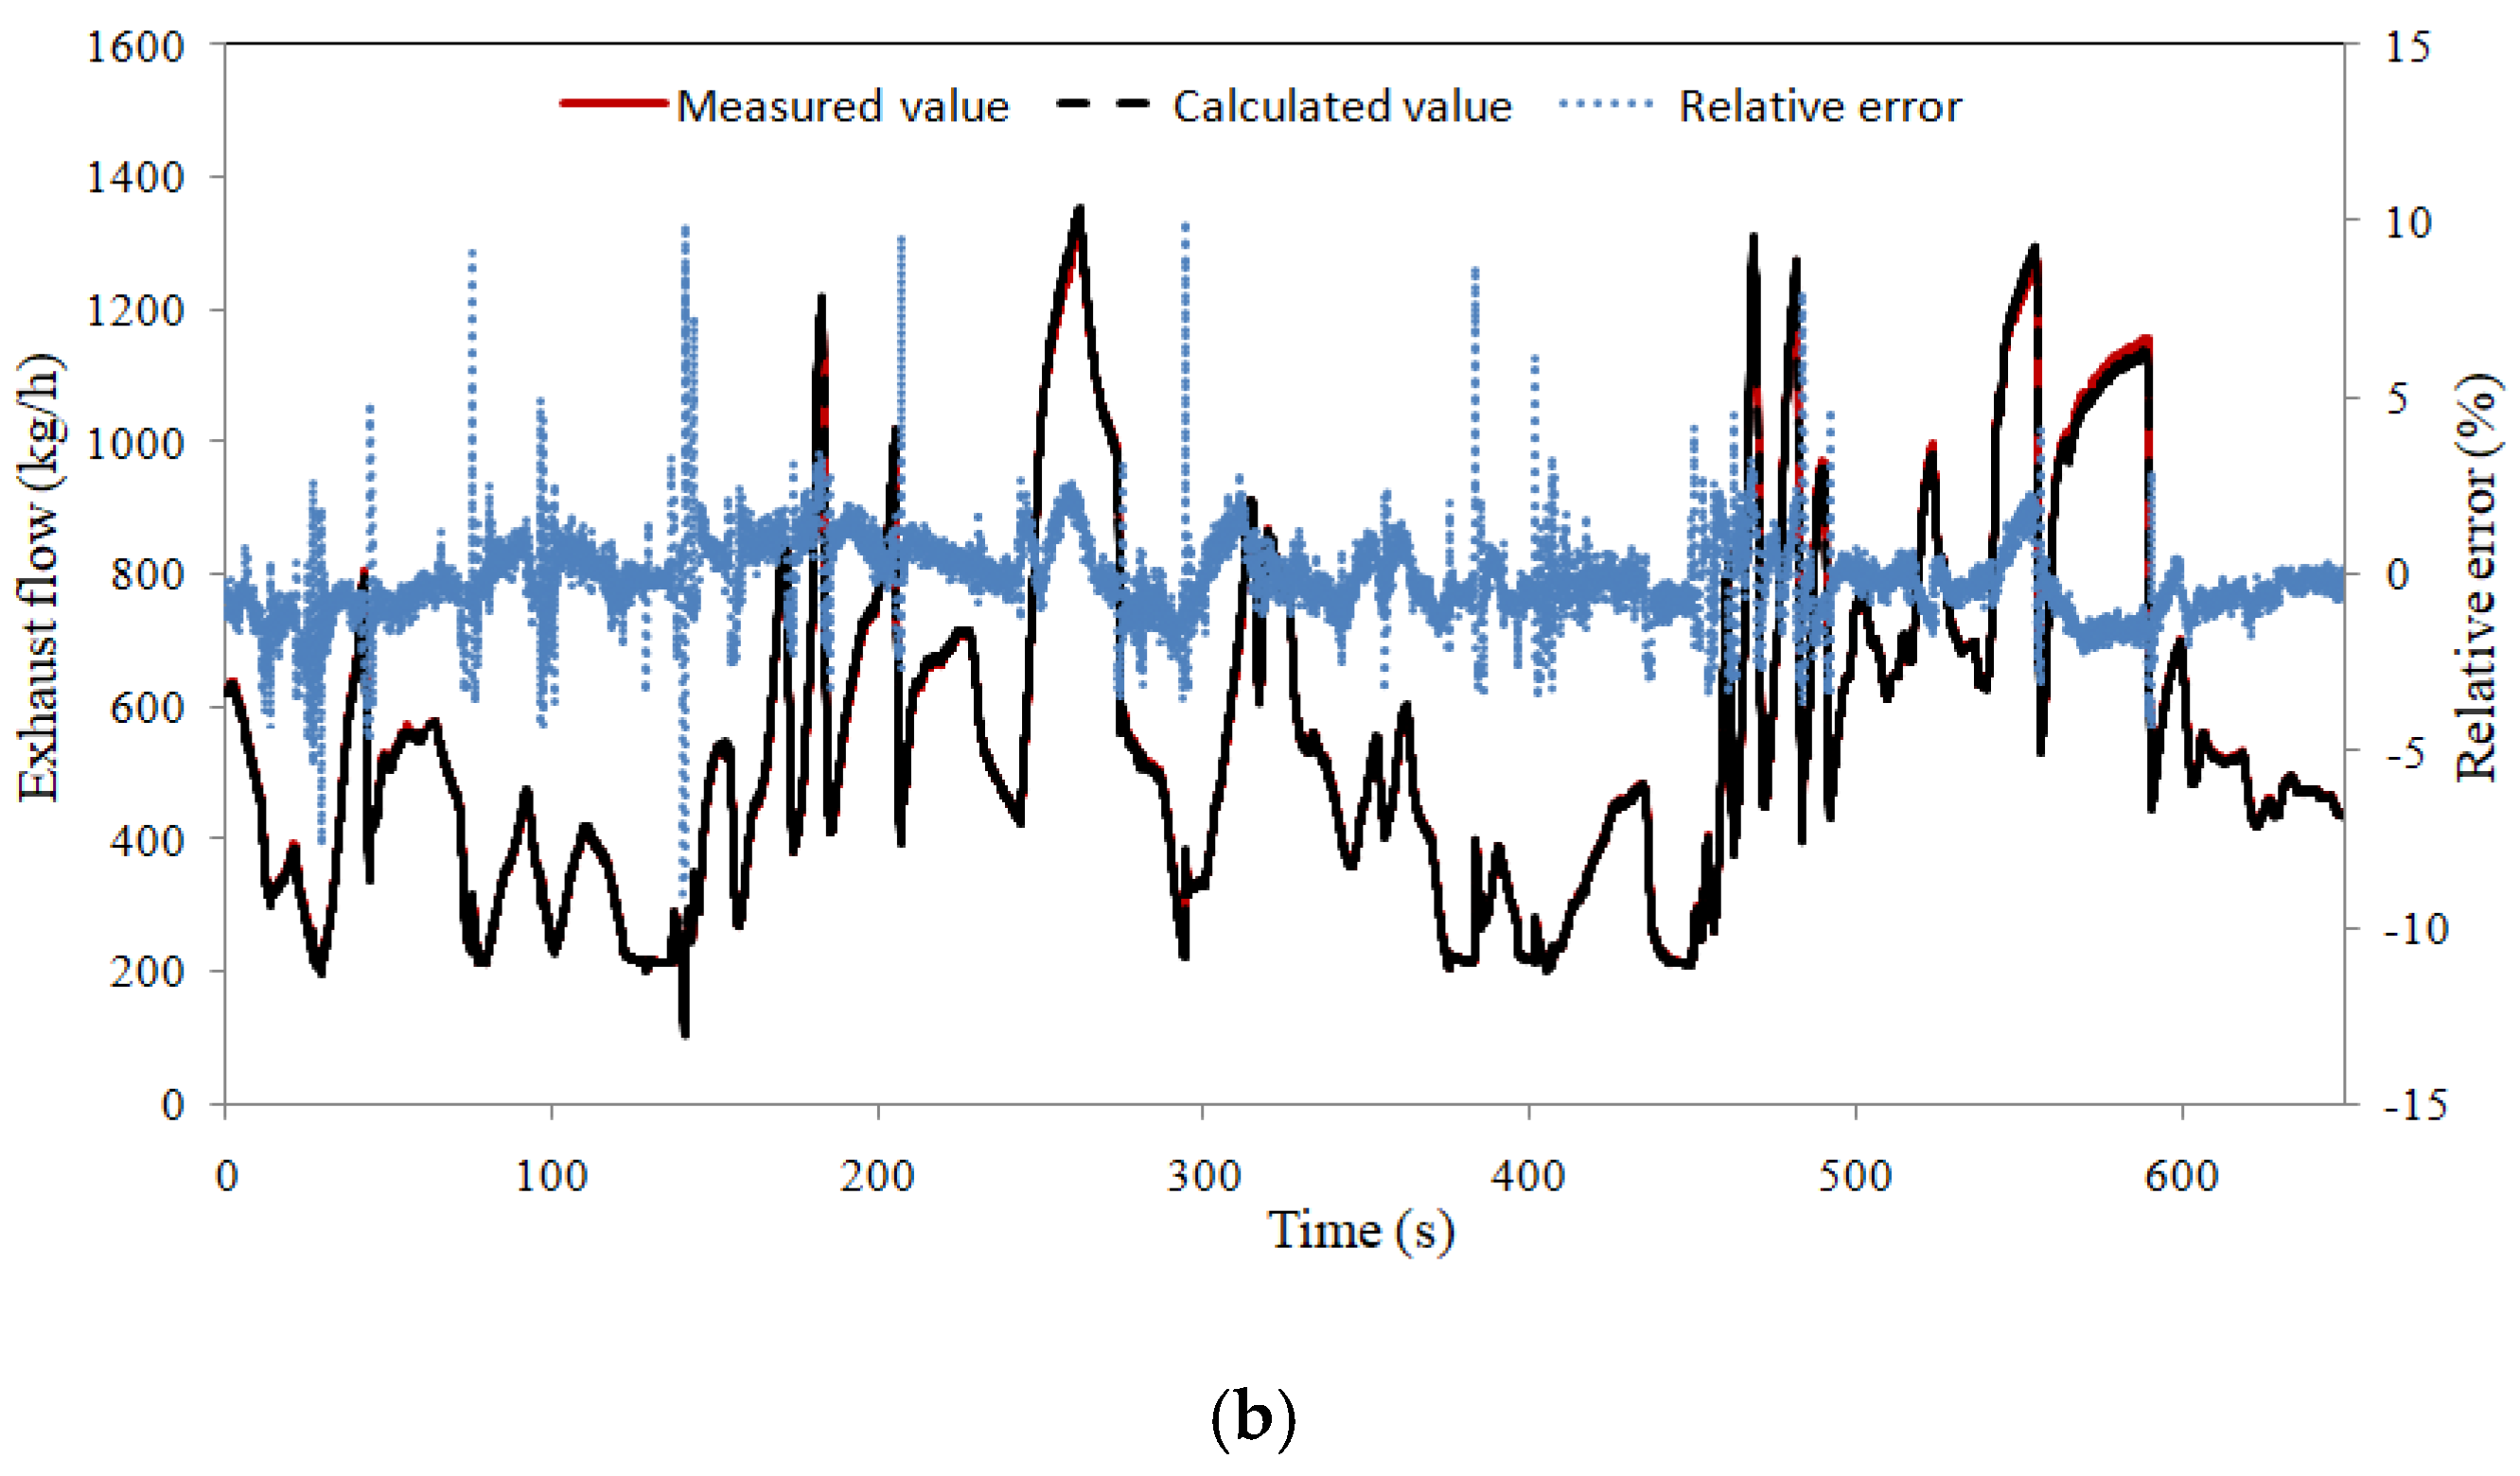
4.1. Exhaust Gas Flow Test

To facilitate the comparison test of the exhaust flow, a vehicle that can send out the exhaust flow on the controller area network (CAN) bus was selected. The exhaust flow information on the CAN bus is calculated by the engine controller, which is generally used for engine control, and its accuracy fully meets the requirements of the SCR system. During the experiment, the entire vehicle was loaded. By controlling the throttle opening on the actual road, the vehicle was operated under stable working conditions, and the exhaust flow rate was tested. Figure 5 shows the comparison curve of the actual road exhaust flow of the whole vehicle under steady-state working conditions. The maximum relative error calculated by the model is less than ±3%, and the relative error under most working conditions is less than ±1.8%. The model can be used to calculate the urea injection and temperature field of the SCR system.
To further test the calculation error of the exhaust flow under the transient working condition, the step change of the throttle opening was controlled, and the test was carried out. Figure 6 shows the comparison curve of the actual road exhaust flow of the entire vehicle under transient conditions. The maximum relative error calculated by the model is less than ±9%, and the relative error under most conditions is less than ±4%. The temperature calculation model can be used to guide the transient process, SCR system urea injection, and temperature field calculation The working condition point with relatively large error generally occurs when the working condition changes suddenly. At this time, the SCR system is equivalent to a buffer.

4.2. Exhaust Gas Temperature Test

It is not convenient to arrange the sensor inside the SCR catalytic reaction, so the exhaust temperature sensor is arranged at the inlet and outlet of the SCR catalytic reaction box. During the vehicle test, the measured value of the downstream exhaust temperature was used as the reference, and the accuracy of the calculated value of the model was analysed. The heavy-duty truck loading experiment under the actual road conditions was used to adjust the throttle opening according to the actual road conditions, and the data were collected for a certain period of time. Figure 7 shows the exhaust temperature curve and vehicle operating data under actual vehicle test conditions. Therefore, the experimental data include both steady-state and transient conditions, where A and B are two steady-state working condition intervals, and C and D are two transient working condition intervals. Under steady-state operating condition A, the relative error of the calculated exhaust temperature is less than 0.8%, and under steady-state operating condition B, the relative error of the calculated exhaust temperature is less than ±1.8%. Compared with the steady-state operating condition, the relative error of the transient operating condition is increased. Under operating condition C, the relative error of the calculated exhaust temperature is less than ±5.2%. Under working condition D, the absolute value of the relative error of the calculated exhaust temperature is less than ±11.6%. The maximum error of all working conditions is 17.8%. Further analysis showed that the percentage of operating points with a relative error of less than ±5% in the calculated exhaust temperature reached 92.2%.

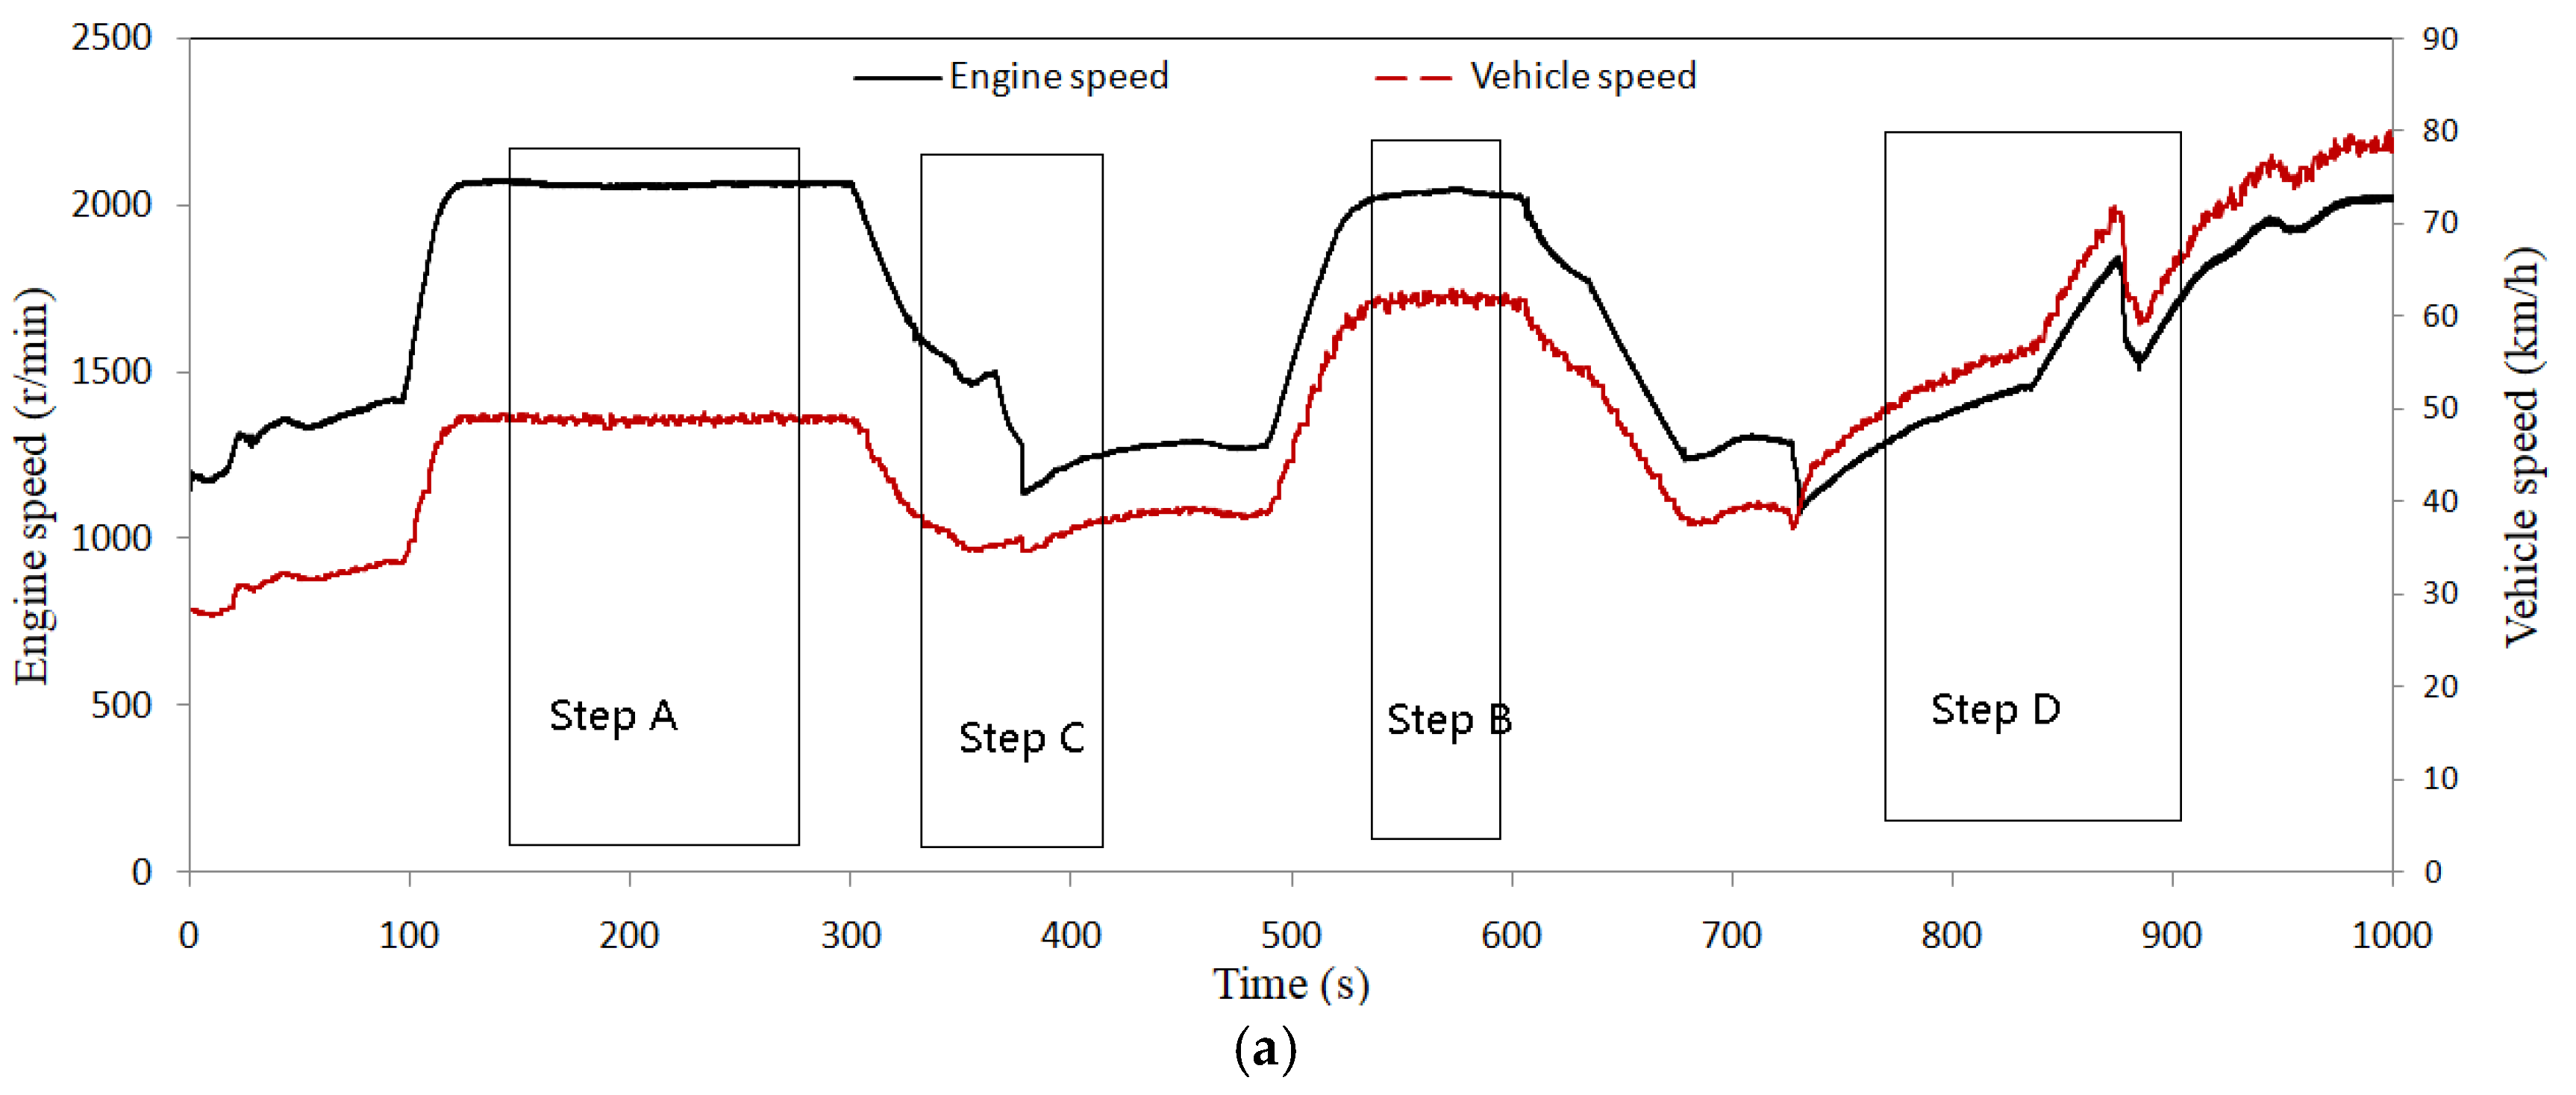
4.3. Control Strategy Test

In this paper, a complete solution was designed for the control of the mobile sources of nitrogen oxide emissions, which includes mainly an exhaust flow calculation, segmented temperature calculation, and segmented PID closed-loop control based on a downstream nitrogen oxides signal. To better verify the effect of nitrogen oxides’ control and the amount of ammonia leakage, verification was carried out through an actual road load test. During the test, to eliminate the cumulative error, the urea injection was terminated every time interval, and then the measured value of the downstream nitrogen oxides was compared with the theoretical calculated value. Figure 8 shows the comparison curves of the calculated and measured values of the downstream NOx and NH3 models.
Figure 8 compares and analyses the situations that follow the calculated downstream NOx value at different temperatures. The results show that the calculated downstream NOx value is not affected by temperature and the ammonia–nitrogen ratio and can better track the measured value. Once the ammonia leakage occurs, it is difficult to control it in time, and the main reason for ammonia leakage is the ammonia saturation storage level [19]. Therefore, we use the starting moment of ammonia leakage as a key parameter to predict and control ammonia leakage. Further analysis of the prediction of ammonia leakage shows that the prediction time of the critical point of ammonia leakage at 330 °C is 15 s earlier than the actual time of ammonia leakage. At 370 °C, the time is 23 s. The ammonia leakage critical point calculated by the model is slightly ahead of the actual ammonia leakage critical point, and the higher the temperature is, the earlier the advancement time because ammonia leakage is closely related to the temperature, and the ammonia leakage calculation model uses the temperature as well as ammonia leakage. It is not difficult to find that when the temperature increases from 330 °C to 370 °C, both the ammonia saturation calculation model and the ammonia leakage calculation model have good predictive effects.

5. Conclusions

(1)
According to the characteristics of the mobile source, a pressure difference-based flow calculation model was established to analyse the heat and mass transfer process of the SCR catalyst and establish a temperature model. Based on the downstream NOx signal and the SCR reaction characteristics, a segmented PID control strategy was established. The control strategy was constructed using MATLAB/Simulink, and the executable code of the embedded system was generated through RTW.
(2)
The test results of the whole vehicle show that the flow calculation model and the temperature model have good accuracy. The errors increase when the load step increases.
(3)
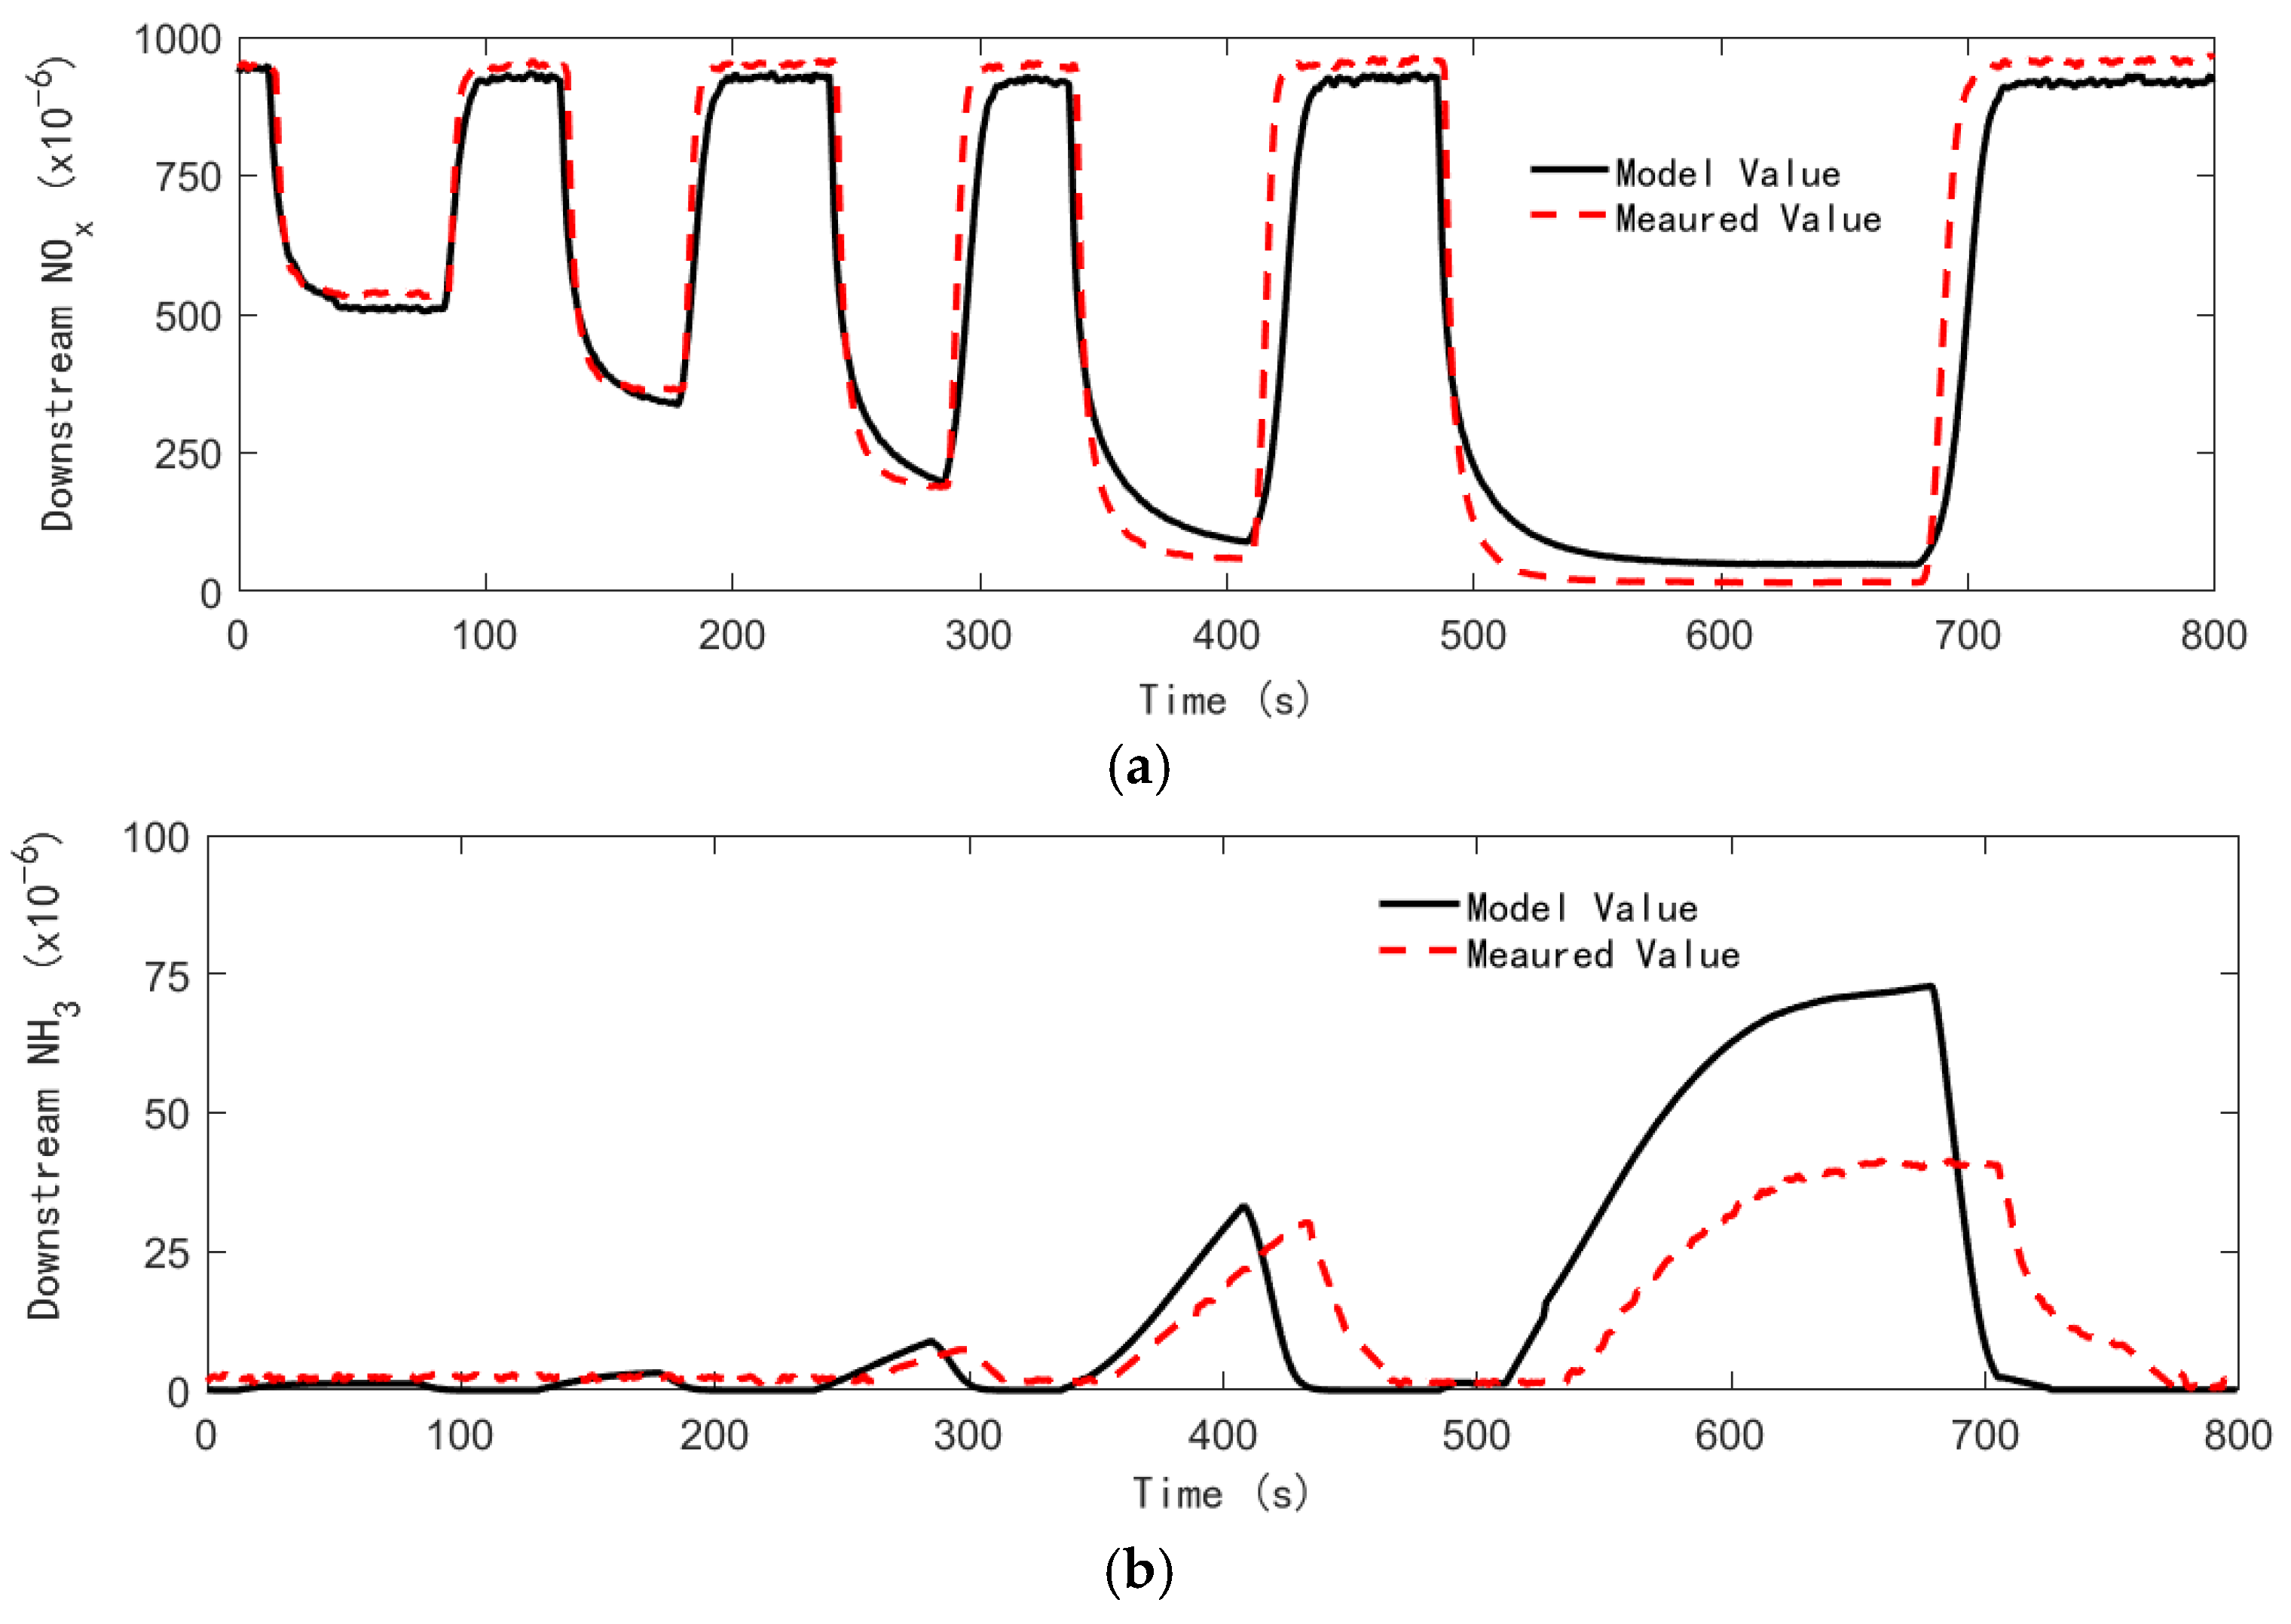
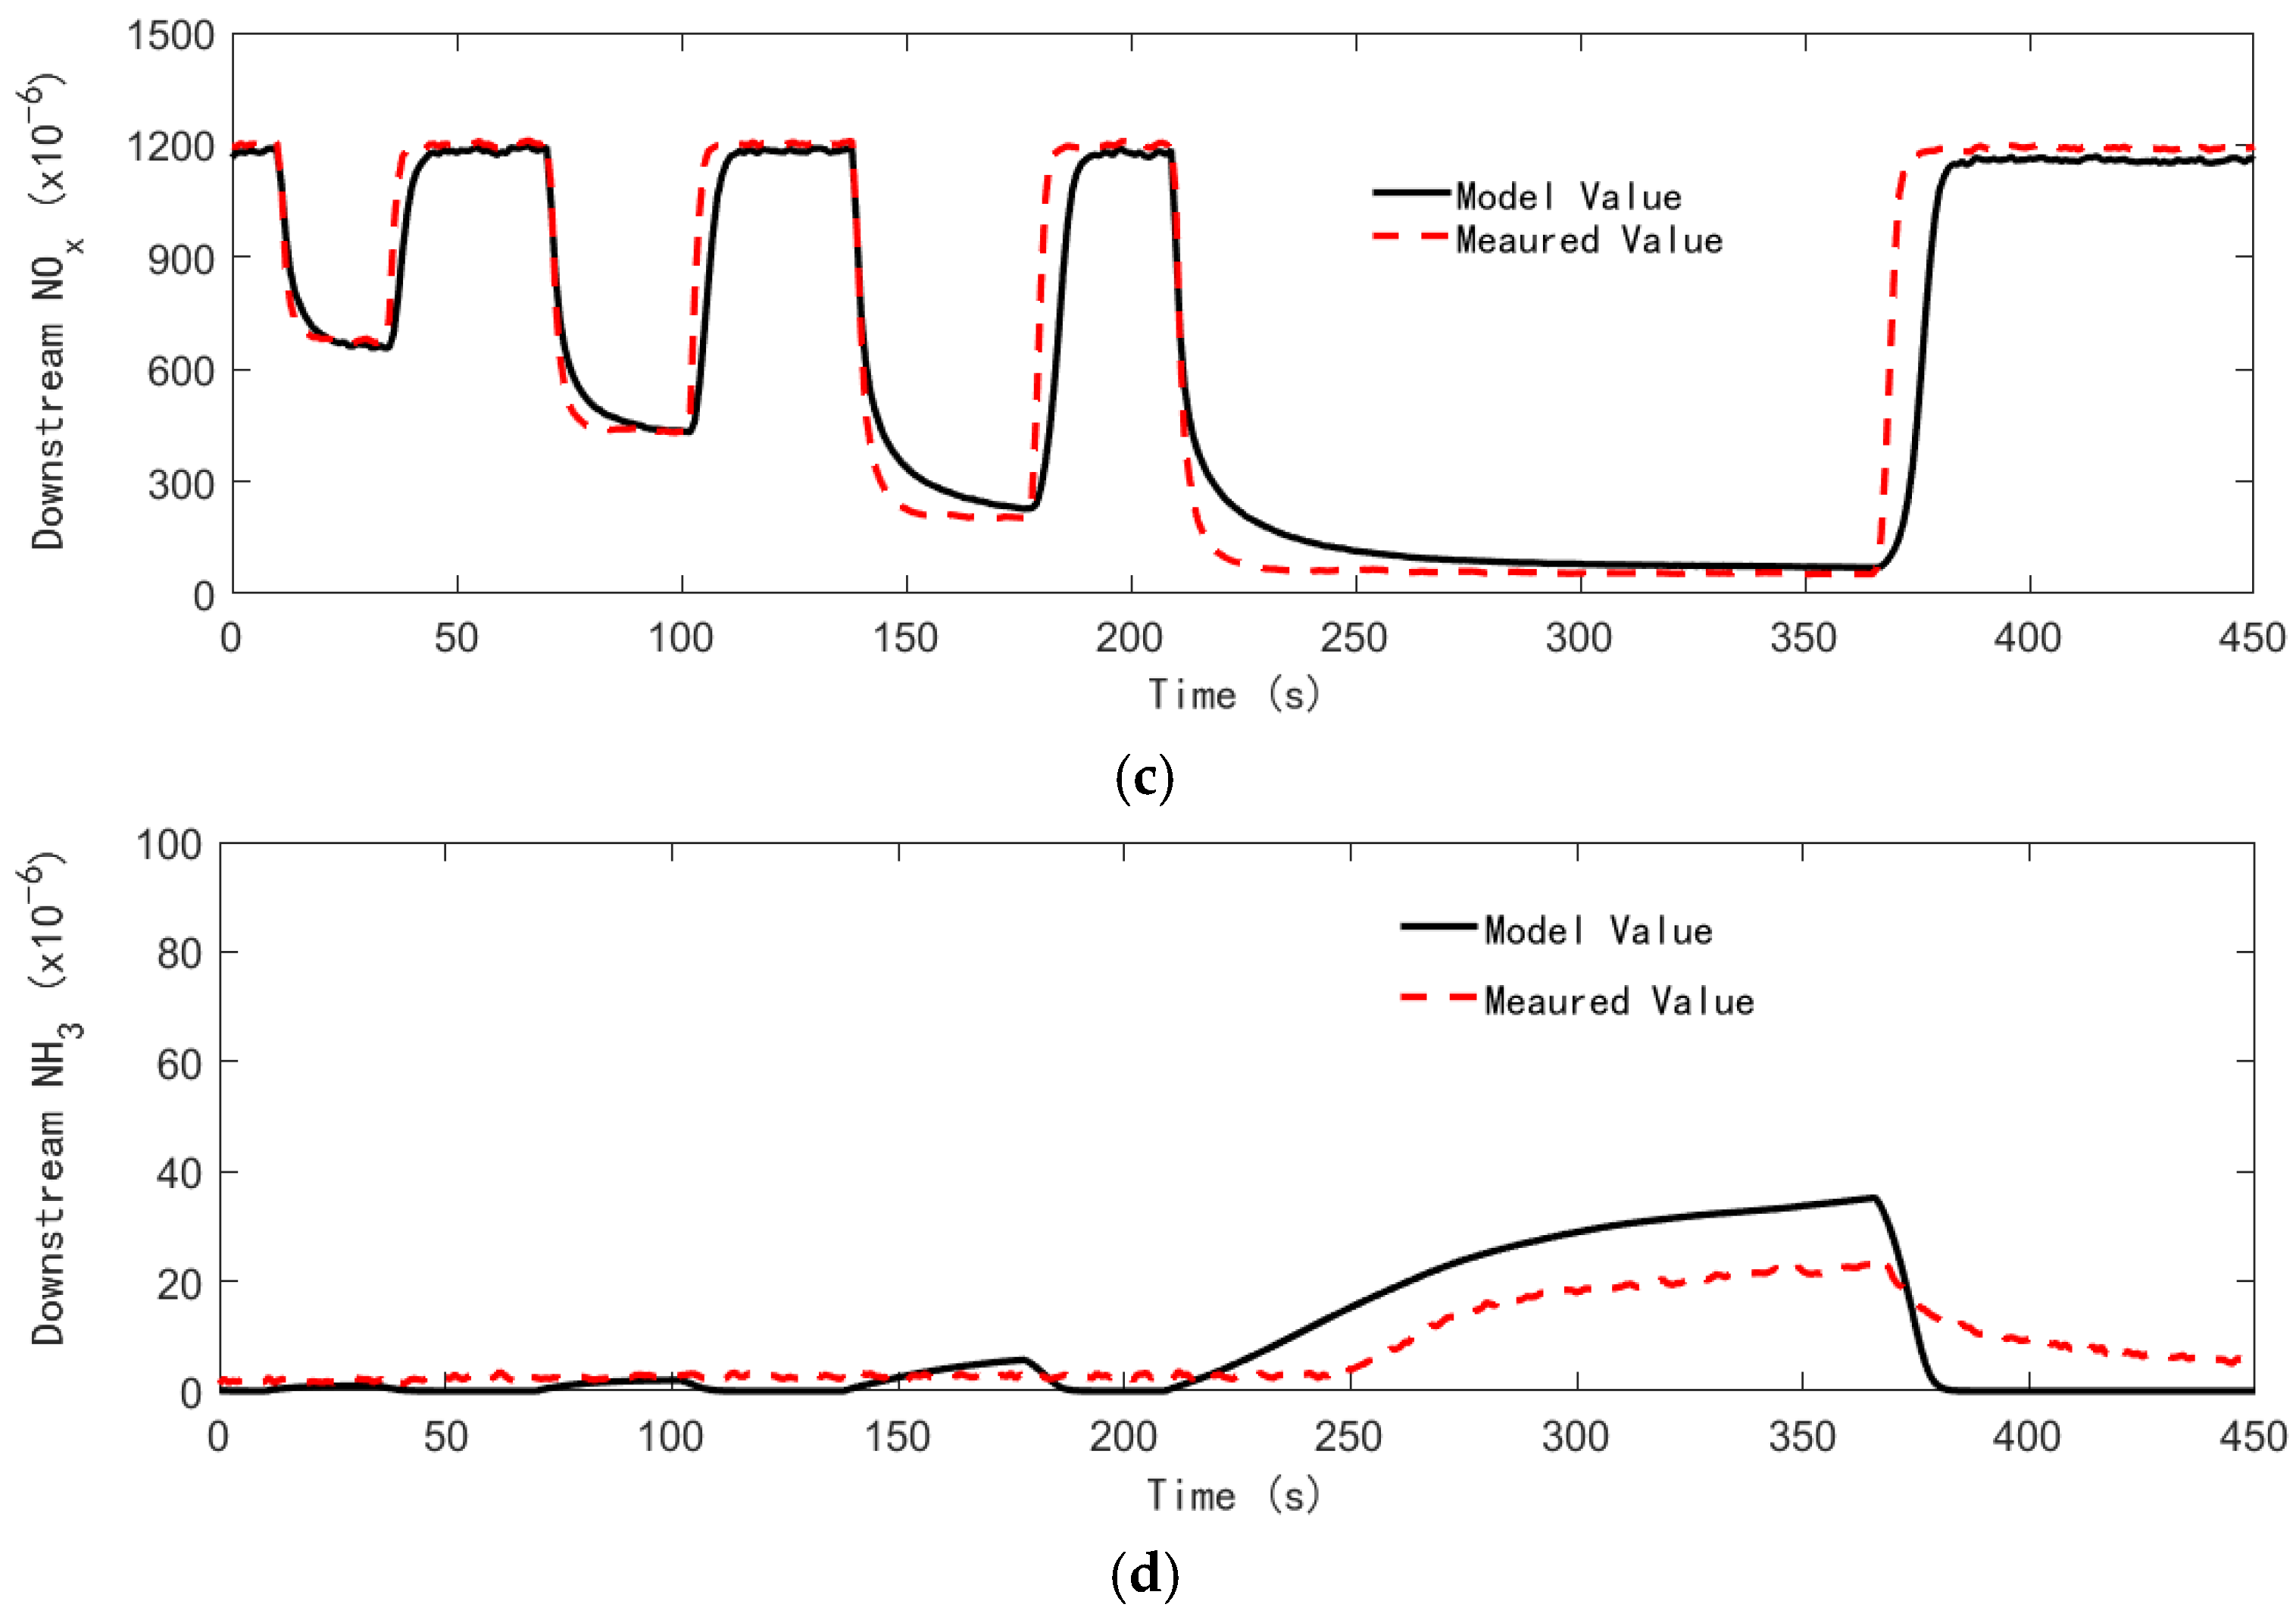
According to the differences in the internal temperature of the catalyst, downstream nitrogen–oxygen-based segmented PID closed-loop control was adopted. The model can better predict downstream nitrogen oxides and ammonia leakage, providing conditions for closed-loop control.

Author Contributions

All authors contributed to the study conception and design. Conceptualization, H.W. and G.Y.; methodology, G.Y. and R.L.; writing—original draft preparation, G.Y.; project administration, T.Z.; visualization, J.S. All authors have read and agreed to the published version of the manuscript.

Funding

This research was funded by National Engineering Laboratory for Mobile Source Emission Control Technology, China Automotive Technology & Research Center Co., Ltd. (grant number: NELMS2020A11) and National Nature Science Foundation of China (grant number: 52075307).

Institutional Review Board Statement

Not applicable.

Informed Consent Statement

Not applicable.

Data Availability Statement

Not applicable.

Acknowledgments

The help supplied in this study by the Hebei Suoqi Automobile Electronic Technology Co., Ltd., Qian’an, China, is greatly appreciated.

Conflicts of Interest

The authors declare no conflict of interest.

References

  1. Li, W.J.; Cao, Y.; Li, R.K.; Ma, X.; Chen, J.; Wu, Z.; Xu, Q. The spatial variation in the effects of air pollution on cardiovascular mortality in Beijing, China. J. Expo. Sci. Environ. Epidemiol. 2018, 28, 297–304. [Google Scholar] [CrossRef] [PubMed]
  2. The Ministry of Ecology and Environment Issued the Annual Report of China Mobile Source Environmental Management, Highlighting the Urgency of Mobile Source Pollution Control. China Environ. Superv. 2020, 8, 9.
  3. Johnson, T.V. Review of Vehicular Emissions Trends. SAE Int. J. Engines 2015, 8, 1152–1167. [Google Scholar] [CrossRef] [Green Version]
  4. Shuai, S.J.; Tang, T.; Zhao, Y.; Hua, L. State of the art and outlook of diesel emission regulations and aftertreatment technologies. Automot. Saf. Energy 2012, 3, 200–217. [Google Scholar]
  5. Shijin, S.H.U.A.I.; Shiyu, L.I.U.; Xiao, M.A. Technology analysis of heavy-duty diesel vehicles to meet near-zero emission regulations. J. Automot. Saf. Energy 2019, 10, 16. [Google Scholar]
  6. Sampath, M.K.; Lacin, F. CFD Study of Sensitivity Parameters in SCR NOx Reduction Modeling; 2014-04-2346; SAE: Detroit, MI, USA, 2014. [Google Scholar]
  7. Suarez-Bertoa, R.; Valverde, V.; Clairotte, M.; Pavlovic, J.; Giechaskiel, B.; Franco, V.; Kregar, Z.; Astorga, C. On-road emissions of passenger cars beyond the boundary conditions of the real-driving emissions test. Environ. Res. 2019, 176, 108572. [Google Scholar] [CrossRef] [PubMed]
  8. Yang, L.H.Z.; Franco, V.; Mock, P.; Kolke, R.; Zhang, S.; Wu, Y.; Germa, J. Experimental Assessment of NOx Emissions from 73 Euro 6 Diesel Passenger Cars. Environ. Sci. Technol. 2015, 49, 14409–14415. [Google Scholar] [CrossRef] [PubMed]
  9. Kun, W.; Yi, L.; Wei, W. Study on factors affecting conversion efficiency of double SCR system of heavy duty diesel engine. J. Heifei Univ. Technol. 2021, 44, 743–747. [Google Scholar]
  10. Tan, P.; Wang, D.; Lou, D.; Hu, Z. Progress of control technologies on exhaust emissions for agricultural machinery. Trans. Chin. Soc. Agric. Eng. 2018, 34, 1–14. [Google Scholar]
  11. Chatterjee, D.; Koci, P.; Schmeißer, V.; Marek, M.; Weibel, M.; Krutzsch, B. Modeling of a combined NOx storage and NH3-SCR catalytic system for diesel exhaust gas after treatment. Catal. Today 2010, 151, 395–409. [Google Scholar] [CrossRef]
  12. Mráček, D.; Kočí, P.; Choi, J.-S.; Partridge, W.P. New operation strategy for driving the selectivity of NOx reduction to N-2, NH3 or N2O during lean/rich cycling of a lean NOx trap catalyst. Appl. Catal. B Environ. Int. J. Devot. Catal. Sci. Its Appl. 2016, 182, 109–114. [Google Scholar] [CrossRef] [Green Version]
  13. Hommen, G.; Kupper, F.; Seykens, X. Model-Based Urea Dosing Control for SCR Aftertreatment Systems Using a Cross-Sensitive Tailpipe NOx Sensor; SAE Paper 2017-01-0938; SAE: Detroit, MI, USA, 2017. [Google Scholar]
  14. Wang, Y.; Zhang, H.; Wang, J. NOx sensor reading correction in diesel engine selective catalytic reduction system applications. IEEE/ASME Trans. Mechatron. 2016, 21, 460–471. [Google Scholar]
  15. Aliramezani, M.; Koch, C.R.; Hayes, R.E. Estimating tailpipe NOx concentration using a dynamic NOx/ammonia cross sensitivity model coupled to a three state control oriented SCR model. IFACPapersOnLine 2016, 49, 8–13. [Google Scholar] [CrossRef]
  16. Stadlbauer, S.; Waschl, H.; del Re, L. SCR ammonia dosing control by a nonlinear model predictive controller. IFAC Proc. Vol. 2014, 47, 3018–3023. [Google Scholar] [CrossRef] [Green Version]
  17. Zhou, B.; Lan, X.; Xu, X.; Liang, H. Numerical model and control strategies for the advanced thermal management system of diesel engine. Appl. Therm. Eng. 2016, 82, 368–379. [Google Scholar] [CrossRef]
  18. Ke, H.; Liu, H.M.; Tian, G.D. An Uncertain Random Programming Model for Project Scheduling Problem. Int. J. Intell. Syst. 2015, 30, 66–79. [Google Scholar] [CrossRef]
  19. Yue, G.; Qiu, T.; Lei, Y. Experimental demonstration of NOx reduction and ammonia slip for diesel engine SCR system. Environ. Sci. Pollut. Res. 2022, 29, 1118–1133. [Google Scholar] [CrossRef] [PubMed]
Figure 1. Schematic diagram of the experimental setup and test method.
Processes 10 01374 g001
Figure 2. Scheme diagram of differential pressure measurement.
Processes 10 01374 g002
Figure 3. Scheme diagram of the catalyst temperature field.
Processes 10 01374 g003
Figure 4. Scheme diagram of SCR system control strategy.
Processes 10 01374 g004
Figure 5. Comparison curve of vehicle actual road exhaust flow under steady-state conditions. (a) Engine speed and vehicle speed; (b) measured and calculated value of exhaust flow gas.
Processes 10 01374 g005
Figure 6. Comparison curve of vehicle actual road exhaust flow under transient-state conditions. (a) Engine speed and vehicle speed; (b) measured and calculated value of exhaust flow gas.
Processes 10 01374 g006aProcesses 10 01374 g006b
Figure 7. Exhaust temperature curve and vehicle operation data under real vehicle test conditions. (a) Engine speed and vehicle speed; (b) exhaust temperature comparison between the model calculated value and the measured value.
Processes 10 01374 g007aProcesses 10 01374 g007b
Figure 8. NOx and NH3 comparison curve between the model calculated value and the measured value. (a) Downstream NOx when catalyst temperature is 330 °C; (b) downstream NH3 when catalyst temperature is 330 °C; (c) downstream NOx when catalyst temperature is 370 °C; (d) downstream NH3 when catalyst temperature is 370 °C.
Processes 10 01374 g008aProcesses 10 01374 g008b
Publisher’s Note: MDPI stays neutral with regard to jurisdictional claims in published maps and institutional affiliations.

