Abstract
Aerobic granular sludge (AGS) is known for high phosphorus removal from wastewaters, and phosphorus can be recovered from high phosphorus-containing waste sludge granules. This study aimed at determining the feeding strategy that provides the best performance in terms of the proliferation of polyphosphate-accumulating organisms (PAOs) and phosphorus removal. Using three AGS bioreactors, this study compared phosphorus removal and the proliferation dynamics of PAOs under three different feeding strategies: anaerobic slow feeding (R1), pulse feeding + anaerobic mixing (R2), and pulse feeding (R3). Results indicate that R1 and R2 achieved significantly higher phosphorus removal (97.6 ± 3% for R1 and 98.3 ± 1% for R2) than R3 (55 ± 11%). The anaerobic slow feeding procedure (R1) achieved the highest specific phosphorus release rate (SPRR) and specific phosphorus uptake rate (SPUR) as compared to the other two feeding conditions. 16S ribosomal ribonucleic acid (rRNA) gene sequencing assay of the microbial community for the three feeding strategies indicated that although the feeding strategy impacted reactor performance, it did not significantly alter the microbial community. The bacteria community composition maintained a similar degree of diversity. Proteobacteria, Bacteroidetes, and Verrucomicrobia were the dominant bacterial phyla in the system. Dominant PAOs were from the class Betaproteobacteria and the genera Paracoccus and Thauera. Glycogen-accumulating organisms were significantly inhibited while other less-known bacteria such as Wandonia and Hyphomonas were observed in all three reactors.
1. Introduction
The growing demand for phosphorus in the fertilizer industry, as well as the textile, rubber, leather, ceramics, and detergent industries [1,2], makes the recovery of phosphorus profitable. The primary source of phosphorus, phosphate rock, is under threat of depletion due to the world’s increasing population [3,4]. Phosphorus recovery from wastewater treatment facilities can reduce our reliance on phosphate rock to meet phosphorus demands.
Aerobic granular sludge (AGS) has been demonstrated to achieve outstanding phosphorus removal from wastewaters [5,6,7]. Each sludge granule presents a layered structure with an aerobic outer layer, a transient anoxic zone, and an anaerobic inner core [6], which is made possible by oxygen diffusion limitation of large sized granules. The aerobic and anaerobic conditions provided by the granule structure alongside the sequencing batch operation mode allow for high phosphorus removal. The mechanisms for phosphorus removal in AGS-based treatment systems include (i) enhanced biological phosphorus removal (EBPR) and (ii) phosphorus precipitation inside the granular sludge matrix [8,9,10,11,12,13,14]. It has been shown that of the total phosphorus removed in AGS reactors, 55–73.7% is through EBPR [10,15].
Enhanced biological phosphorus removal (EBPR) is widely regarded as the most economical and sustainable method for the removal of phosphorus from wastewater. In EBPR, polyphosphate accumulating organisms (PAOs) within the sludge release phosphorus to the bulk liquid during anaerobic conditions, subsequently uptake phosphorus from the bulk liquid during the aerobic phase, and store phosphorus as intracellular polyphosphates inside their cells and use for energy generation [14]. This implies the success of EBPR depends on the enrichment of PAOs in the AGS bioreactor. Numerous factors affect the EBPR performance of AGS systems, including carbon source, pH, carbon-to-phosphorus ratio, feeding strategy, temperature, and free ammonia concentration.
The feeding strategy is an operational parameter that impacts both aerobic granule formation and stability. Five different feeding strategies are used in AGS bioreactors: aerated feeding, pulse (fast static) feeding, anaerobic slow (slow static) feeding, pulse feeding followed by anaerobic mixing, and split anaerobic–aerobic feeding [16]. While the aerated feeding strategy (feeding and aeration/mixing taking place simultaneously) leads to fast granulation, the resulting granules are not capable of removing nutrients since the dominant microorganisms (COD degraders) outcompete slow-growing nitrifiers [17]. Granules formed through the aerated feeding strategy are also not stable due to the weak anaerobic core [18]. The pulse feeding strategy poses no problem with granule formation, but the granules formed are not stable [19]. The anaerobic slow feeding strategy results in compact and stable granules that are capable of removing both organic matter and nutrients [20,21]. Pulse feeding followed by anaerobic mixing allows for the formation of stable granules due to the stable growth rate, which allows for a suitable balance between the growth of heterotrophic and autotrophic microorganisms [22]. Nevertheless, while one study found the split anaerobic–aerobic feeding strategy suitable for aerobic granule formation and stable granules at low organic loading rate [23], another study reported the contrary [24].
Currently, there is no information in the scientific literature on the comparative study of different feeding strategies in terms of the proliferation of PAOs and phosphorus removal in AGS systems. Thus, the aim of this study was to fill this important research gap. Using synthetic wastewater, the present study used three different feeding strategies to compare phosphorus removal and the proliferation dynamics of PAOs in AGS bioreactors: anaerobic slow feeding, pulse feeding + anaerobic mixing, and pulse feeding. The specific phosphorus uptake rate (SPUR), the specific phosphorus release rate (SPRR), and phosphorus distribution were determined for the seed sludge and for the three reactors at steady state conditions.
2. Materials and Methods
2.1. Experimental Set-Up
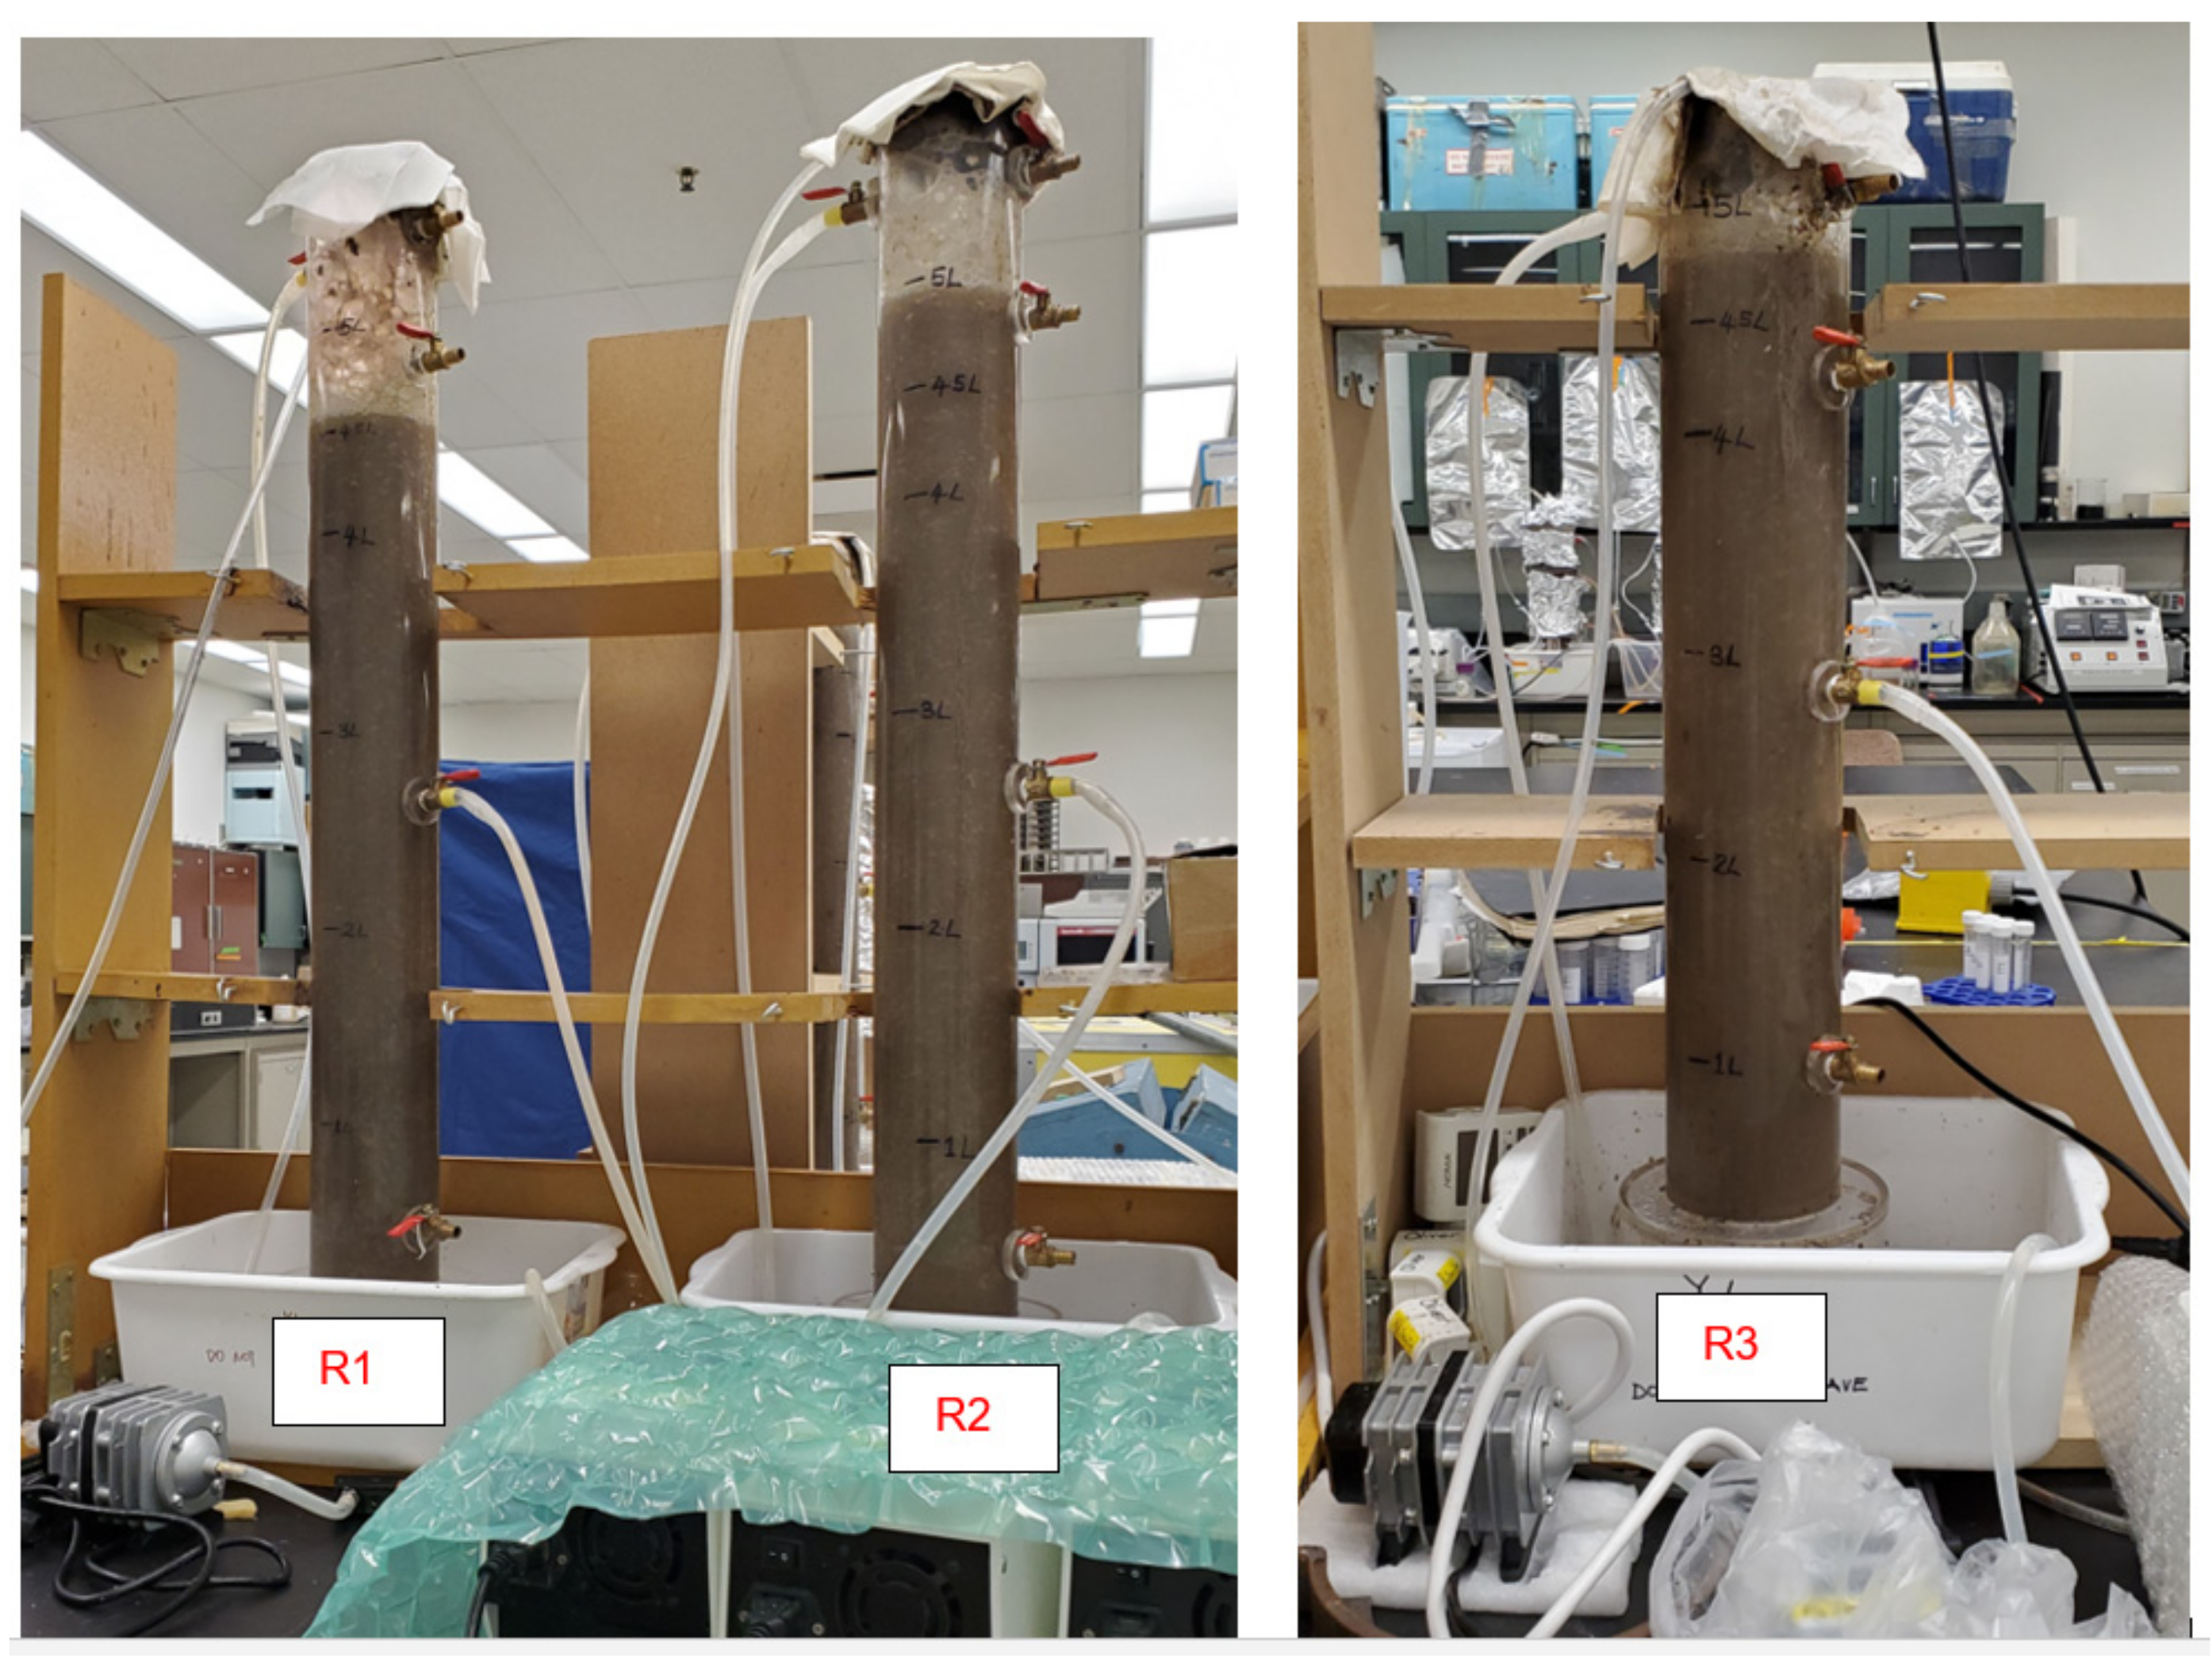
Three reactors (R1, R2, R3), fabricated using acrylic (Plexiglas), were used for the experiment. Each reactor had a working volume of 4.5 L. The reactors were of diameter 9 cm for R1 and R2 and 10 cm for R3, and effective height-to-diameter (H/D) ratios of 7.56 for R1 and R2 and 5.75 for R3. Figure 1 shows the three reactors in operation.
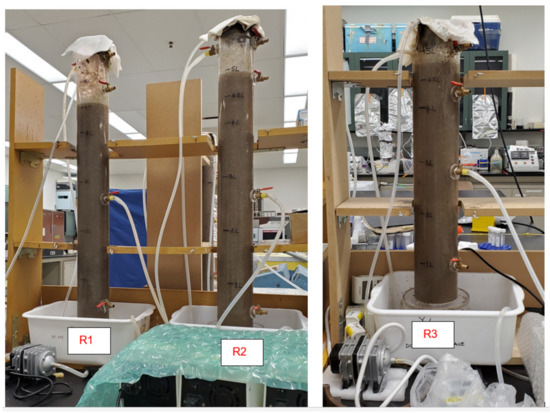
Figure 1.
AGS bioreactors (R1, R2, R3) in operation.
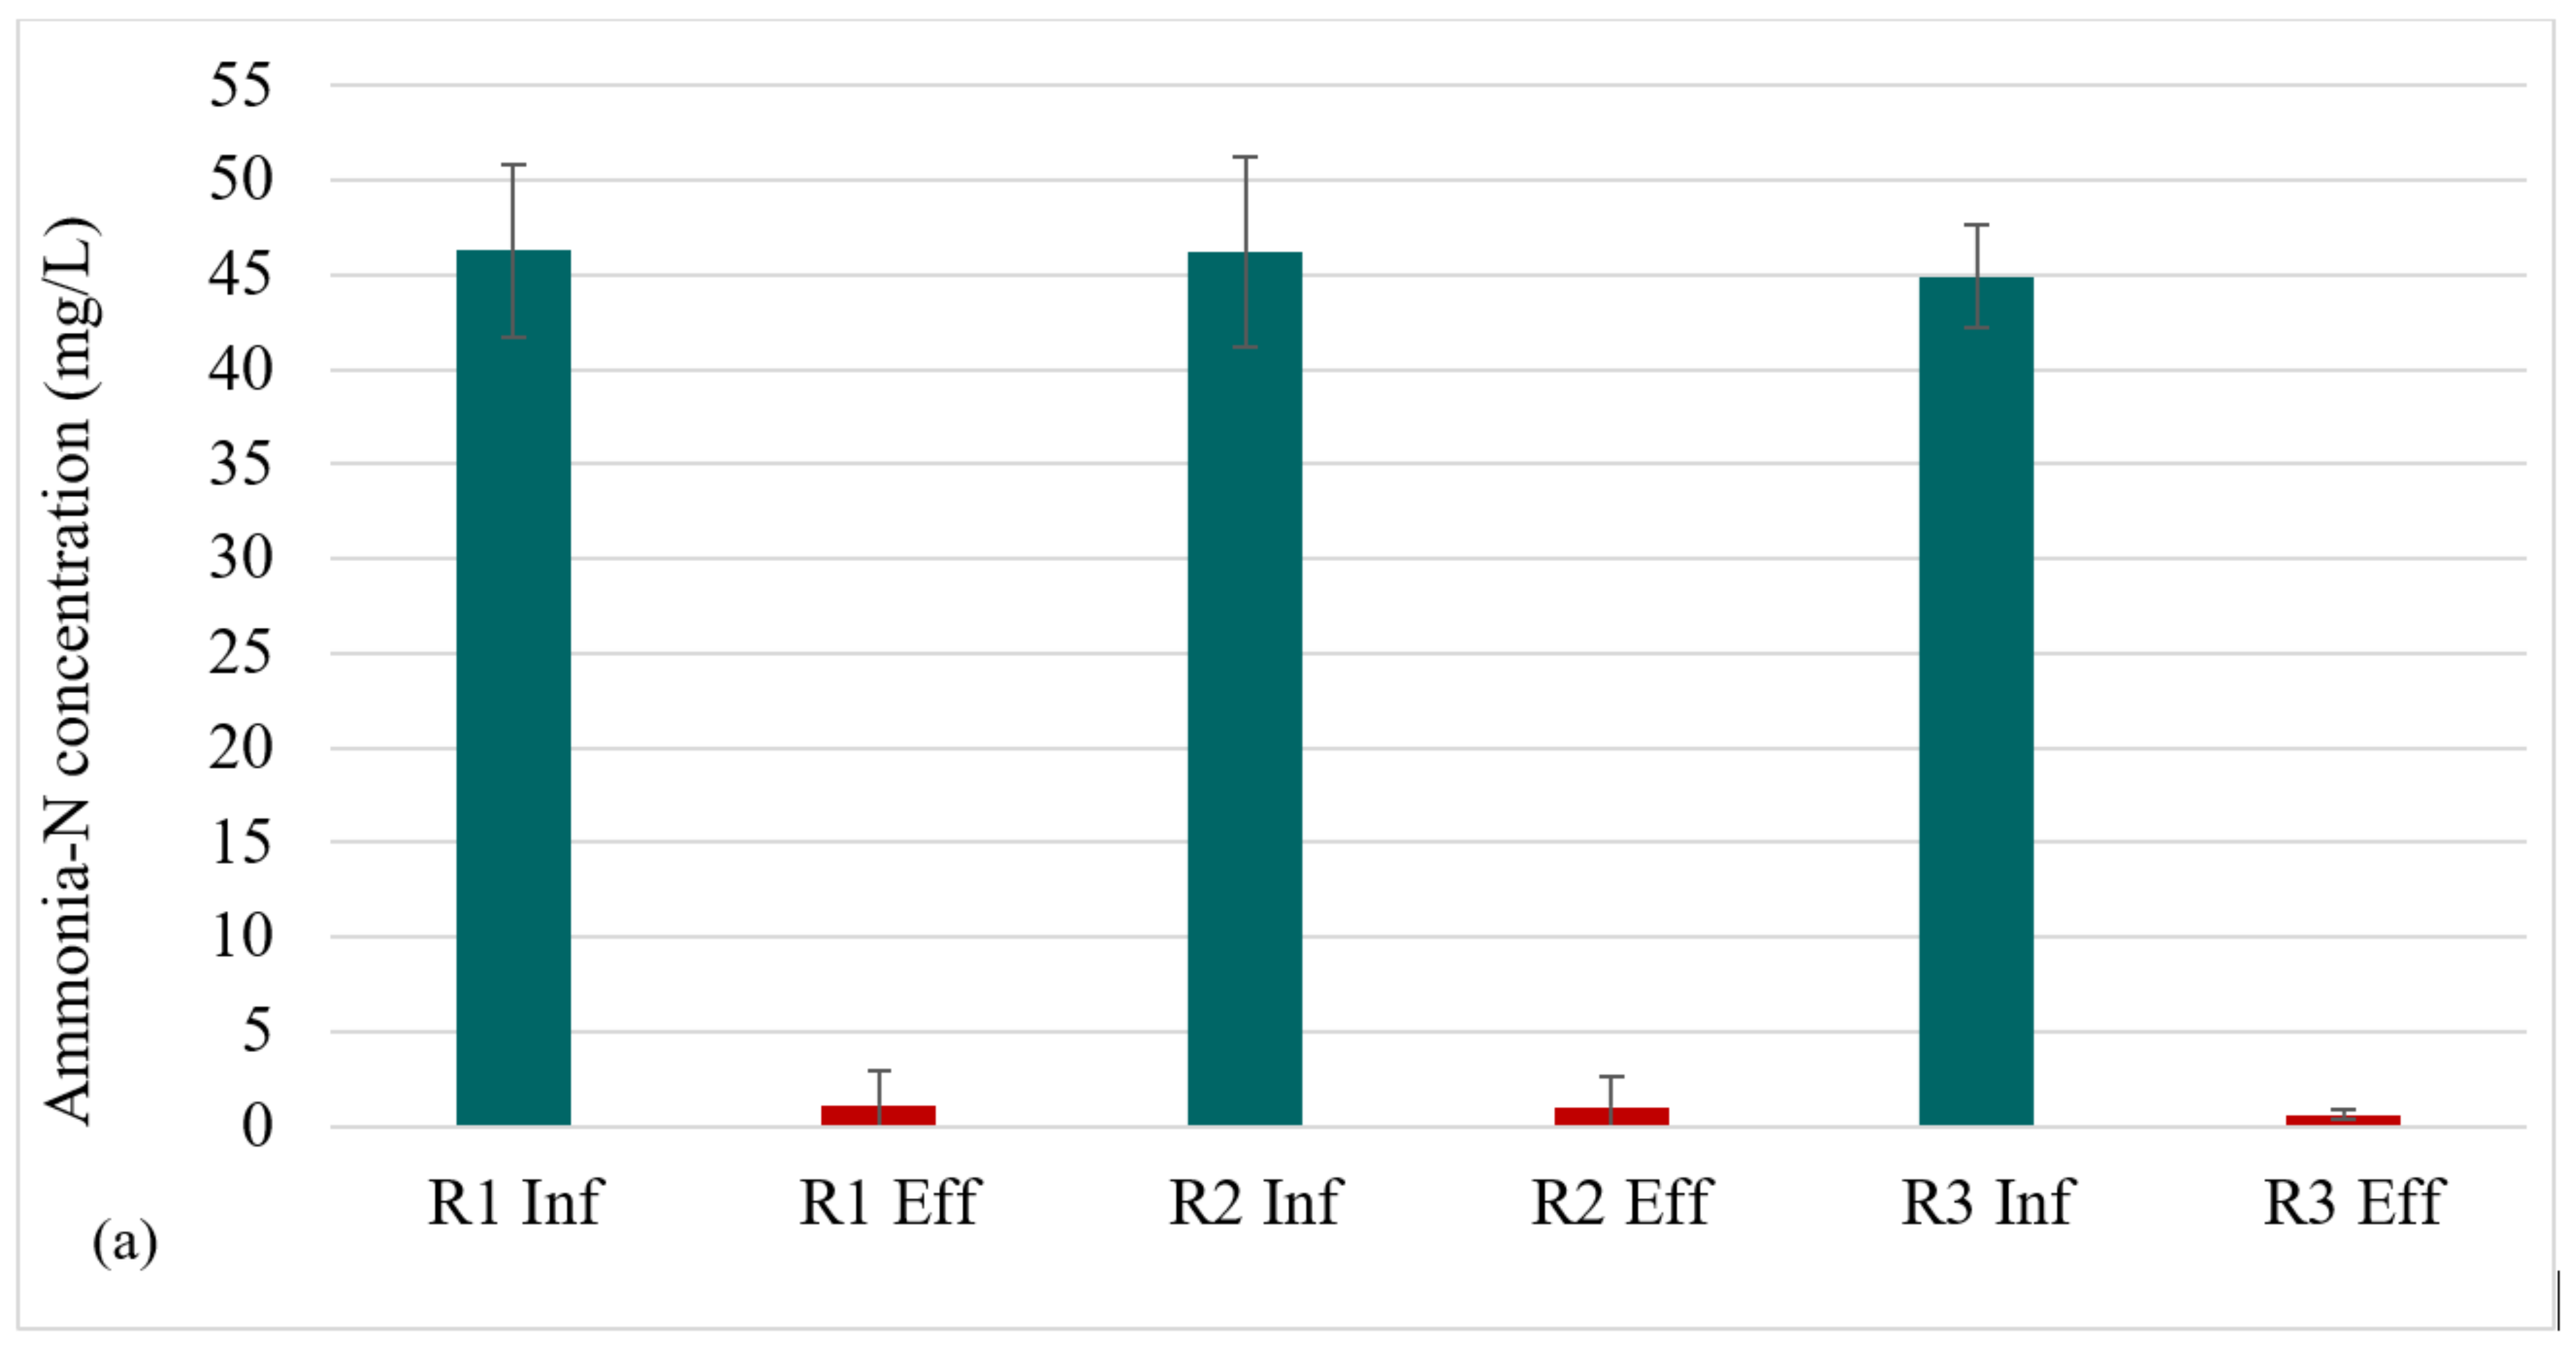
A sequencing batch reactor (SBR) mode of operation was adopted as it is common with AGS systems. The details of the SBR operation are shown in Table 1. Influent chemical oxygen demand (COD) was 2092 ± 198 mg/L (day 1–27) and 971 ± 114 mg/L (day 28–84). The reactors were operated at a COD:N:P ratio of 100:5:1. Hence, the influent ammonia–nitrogen concentrations were 97 ± 7 mg/L (day 1–27) and 45 ± 3 mg/L (day 28–84) and the influent phosphorus concentrations were 20 ± 4 mg/L (day 1–27) and 11 ± 2 mg/L (day 28–84). Pentair ceramic diffusers (AS4) were used to provide fine air bubbles at the bottom of the reactors at superficial upflow velocities of 1.48 cm/s in R1 and R2, and at 1.2 cm/s in R3. Effluent was withdrawn via a port located around the middle of the reactor height, resulting in the volumetric exchange ratio (VER) shown in Table 1. In R2, anaerobic mixing was done by recirculating the wastewater in the bioreactor from the top to the bottom of the bioreactor using a peristaltic pump.

Table 1.
SBR operational conditions.
2.2. Seed Sludge and Media
Return activated sludge was obtained from a full-scale biological nutrient removal wastewater treatment plant in Alberta. The activated sludge was acclimated to the substrate for 3 d in a batch mode before being used to start the bioreactors. Experiments were conducted at room temperature (20 ± 2 °C).
Synthetic wastewater was prepared using the following compounds: sodium acetate, sodium propionate, NH4Cl, KH2PO4, K2HPO4, CaCl2·2H2O, MgSO4·7H2O, and FeSO4·7H2O. Micronutrients were prepared from: H3BO3 0.05 g/L, ZnCl2 0.05 g/L, CuCl2 0.03 g/L, MnSO4·H2O 0.05 g/L, (NH4)6·Mo7O24·4H2O 0.05 g/L, AlCl3 0.05 g/L, CoCl2·6H2O 0.05 g/L, and NiCl2 0.05 g/L as detailed elsewhere (Tay et al., 2002).
2.3. Analytical Methods
Biomass characteristics in reactors 1–3—mixed liquor suspended solids (MLSS), mixed liquor volatile suspended solids (MLVSS), COD, orthophosphate, SVI30, and SVI5—were determined according to standard methods [25]. SVI refers to the amount of sludge (milliliters) that has settled, and the SVI subscript refers to the settling time (minutes). Ammonia nitrogen (NH3-N) was analysed using the Hach Ammonia Nessler Method 8038. Nitrite-nitrogen was determined using Hach NitriVer®3 Nitrite Reagent. Nitrate-nitrogen was analysed using Hach TNT kits (TNT835). Total phosphorus was determined using Hach kits (TNT844).
2.4. Specific Phosphorus Uptake and Release Rates
The specific phosphorus release rate (SPRR) (phosphorus release solely due to PAOs activities) in sludge samples from each reactor was measured near the end of the settling phase when the reactors attained steady state (day 67 of the experiment) when the influent COD concentration was 971 ± 114 mg/L. The SPRR was determined as follows: 100 mL of the sludge was transferred into a 160 mL test bottle and the bottle was sparged with nitrogen gas for 15 min to create anaerobic conditions. Sodium acetate stock solution (0.625 mL) (COD = 10 g/L) was added to the test bottle, and the bottle was inverted three times and quickly sealed. Samples were then taken from the test bottle at 5, 10, 15, 20, 30, 45, and 60 min and filtered at 0.45 μm. The orthophosphate concentration in solution (as PO4-P) was measured in each sample, and the dissolved phosphorus (orthophosphate) concentration versus time was plotted. The MLVSS concentration of the withdrawn sample was also determined. The dissolved phosphorus concentration at 60 min was divided by the MLVSS (in g/L) to obtain the SPRR in mg P/g VSS.h.
To measure the specific phosphorus uptake rate (SPUR) of PAOs from wastewater, a sample from each SPRR test bottle at 60min was transferred to an open beaker and stone diffusers were employed to aerate the mixed liquor. Samples were taken at 0, 5, 10, 15, 20, 30, 45, and 60 min, filtered at 0.45 μm, and the dissolved phosphorus concentration vs. time was plotted for each sample. The dissolved phosphorus concentration at 60 min was divided by the mixed liquor volatile suspended solids MLVSS (in g/L) to obtain the SPUR in mg P/g VSS.h.
2.5. Phosphorus Distribution within the Sludge
Sludge samples were withdrawn from each reactor toward the end of the settling phase and their MLSS and MLVSS concentrations were determined. The total phosphorus in the sludge samples was measured using the digestion method (Hach TNT844): 40 mL of sludge was transferred to a 50 mL test bottle; the bottle was sparged with nitrogen gas for 15 min, then a sample (So) was taken. Sodium acetate stock solution (COD 10 g/L) (25 mL) was added to the test bottle, and the bottle was inverted three times for thorough mixing and quickly sealed. Samples from the bottle were then taken at 5, 10, 15, 20, 30, 45, and 60 min and filtered at 0.45 μm. The dissolved phosphorus concentration in the 60 min filtrate was divided by the MLVSS (in g/L) to obtain the phosphorus contribution from PAOs in mg P/g VSS.
To measure precipitated phosphorus, the test bottle from each reactor was opened and the pH was adjusted to 6.0–6.5 with hydrochloric acid (HCl). Liquid samples were withdrawn from the bottles after 10 min to measure the dissolved phosphorus concentration. The test bottles were then sonicated for 20 min at 100 W and 42 kHz. Liquid samples were withdrawn to measure dissolved phosphorus from the microbial cell surfaces. To measure phosphorus inside microbial cells, 1 mL of the sludge sample was transferred to a 2 mL microcentrifuge tube and treated with a cell disruptor (Branson Ultrasonics™ Sonifier™ SFX150 Cell Disruptor, Brookfield, WI, USA) for 10 min. Liquid samples were withdrawn from the bottles, filtered at 0.45 μm, and the dissolved phosphorus was estimated using the formula for the composition of a bacteria cell (C60H87O23N12P)-22.53 mg/g VSS.
2.6. Deoxyribonucleic Acid (DNA) Extraction
Deoxyribonucleic acid (DNA) was extracted from the sludge during granule formation and maturation using a DNeasy PowerSoil Kit following the manufacturer’s protocol. Extraction was performed on the seed sludge, and in all reactors on days 11, 27, 39, 56, and 58. The purity and concentration of the DNA extracted from each sample were measured with NanoDrop One (ThermoFisher, Waltham, MA). Microbial communities in the samples were analyzed for the 16S ribosomal ribonucleic acid (rRNA) gene sequence. The sequence was amplified by the polymerase chain reaction (PCR) using primer sets with the sequencing adaptors 515F (GTGCCAGCMGCCGCGG) and 806R (GGACTACHVGGGTWTCTAAT) (Apprill et al., 2015, Parada et al., 2016). DNA amplicon samples were stored at −20 °C and sent to the Génome Québec Innovation Centre (Montréal, QC, Canada) for barcoding and sequencing on the Illumina Miseq PE250 platform using primer pair 515F/806R. Forward and reverse reads of the raw sequence were paired and screened, and chimera were removed with the “DADA2” algorithm in the QIIME2 pipeline (Callahan et al., 2016). Taxonomy was determined with 99% similarity in the GreenGenes database, version 13_8 (McDonald et al., 2012, Werner et al., 2012).
3. Results and Discussion
3.1. Granule Development and Biomass Characteristics
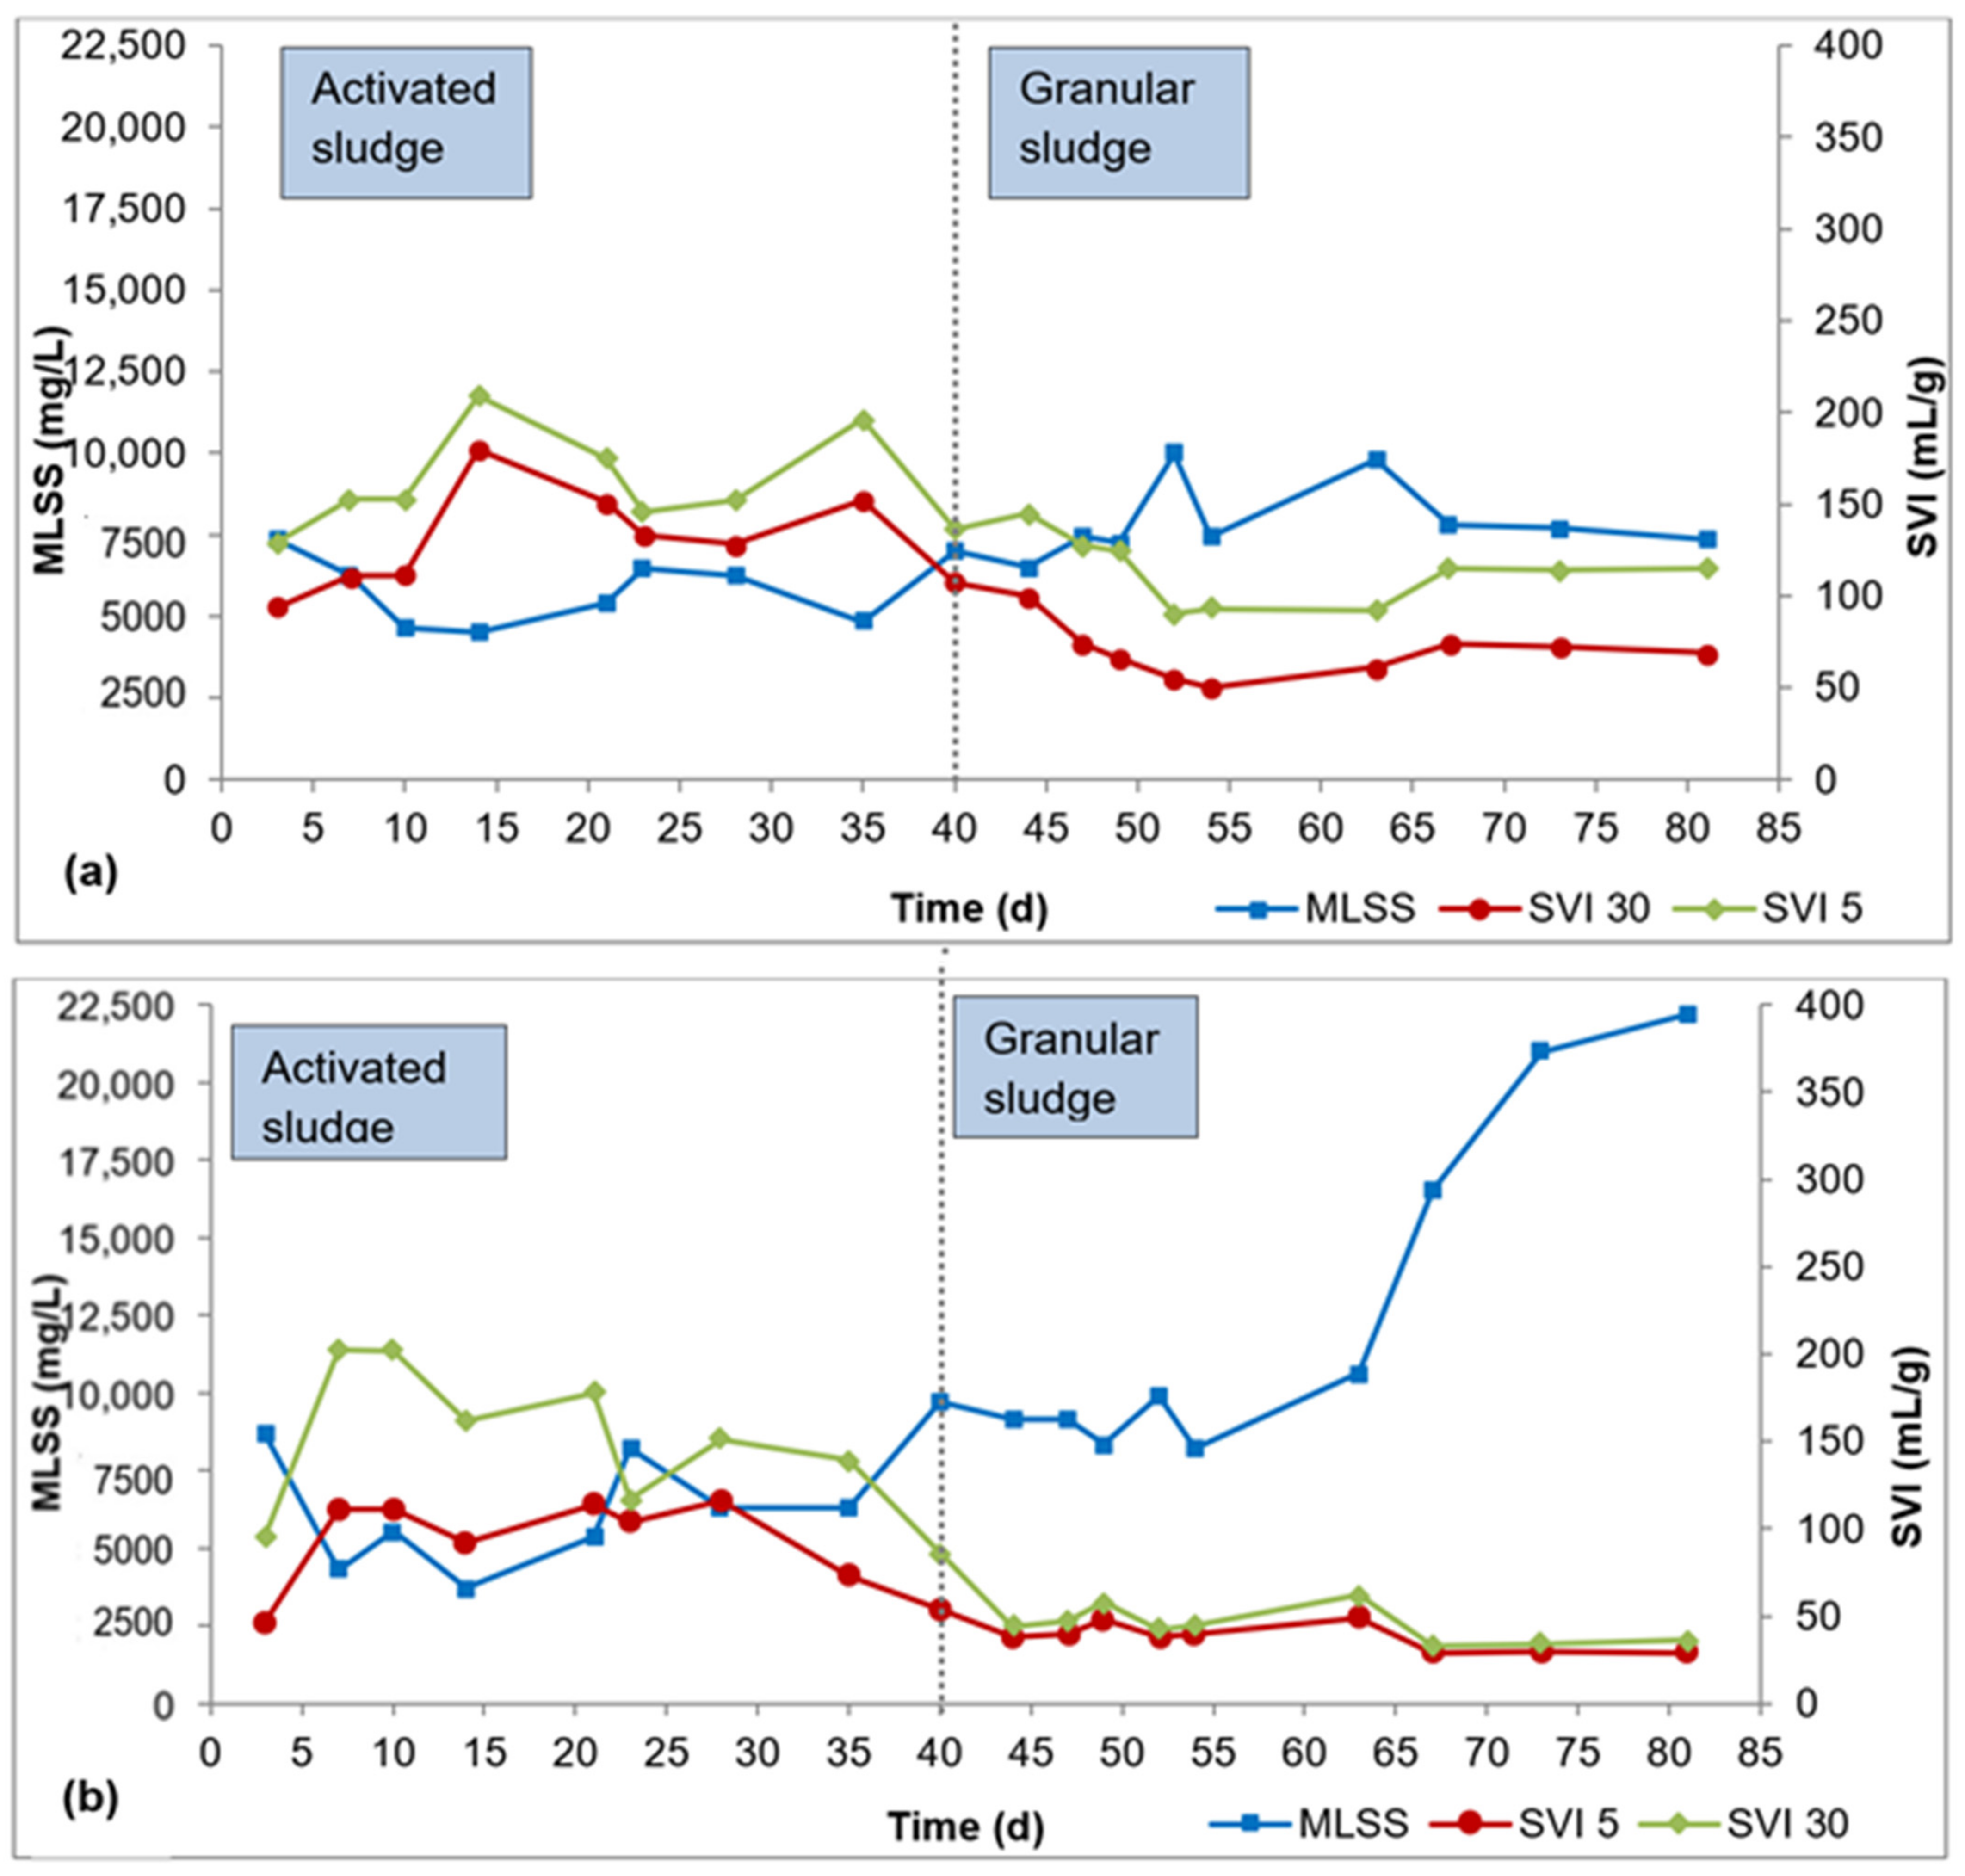
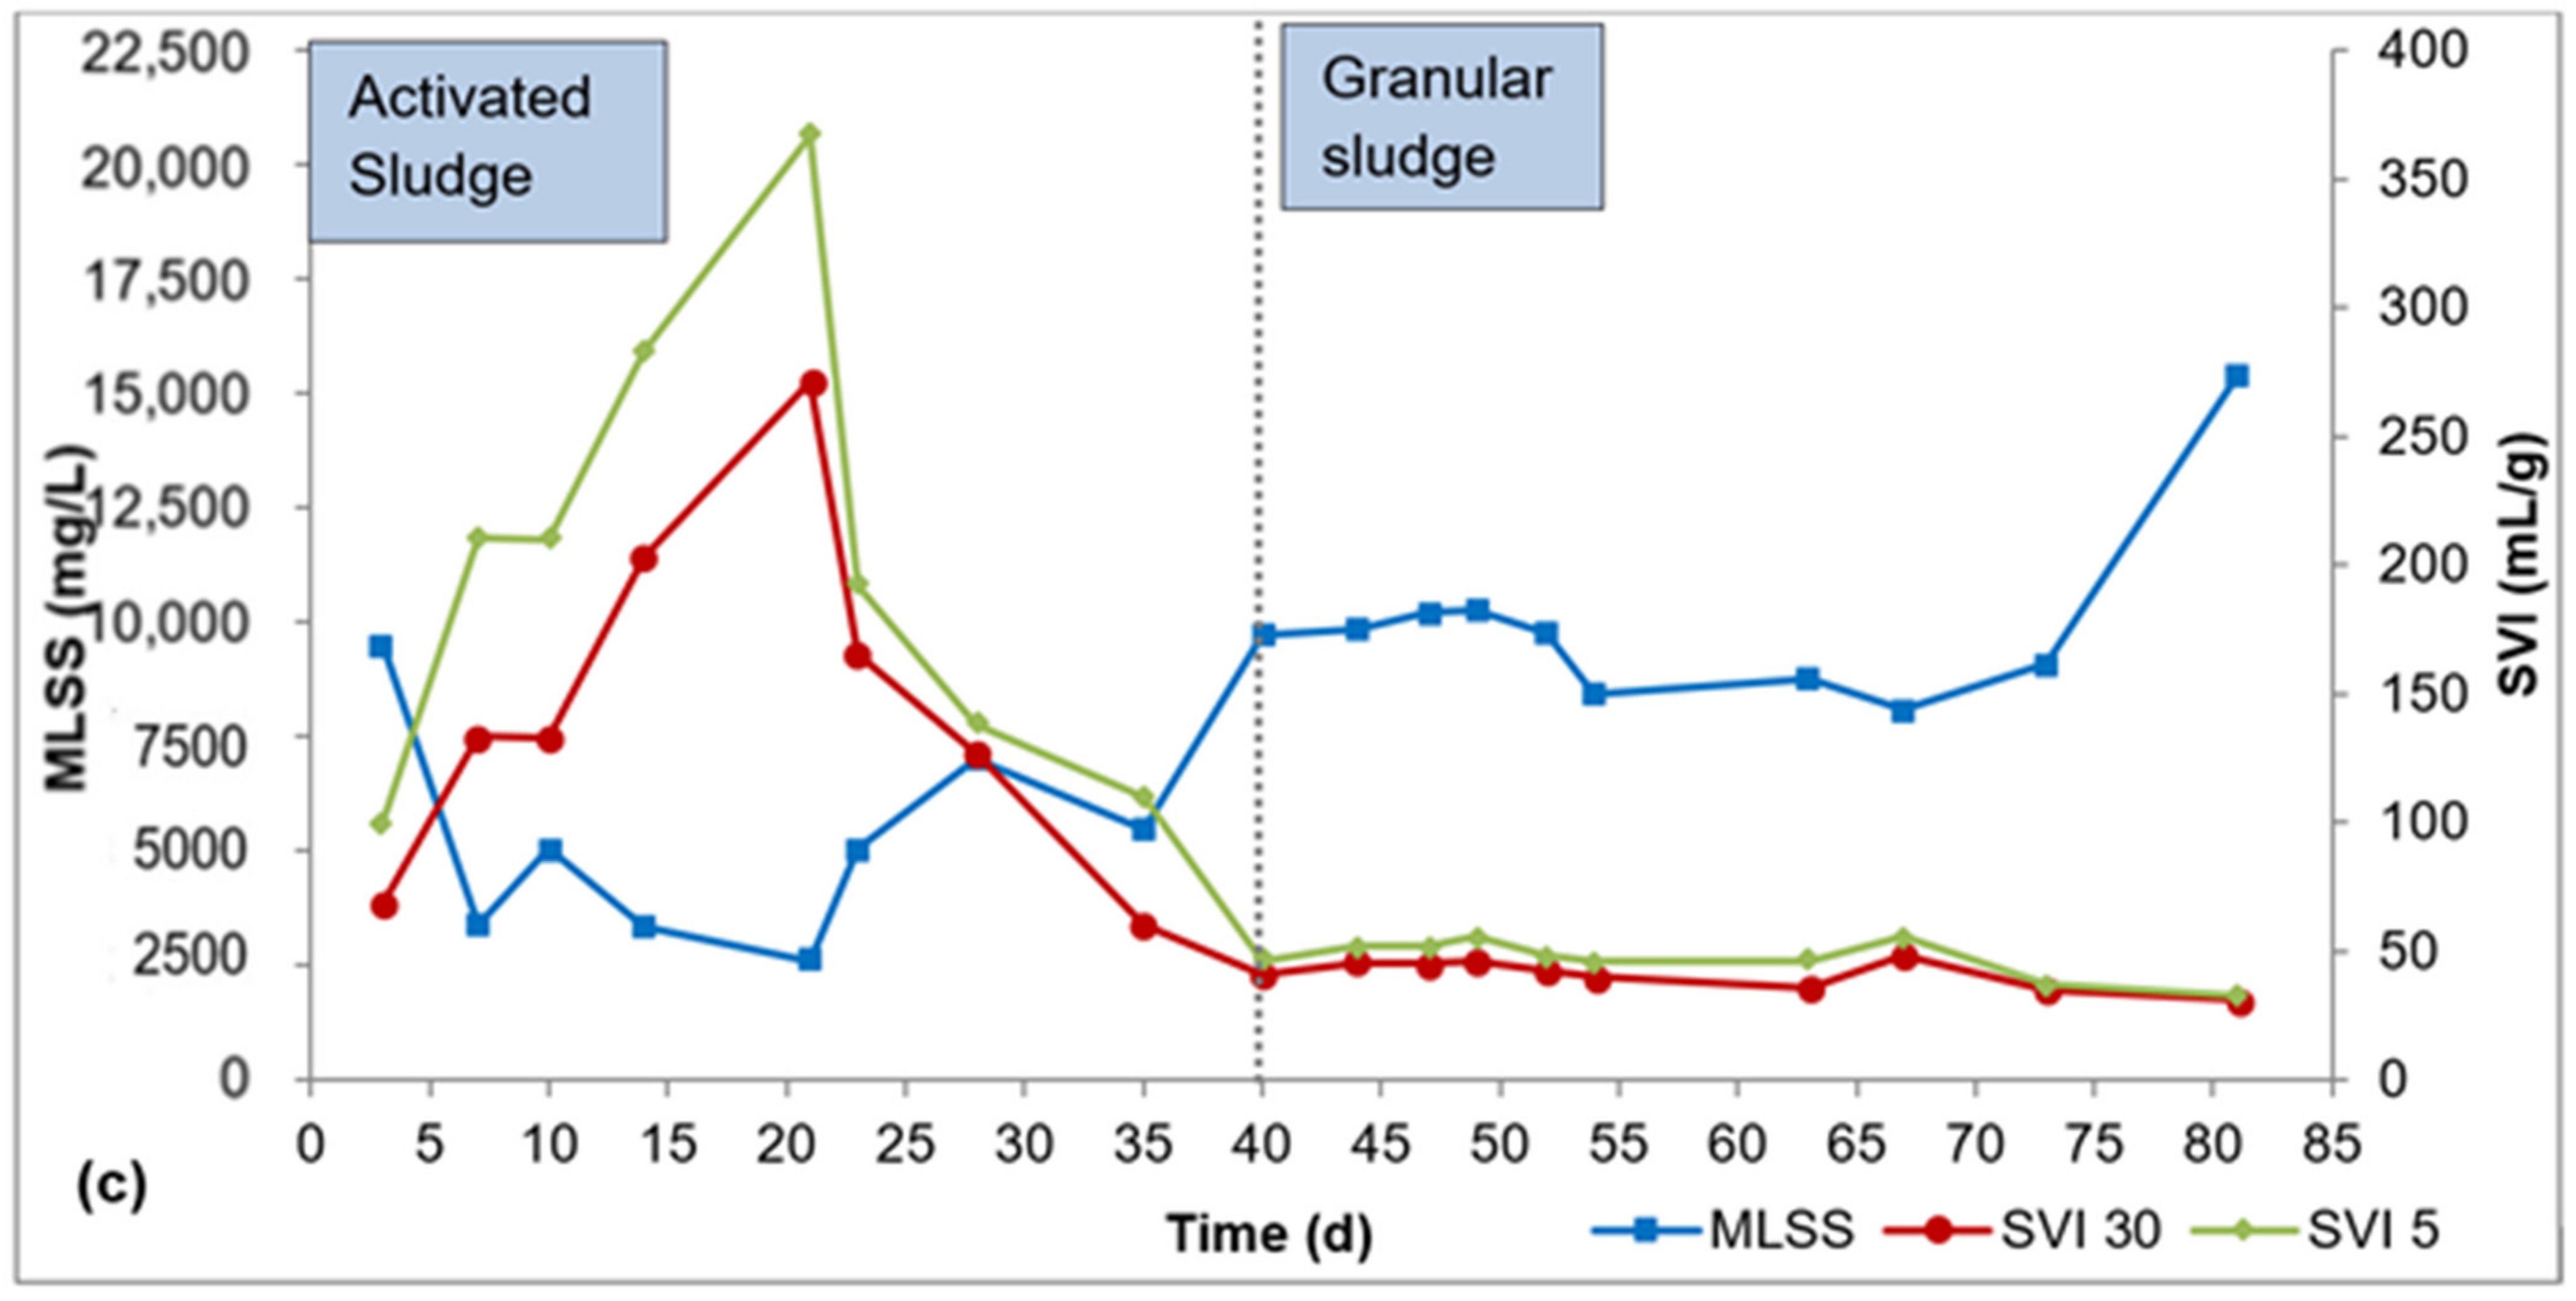
Biomass characteristics for R1, R2, and R3 are presented in Figure 2a–c. It took about 40 d for flocculent sludge to mature to dense granular sludge in all three reactors, as can be seen by the SVI30 values in Figure 2a–c. From this point, the SVI30 values were about 80 mL/g or lower, meeting the requirement for granular sludge. During the AGS maturation phase (day 41–84), the SVI30 was 69 ± 14 mL/g for R1, 38 ± 8 mL/g for R2, and 41 ± 6 mL/g for R3. The SVI5 during this period was 113 ± 18 mL/g for R1, 44 ± 10 mL/g for R2, and 47 ± 8 mL/g for R3. The SVI5 is a great indicator of the quality of granulation—a full granular sludge system is attained when SVI5 is comparable to SVI30 or when SVI30/SVI5 ratio approaches 0.9 (Liu et al., 2010, Nancharaiah and Reddy, 2018). The SVI30/SVI5 ratio ranged from 0.5 to 0.8 for R1, 0.8 to 0.9 for R2, and 0.8 to 1.0 for R3 during the AGS maturation phase. While the SVI30/SVI5 ratio is relatively smaller in R1 compared to R2 and R3, the SVI30 in R1 is 69 ± 14 mL/g is still below the 80 mL/g threshold.
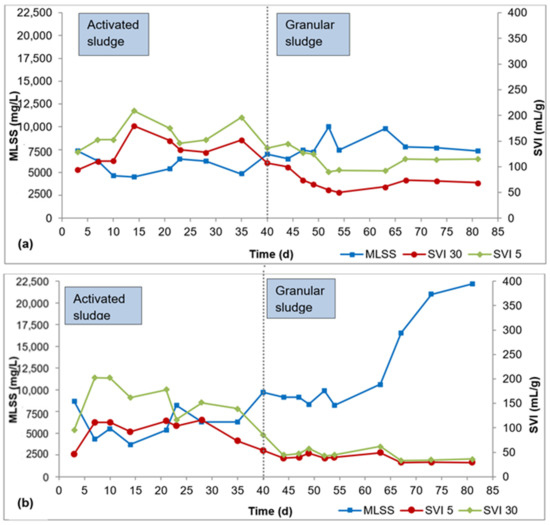
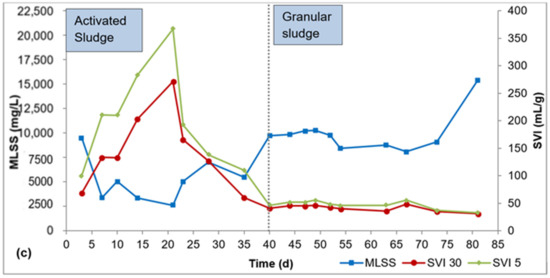
Figure 2.
Profiles of biomass concentration and sludge settleability: (a) R1, (b) R2, (c) R3.
In the AGS maturation phase (day 41–84), the average biomass concentration was 8000 ± 1200 mg/L, 13,000 ± 5600 mg/L, and 10,000 ± 2000 mg/L mg/L in R1, R2, and R3, respectively. AGS bioreactors exhibit very high biomass concentration, in the range 8000–15,000 mg/L, due to the high biomass density and outstanding settleability of the granules [26]. The biomass concentrations obtained in this study all fall within this range. While there are spikes in biomass concentration in R2 (day 67–84) and R3 (day 73–84), these elevated biomass concentrations showed no effect on phosphorus removal.
3.2. Reactor Performance
3.2.1. Profiles of Organic Matter Degradation
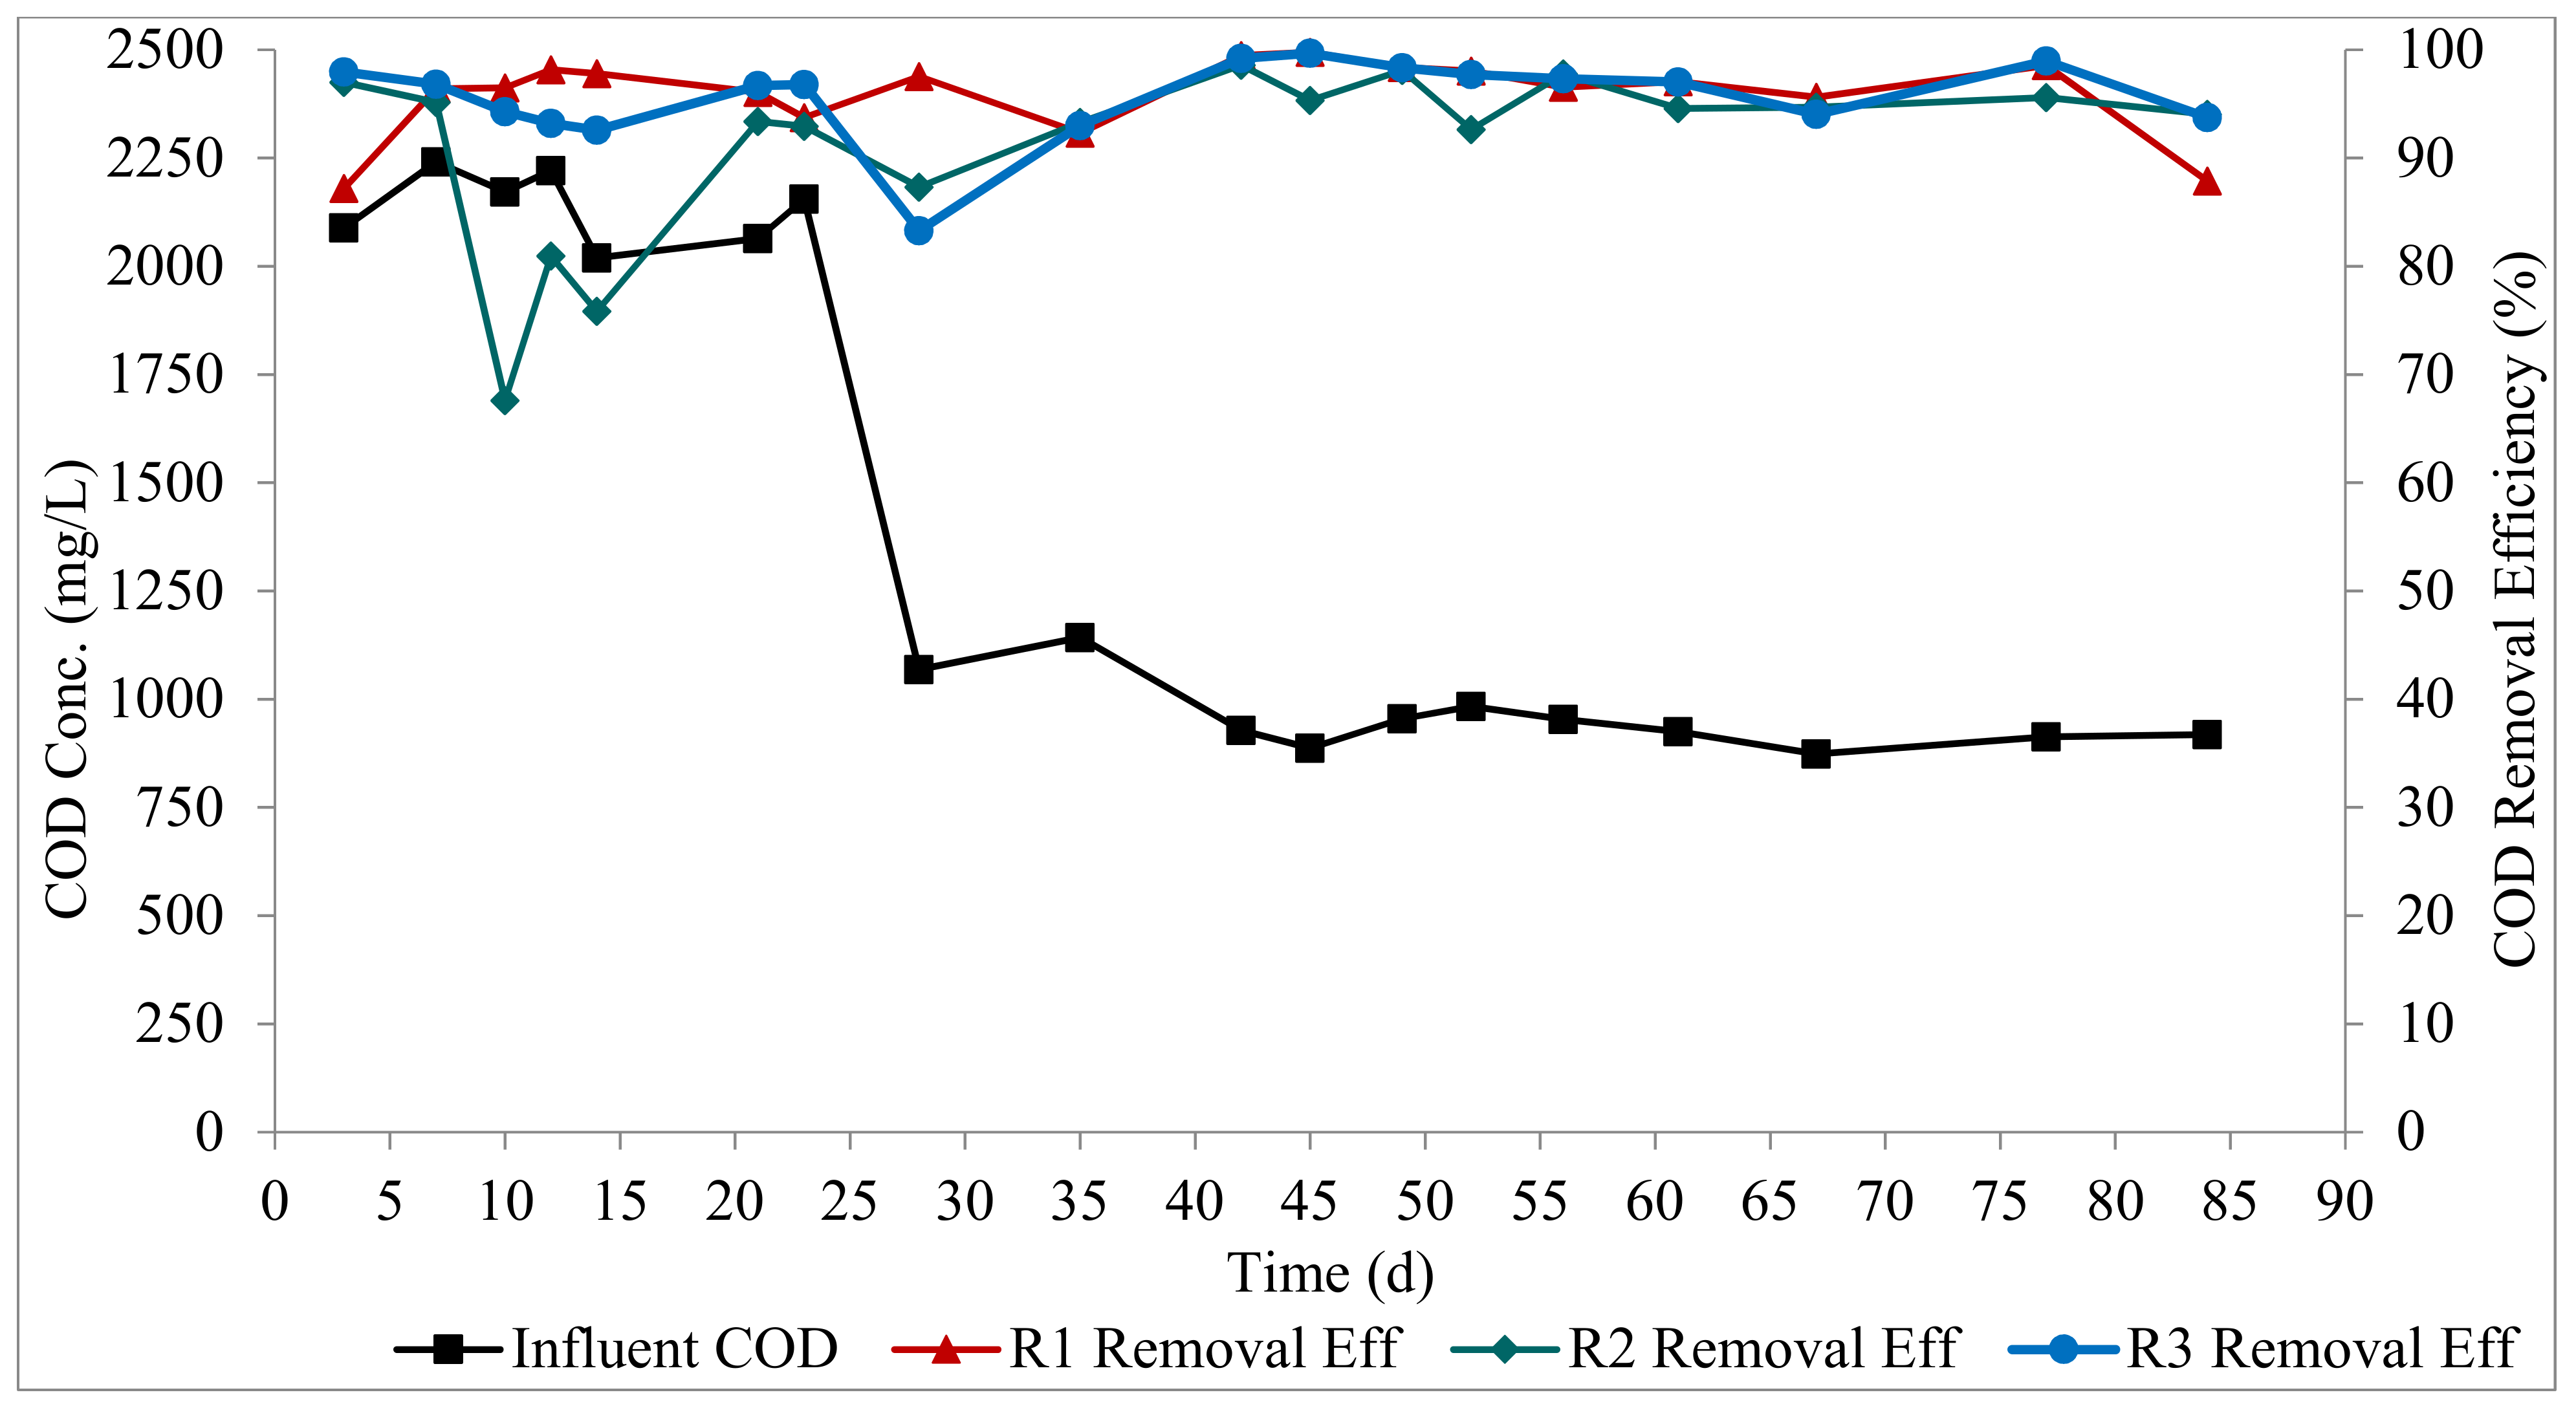
All three reactors exhibited high COD degradation at the steady state, as shown in Figure 3. R1, R2, and R3 had mean removal efficiencies of 96 ± 4%, 95 ± 2%, and 97 ± 2%, respectively. R3 had a longer aeration period compared to the R1 and R2 (54 min longer than the aeration period in R1 and R2), hence the slightly higher COD removal in R3. This implies that the feeding strategy had no impact on COD removal, and the COD concentration did not impact the treatment performance in the reactors. The high COD degradation attained in this study is consistent with other AGS systems used for both municipal and industrial wastewaters [5,27,28]. The high biomass concentration, the dense nature of the AGS, and the good settling properties of the biomass allowed for a high biomass retention, which enhanced the performance of the bioreactors.
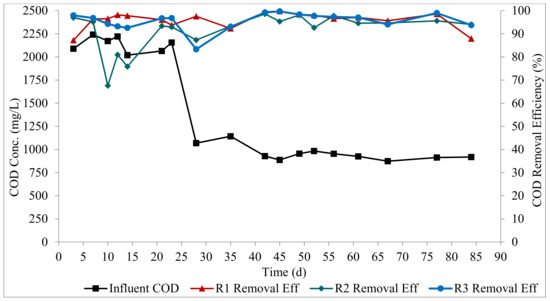
Figure 3.
Profiles of organic matter degradation.
3.2.2. Profiles of Nitrogen Removal
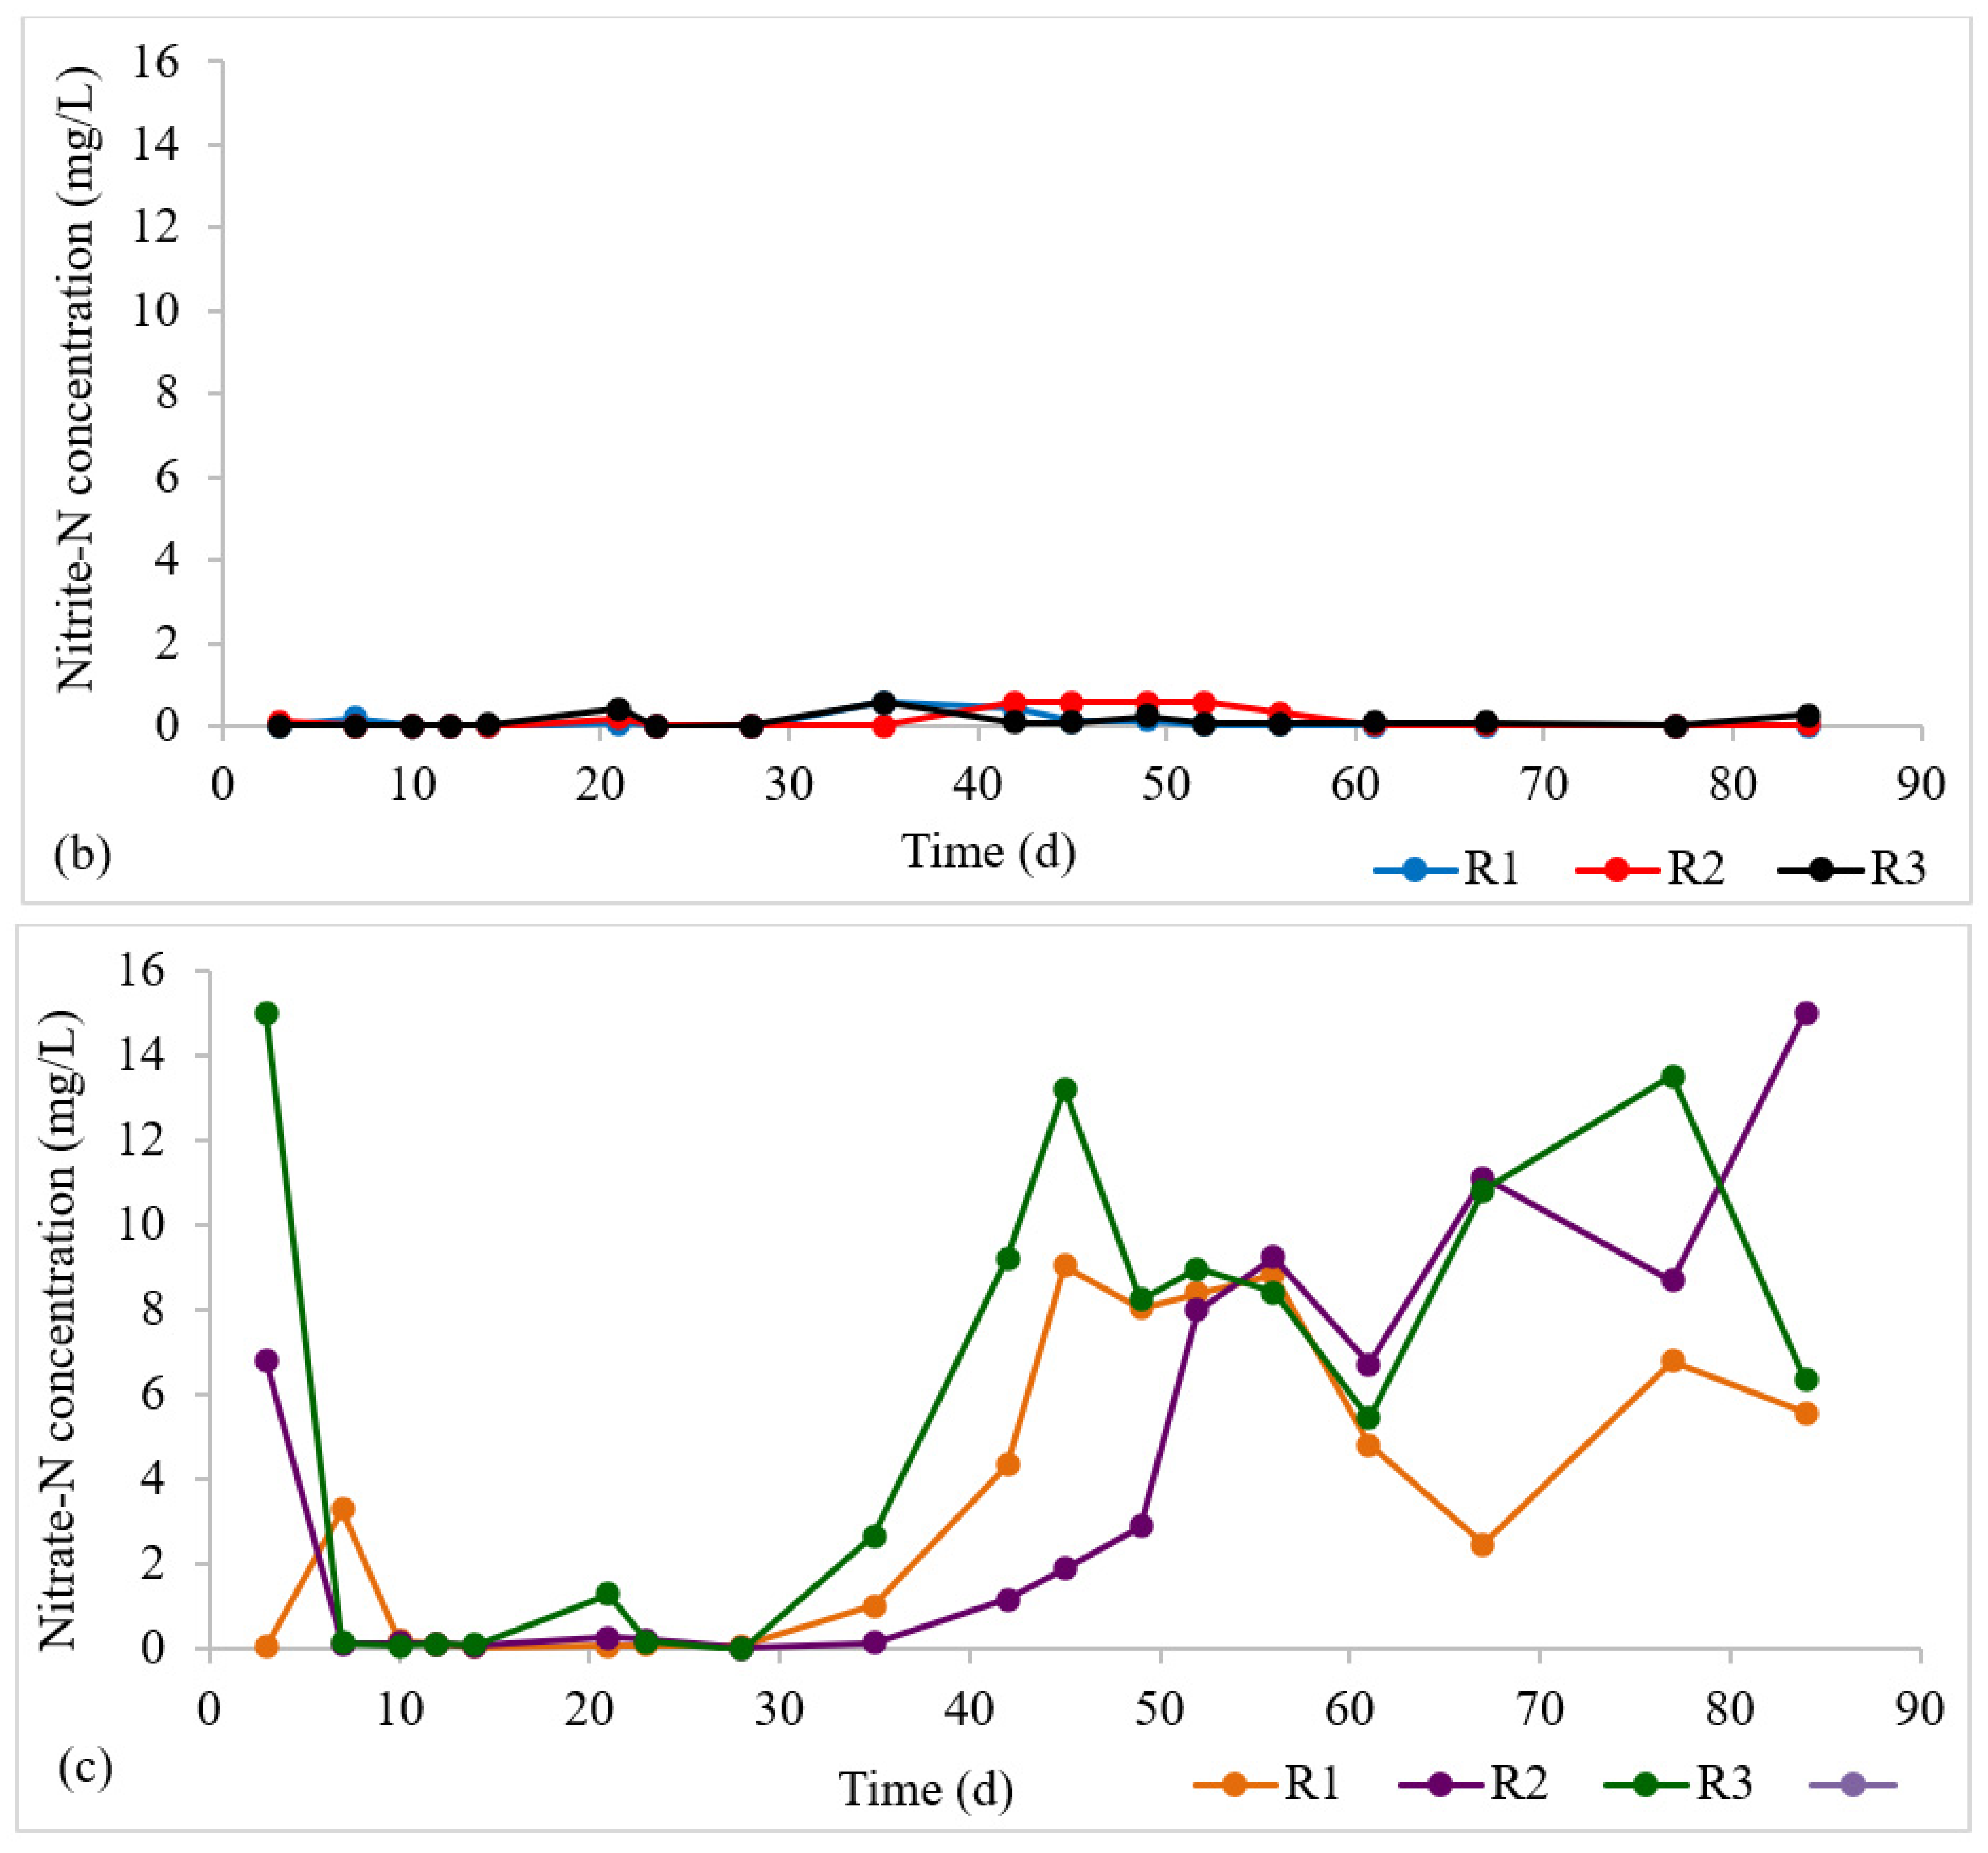
The nitrogen profile in each reactor is presented in Figure 4a–c. At steady state (in the granule maturation phase), ammonia-N removal was 98 ± 3%, 98 ± 3%, and 99 ± 0.6% for R1, R2, and R3, respectively. The high ammonia-N removal indicates the occurrence of nitrification in all three reactors. Nitrite-N exhibited low values across all reactors, demonstrating complete nitrification. This implies that the rate-limiting step for nitrification, that is, the transformation of ammonia to nitrite, was completed, and that the second nitrification step—the conversion of nitrite to nitrate—was also successful. The high retention of nitrifying biomass in AGS [29] facilitates nitrification.
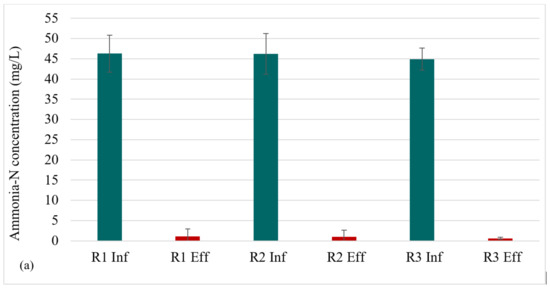
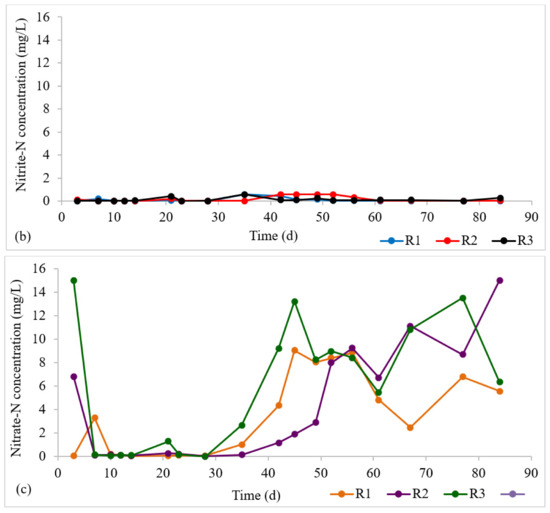
Figure 4.
Profiles of nitrogen removal: (a) NH3-N influent and effluent concentrations at steady state, (b) Effluent NO2-N profile, (c) Effluent NO3-N profile.
Within an aerobic granule, there is a layered structure with an outer aerobic layer (for nitrification) and an inner anoxic zone (for denitrification) [6,30]. Denitrification is normally the limiting step for total nitrogen removal, but an anoxic interior is required [31]. Denitrification seems to have occurred due to this stratified structure. However, there appeared to be nitrate accumulation in all three reactors.
3.2.3. Profiles of Phosphorus Removal
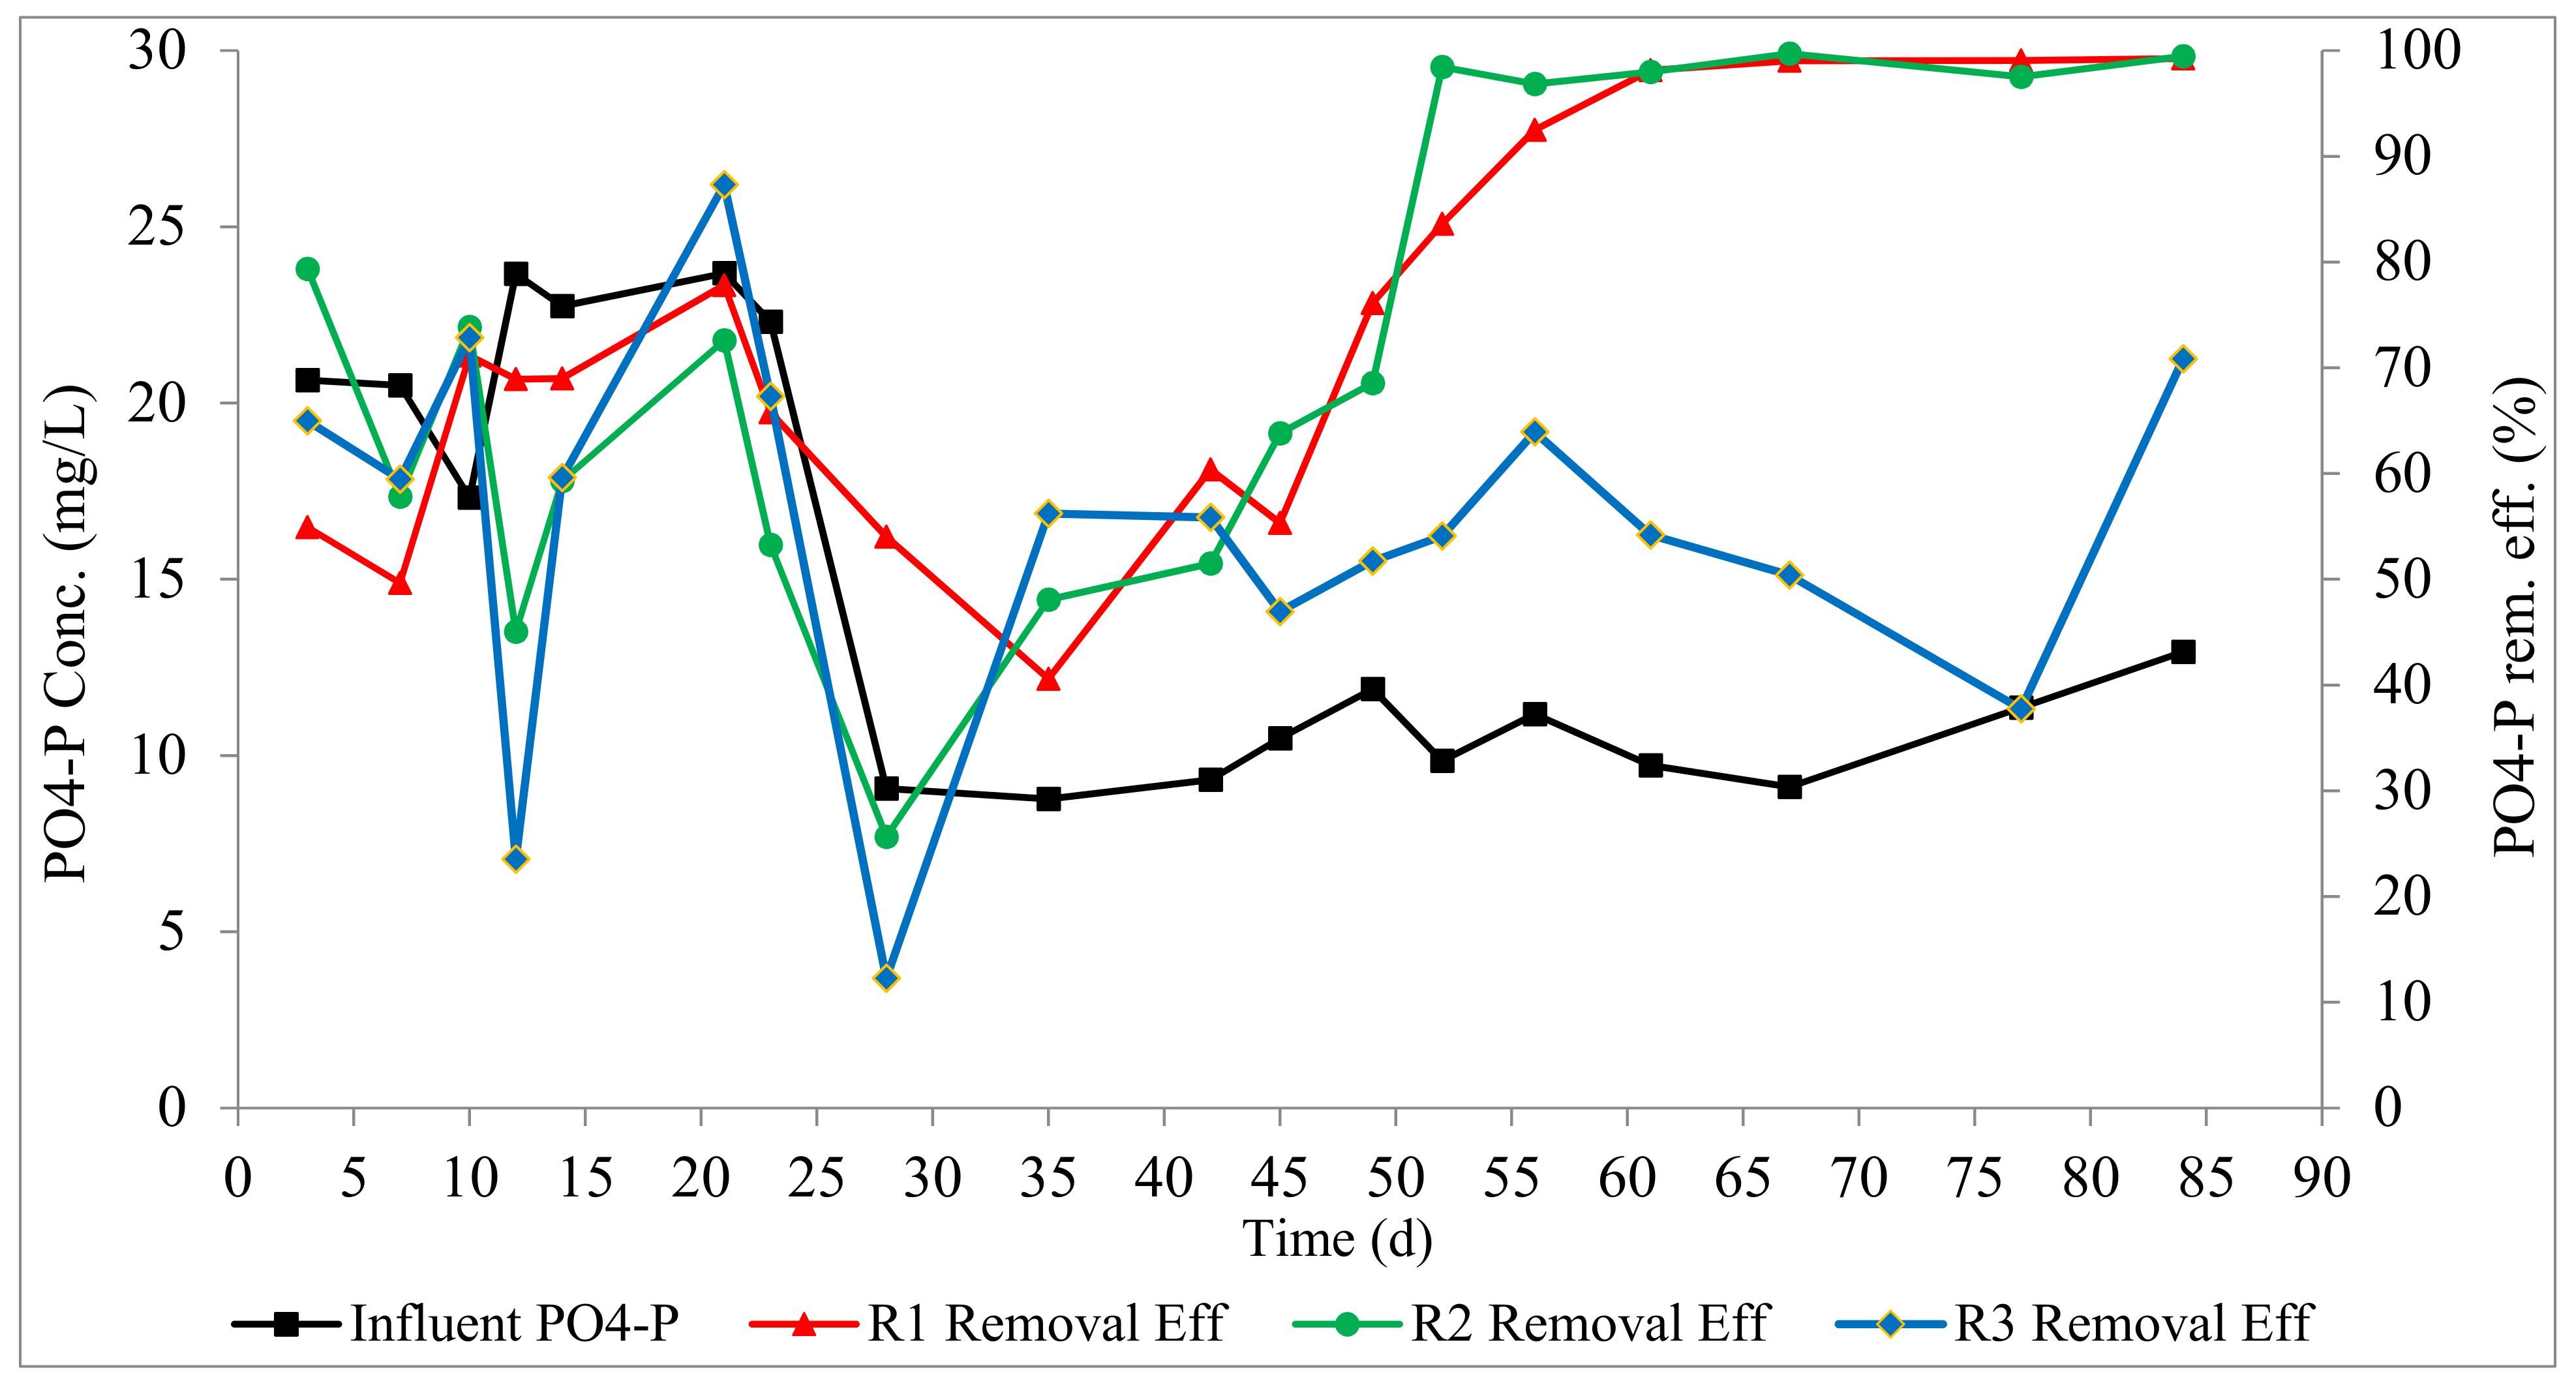
Phosphorus removal profiles are presented in Figure 5. At the steady state, phosphorus removals in R1, R2, and R3 were 97.6 ± 3, 98.3 ±1, and 55 ± 11%, respectively. This shows that the slow anaerobic feeding in R1 and the pulse feeding followed by anaerobic mixing in R2 facilitated the proliferation of PAOs, presenting an opportunity for high phosphorus recovery. High phosphorus removal efficiencies have been reported for AGS systems in the scientific literature [6,14,30]. This is due to the layered structure of the aerobic granule, which provides both aerobic and anaerobic conditions within the granule structure, as a result of oxygen diffusion limitation, which enable EBPR by PAOs. In R1 and R2, there is an anaerobic phase of about 1 h (filling for R1, and filling/mixing for R2) followed by aeration, which provides the desired alternating anaerobic–aerobic conditions in the SBR cycle in addition to the layered structure of the granule. This explains the outstanding phosphorus removal achieved in R1 and R2. High phosphorus removal has been previously reported in AGS systems with an anaerobic phase in the SBR cycle [8,12,29,32]. In R3, there is no anaerobic phase within the SBR cycle, and EBPR was only due to the stratified structure of the granule. The lower phosphorus removal in R3 implies that the stratified structure of aerobic granules (with an aerobic outer layer and an anaerobic core) alone is inadequate to allow anaerobic phosphorus release and potent phosphorus uptake. Low phosphorus removal was previously reported in AGS systems without the anaerobic phase [33]. It can be inferred that both an anaerobic phase and the layered structure of the granule are essential for high phosphorus removal in AGS systems.
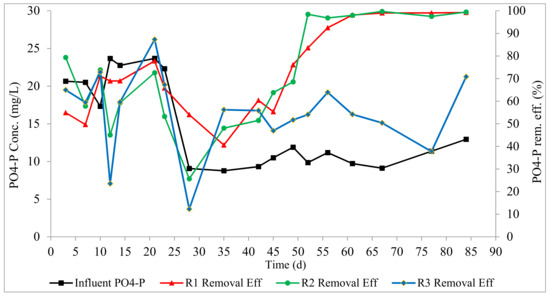
Figure 5.
Profiles of phosphorus removal.
3.3. Specific Phosphorus Release and Uptake Rates
The specific phosphorus release rate (SPRR) for the seed sludge and in R1, R2, and R3 are presented in Table 2 below. The seed sludge used in the reactors had a high SPRR (23.33 mg P/g Vss.h) because it was the return activated sludge from a biological nutrient removal wastewater treatment plant. At steady state, the SPRR changed to 11.51 mg P/g VSS.h, 7.42 mg P/g VSS.h, and 2.60 mg P/g VSS.h in R1, R2, and R3, respectively. These values imply that in the course of granulation, several microbial species increased in relative abundance within the sludge. We conclude that the anaerobic feeding, the pulse feeding, and the anaerobic mixing applied in R1 and R2 were responsible for the high SPRR and the high phosphorus removal.

Table 2.
SPRR and SPUR values for seed sludge and granular sludge in R1, R2, and R3 at steady state.
The specific phosphorus uptake rate (SPUR) in the seed sludge was −12.83 mg P/g Vss.h. At steady state, the SPUR changed to −9.79 mg P/g VSS.h, −7.05 mg P/g VSS.h, and −0.55 mg P/g VSS.h in R1, R2, and R3, respectively. Similar to the SPRR values, the SPUR values imply that some microbial species increased in relative abundance in the course of granulation. R3, with the lowest SPUR, had no anaerobic phase to allow for PAOs. Therefore, R3 had a low phosphorus uptake. R1 and R2 exhibited high SPUR values because the feeding phase was anaerobic.
3.4. Phosphorus Distribution in the Sludge
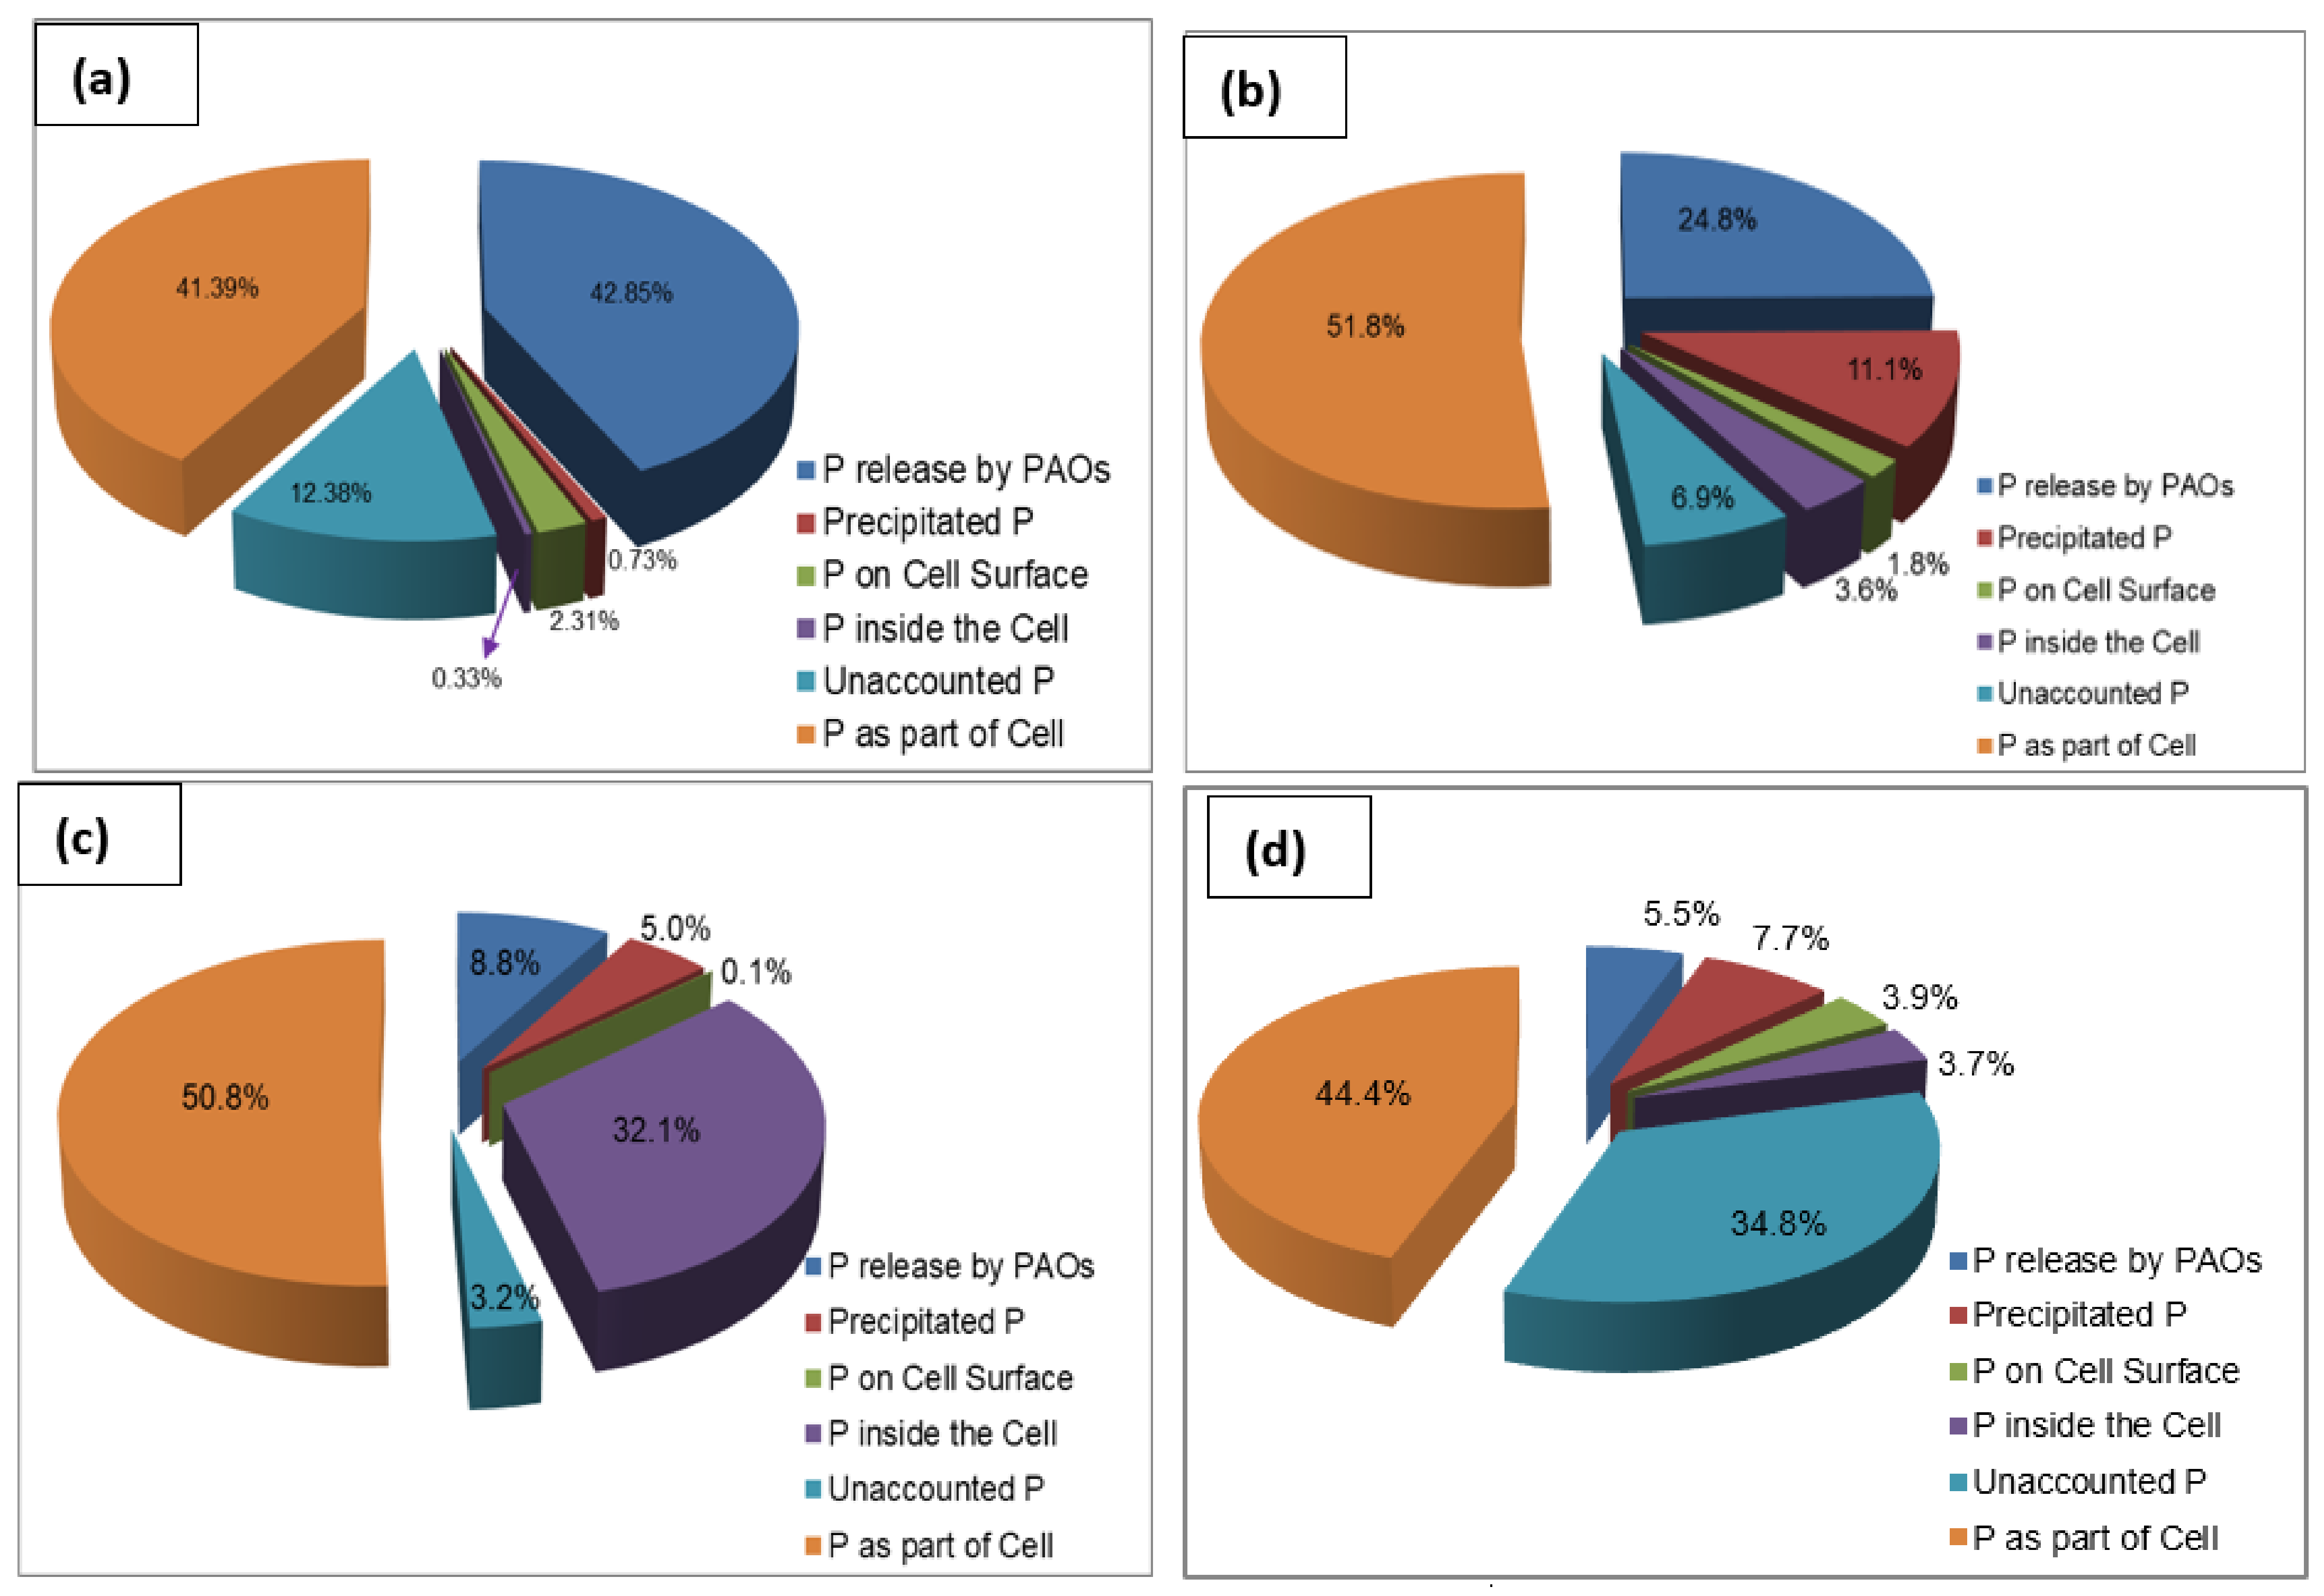
Figure 6a–d shows the phosphorus distribution in the biomass of the wastewater treatment plant seed sludge and in the R1 sludge, the R2 sludge, and the R3 sludge at the steady state condition. Similar to the rates of phosphorus release and phosphorus uptake reported in Section 3.3, the percentage of phosphorus released by PAOs decreased in the course of sludge granulation. The percentage of P released by PAOs decreased from 42.8% in the seed sludge to 24.8%, 8.8%, and 7.2% in R1, R2, and R3, respectively. This indicates that there was a change in the microbial composition in the sludge in the course of granulation from flocculent sludge to granular sludge. Similarly, the percentage of precipitated P increased from 0.73% in the seed sludge to 11.1%, 5%, and 10% in R1, R2, and R3, respectively. This indicates that the granular sludge matrix encapsulated precipitated phosphorus, whereas the seed sludge, with no granule structure, could not encapsulate precipitated phosphorus.
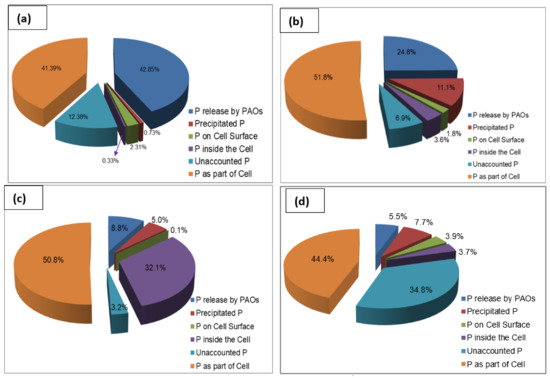
Figure 6.
Phosphorus distribution in the sludge: (a) seed sludge, (b) R1 sludge at steady state, (c) R2 sludge at steady state, (d) R3 sludge at steady state.
3.5. Microbial Analysis
3.5.1. Shift of Microbial Communities
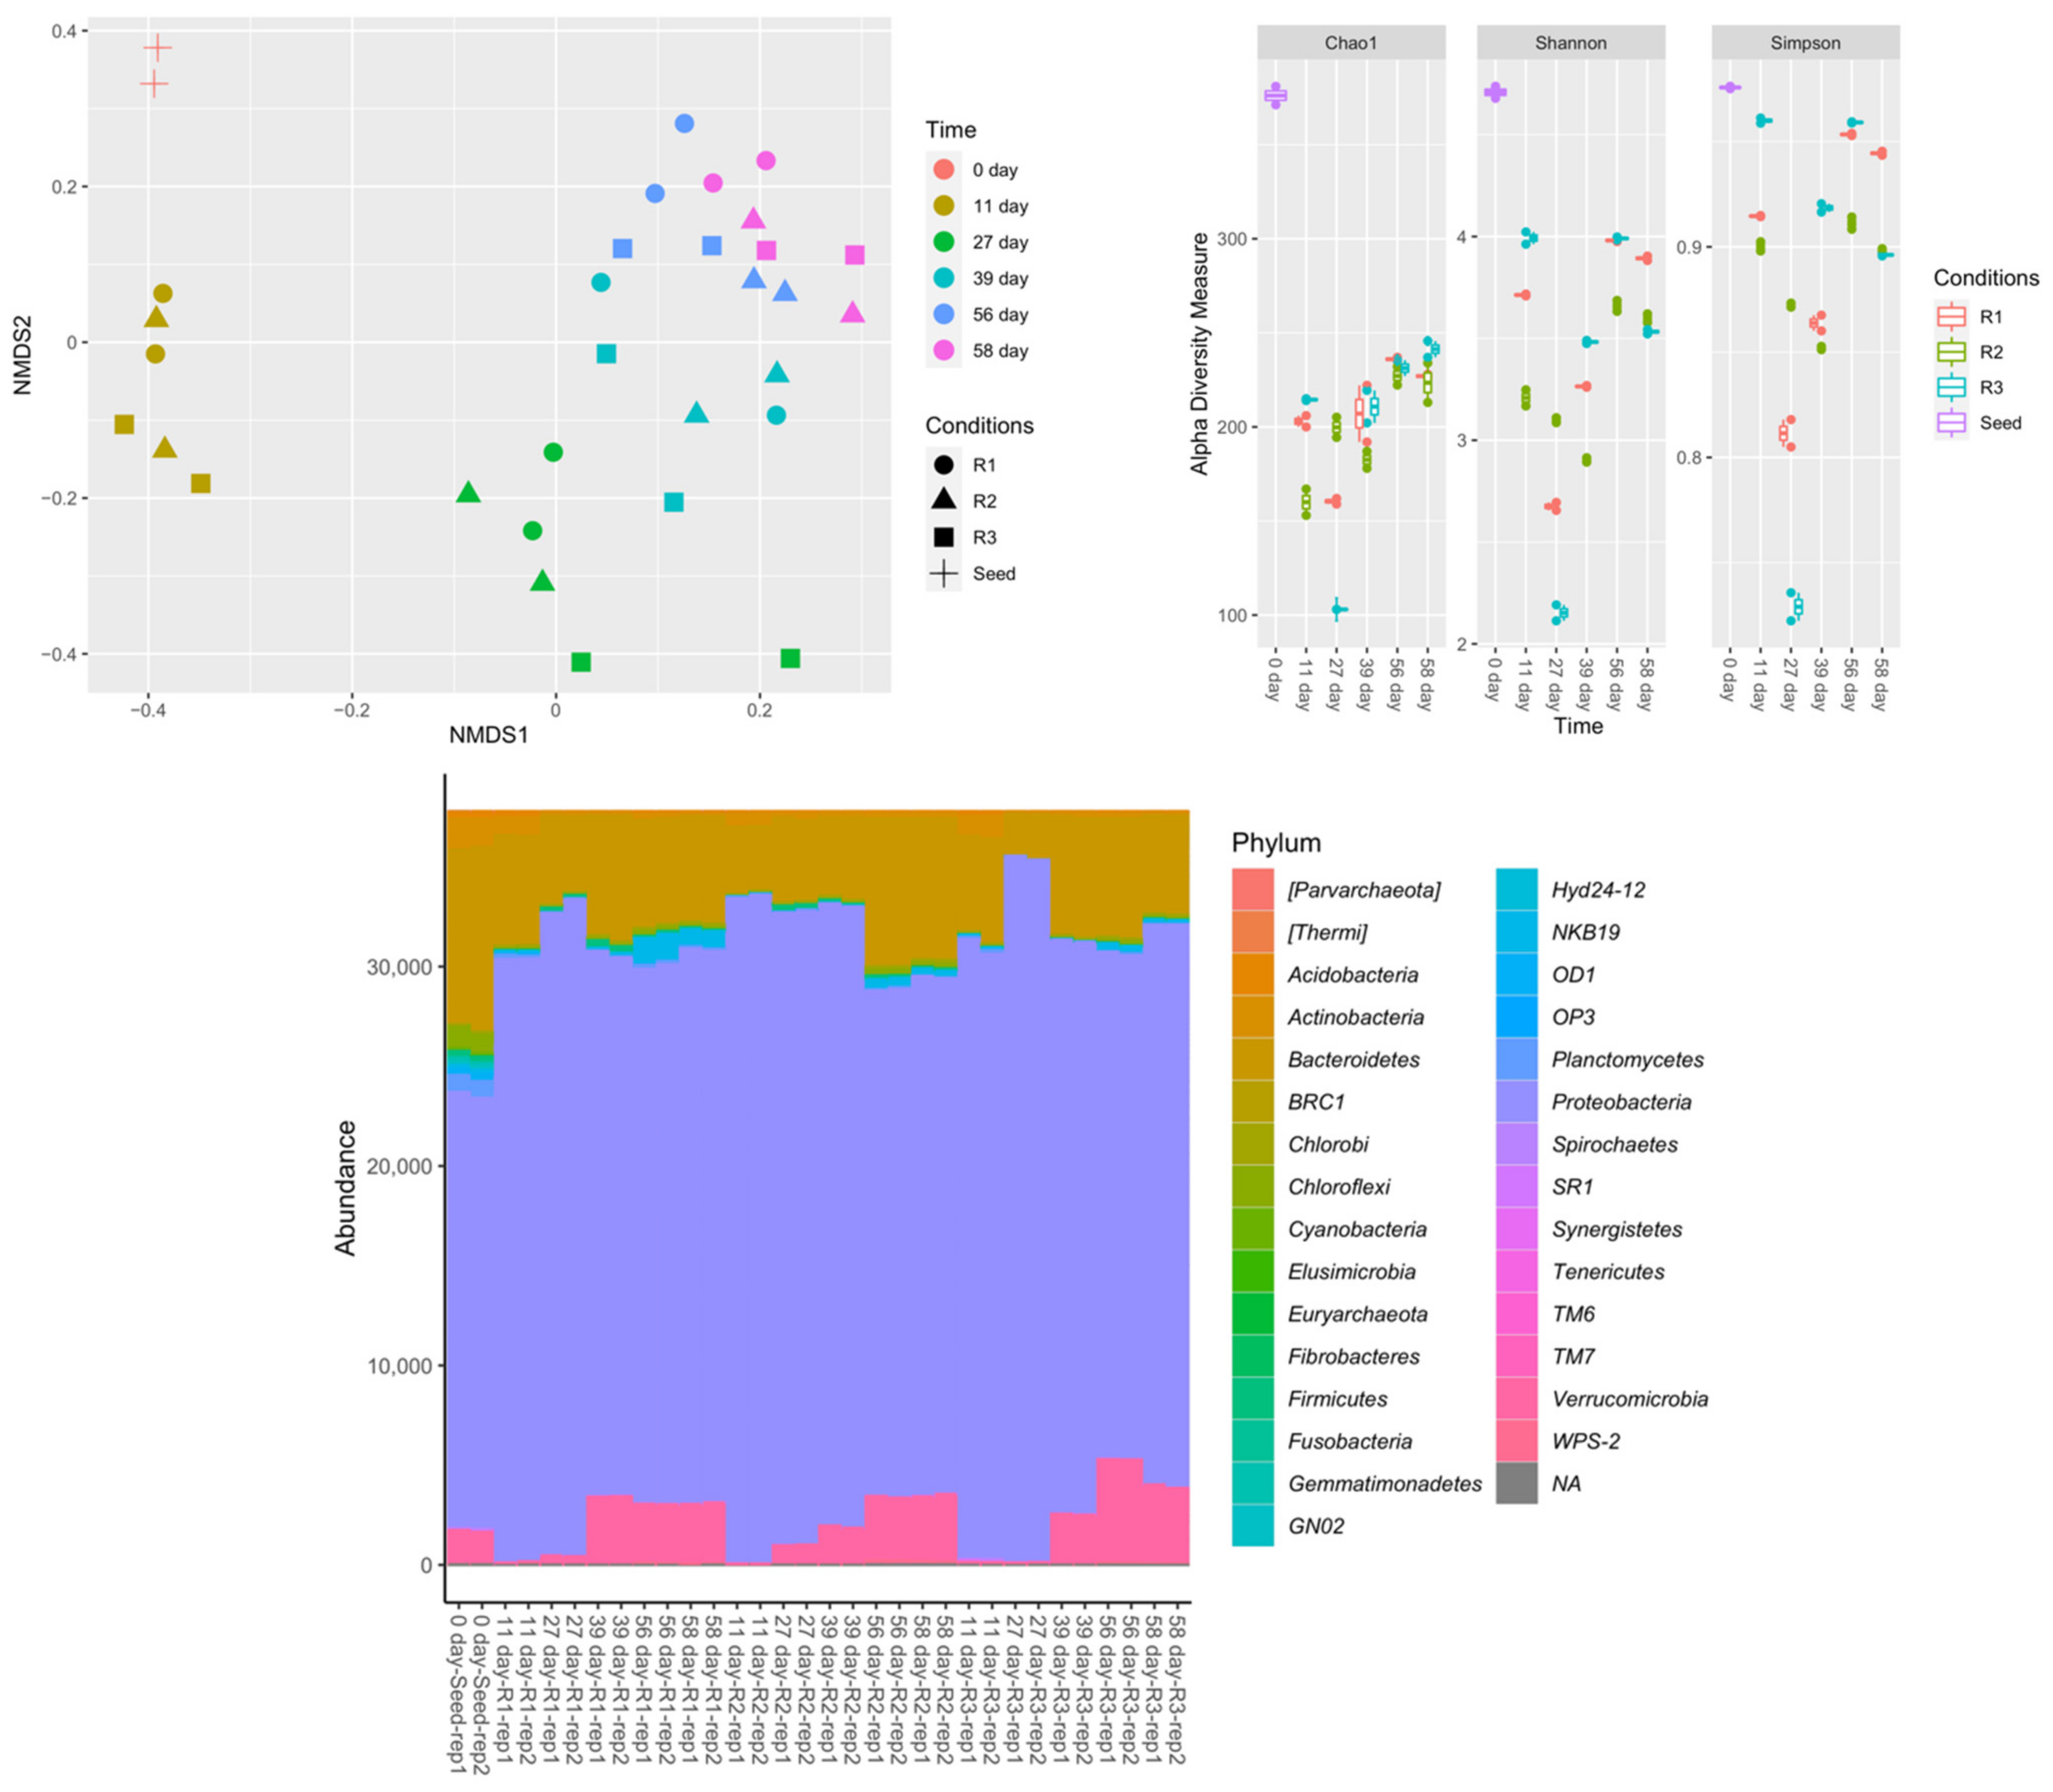
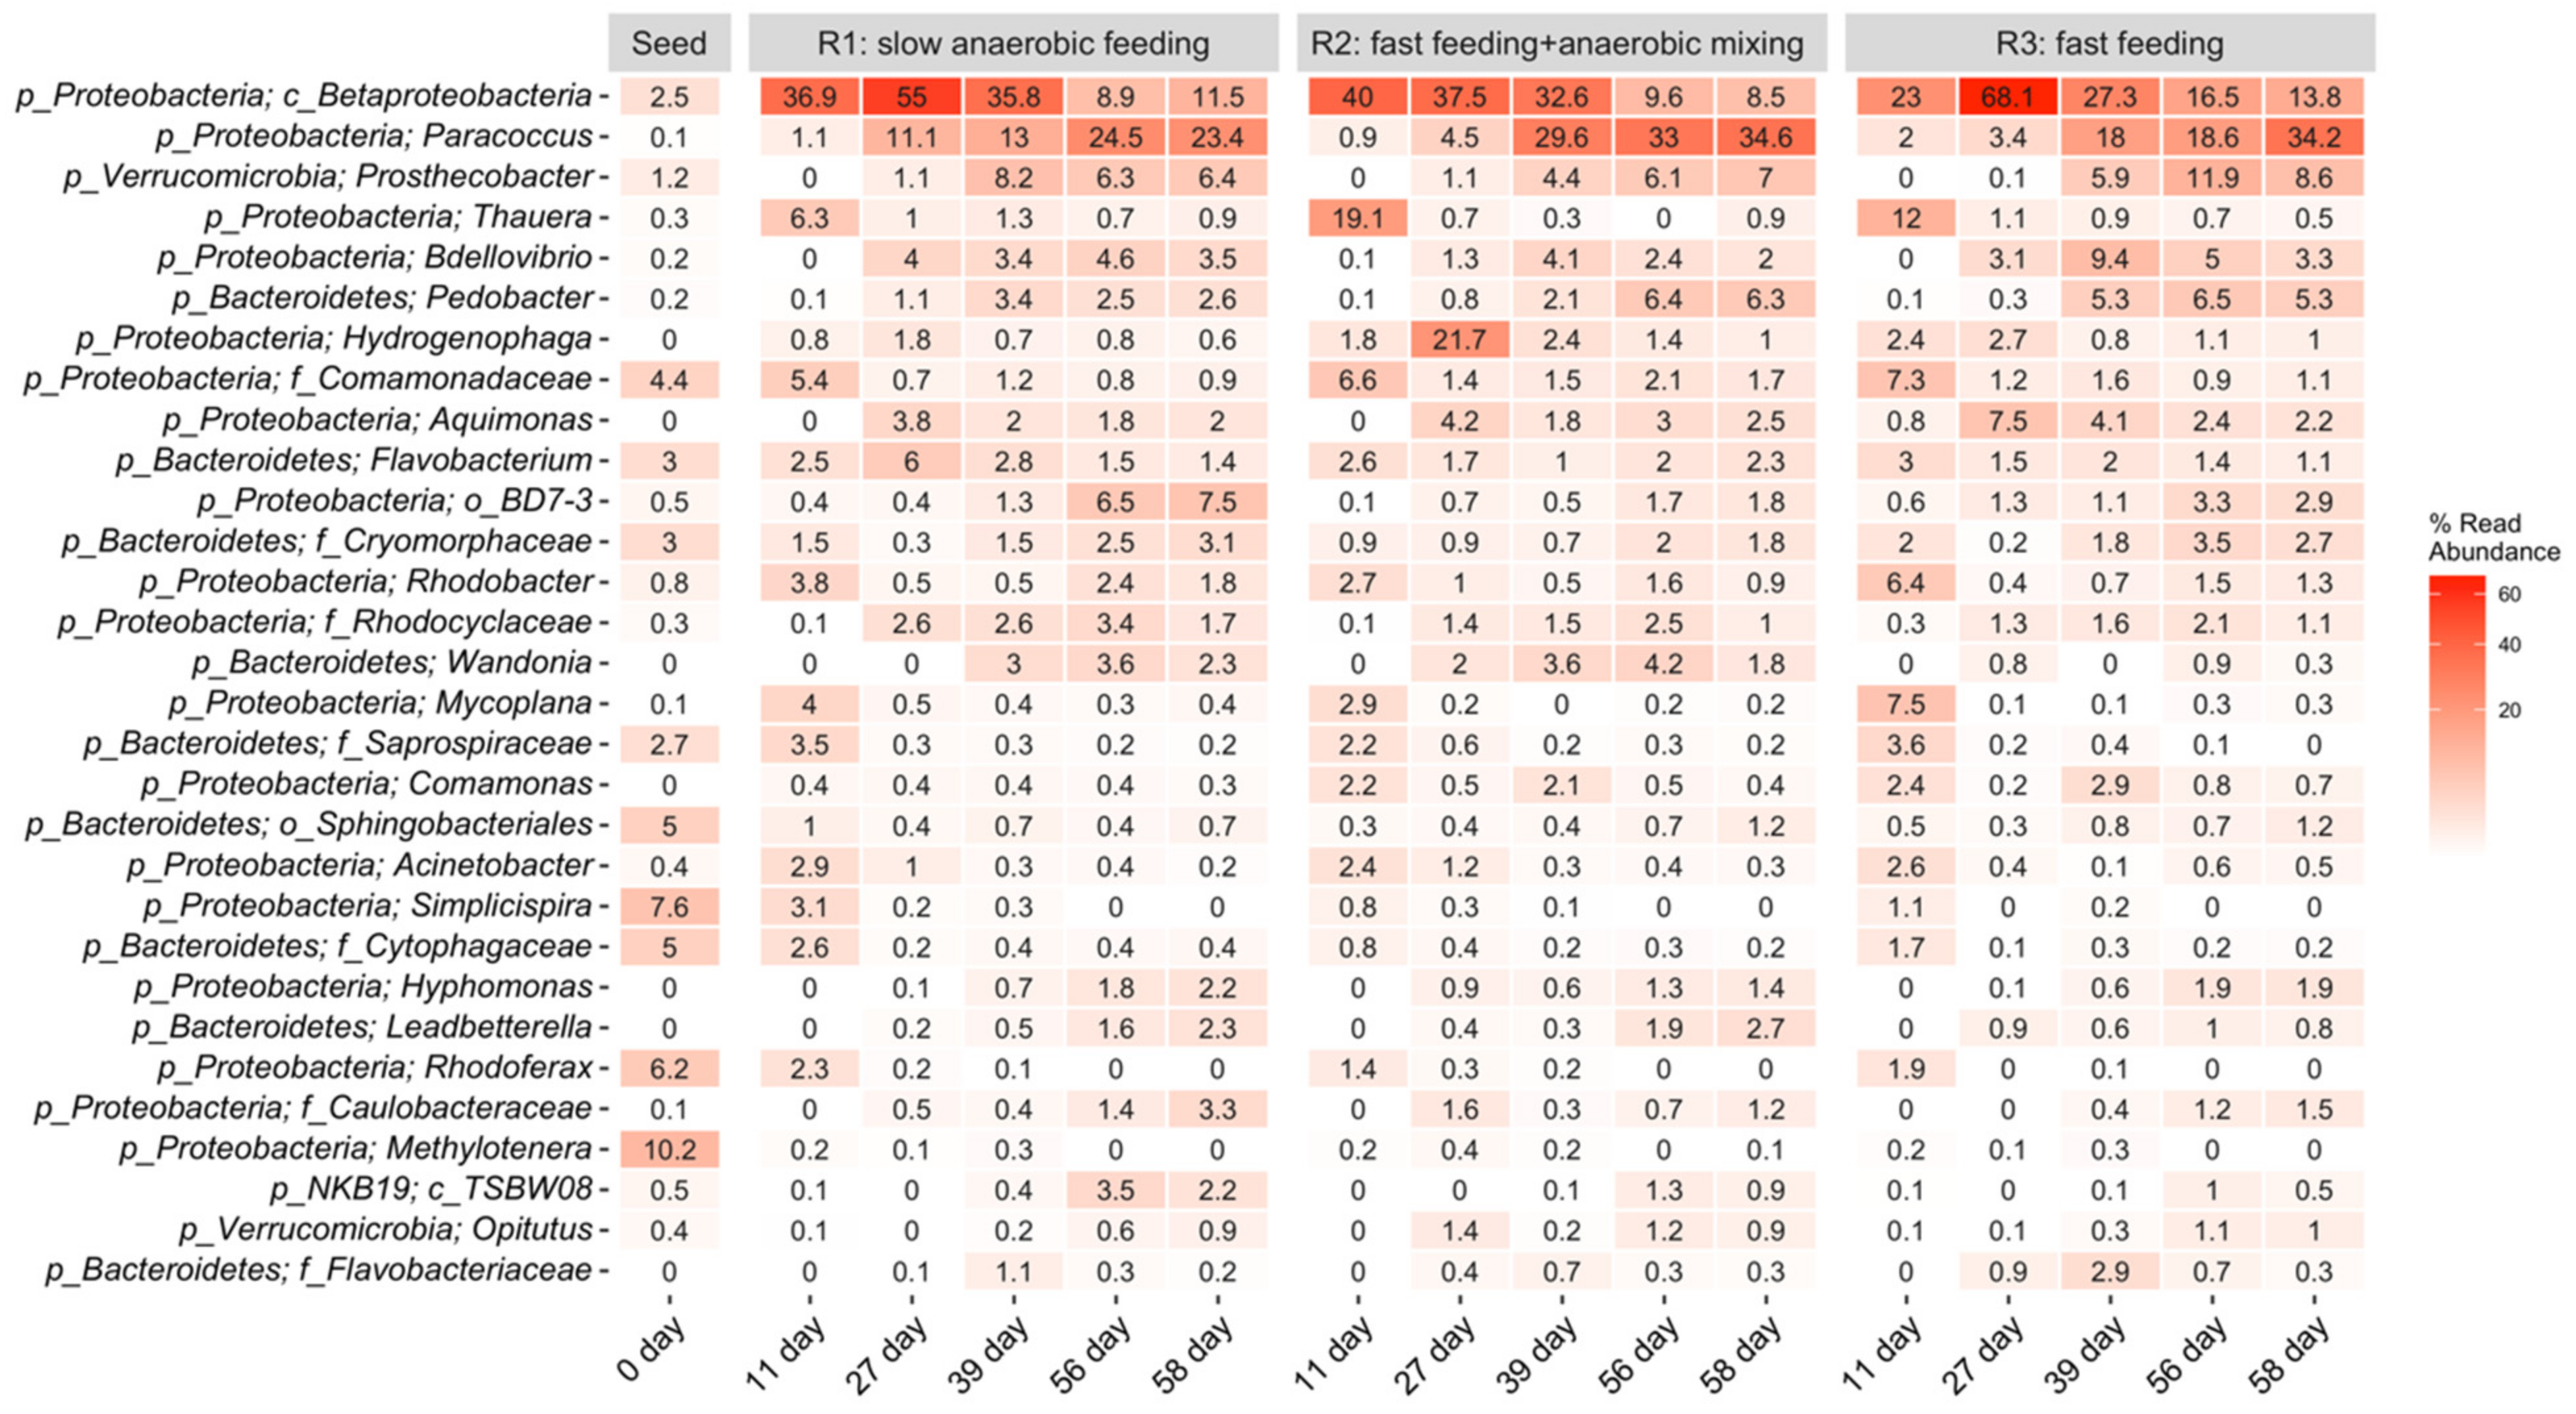
Nonmetric multidimensional scaling (NMDS) plots, alpha diversity measurements, and phylum-level classifications under the different operating conditions are presented in Figure 7. NMDS analysis suggested that microbial composition differed more with respect to sampling time than with respect to feeding strategy. The seed sludge had the highest microbial diversity. The microbial diversity decreased in the first 27 days of reactor operation, then increased. This transition was depicted at the phylum level. Proteobacteria increased significantly across all feeding conditions. Firmicutes and Verrucomicrobia increased at least four times in R1 and R2. At the last sampling point, the phyla distribution was similar in all reactors, consistent with the results obtained for biomass concentration. Figure 8 shows the dominant amplicon sequence variants (ASVs) in the microbial community, indicating an apparent microbial shift. In the seed sludge, the dominant ASVs belonged to Methylotenera, Simplicispira, and Rhodoferax genera, which decreased over time in all three reactors. In contrast, several ASVs of Paracoccus, Prosthecobacter, and Pedobacter genera, and unclassified genera from the class Betaproteobacteria, increased.
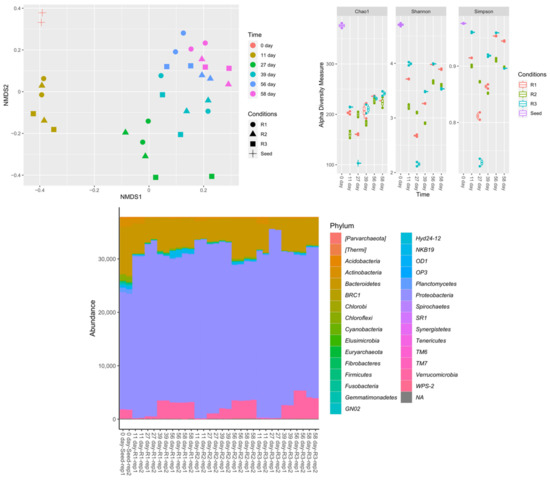
Figure 7.
Nonmetric multidimensional scaling (NMDS) plots, alpha diversity measurements, and phylum-level classification with a rarefied-even-depth function of 95% of the minimum sum of amplicon sequence variants (ASVs) for samples under different conditions.
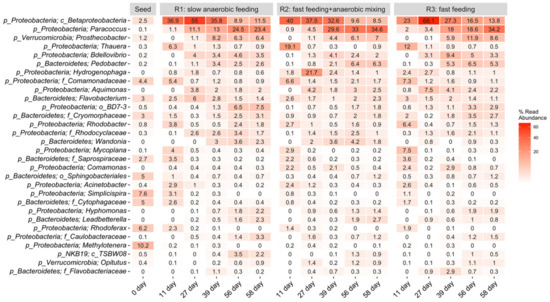
Figure 8.
The 30 most abundant ASVs (by means of the replicates) classified to the lowest taxonomic rank (majority are genus, shown with phylum) across all samples. p_, c_, and f_ represent phylum, class, and family, respectively.
3.5.2. Distribution of the Microbial Profile
The dominant ASVs in all three reactors, each treated with a different feeding strategy, comprised the class of Betaproteobacteria, (29–35.84%) in R1, (25.7–32.6%) in R2, and (29.8–23%) in R3. Betaproteobacteria are in a class that belongs to the phylum Proteobacteria, the members of which have extreme metabolic diversity and are the most important, and often the most dominant, of the PAOs in lab-scale reactors and in full-scale wastewater treatment facilities [2,34,35,36]. The consistent increase in the relative abundance of Proteobacteria phylum during the stabilization phases in R1, R2, and R3, suggests quick adaptation of the microbes to the operating condition and also indicates that the operational conditions had insignificant effect on diversity and abundance of the microbial communities. This finding agrees with the result of Wang et al. [37], who reported an increase in the relative abundance of phylum Proteobacteria in AGS reactors under both continuous and alternating aeration conditions. Xu et al. [38] also reported an increase in the relative abundance of Proteobacteria during granulation in a continuous-flow integrated oxidation ditch AGS system with two-zone clarifiers. The second most abundant bacteria in the three reactors were Paracoccus: 1.1–24.5% in R1, 0.9–34.6% in R2, and 2–34.2% in R3. Paracoccus are denitrifiers with the ability to use both oxygen and nitrogenous oxides. This enables them to survive in aerobic or anaerobic conditions, which explains their ongoing abundance in all three reactors. Paracoccus are well known for their denitrification and phosphorus removal capabilities [39,40]. Thauera were identified at 6.3% in R1, 19% in R2, and 12% in R3 on day 11, and decreased after that. Thauera are anaerobic, facultative denitrifying bacteria with versatile metabolic potentials, including the ability to remove nitrogen, nitrates, nitrites, and phosphorus from the reactors [41,42]. Hamza et al. [41] reported a decline in the relative abundance of Thauera upon reactor stabilization. Proteobacteria belonging to the Bacteroidetes and Verrucomicrobia phyla that have been reported in AGS bioreactors were present in small amounts in our reactors; their slow growth provided a low competitive advantage. Proteobacteria thrive better than Bacteroidetes and Verrucomicrobia in an anaerobic environment [43]. Several investigators have reported Proteobacteria and Bacteroidetes as the predominant phyla in AGS systems, and these phyla include a number of important functional bacteria comprising of Rhodobacter, Bdellovibrio, and Rhodocyclaceae, which play important roles in AGS granulation. For instance, Rhodocyclaceae, an EPS-secreting microbe, has denitrification potential as well. EPS secretion promotes self-aggregation of flocculent sludge needed in granulation and also contributes to maintaining the operational stability of the AGS system [44]. Rhodobacter also acts as a stabilizer, but possesses denitrification abilities. Proteobacteria and Bacteroidetes bacteria have the ability to degrade carbon, including recalcitrant organic carbon, nitrogen, and phosphorus [37]. Some less-known bacteria such as Wandonia and Hyphomonas were observed to consistently increase in the three reactors, thus, their identification and characterization should be the focus of future work.
Predominant bacterial families present in R1, R2, and R3 included: Comamonadaceae—0.7–5.4% in R1, 1.4–6.6% in R2, 0.9–7.3% in R3 and Saprospiraceae—0.2–3.5% in R1, 0.2–2.2% in R2, and 0–3.6% in R3. Comamonadaceae and other bacterial families within the Proteobacteria phylum are commonly involved in nitrification and denitrification (Adav et al., 2010), while members of the Saprospiraceae family are acetotrophic denitrifiers [43]. Rhodobacter—0.5–3.8% in R1, 0.9–2.7% in R2, and 0.4–6.4% in R3—are known to accumulate phosphorus during denitrification [45]. Acinetobacter—0.2–2.4% in R1, 0.3–2.4% in R2, and 0.0–2.6% in R3—persistent but usually low in abundance in AGS reactors [46], were also found. Environmental conditions control the abundance of each bacterial species [47].
3.5.3. Distribution of Putative PAOs
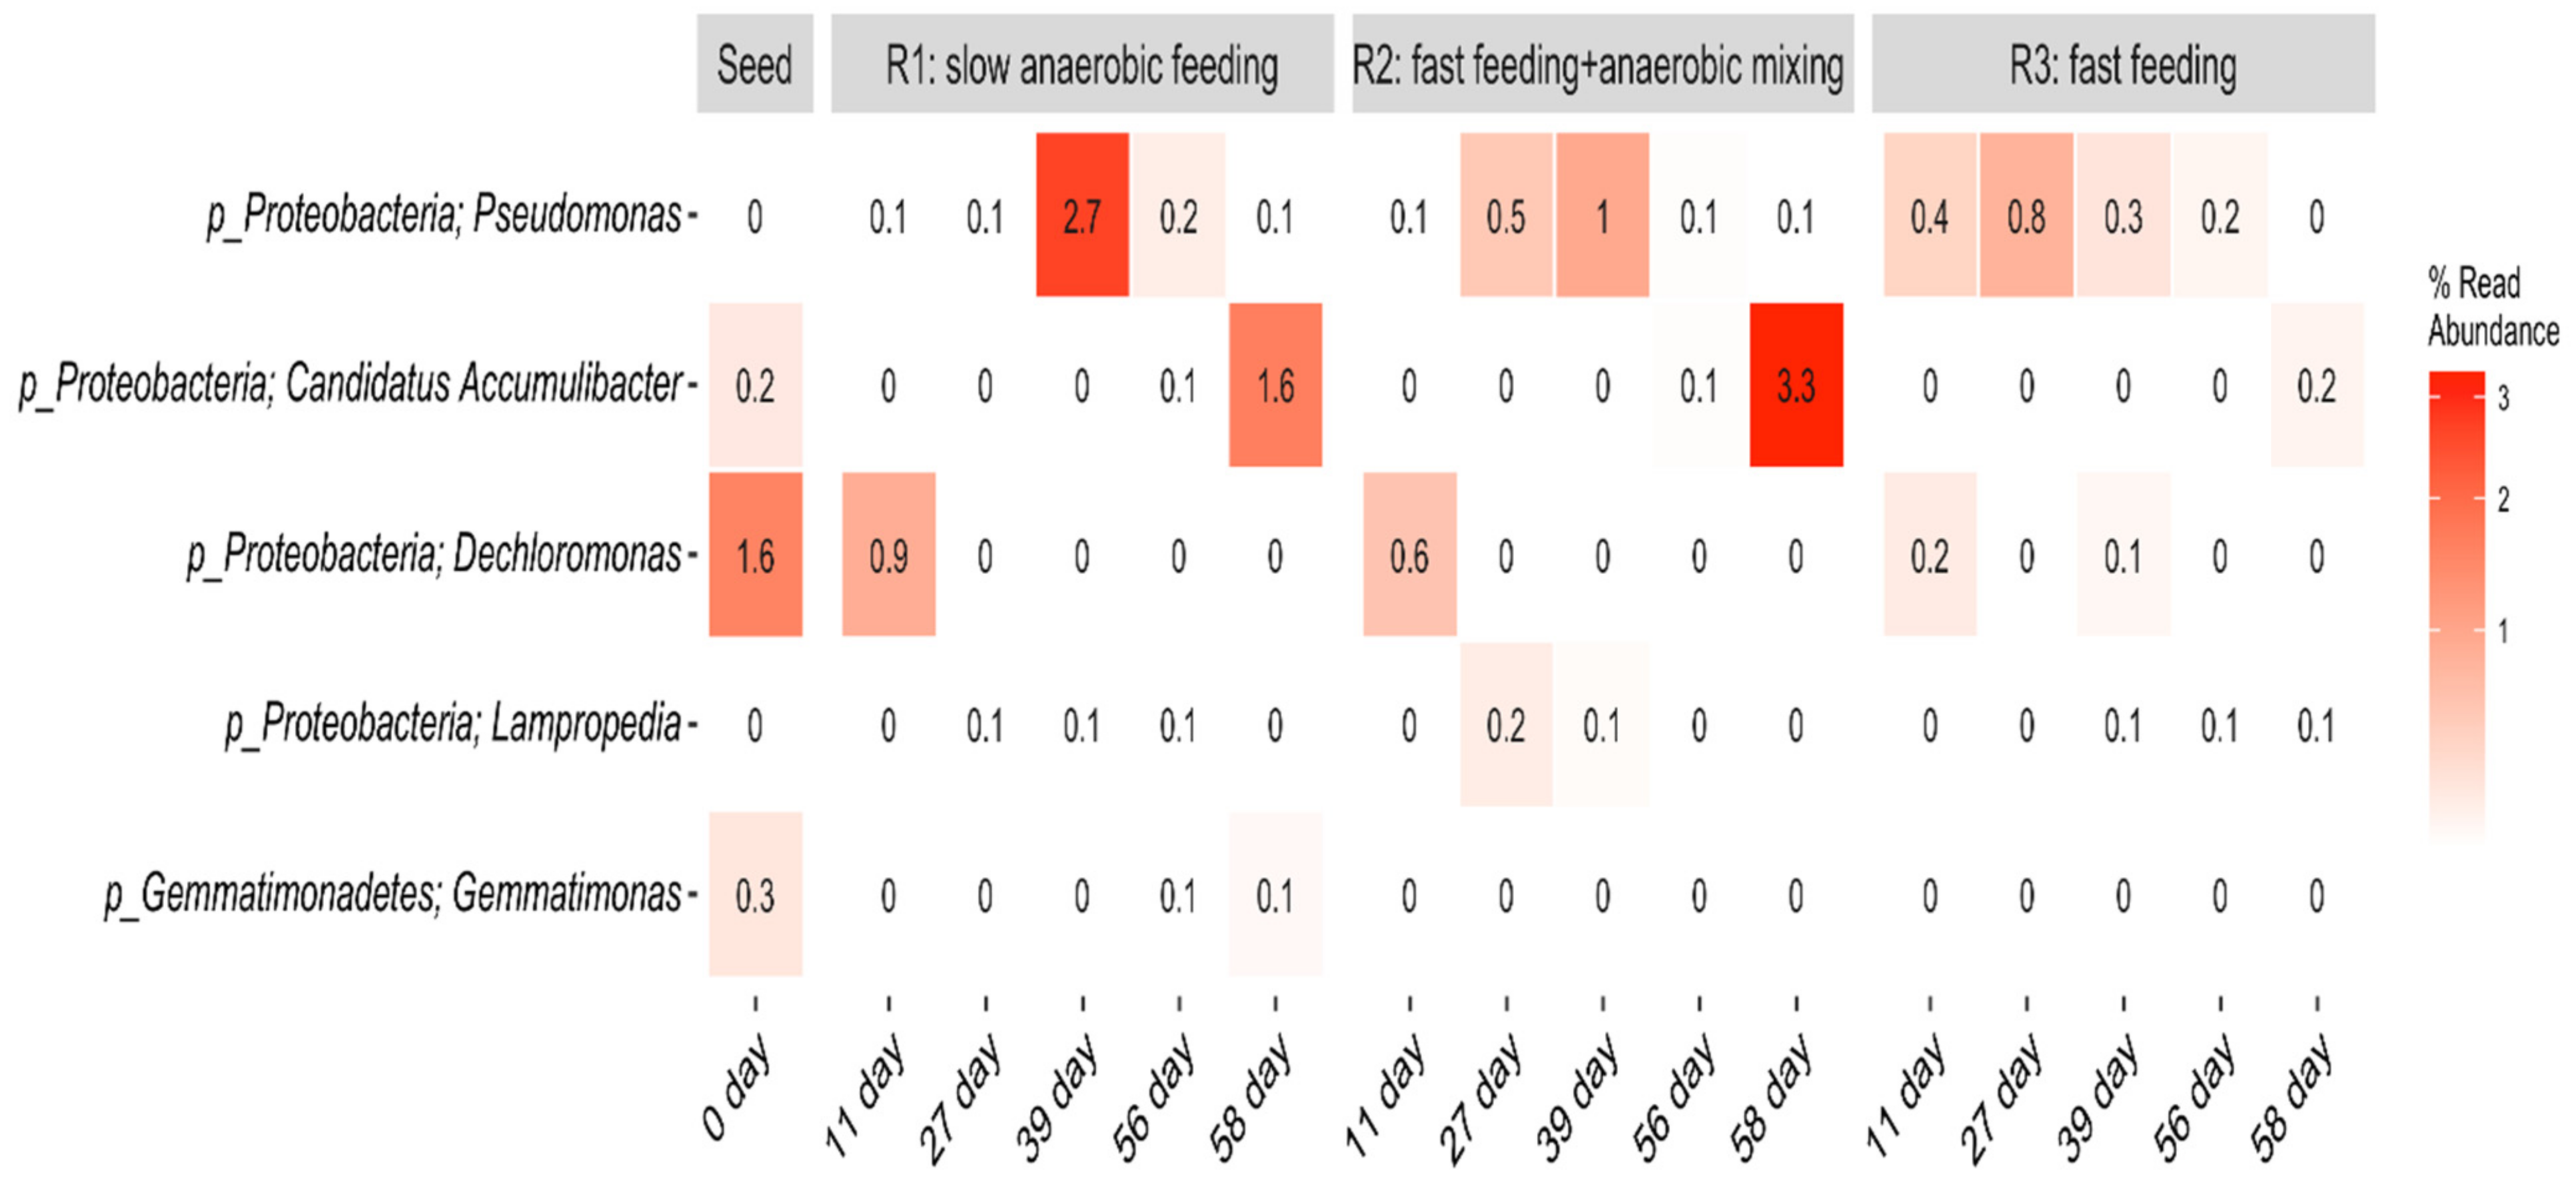
The heat map showing the evolution of putative PAOs in R1, R2, and R3 at phyla and genus levels is presented in Figure 9.
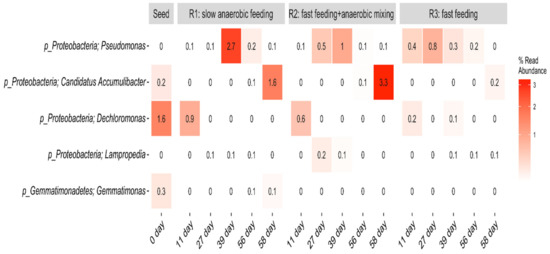
Figure 9.
Heat map showing the evolution of putative PAOs in R1, R2, and R3 at phyla and genus levels.
Low percentage abundance of well-known and putative PAOs including, Pseudomonas, Accumulibacter, Dechloromonas, and Lampropedia [36,48,49] were dictated at genus level within this AGS system. Pseudomonas was the most abundant with average read abundance of 0.64% in R1, 0.36% in R2, and 0.34% in R3. All three reactors recorded small but steady increments and eventual decline of Pseudomonas population over time. Within the first 39 days of reactor operation, Pseudomonas within R1 (slow anaerobic feeding) increased from 0–2.7%, before declining to 0.1%. In R2 (pulse feeding + anaerobic mixing), they increased from 0–1.0% before declining to 0.1% too, while in R3 (pulse feeding), they increased to 0.8% on day 27 before steady decline and eventual complete decay by day 58. This could imply that this bacterial community responded to factors other than the feeding strategies within this system. Günther et al. [50] identified members of the genus Pseudomonas as the predominant PAOs in an SBR-EBPR system. The second most abundant putative PAO genus in the present study was Ca. Accumulibacter with an average read abundance of 0.14% in R1, 0.68% in R2, and 0.04% in R3. This group of microbes also gradually but steadily increased over time. Ca. Accumulibacter is the most studied of the PAO genera and is often assumed to be the most important PAO [48]. Dechloromonas genus was also found in small quantities in the seed sludge and decayed over time in all three reactors. The dramatic decrease of the read abundance of PAOs within this system is difficult to explain, as there were no apparent substrate limitations within the system. Consistent decline over time shows lack of resilience. However, the core species may have been retained within the reactor or induced within the granules, which ensured the accomplishment of the biological removal processes and process stability. This aligns with the work of Adler and Holliger [48], who reported that with fermentative bacteria within a phosphorus removing system, various sugars and amino acids can be anaerobically fermented to release fermentation products, which allow classical PAOs to remain in the system. Wang et al. [37] reported a similar situation including a decrease in microbial communities at the class level, in an AGS system using an alternating aeration strategy. Minute quantities of the genus Lampropedia developed in the three reactors over time, while Gemmatimonas, though present in the seed sludge, did not strive in the reactors. Lampropedia are unlikely numerically important in phosphorus removal processes, with the only evidence suggesting their role as PAOs being the ability to store visible polyphosphate granules [36]. Further analysis of this result shows that R1, R2, and R3 have similar microbial community compositions despite the different feeding strategies. Although the reasons for this are not clear, it is known that certain operational parameters can affect both the diversity and the stability of bacterial populations [51]. The abundance and diversity of PAOs are critical for an assessment of the P-removal efficiency in the AGS. Thus, based on the small percentages of the PAOs found within this system, it can be inferred that some unidentified bacterial species may have also contributed to the performances achieved by R1, R2, and R3.
4. Conclusions
Phosphorus removal and PAO proliferation were studied in AGS bioreactors under three different feeding strategies: anaerobic slow feeding (R1), pulse feeding + anaerobic mixing (R2), and pulse feeding (R3). The results show that feeding strategy significantly impacts AGS bioreactor performance in terms of phosphorus removal but has no impact on organic matter degradation and ammonia removal. High phosphorus recovery from wasted aerobic sludge granules is possible when the reactor is operated using slow anaerobic feeding or fast feeding + anaerobic mixing strategies. With these feeding strategies, active PAOs can be accumulated and GAOs can be significantly inhibited within the bioreactor, leading to high SPRR, SPUR, and significantly higher phosphorus removal rates.
Author Contributions
Conceptualization, O.T.I.; methodology, O.T.I.; formal analysis, O.T.I.; investigation, O.T.I. and S.U.; resources, Y.L.; data curation, H.D.; writing—original draft preparation, O.T.I.; writing—review and editing, O.T.I., S.U., H.D. and Y.L.; supervision, Y.L.; funding acquisition, O.T.I. and Y.L. All authors have read and agreed to the published version of the manuscript.
Funding
This research received no external funding.
Institutional Review Board Statement
Not applicable.
Acknowledgments
The authors acknowledge financial support from the Natural Sciences and Engineering Research Council of Canada (NSERC) Industrial Research Chair (IRC) Program in Sustainable Urban Water Development through the support by EPCOR Water Services, EPCOR Drainage Operation and Alberta Innovates, an NSERC Discovery project, the Canada Research Chair (CRC) in Future Community Water Services (L.Y.), and an NSERC Postdoctoral Fellowship (I.O.T.).
Conflicts of Interest
The authors declare no conflict of interest.
References
- Heckenmüller, M.; Narita, D.; Klepper, G. Global Availability of Phosphorus and Its Implications for Global Food Supply: An Economic Overview; Kiel Working Paper, No. 1897; Kiel Institute for the World Economy (IfW): Kiel, Germany, 2014. [Google Scholar]
- Lu, Y.-Z.; Wang, H.-F.; Kotsopoulos, T.A.; Zeng, R.J. Advanced phosphorus recovery using a novel SBR system with granular sludge in simultaneous nitrification, denitrification and phosphorus removal process. Appl. Microbiol. Biotechnol. 2016, 100, 4367–4374. [Google Scholar] [CrossRef] [PubMed]
- Cordell, D.; Rosemarin, A.; Schröder, J.; Smit, A. Towards global phosphorus security: A systems framework for phosphorus recovery and reuse options. Chemosphere 2011, 84, 747–758. [Google Scholar] [CrossRef] [PubMed]
- Chrispim, M.C.; Scholz, M.; Nolasco, M.A. Phosphorus recovery from municipal wastewater treatment: Critical review of challenges and opportunities for developing countries. J. Environ. Manag. 2019, 248, 109268. [Google Scholar] [CrossRef] [PubMed]
- de Kreuk, M.; Heijnen, J.; van Loosdrecht, M. Simultaneous COD, nitrogen, and phosphate removal by aerobic granular sludge. Biotechnol. Bioeng. 2005, 90, 761–769. [Google Scholar] [CrossRef]
- Yilmaz, G.; Lemaire, R.; Keller, J.; Yuan, Z. Simultaneous nitrification, denitrification, and phosphorus removal from nutrient-rich industrial wastewater using granular sludge. Biotechnol. Bioeng. 2007, 100, 529–541. [Google Scholar] [CrossRef]
- Khan, M.Z.; Mondal, P.K.; Sabir, S. Aerobic granulation for wastewater bioremediation: A review. Can. J. Chem. Eng. 2013, 91, 1045–1058. [Google Scholar] [CrossRef]
- Cassidy, D.; Belia, E. Nitrogen and phosphorus removal from an abattoir wastewater in a SBR with aerobic granular sludge. Water Res. 2005, 39, 4817–4823. [Google Scholar] [CrossRef]
- Gao, D.; Liu, L.; Liang, H.; Wu, W. Aerobic granular sludge: Characterization, mechanism of granulation and application to wastewater treatment. Crit. Rev. Biotechnol. 2010, 31, 137–152. [Google Scholar] [CrossRef]
- Mañas, A.; Biscans, B.; Spérandio, M. Biologically induced phosphorus precipitation in aerobic granular sludge process. Water Res. 2011, 45, 3776–3786. [Google Scholar] [CrossRef] [Green Version]
- Filali, A.; Mañas, A.; Mercade, M.; Bessière, Y.; Biscans, B.; Spérandio, M. Stability and performance of two GSBR operated in alternating anoxic/aerobic or anaerobic/aerobic conditions for nutrient removal. Biochem. Eng. J. 2012, 67, 10–19. [Google Scholar] [CrossRef] [Green Version]
- Henriet, O.; Meunier, C.; Henry, P.; Mahillon, J. Improving phosphorus removal in aerobic granular sludge processes through selective microbial management. Bioresour. Technol. 2016, 211, 298–306. [Google Scholar] [CrossRef]
- Sarma, S.; Tay, J.-H. Carbon, nitrogen and phosphorus removal mechanisms of aerobic granules. Crit. Rev. Biotechnol. 2018, 38, 1077–1088. [Google Scholar] [CrossRef] [PubMed]
- Purba, L.D.A.; Ibiyeye, H.T.; Yuzir, A.; Mohamad, S.E.; Iwamoto, K.; Zamyadi, A.; Abdullah, N. Various applications of aerobic granular sludge: A review. Environ. Technol. Innov. 2020, 20, 101045. [Google Scholar] [CrossRef]
- Huang, W.; Huang, W.; Li, H.; Lei, Z.; Zhang, Z.; Tay, J.H.; Lee, D.-J. Species and distribution of inorganic and organic phosphorus in enhanced phosphorus removal aerobic granular sludge. Bioresour. Technol. 2015, 193, 549–552. [Google Scholar] [CrossRef] [PubMed]
- Iorhemen, O.T.; Liu, Y. Effect of feeding strategy and organic loading rate on the formation and stability of aerobic granular sludge. J. Water Process Eng. 2020, 39, 101709. [Google Scholar] [CrossRef]
- Winkler, M.-K.H.; Meunier, C.; Henriet, O.; Mahillon, J.; Suárez-Ojeda, M.E.; Moro, G.D.; Sanctis, M.D.; Iaconi, C.D.; Weissbrodt, D.G. An integrative review of granular sludge for the biological removal of nutrients and recalcitrant organic matter from wastewater. Chem. Eng. J. 2018, 336, 489–502. [Google Scholar] [CrossRef]
- Yuan, Q.; Gong, H.; Xi, H.; Xu, H.; Jin, Z.; Ali, N.; Wang, K. Strategies to improve aerobic granular sludge stability and nitrogen removal based on feeding mode and substrate. J. Environ. Sci. 2019, 84, 144–154. [Google Scholar] [CrossRef]
- Martins, A.M.; Heijnen, J.J.; van Loosdrecht, M.C. Effect of feeding pattern and storage on the sludge settleability under aerobic conditions. Water Res. 2003, 37, 2555–2570. [Google Scholar] [CrossRef]
- Liu, Y.; Yang, S.-F.; Tay, J.-H. Improved stability of aerobic granules by selecting slow-growing nitrifying bacteria. J. Biotechnol. 2004, 108, 161–169. [Google Scholar] [CrossRef]
- Lochmatter, S.; Holliger, C. Optimization of operation conditions for the startup of aerobic granular sludge reactors biologically removing carbon, nitrogen, and phosphorous. Water Res. 2014, 59, 58–70. [Google Scholar] [CrossRef]
- Rocktäschel, T.; Klarmann, C.; Helmreich, B.; Ochoa, J.; Boisson, P.; Sørensen, K.; Horn, H. Comparison of two different anaerobic feeding strategies to establish a stable aerobic granulated sludge bed. Water Res. 2013, 47, 6423–6431. [Google Scholar] [CrossRef] [PubMed]
- Thwaites, B.J.; Reeve, P.; Dinesh, N.; Short, M.D.; Akker, B.V.D. Comparison of an anaerobic feed and split anaerobic–aerobic feed on granular sludge development, performance and ecology. Chemosphere 2017, 172, 408–417. [Google Scholar] [CrossRef]
- McSwain, B.; Irvine, R.; Wilderer, P. The effect of intermittent feeding on aerobic granule structure. Water Sci. Technol. 2004, 49, 19–25. [Google Scholar] [CrossRef] [PubMed]
- APHA/AWWA/WEF. Standard Methods for the Examination of Water and Wastewater; American Public Health Association/American Water Works Association/Water Environment Federation: Washington, DC, USA, 2012. [Google Scholar]
- De Kreuk, M.; Van Loosdrecht, M. Selection of slow growing organisms as a means for improving aerobic granular sludge stability. Water Sci. Technol. 2004, 49, 9–17. [Google Scholar] [CrossRef]
- Show, K.-Y.; Lee, D.-J.; Tay, J.-H. Aerobic Granulation: Advances and Challenges. Appl. Biochem. Biotechnol. 2012, 167, 1622–1640. [Google Scholar] [CrossRef] [PubMed]
- Franca, R.D.; Pinheiro, H.M.; van Loosdrecht, M.C.; Lourenço, N.D. Stability of aerobic granules during long-term bioreactor operation. Biotechnol. Adv. 2018, 36, 228–246. [Google Scholar] [CrossRef] [PubMed]
- Iorhemen, O.T.; Zaghloul, M.S.; Hamza, R.A.; Tay, J.H. Long-term aerobic granular sludge stability through anaerobic slow feeding, fixed feast-famine period ratio, and fixed SRT. J. Environ. Chem. Eng. 2020, 8, 103681. [Google Scholar] [CrossRef]
- Nancharaiah, Y.; Reddy, G.K.K. Aerobic granular sludge technology: Mechanisms of granulation and biotechnological applications. Bioresour. Technol. 2018, 247, 1128–1143. [Google Scholar] [CrossRef] [PubMed]
- Chen, F.-Y.; Liu, Y.-Q.; Tay, J.-H.; Ning, P. Alternating anoxic/oxic condition combined with step-feeding mode for nitrogen removal in granular sequencing batch reactors (GSBRs). Sep. Purif. Technol. 2013, 105, 63–68. [Google Scholar] [CrossRef]
- He, Q.; Wang, H.; Chen, L.; Gao, S.; Zhang, W.; Song, J.; Yu, J. Elevated salinity deteriorated enhanced biological phosphorus removal in an aerobic granular sludge sequencing batch reactor performing simultaneous nitrification, denitrification and phosphorus removal. J. Hazard. Mater. 2020, 390, 121782. [Google Scholar] [CrossRef]
- Iorhemen, O.T.; Hamza, R.A.; Sheng, Z.; Tay, J.H. Submerged aerobic granular sludge membrane bioreactor (AGMBR): Organics and nutrients (nitrogen and phosphorus) removal. Bioresour. Technol. Rep. 2019, 6, 260–267. [Google Scholar] [CrossRef]
- Crocetti, G.R.; Hugenholtz, P.; Bond, P.L.; Schuler, A.; Keller, J.; Jenkins, D.; Blackall, L.L. Identification of Polyphosphate-Accumulating Organisms and Design of 16S rRNA-Directed Probes for Their Detection and Quantitation. Appl. Environ. Microbiol. 2000, 66, 1175–1182. [Google Scholar] [CrossRef] [PubMed] [Green Version]
- Wong, M.-T.; Mino, T.; Seviour, R.J.; Onuki, M.; Liu, W.-T. In situ identification and characterization of the microbial community structure of full-scale enhanced biological phosphorous removal plants in Japan. Water Res. 2005, 39, 2901–2914. [Google Scholar] [CrossRef] [PubMed]
- Stokholm-Bjerregaard, M.; McIlroy, S.J.; Nierychlo, M.; Karst, S.M.; Albertsen, M.; Nielsen, P.H. A Critical Assessment of the Microorganisms Proposed to be Important to Enhanced Biological Phosphorus Removal in Full-Scale Wastewater Treatment Systems. Front. Microbiol. 2017, 8, 718. [Google Scholar] [CrossRef] [Green Version]
- Wang, B.; Liu, S.-G.; Yao, X.; Liu, Y.; Qi, G. Alternating aeration strategy to reduce aeration energy demand for aerobic granular sludge and analysis of microbial community dynamics. Environ. Sci. Water Res. Technol. 2022, 8, 1111–1125. [Google Scholar] [CrossRef]
- Xu, D.; Li, J.; Ma, T. Rapid aerobic sludge granulation in an integrated oxidation ditch with two-zone clarifiers. Water Res. 2020, 175, 115704. [Google Scholar] [CrossRef] [PubMed]
- Lee, H.W.; Park, Y.K. Characterizations of denitrifying polyphosphate-accumulating bacterium Paracoccus sp. Strain YKP-9. J. Microbiol. Biotechnol. 2008, 18, 1958–1965. [Google Scholar]
- Medhi, K.; Mishra, A.; Thakur, I.S. Genome Sequence of a Heterotrophic Nitrifier and Aerobic Denitrifier, Paracoccus denitrificans Strain ISTOD1, Isolated from Wastewater. Genome Announc. 2018, 6, e00210-18. [Google Scholar] [CrossRef] [Green Version]
- Hamza, R.A.; Sheng, Z.; Iorhemen, O.T.; Zaghloul, M.S.; Tay, J.H. Impact of food-to-microorganisms ratio on the stability of aerobic granular sludge treating high-strength organic wastewater. Water Res. 2018, 147, 287–298. [Google Scholar] [CrossRef] [PubMed]
- Wu, X.; Wu, X.; Li, J.; Wu, Q.; Ma, Y.; Sui, W.; Zhao, L.; Zhang, X. Cross-Feeding between Members of Thauera spp. and Rhodococcus spp. Drives Quinoline-Denitrifying Degradation in a Hypoxic Bioreactor. mSphere 2020, 5, e00246-20. [Google Scholar] [CrossRef]
- Wiątczak, P.; Cydzik-Kwiatkowska, A. Performance and microbial characteristics of biomass in a full-scale aerobic granular sludge wastewater treatment plant. Environ. Sci. Pollut. Res. 2018, 25, 1655–1669. [Google Scholar] [CrossRef] [PubMed] [Green Version]
- Zou, J.; Pan, J.; Wu, S.; Qian, M.; He, Z.; Wang, B.; Li, J. Rapid control of activated sludge bulking and simultaneous acceleration of aerobic granulation by adding intact aerobic granular sludge. Sci. Total Environ. 2019, 674, 105–113. [Google Scholar] [CrossRef] [PubMed]
- Zheng, D.; Sun, Y.; Li, H.; Lu, S.; Shan, M.; Xu, S. Multistage A-O Activated Sludge Process for Paraformaldehyde Wastewater Treatment and Microbial Community Structure Analysis. J. Chem. 2016, 2016, 2746715. [Google Scholar] [CrossRef] [Green Version]
- Xia, J.; Ye, L.; Ren, H.; Zhang, X.-X. Microbial community structure and function in aerobic granular sludge. Appl. Microbiol. Biotechnol. 2018, 102, 3967–3979. [Google Scholar] [CrossRef]
- Zhang, Y.; Islam, S.; McPhedran, K.N.; Dong, S.; Rashed, E.M.; El-Shafei, M.M.; Noureldin, A.M.; El-Din, M.G. A comparative study of microbial dynamics and phosphorus removal for a two side-stream wastewater treatment processes. RSC Adv. 2017, 7, 45938–45948. [Google Scholar] [CrossRef] [Green Version]
- Adler, A.; Holliger, C. Multistability and Reversibility of Aerobic Granular Sludge Microbial Communities Upon Changes From Simple to Complex Synthetic Wastewater and Back. Front. Microbiol. 2020, 11, 574361. [Google Scholar] [CrossRef] [PubMed]
- Nierychlo, M.; Andersen, K.S.; Xu, Y.; Green, N.; Jiang, C.; Albertsen, M.; Dueholm, M.S.; Nielsen, P.H. MiDAS 3: An ecosystem-specific reference database, taxonomy and knowledge platform for activated sludge and anaerobic digesters reveals species-level microbiome composition of activated sludge. Water Res. 2020, 182, 115955. [Google Scholar] [CrossRef] [PubMed]
- Günther, S.; Trutnau, M.; Kleinsteuber, S.; Hause, G.; Bley, T.; Röske, I.; Harms, H.; Müller, S. Dynamics of Polyphosphate-Accumulating Bacteria in Wastewater Treatment Plant Microbial Communities Detected via DAPI (4′,6′-Diamidino-2-Phenylindole) and Tetracycline Labeling. Appl. Environ. Microbiol. 2009, 75, 2111–2121. [Google Scholar] [CrossRef] [PubMed] [Green Version]
- Mielczarek, A.T.; Nguyen, H.T.T.; Nielsen, J.L.; Nielsen, P.H. Population dynamics of bacteria involved in enhanced biological phosphorus removal in Danish wastewater treatment plants. Water Res. 2013, 47, 1529–1544. [Google Scholar] [CrossRef]
Publisher’s Note: MDPI stays neutral with regard to jurisdictional claims in published maps and institutional affiliations. |
© 2022 by the authors. Licensee MDPI, Basel, Switzerland. This article is an open access article distributed under the terms and conditions of the Creative Commons Attribution (CC BY) license (https://creativecommons.org/licenses/by/4.0/).

