Article

Influence of Road Types on Transiting Test for Aerodynamic Coefficient Measurements Using Passive Wind Generated by a Moving Vehicle

1
China Second Metallurgy Group Corporation Limited, Baotou 014033, China
2
Zhengzhou Highway Development Center, Zhengzhou 450052, China
3
School of Civil Engineering, Zhengzhou University, Zhengzhou 450001, China
4
Zhengzhou Key Laboratory of Disaster Prevention and Control for Cable Structure, Zhengzhou 450001, China
*
Authors to whom correspondence should be addressed.
Processes 2022, 10(8), 1471; https://doi.org/10.3390/pr10081471
Submission received: 18 June 2022 / Revised: 19 July 2022 / Accepted: 22 July 2022 / Published: 27 July 2022

Abstract

:
A transiting test using vehicle-driving passive wind is a novel experimental technique to perform aerodynamic tests, proposed by the authors. However, this low-cost, short-cycle, and symmetrical test method can be influenced by many factors. In this paper, a comparative study on the influence of road types on a transiting test of aerodynamic coefficient measurements is presented. The tests were carried out on three different roads (expressway, viaduct highway, and tunnel highway); for each road type, structure models with and without end plates were investigated. For all the road types, measured turbulence intensity (around 4%) was similar to that of the wind tunnel test under the following conditions: 3 °C temperature, 42% humidity, 0.28 m/s natural wind speed, vehicle driving in a straight line with stable speed, and no traffic flow. All the tests were conducted under the above conditions. To deal with the interference components in the original data signals obtained from a viaduct highway and tunnel highway, a low-pass filter with a 1 Hz cutoff frequency was used. With wind attack angles changing, the tendency of the aerodynamic coefficients of the test model in the transiting test showed satisfactory consistency with that of the wind tunnel test; and the results exhibited fine repeatability. Regarding the drag coefficients, the test model with end plates was in good agreement with those from the wind tunnel test. Compared with the wind tunnel test, the results of expressway showed the best consistency, considering turbulence intensity, pavement surface roughness, and other factors. Thus, the transiting test in future research should be conducted on the expressway, with end plates installed on both ends of the structure model.

1. Introduction

In recent years, with the continuous developments of construction techniques and building materials, it is becoming increasingly common to find high-rise buildings and long-span bridges. These lightweight and slender structures have lower damping and stiffness and are prone to being damaged by strong wind, thus causing massive casualties and large economic losses. Therefore, wind is one of the key loads in the structural design of high-rise buildings [1,2] and long-span bridges [3,4]. For optimizing wind-resistant design of structures, aerodynamic coefficients play a significant part in numerical calculation and stability analysis. Research approaches of analyzing structural wind-resistant characteristics mainly include field measurement, theoretical analysis, numerical simulation, and the wind tunnel test. Field-measured data contain the most reliable first-hand information of wind loads [5,6], and can also provide checks on the numerical simulation and wind tunnel tests. Limited by various uncontrollable factors like topography and meteorology, however, the field experiments might be in a complicated situation in reality. Theoretical analysis can provide an analytical solution to aerodynamic coefficients, which were in good agreement with the experimental results [7]. For complicated cases, however, analytical techniques are still in progress. Numerical simulation has the advantages of low cost and flow visualization. In addition, with the presence of various finite element programs, complex wind field simulation problems can be solved effectively. Nevertheless, due to the huge computational burden in numerical simulation, validation of the wind tunnel test is important and necessary [8,9]. The wind tunnel test possesses advantages like wind field of good controllability and reliable test results with high accuracy, which contribute to its wide use in the following fields: civil, aeronautic, and aerospace engineering [10,11,12,13]. On the other hand, however, the wind tunnel test is time-consuming and expensive.
In order to find a test method alternative to the wind tunnel test, the transiting test using vehicle-driving passive wind is developed by the authors [14,15]. This low-cost and short-cycle test method showed good ability to perform wind resistance analyses [16], compared with the wind tunnel test. The testing results showed good agreement with the wind tunnel tests, demonstrating the reliability of this technique. However, before this can fully mature, many issues have to be solved. The transiting test will undoubtedly be affected by considerable interferences from natural outdoor conditions. Therefore, interference mitigations for the transiting test are taken into account.
This paper investigates the influence of road types on the transiting test, based on the analysis of experimental aerodynamic forces measured by dynamometric force balance, thereby providing references of the optimum road type for transiting test in future research. The effect of end plates together with influence of road types was evaluated in the transiting test where a triangular cross-sectional body is considered as the test model. Transiting tests were implemented on three different roads (expressway, viaduct highway, and tunnel highway); for each road type, the test model with and without end plates was investigated. That is, six test conditions in total were considered. Firstly, the impact of natural wind obtained using the ultrasonic anemometer and the turbulence intensity measured by the pitot tube were analyzed. Secondly, a data processing method was presented based on the analysis of the time and frequency domains of the aerodynamic forces and vibration accelerations in the corresponding direction. Finally, the optimum road type for the transiting test is determined by comparing and analyzing the aerodynamic coefficients of the test model in all test conditions. A general schematic is shown in Figure 1, showing the procedure for each test.
The structure of the paper is organized as follows: Section 2 documents the experimental setup, including experimental devices, test model, test conditions, specific assumptions, and theoretical model. Section 3 presents the results from the transiting test and the discussion, analyzing the influence of the road types on the transiting test. Section 4 closes the paper by giving some conclusions on this research.

2. Experimental Setup

2.1. Experimental Devices

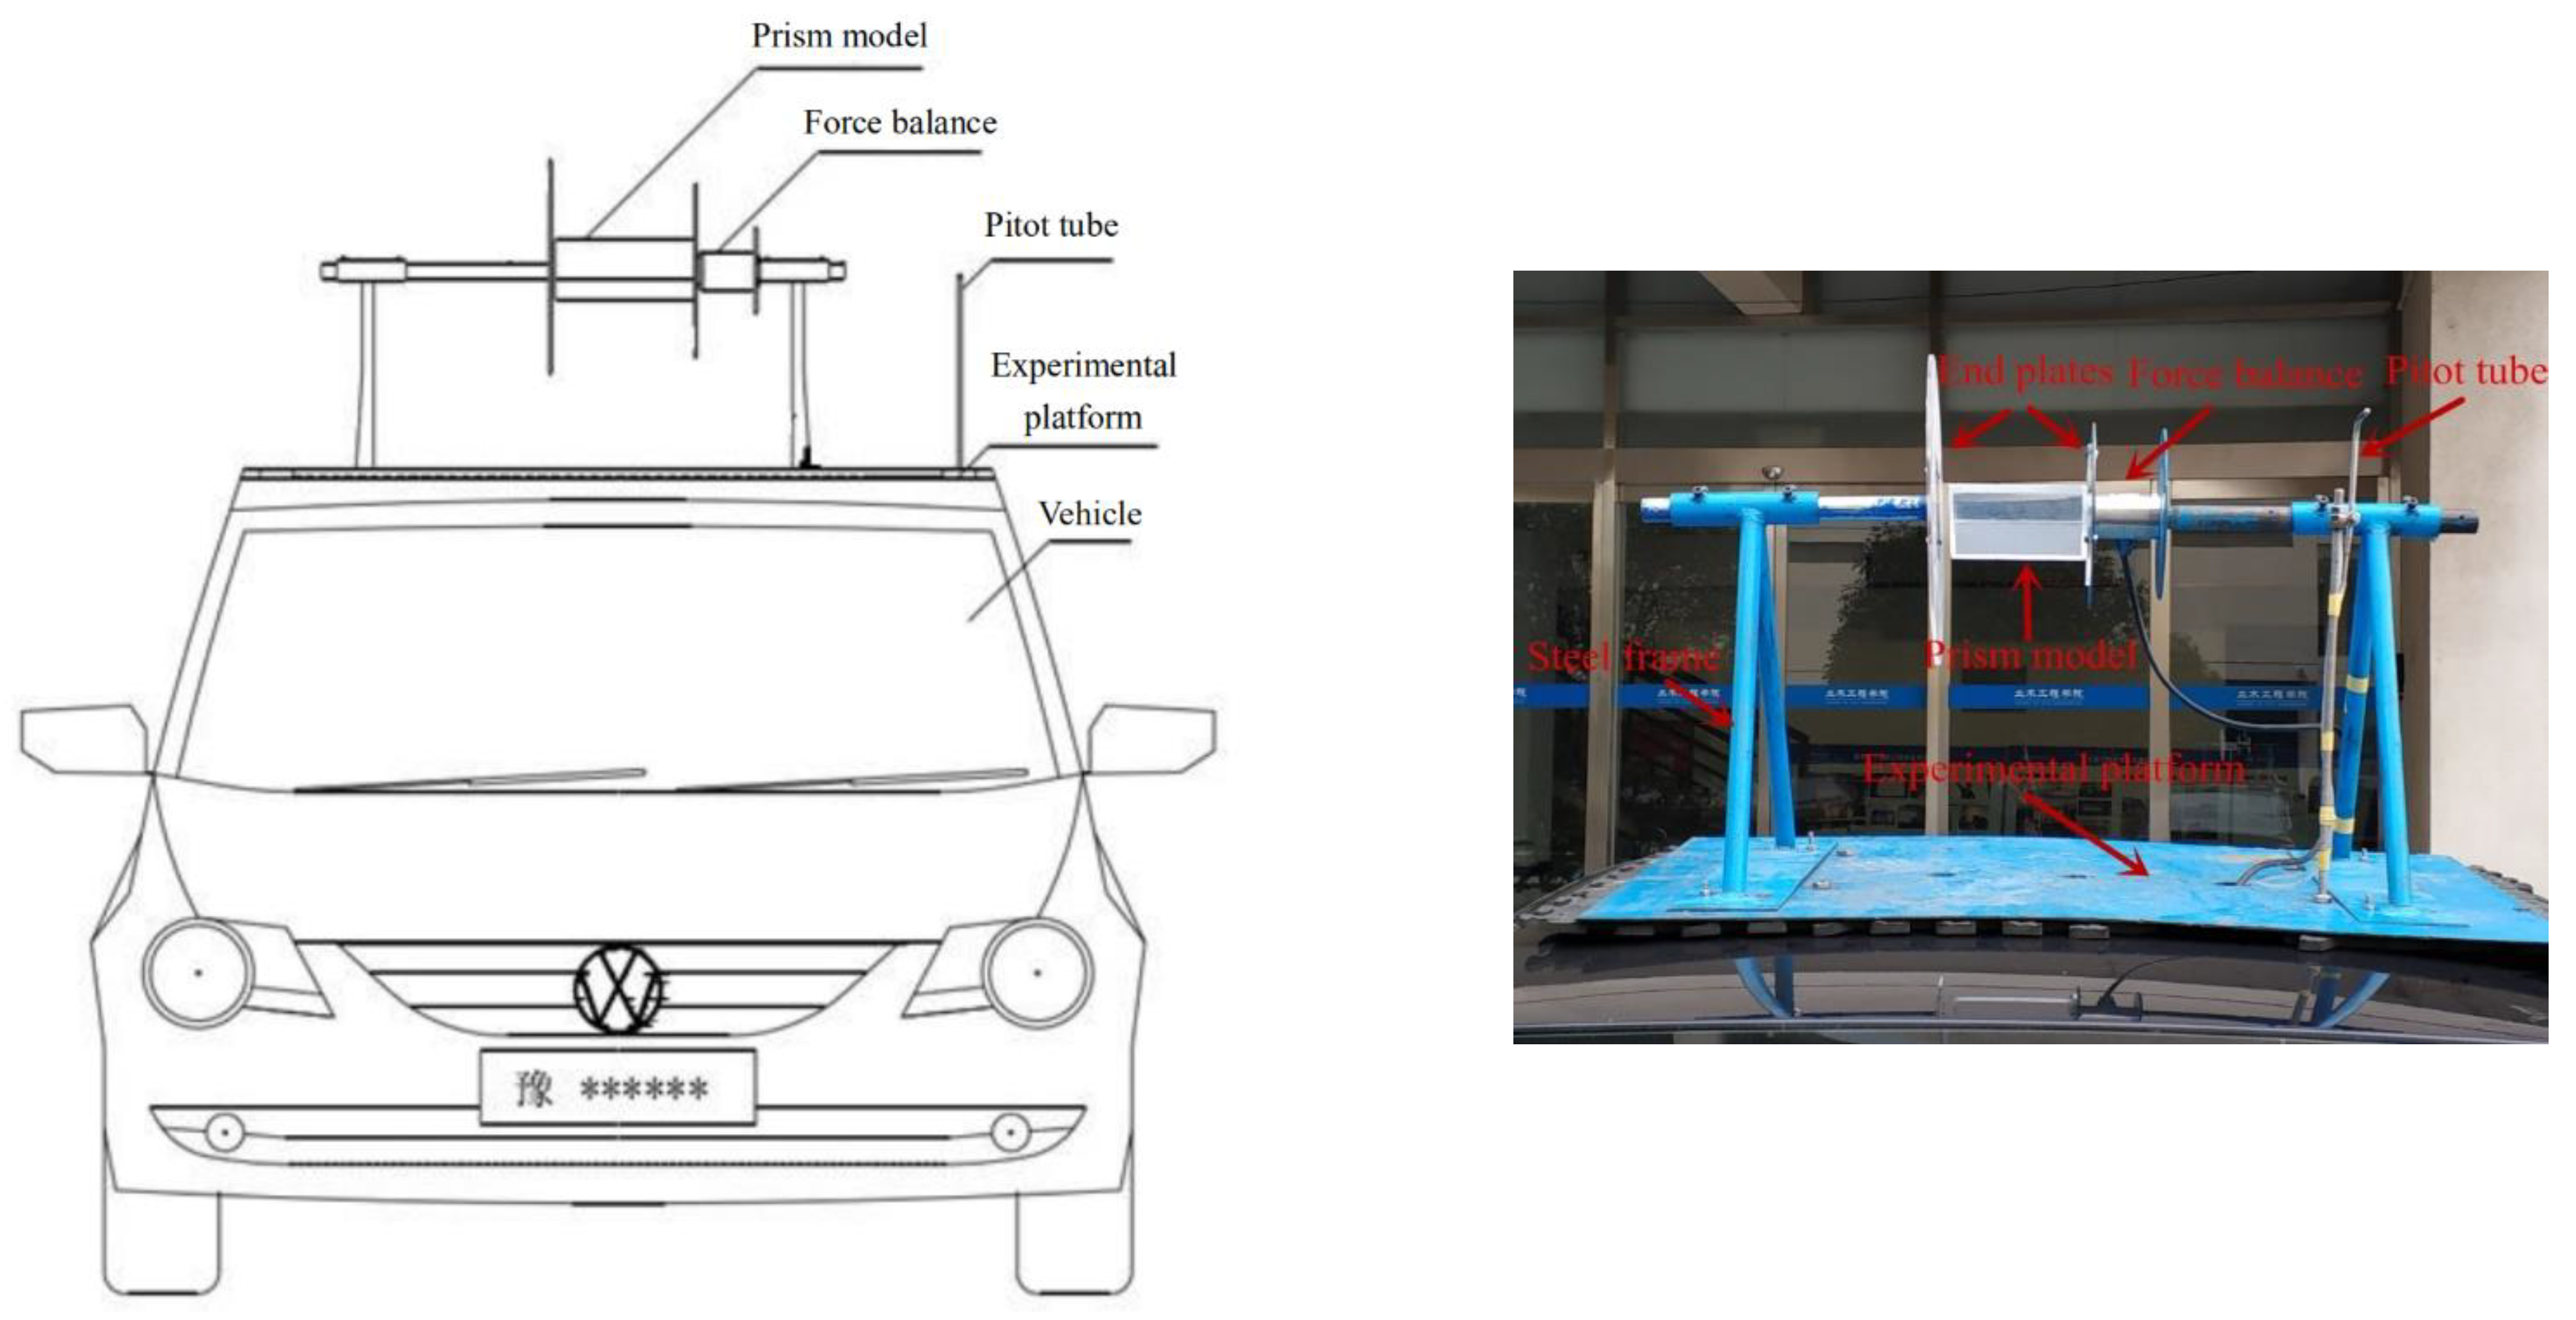
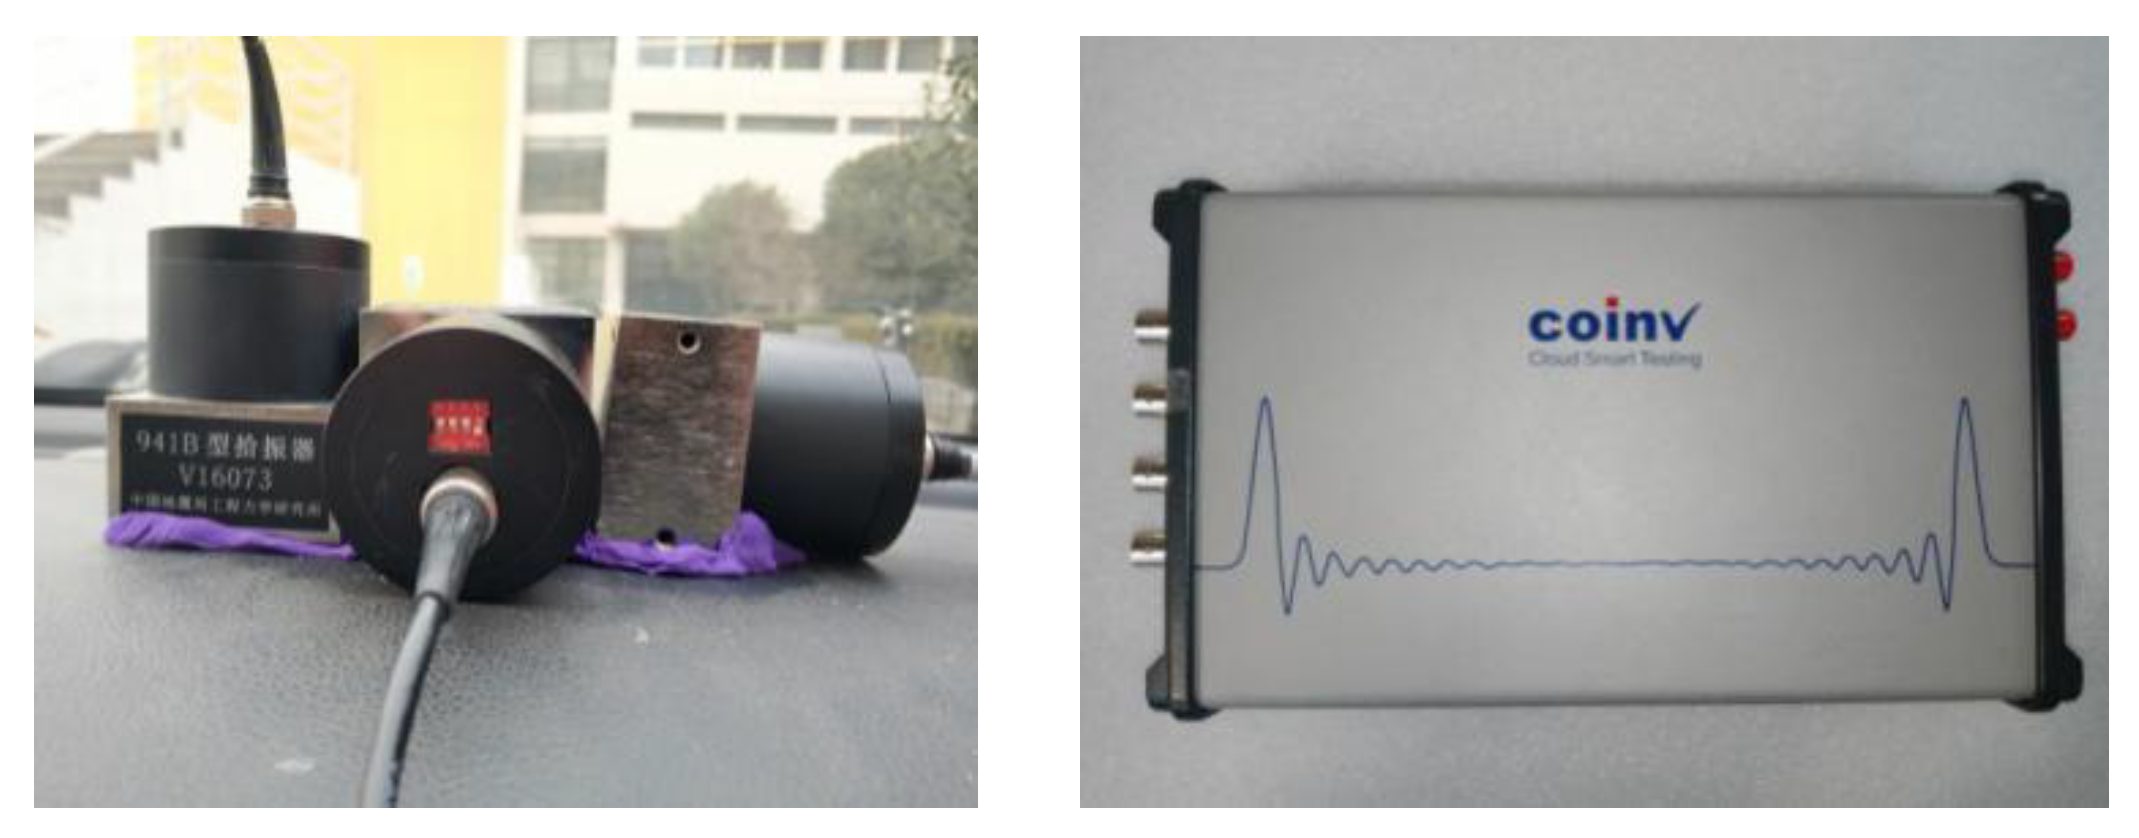
The prism test model was supported by a steel frame and mounted on the experimental platform on top of the vehicle roof (see Figure 2). Experimental devices are mainly divided into three subsystems: the aerodynamic forces and vehicle speed testing systems on the vehicle roof (Figure 1) and vibration testing system inside the vehicle (Figure 3). Figure 4 is a simplified flowchart showing the data acquisition process of the three subsystems.
The aerodynamic force testing system consists of force balance (model NOS-C901) and the corresponding intelligent control instrument (model MCK-F). The former can be used to measure the force conditions of the prism model, and the latter is capable of real-time display and data storing. The force balance and prism model are connected by bolts. The vehicle speed testing system includes pitot tube, high frequency pressure sensors, and the corresponding demodulation instrument. The vibration testing system including ultra-low frequency vibration accelerometers (model 941B) and the corresponding data acquisition instrument (model INV3062T) aims at measuring the vibration accelerations in the corresponding direction of lift and drag forces. Four mainly test devices were investigated in total, as shown in Table 1.

2.2. Prism Model and Test Conditions

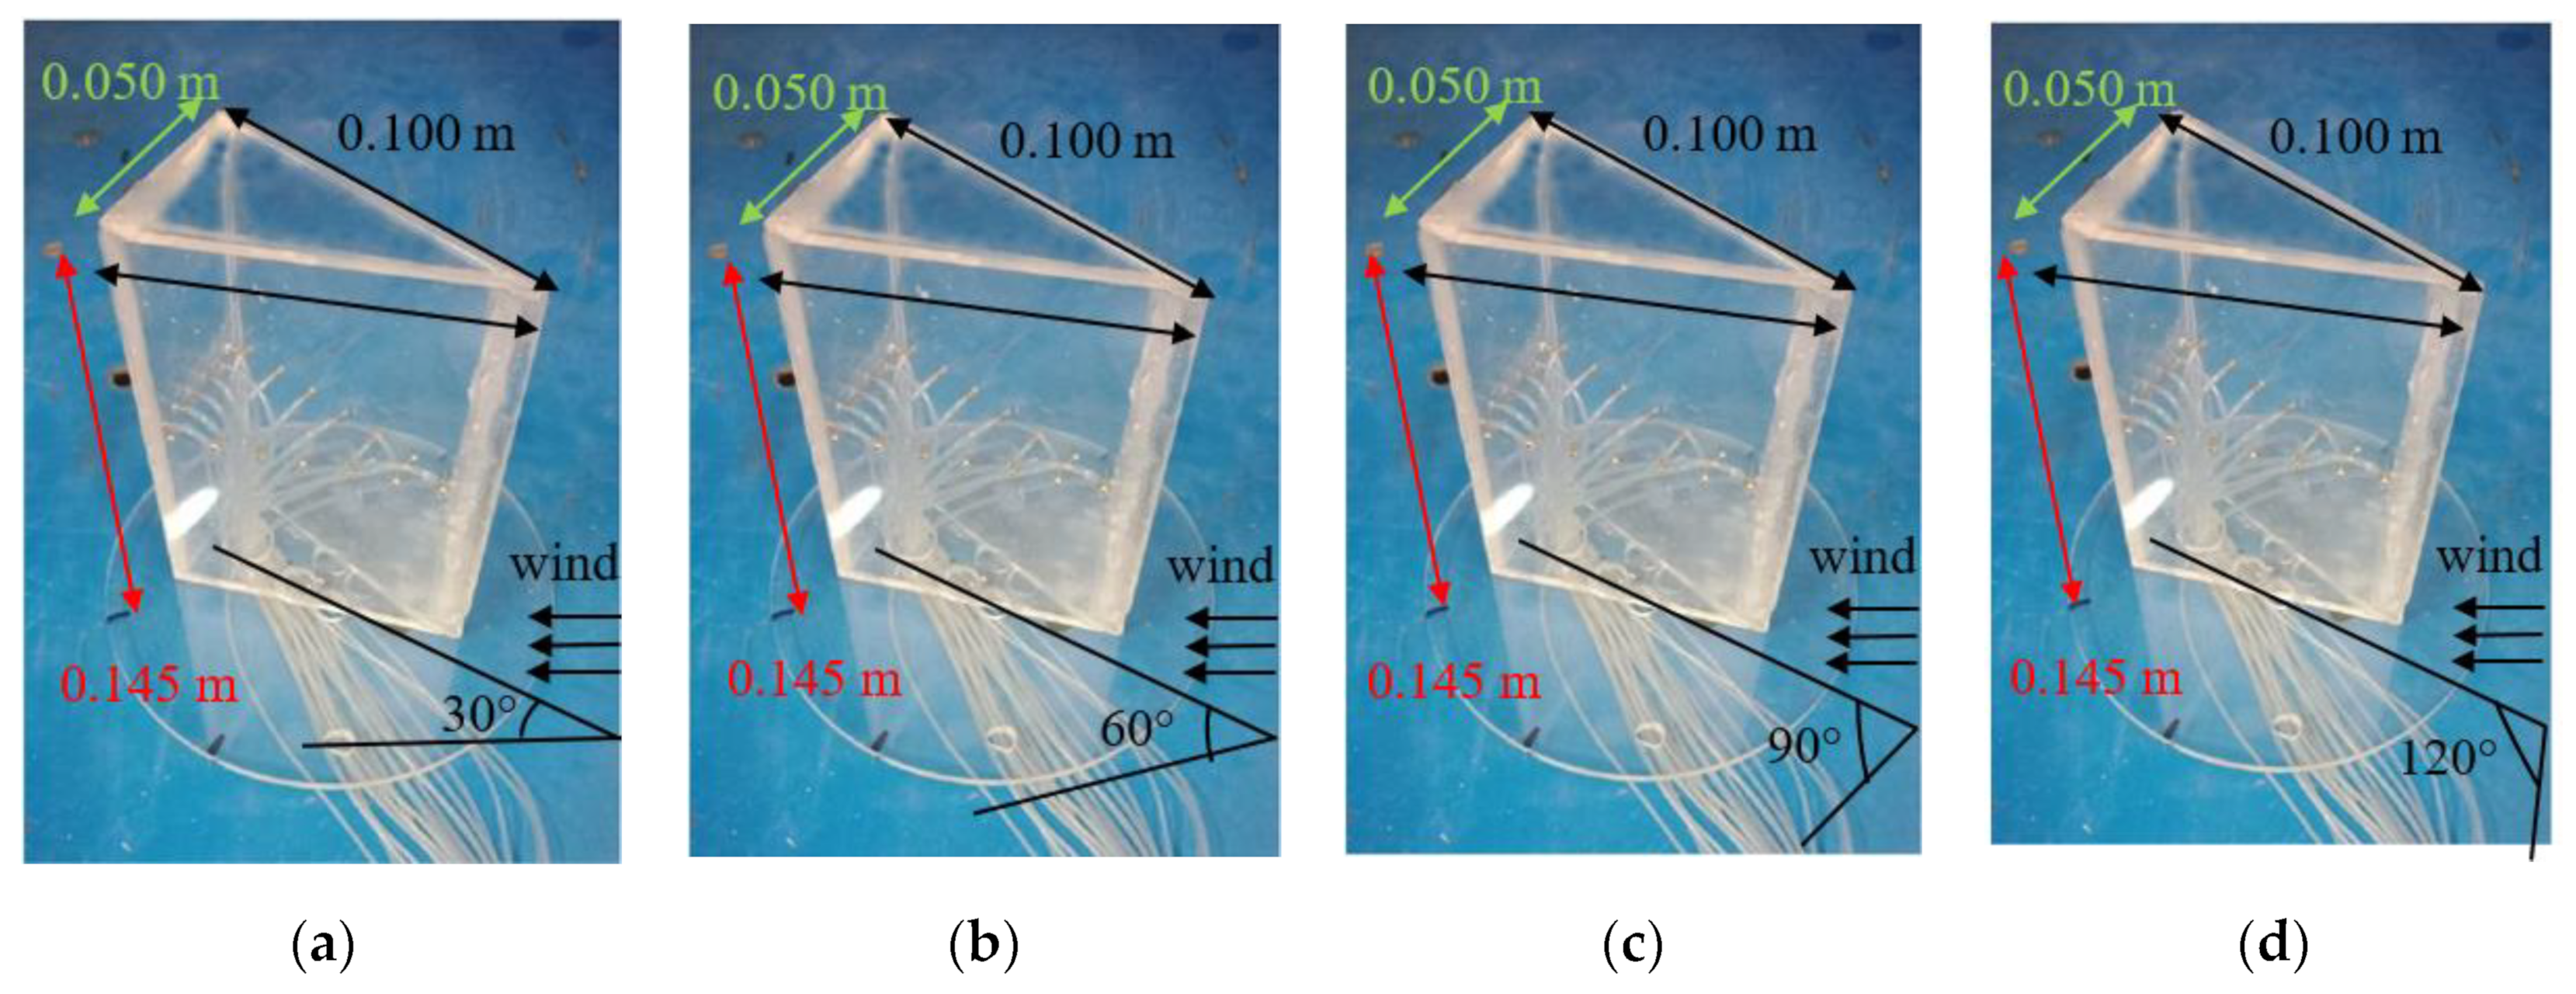
Two-dimensional isosceles triangular cross-section bodies have been analyzed in previous research [17,18], whose aerodynamic coefficients were measured with an angle of 30° at the main vertex. As shown in Figure 5, the maximum characteristic length and span of the test model are 0.100 m and 0.145 m, respectively. The plexiglass model is rigidly connected with the experimental platform through the steel frame, thus assuring accurate experimental results with high vehicle speeds. The Cruise Control System enables the vehicle to drive at a constant speed of 72 km/h (20 m/s), the same as the wind velocity in the wind tunnel. For vehicle yaw angles less than 8°, the maximum vehicle speed correction required was less than 1%, and no corrections were made for yaw [19,20]. The Reynolds number was particularly high so that it might be neglected for the aerodynamic coefficients of the model [19,20].
Expressway, tunnel highway, and viaduct highway are three typical test sites for the transiting test. Pavement of these sites presents high strength, great rigidity, and good stability. In addition, these roads were made of asphalt, there were expansion joints above the viaduct, and the slope of the tunnel pavement was large, while the slope of the expressway was small.
Moreover, these sites are closed to passengers and non-motors to ensure high speed driving. Six test conditions were investigated in total, as shown in Table 2. Wind attack angles of the test model range from 30° to 120°, with an increment of 30°. To cancel the errors during the tests, three repeated tests were designed for each test conditions. The averaging results of three repeated tests were assumed to be the reliable final results.

2.3. Specific Assumptions

This novel test method might be influenced by many factors. In standard practice of wind engineering, wind characteristics are usually classified by the terrain type over which the wind prevails. Previous research [21,22] has demonstrated that terrain roughness, wind strength, and traffic density are the basis to classify measured on-road turbulence data into different segments. Surrounding road conditions, such as upstream wakes of other moving vehicles nearby and roadside obstacles, also have an impact on the aerodynamic coefficients [23,24]. In other words, on-road wind characteristics experienced by the moving vehicle and the test model are greatly influenced by the road conditions. While driving in a tunnel, the drag forces of the vehicles intensified as a result of the blockage effect [25,26]. In the wind tunnel test, for a vehicle model moving on the viaduct with high speed, evident noise signals might be caused by plenty of interfering factors, such as bidirectional conversion bracket vibrations and guide rail irregularity [27]. Therefore, three representative road types (expressway, viaduct highway, tunnel highway), which span the range of terrain and traffic conditions that vehicles commonly traverse, were selected as test sites to study the influence on the measurement of aerodynamic coefficients in the transiting test. In both the wind tunnel test [28,29] and transiting test [14], end plates are commonly used for reducing the effect of the flow on both ends, thus ensuring nominal two-dimensional flow. In [14], the research work focuses on the effect of end plates on the transiting test for measuring aerodynamic coefficients, and the optimum shape and size were studied deeply. However, in this work, for a certain condition (without or with a certain kind) of end plates, the influence of different road types on the aerodynamic coefficient measurement is the main issue.
To mitigate the interfering factors in the transiting tests, several actions were taken (listed in Table 3). The impacts of natural wind and heavy traffic density were successfully reduced by carrying out the tests at night. During a transiting test, the test model may be subjected to interferences from not only crosswind and road side obstacles but also vehicle vibration [30,31]. Large error would be produced if one calculates aerodynamic forces directly based on the original signals [32]. Therefore, the original data were properly processed using a low-pass filter with a cutoff frequency of 1 Hz to calculate the aerodynamic coefficients.
In addition, the transiting test is carried out on the basis of the following assumptions. The vehicle can run a straight line with constant velocity; the disturbance action of highways and ancillary facilities, such as road greening, is neglected; the effects of local natural wind, air temperature, and humidity are neglected; the air is steady and incompressible.

2.4. Theoretical Modeling

The airspeed Vair (or passive wind speed experienced by the moving vehicle, vehicle-driving wind speed) can be defined as follows:
V a i r = 2 P p P 0 ρ ,
where P0 and Pp represent, respectively, the reference static pressure and total pressure measured by the pitot tube; and ρ is the air density.
Drag force (FD), lift force (FL), and pitching moment (M) presented in terms of coefficients per unit length; drag coefficient (CD), lift coefficient (CL), and moment coefficient (CM) are calculated using force balance according to the following formulas:
C D = F D P p P 0 d   ,
C L = F L P p P 0 d   ,
C M = M P p P 0 d 2   ,
where d is the height of the test model.

3. Results and Discussion

3.1. Impact of Natural Wind on the Test

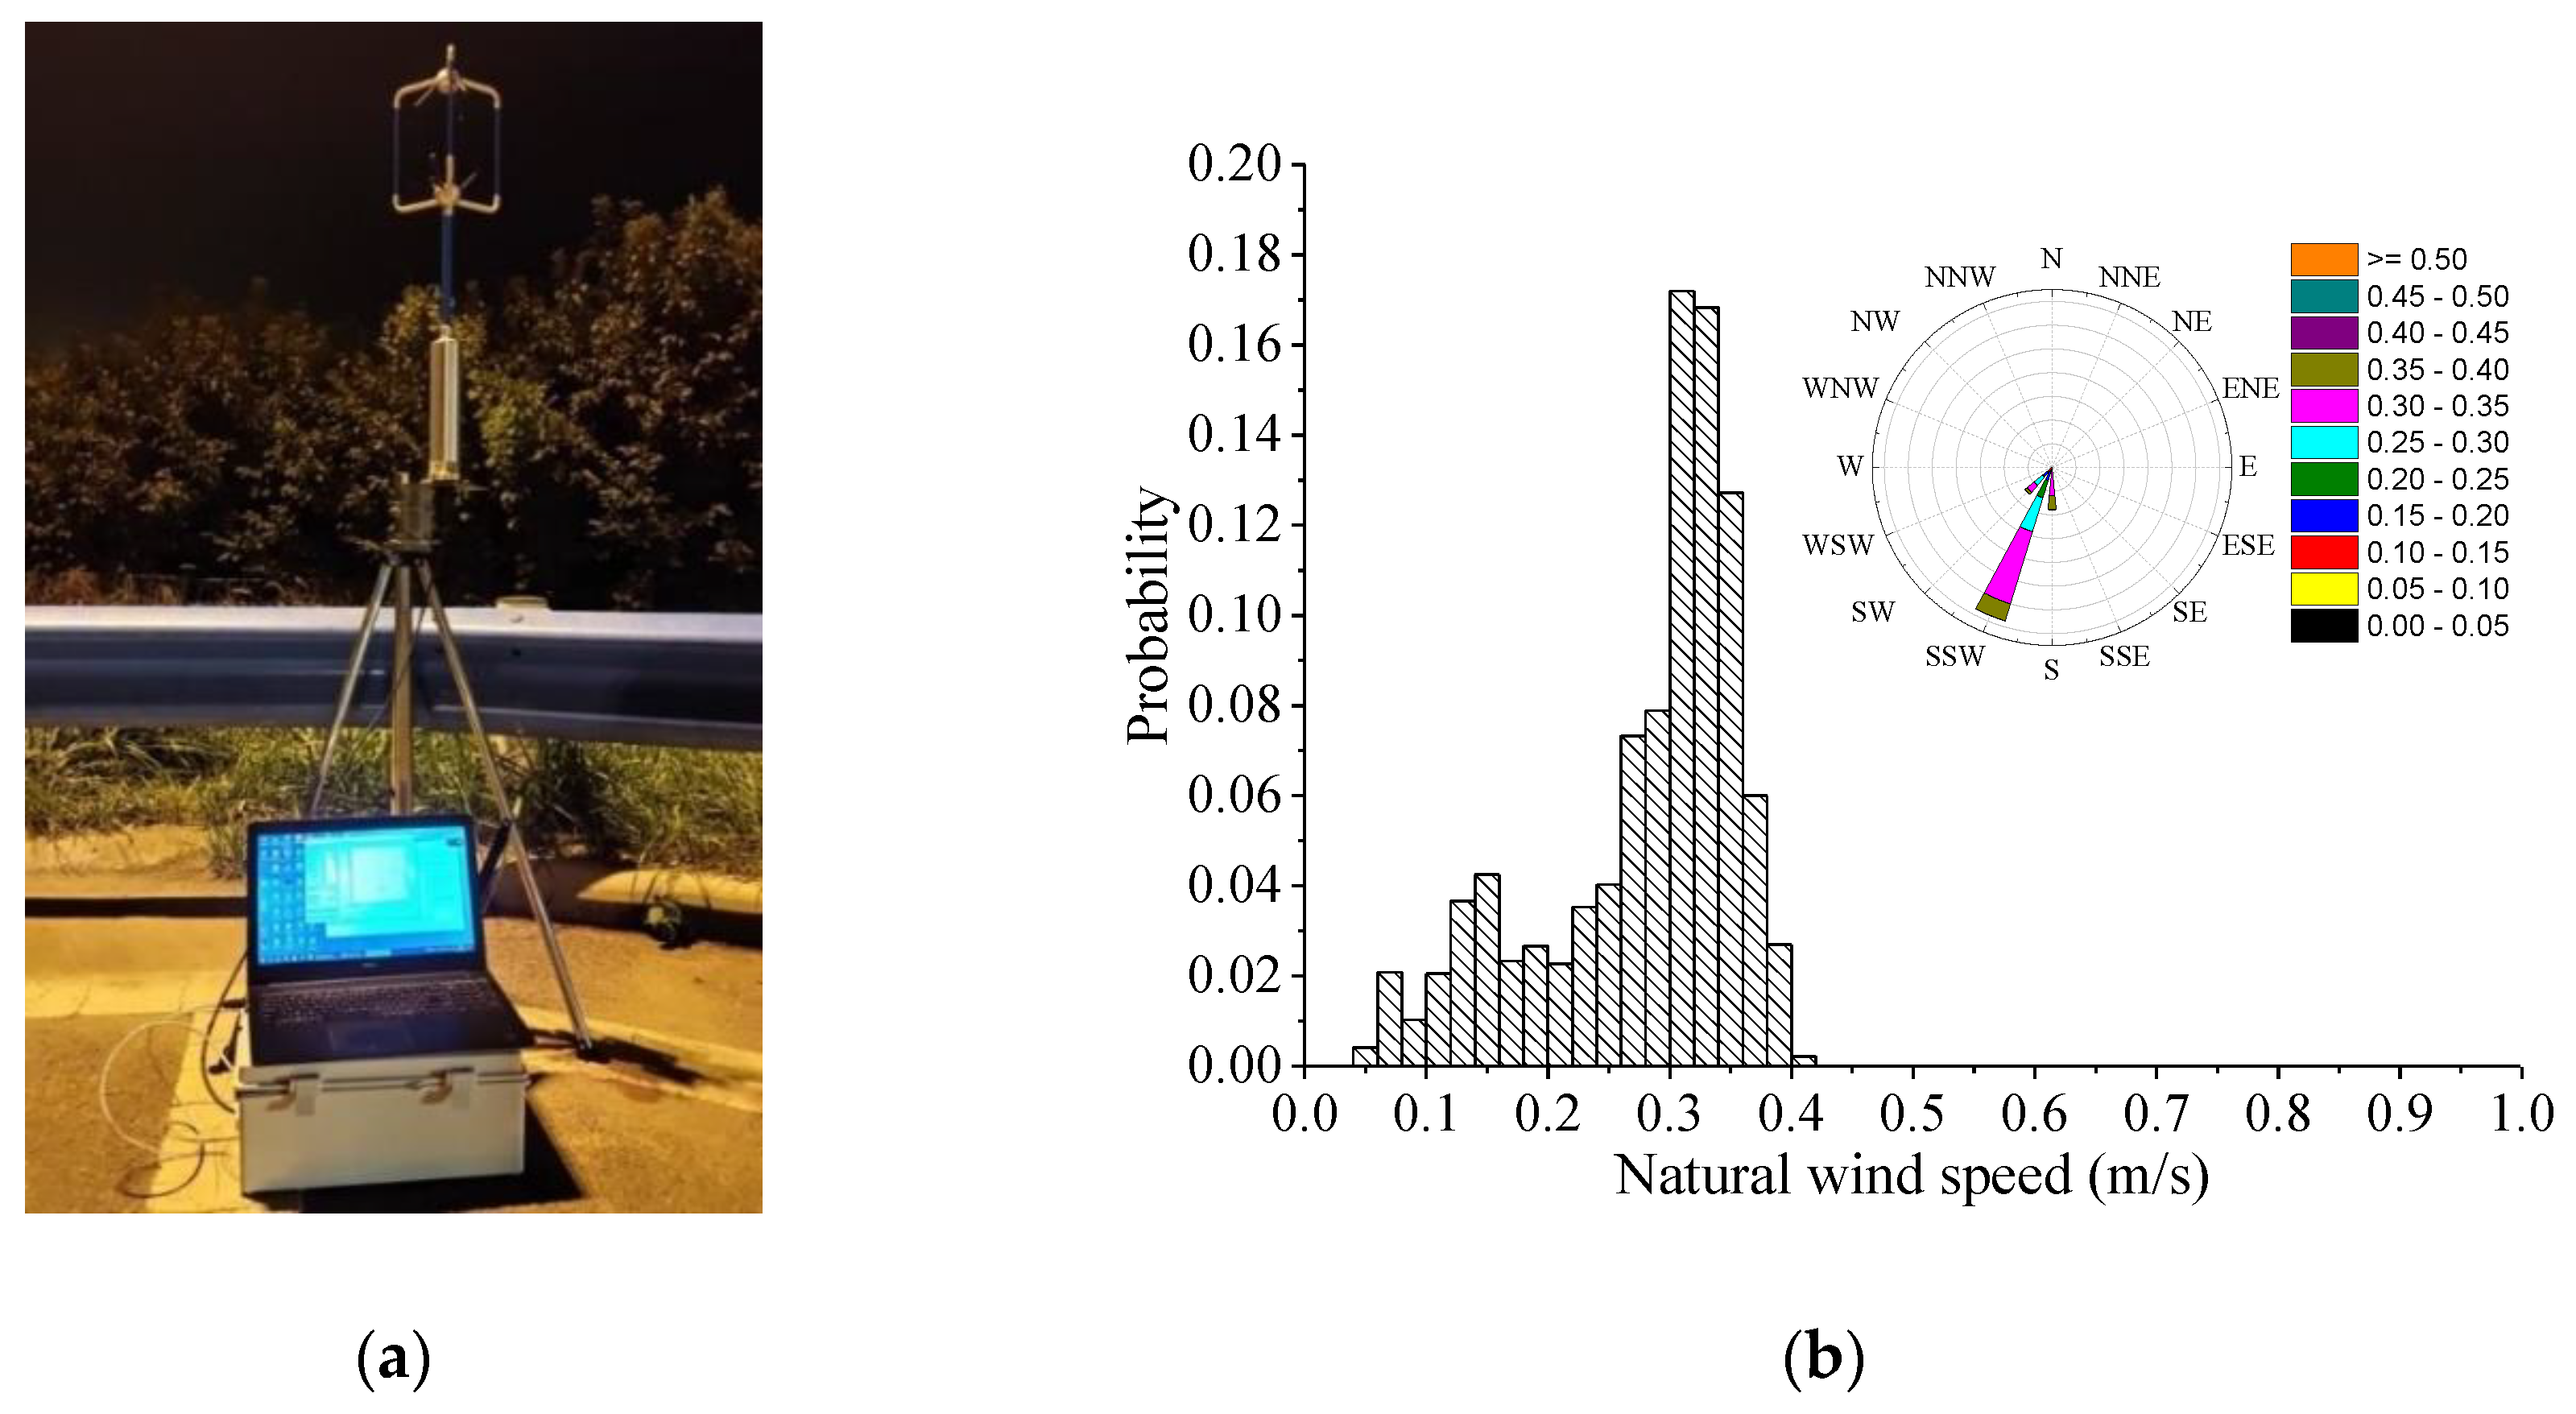
Located on the test road, the anemometer (Figure 6a) was mounted on a tripod with the sensing element elevated to be coincident with the vehicle’s height dimension. The ultrasonic anemometer synchronously recorded wind data in the east, north, and vertical directions. The wind attack angles in the vertical direction were particularly small in general, within the range of 3°. Therefore, the wind flow was considered to be in the horizontal direction [33]. Figure 6b shows the probability distribution of the direction and the speed of the natural wind. The natural wind speed is approximately 0.28 m/s, and its direction is mostly south-southwest. The ratio of the natural wind speed to airspeed is approximately 1.4%, based on the airspeed Vair measured with the pitot tube close to 20 m/s. Thus, the impact of the natural wind on the aerodynamic coefficients of the test model can be ignored.

3.2. Coefficient of Variation of Vehicle-Driving Wind Speed

Turbulence intensity is the simplest way to quantify and compare the characteristics of turbulence. It can indicate the turbulence length scale and the magnitude of turbulent fluctuations, thus remarkably describing the wind field of the transiting test. The turbulence intensity (or coefficient of variation of vehicle-driving wind speed [34]), for all the tests conducted, as a whole (for each the road types), was close to 4%, as shown in Table 4. Meanwhile, the coefficient of variation of vehicle-driving wind speed of the viaduct highway was greater than those of the expressway and tunnel highway. Thus, the wind field in the expressway test condition is the most stable, followed by the tunnel highway, while that of the viaduct is the worst. This fact can be explained by the fact that the test model is subjected to interferences arising from the crosswind while driving on the viaduct highway.
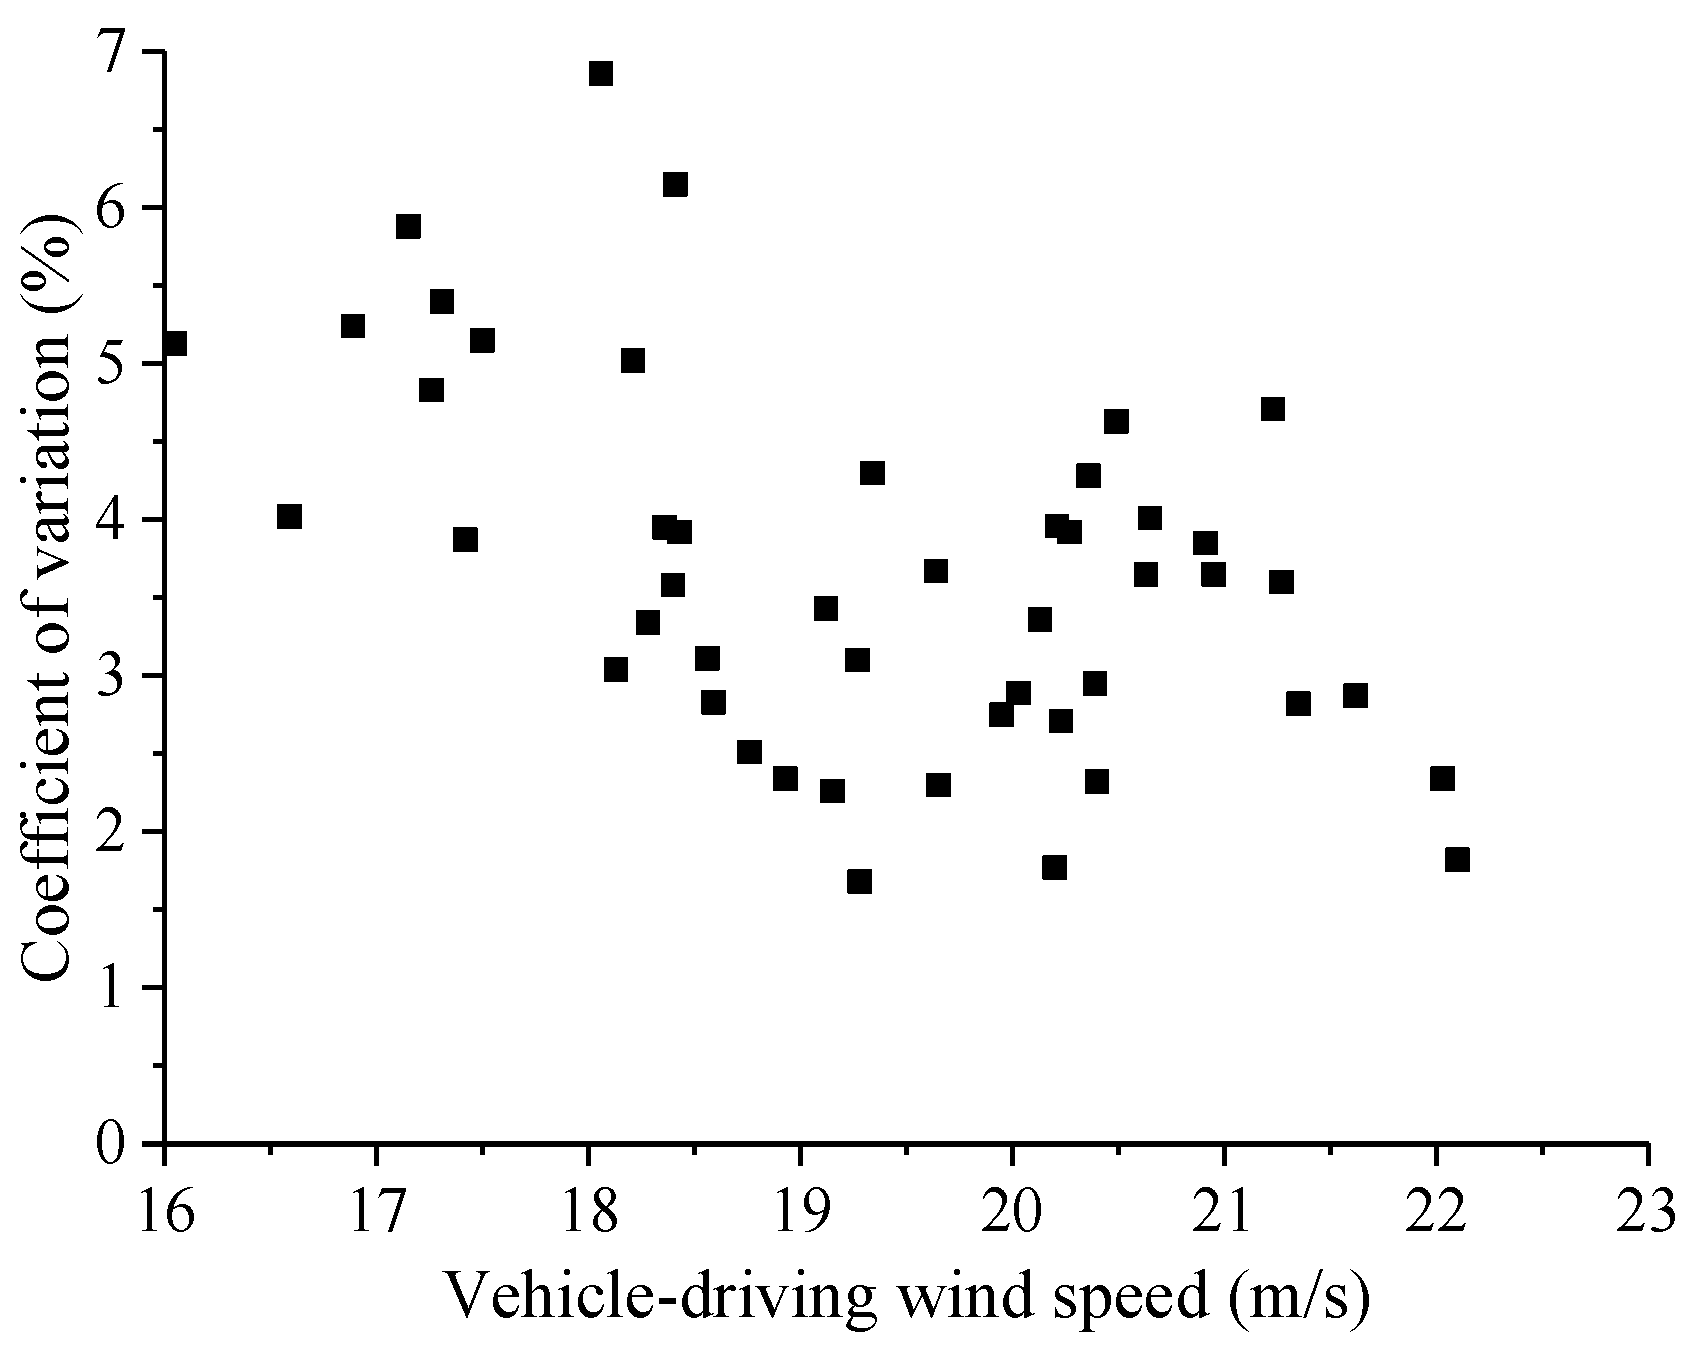
The general trend of coefficient of variation of vehicle-driving wind speed reducing with flow speed increasing can be illustrated in Figure 7, where the data were recorded on the expressway with wind attack angles varied. As shown in Figure 7, it seems that, whilst the data were scattered due to the nature of the wind, the differing thermal stratifications, and the variations in local roughness, there was a distinct correlation between velocities and intensity. These results are in accordance with those found by Watkins and Wordley [19,35]. All the tests were performed under the road speed of 20 m/s. Total wind speed of high values represents data recorded in a headwind. However, total wind speed of low values indicates either the influence of vehicle wakes or strong tail winds, thereby causing a velocity deficit visible via the pitot tube. That is, the coefficient of variation of vehicle-driving wind speed, which is greater than 4%, might be caused by these effects.

3.3. Stability Analysis of the Aerodynamic Forces and Vibration Accelerations

The time histories of all tests were visually inspected to check for evident transient events and unacceptable trends of the mean value. Then, time histories of the aerodynamic forces and vibration accelerations in corresponding directions were analyzed in time and frequency domains. The duration of each test is 40 s, and the sampling frequency is 50 Hz. The test results of the same road type are similar. Thus, Figure 8, Figure 9 and Figure 10 only present the time histories of the aerodynamic forces at wind attack angle of 30° and vibration accelerations in corresponding directions under test conditions of no end plates. From Figure 8, Figure 9 and Figure 10, a noise component was observed in the vibration accelerations of the viaduct highway and tunnel highway compared with the expressway. This phenomenon is due to the expansion joints of the viaduct highway and speed bumps of the tunnel highway. In general, vibration acceleration was usually divided into horizontal acceleration and vertical acceleration; due to the location of vibration source and other factors, there will be noise in vibration acceleration. Most measurements of vibration processes at the present time were made using vibration acceleration sensors (accelerometers), and the acceleration was converted into a vibration velocity or a vibration displacement by electrical methods. The vibration acceleration signal reflects the fluctuating range of the time histories of lift and drag forces, thus showing irregularity of the road surface. Various interfering factors, such as test model vibration and pavement irregularity, can cause evident noise signals when the vehicle moves on the viaduct highway and tunnel highway at a high speed. Thus, the original data must be preprocessed in a proper way.
The spectrum diagrams (Figure 11, Figure 12 and Figure 13) of the aerodynamic forces at a wind attack angle of 30°, and vibration accelerations in corresponding directions under test conditions of no end plates were obtained by performing Fast Fourier Transform. Figure 11 shows the fluctuation of lift and drag forces and vibration accelerations in the frequency domain, under test condition of expressway and no end plates.
A large error would be produced if one calculates aerodynamic forces directly based on the original signals. To avoid the error, a low-pass filter of 4 Hz [28] had been adopted in previous research when processing the original data. Figure 12 and Figure 13 indicate that the frequency fluctuation of the accelerations is concentrated mainly between 1 Hz and 4 Hz, thereby resulting in signal disturbance that corresponds to the main frequency band of the spectrum diagrams of the aerodynamic forces under test conditions of no end plates for viaduct highway and tunnel highway. Thus, the aerodynamic coefficients’ calculation of the test model with conditions of viaduct highway and tunnel highway was filtered using a low-pass filter to cancel the interference of the vehicle vibration on aerodynamic forces measurement. Different from [28], the cutoff frequency here was chosen as 1 Hz.
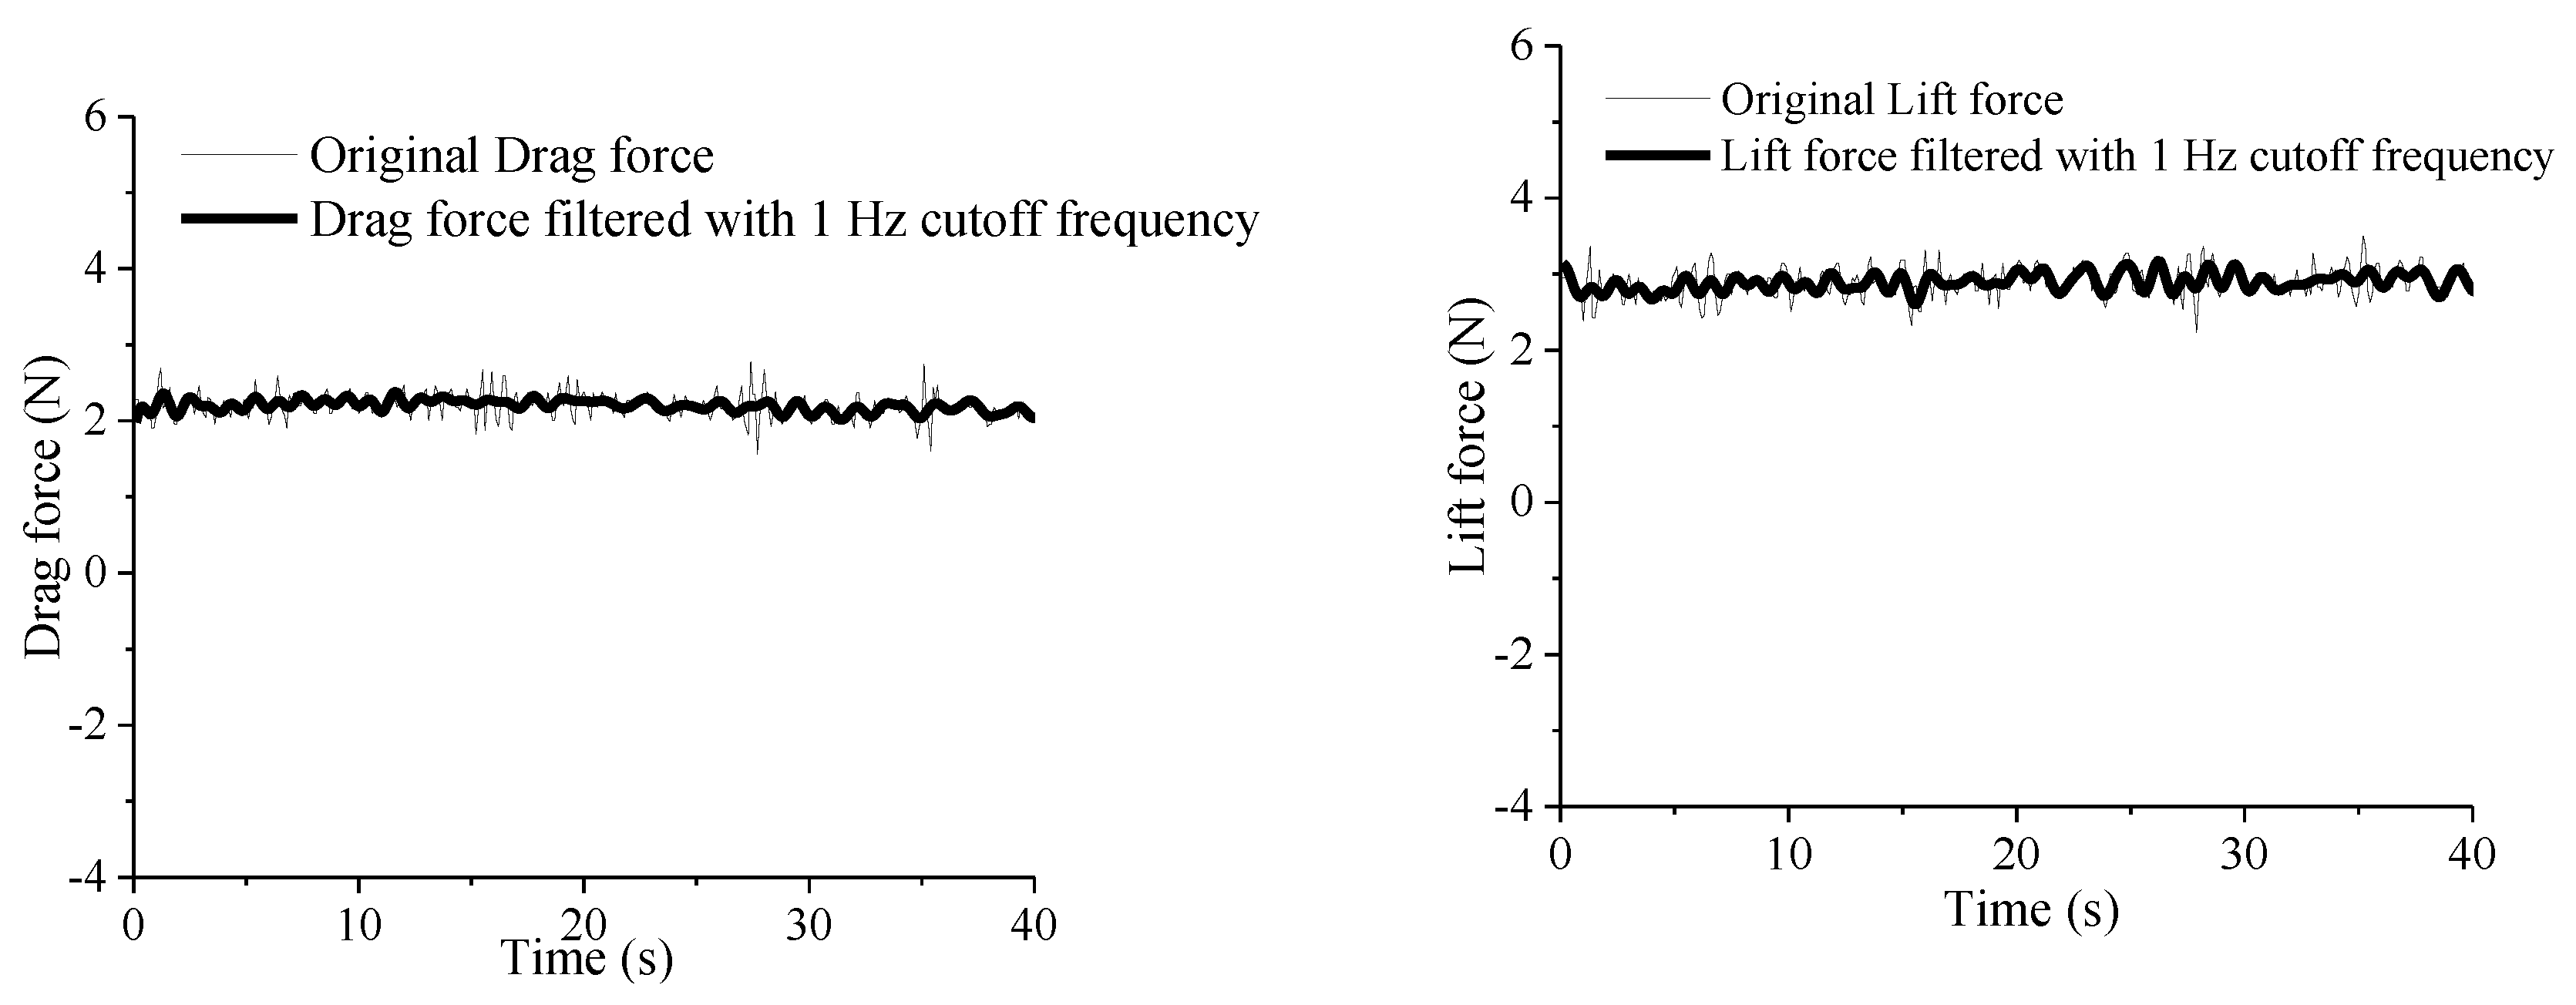
The stationarity level of the test data was characterized by the coefficients of variation [19,20]. The time histories of the aerodynamic forces without end plates before and after filtering at wind attack angle of 30° under test conditions of viaduct highway and tunnel highway are presented in Figure 14 and Figure 15, respectively. For tests on viaduct highway without end plates (Figure 14), the coefficients of variation of the drag force before and after filtering are 8.46% and 5.27%, respectively; and those of lift forces are 5.42% and 3.25%, respectively. For tests on the tunnel highway without end plates (Figure 15), the coefficients of variation of the drag force before and after filtering are 7.19% and 3.36%, respectively; and those of lift forces are 6.71% and 3.77%, respectively. The fluctuation of the aerodynamic forces is effectively diminished and becomes stable after filtering.

3.4. Influence of Road Types on Aerodynamic Coefficients

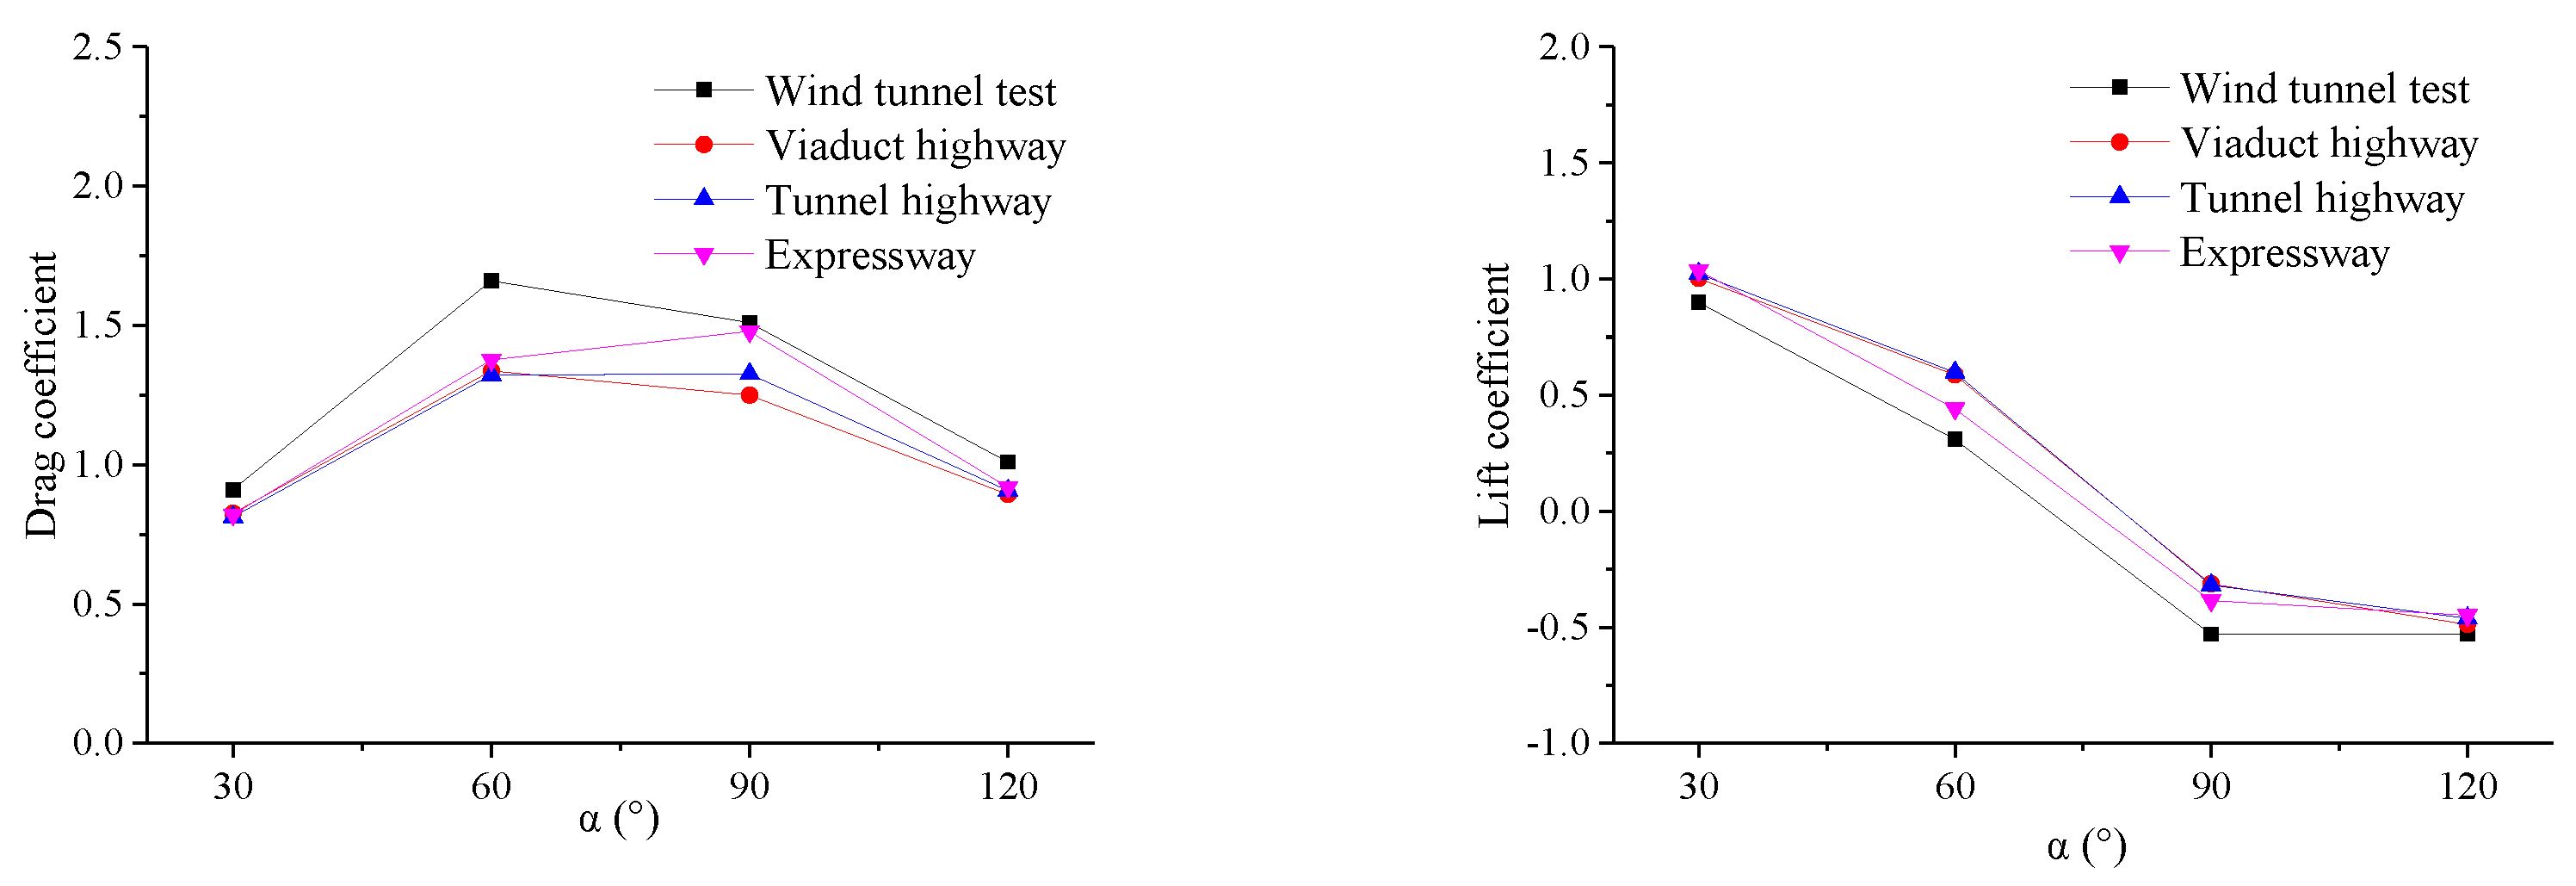
Aerodynamic coefficients of the test model calculated using Formulas (1)–(4) by the measured data are compared in Figure 16 and Figure 17. The tendency of the aerodynamic coefficients of the model under three test conditions (road types) of the transiting test with the changing of wind attack angles shows satisfactory consistency with a wind tunnel test. The error of the results between the transiting and the wind tunnel tests is mainly caused by differences in test devices and experimental environments. With the increase of wind attack angles, drag coefficients of the test model firstly increase and then decrease. By contrast, lift coefficients of the model decrease with the increasing wind attack angles. The results of the expressway are most consistent with the wind tunnel test, followed by the tunnel highway, while the viaduct highway is the worst due to crosswind and expansion joints. Results in Figure 16 and Figure 17 illustrate that the drag coefficients obtained under the tunnel highway test condition are greater than those of the viaduct highway due to the blockage effect. From Figure 16 and Figure 17, for the wind attack angle of 30°, all the six conditions showed good results compared with that of the wind tunnel test, while the test model with end plates on the expressway was the best. With wind attack angles increasing, however, even though all the six test conditions exhibited a larger difference with wind tunnel tests, the test model with end plates on the expressway still showed good consistency, and had better results compared with the other test conditions.
In general, the repeatability error refers to the RMS error of the aerodynamic coefficients of the same test model under the same test condition through non-continuous repeated tests. Three times repeatability precisions under six test conditions are shown in Table 5. The minimum drag and lift coefficients repeatability errors are 0.45 × 10⁻² and 0.46 × 10⁻², respectively. The maximum drag and lift coefficients repeatability errors are 5.98 × 10⁻² and 5.58 × 10⁻², respectively. The repeatability errors are within ±6%, thus verifying the good repeatability of the transiting tests carried out and the high precision of results.

3.5. Effect of End Plates on the Aerodynamic Coefficients

Aerodynamic coefficients of the test model with and without end plates are shown in Figure 18. No evident regularity was obtained from the lift coefficients of the test model. The drag coefficients of the test model in the transiting test without end plates were generally smaller, whereas those of the model with end plates showed good accordance with the wind tunnel test. For test conditions without end plates, the flow moves from the outer to the wake of the test model due to the difference in pressure of the leeward and the windward sides of the test model. The end plates can resist this flow, thus resulting in the increasing drag force. Fundamentally, end plates can decrease the influence of flow to ensure a nominal two-dimensional flow in the section model tests [36,37].

3.6. Comparison of the Influence of Road Types and Effect of End Plates

Average values of the aerodynamic coefficients of the test model under each test condition were calculated. The lift coefficients of the model exhibit no particular trend. The drag coefficients for wind attack angle of 30° are plotted in Figure 19, where the trends in the aerodynamic coefficients of the test model due to changes in road types and end plates can be better demonstrated. The data in Figure 19 demonstrate that the drag coefficients of the test model increase with road types (from viaduct highway to tunnel highway to expressway), but the sensitivity is not as strong as that for end plates [14]. In other words, the road type has a smaller influence on the drag coefficient of the test model, compared with end plates. Take the example of wind attack angle of 30°, the drag coefficients of expressway test conditions are 0.985 with end plates and 0.821 without end plates, while the drag coefficients of tunnel highway test conditions are 0.883 with end plates and 0.812 without end plates.

4. Conclusions

This paper mainly investigates the influence of road types on the transiting test for aerodynamic coefficient measurements: expressway, viaduct highway, and tunnel highway. The following remarks can be concluded from the experimental tests:
  • The coefficient of variation of vehicle-driving wind speed of the expressway, viaduct highway, and tunnel highway in the transiting tests were close to or even smaller than 4% under several conditions similar to those of the wind tunnel test, as follows: 3 °C temperature, 42% humidity, 0.28 m/s natural wind speed, vehicle driving at a stable speed in straight line, and no traffic flow.
  • In the transiting test under the aforementioned conditions, the tendency of the aerodynamic coefficients of the test model with the change of wind attack angles showed satisfactory consistency with that of the wind tunnel test. The results of the transiting test demonstrated satisfactory repeatability.
  • In comparison with the wind tunnel test, the drag coefficients of the test model in the transiting test without end plates were generally smaller, whereas those of the test model with end plates were in good agreement with the wind tunnel test.
  • The results obtained from the expressway were the most consistent with those from the wind tunnel test. In future research, transiting tests should be carried out on the expressway under the aforementioned conditions, with end plates installed on both ends of the test model.

Author Contributions

Conceptualization, methodology, X.Z. (Xiaoli Zhang); software, validation, formal analysis, investigation, resources, L.H., Y.H., X.Z. (Xufen Zheng) and R.W.; data curation, writing—original draft preparation, D.R.; writing—review and editing, visualization, supervision, project administration, funding acquisition, S.L. All authors have read and agreed to the published version of the manuscript.

Funding

This research was funded by [National Natural Science Foundation of China] grant number [51778587, 51808510], [Key Scientific and Technological Research Projects of Henan Province] grant number [212102310975], [Postdoctoral research grant in Henan Province] grant number [19030027], and The APC was funded by [Zhengzhou University].

Institutional Review Board Statement

Not applicable.

Informed Consent Statement

Not applicable.

Data Availability Statement

All data used are provided within the article in Section 3.

Acknowledgments

The authors are grateful for the financial support from the National Natural Science Foundation of China (51778587, 51808510), Key Scientific and Technological Research Projects of Henan Province (212102310975), and Postdoctoral research grant in Henan Province (19030027).

Conflicts of Interest

The authors declare no conflict of interest.

References

  1. Li, Y.; Tian, X.; Tee, K.F.; Li, Q.; Li, Y. Aerodynamic treatments for reduction of wind loads on high-rise buildings. J. Wind Eng. Ind. Aerodyn. 2018, 172, 107–115. [Google Scholar] [CrossRef]
  2. Sy, L.D.; Yamada, H.; Katsuchi, H. Interference effects of wind-over-top flow on high-rise buildings. J. Wind Eng. Ind. Aerodyn. 2019, 187, 85–96. [Google Scholar] [CrossRef]
  3. Ge, Y.J.; Xiang, H.F. Computational models and methods for aerodynamic flutter of long-span bridges. J. Wind Eng. Ind. Aerodyn. 2008, 96, 1912–1924. [Google Scholar] [CrossRef]
  4. Mashnad, M.; Jones, N.P. A model for vortex-induced vibration analysis of long-span bridges. J. Wind Eng. Ind. Aerodyn. 2014, 134, 96–108. [Google Scholar] [CrossRef]
  5. Choi, E.C.C. Field measurement and experimental study of wind speed profile during thunderstorms. J. Wind Eng. Ind. Aerodyn. 2004, 92, 275–290. [Google Scholar] [CrossRef]
  6. Huang, G.; Jiang, Y.; Peng, L.; Solari, G.; Liao, H.; Li, M. Characteristics of intense winds in mountain area based on field measurement: Focusing on thunderstorm winds. J. Wind Eng. Ind. Aerodyn. 2019, 190, 166–182. [Google Scholar] [CrossRef]
  7. Buccolieri, R.; Sandberg, M.; Wigö, H.; di Sabatino, S. The drag force distribution within regular arrays of cubes and its relation to cross ventilation—Theoretical and experimental analyses. J. Wind Eng. Ind. Aerodyn. 2019, 189, 91–103. [Google Scholar] [CrossRef]
  8. Alminhana, G.W.; Braun, A.L.; Loredo-Souza, A.M. A numerical-experimental investigation on the aerodynamic performance of CAARC building models with geometric modifications. J. Wind Eng. Ind. Aerodyn. 2018, 180, 34–48. [Google Scholar] [CrossRef]
  9. Noguchi, Y.; Suzuki, M.; Baker, C.; Nakade, K. Numerical and experimental study on the aerodynamic force coefficients of railway vehicles on an embankment in crosswind. J. Wind Eng. Ind. Aerodyn. 2019, 184, 90–105. [Google Scholar] [CrossRef]
  10. Diana, G.; de Ponte, S.; Falco, M.; Zasso, A. A new large wind tunnel for civil-environmental and aeronautical applications. J. Wind Eng. Ind. Aerodyn. 1998, 74–76, 553–565. [Google Scholar] [CrossRef]
  11. Diana, G.; Yamasaki, Y.; Larsen, A.; Rocchi, D.; Giappino, S.; Argentini, T.; Pagani, A.; Villani, M.; Somaschini, C.; Portentoso, M. Construction stages of the long span suspension Izmit Bay Bridge: Wind tunnel test assessment. J. Wind Eng. Ind. Aerodyn. 2013, 123, 300–310. [Google Scholar] [CrossRef]
  12. Jeong, H.; Lee, S.; Kwon, S.D. Blockage corrections for wind tunnel tests conducted on a Darrieus wind turbine. J. Wind Eng. Ind. Aerodyn. 2018, 179, 229–239. [Google Scholar] [CrossRef]
  13. Tang, Z.; Liu, P.; Sun, J.; Chen, Y.; Hao, G.; Li, G. Performance of Contra-Rotating Propellers for Stratospheric Airships. Int. J. Aeronaut. Space Sci. 2015, 16, 485–492. [Google Scholar] [CrossRef] [Green Version]
  14. Li, S.; Wan, R.; Wang, D.; Guo, P. Effect of end plates on transiting test for measuring the aerodynamic coefficient of structures using wind generated by a moving vehicle. J. Wind Eng. Ind. Aerodyn. 2019, 190, 273–286. [Google Scholar] [CrossRef]
  15. Li, S.; Liu, L.; Wu, H.; Jiang, N.; Zheng, S.; Guo, P. New test method of wind pressure coefficient based on CAARC standard model determined using vehicle driving wind. Exp. Tech. 2019, 43, 707–717. [Google Scholar] [CrossRef]
  16. Li, S.; Liang, J.; Zheng, S.; Jiang, N.; Liu, L.; Guo, P. A novel test method for aerodynamic coefficient measurements of structures using wind generated by a moving vehicle. Exp. Tech. 2019, 43, 677–693. [Google Scholar] [CrossRef]
  17. Alonso, G.; Meseguer, J. A parametric study of the galloping stability of two-dimensional triangular cross-section bodies. J. Wind Eng. Ind. Aerodyn. 2006, 94, 241–253. [Google Scholar] [CrossRef]
  18. Alonso, G.; Meseguer, J.; Pérez-Grande, I. Galloping stability of triangular cross-sectional bodies: A systematic approach. J. Wind Eng. Ind. Aerodyn. 2007, 95, 928–940. [Google Scholar] [CrossRef]
  19. Hui, M.C.H.; Zhou, Z.Y.; Chen, A.R.; Xiang, H.F. The effect of Reynolds numbers on the steady state aerodynamic force coefficients of the Stonecutters Bridge deck section. Wind Struct. 2008, 11, 179–192. [Google Scholar] [CrossRef]
  20. Lee, S.; Kwon, S.; Yoon, J. Reynolds number sensitivity to aerodynamic forces of twin box bridge girder. J. Wind Eng. Ind. Aerodyn. 2014, 127, 59–68. [Google Scholar] [CrossRef]
  21. Mcauliffe, B.R.; Belluz, L.; Belzile, M. Measurement of the On-Road Turbulence Environment Experienced by Heavy Duty Vehicles. SAE Int. J. Commer. Veh. 2014, 7, 685–702. [Google Scholar] [CrossRef]
  22. Pu, Y.; Chen, F.; Chen, P.; Pan, X. Wind data collection and analysis of topographical features along a highway for traffic safety assessment based on mobile mapping technology. Transp. Res. Rec. 2018, 2672, 292–301. [Google Scholar] [CrossRef]
  23. Wordley, S.; Saunders, J.W. On-road Turbulence: Part 1. SAE Int. J. Passeng. Cars Mech. Syst. 2008, 1, 341–360. [Google Scholar] [CrossRef]
  24. Wordley, S.; Saunders, J.W. On-road Turbulence: Part 2. SAE Int. J. Passeng. Cars Mech. Syst. 2009, 2, 111–137. [Google Scholar] [CrossRef]
  25. Choi, J.K.; Kim, K.H. Effects of nose shape and tunnel cross-sectional area on aerodynamic drag of train traveling in tunnels. Tunn. Undergr. Space Technol. 2014, 41, 62–73. [Google Scholar] [CrossRef]
  26. Muñoz-Paniagua, J.; García, J.; Crespo, A. Genetically aerodynamic optimization of the nose shape of a high-speed train entering a tunnel. J. Wind Eng. Ind. Aerodyn. 2014, 130, 48–61. [Google Scholar] [CrossRef] [Green Version]
  27. He, X.H.; Zou, Y.F.; Wang, H.F.; Han, Y.; Shi, K. Aerodynamic characteristics of a trailing rail vehicles on viaduct based on still wind tunnel experiments. J. Wind Eng. Ind. Aerodyn. 2014, 135, 22–33. [Google Scholar] [CrossRef]
  28. Guo, P.; Li, S.; Wang, C.; Hu, Y.; Wang, D. Influence of catwalk design parameters on the galloping of constructing main cables in long-span suspension bridges. J. Vibroeng. 2017, 19, 4671–4684. [Google Scholar]
  29. Wang, X.; Gu, M. Experimental investigation of Reynolds number effects on 2D rectangular prisms with various side ratios and rounded corners. Wind Struct. 2015, 21, 183–202. [Google Scholar] [CrossRef]
  30. Agostinacchio, M.; Ciampa, D.; Olita, S. The vibrations induced by surface irregularities in road pavements—A Matlab® approach. Eur. Transp. Res. Rev. 2014, 6, 267–275. [Google Scholar] [CrossRef] [Green Version]
  31. Haigermoser, A.; Luber, B.; Rauh, J.; Fe, G.G. Road and track irregularities: Measurement, assessment and simulation. Veh. Syst. Dyn. 2015, 53, 878–957. [Google Scholar] [CrossRef]
  32. Li, Y.; Hu, P.; Xu, Y.; Zhang, M.; Liao, H. Wind loads on a moving vehicle-bridge deck system by wind-tunnel model test. Wind Struct. 2014, 19, 145–167. [Google Scholar] [CrossRef]
  33. Li, B.; Yang, Q.; Yang, J. Wind characteristics near ground in south-eastern coast area of China based on field measurement. Geomat. Nat. Hazards Risk 2016, 7, 57–69. [Google Scholar] [CrossRef] [Green Version]
  34. Xu, F.; Cai, C.; Zhang, Z. Investigations on coefficient of variation of extreme wind speed. Wind Struct. 2014, 18, 633–650. [Google Scholar] [CrossRef]
  35. Watkins, S.; Saunders, J.W.; Hoffmann, P.H. Turbulence experienced by moving vehicles. Part I. Introduction and turbulence intensity. J. Wind Eng. Ind. Aerodyn. 1995, 57, 1–17. [Google Scholar] [CrossRef]
  36. An, Y.; Wang, C.; Li, S.; Wang, D. Galloping of steepled main cables in long-span suspension bridges during construction. Wind Struct. 2016, 23, 595–613. [Google Scholar] [CrossRef]
  37. Li, S.; An, Y.; Wang, C.; Wang, D. Experimental and numerical studies on galloping of the flat-topped main cables for the long span suspension bridge during construction. J. Wind Eng. Ind. Aerodyn. 2017, 163, 24–32. [Google Scholar] [CrossRef]
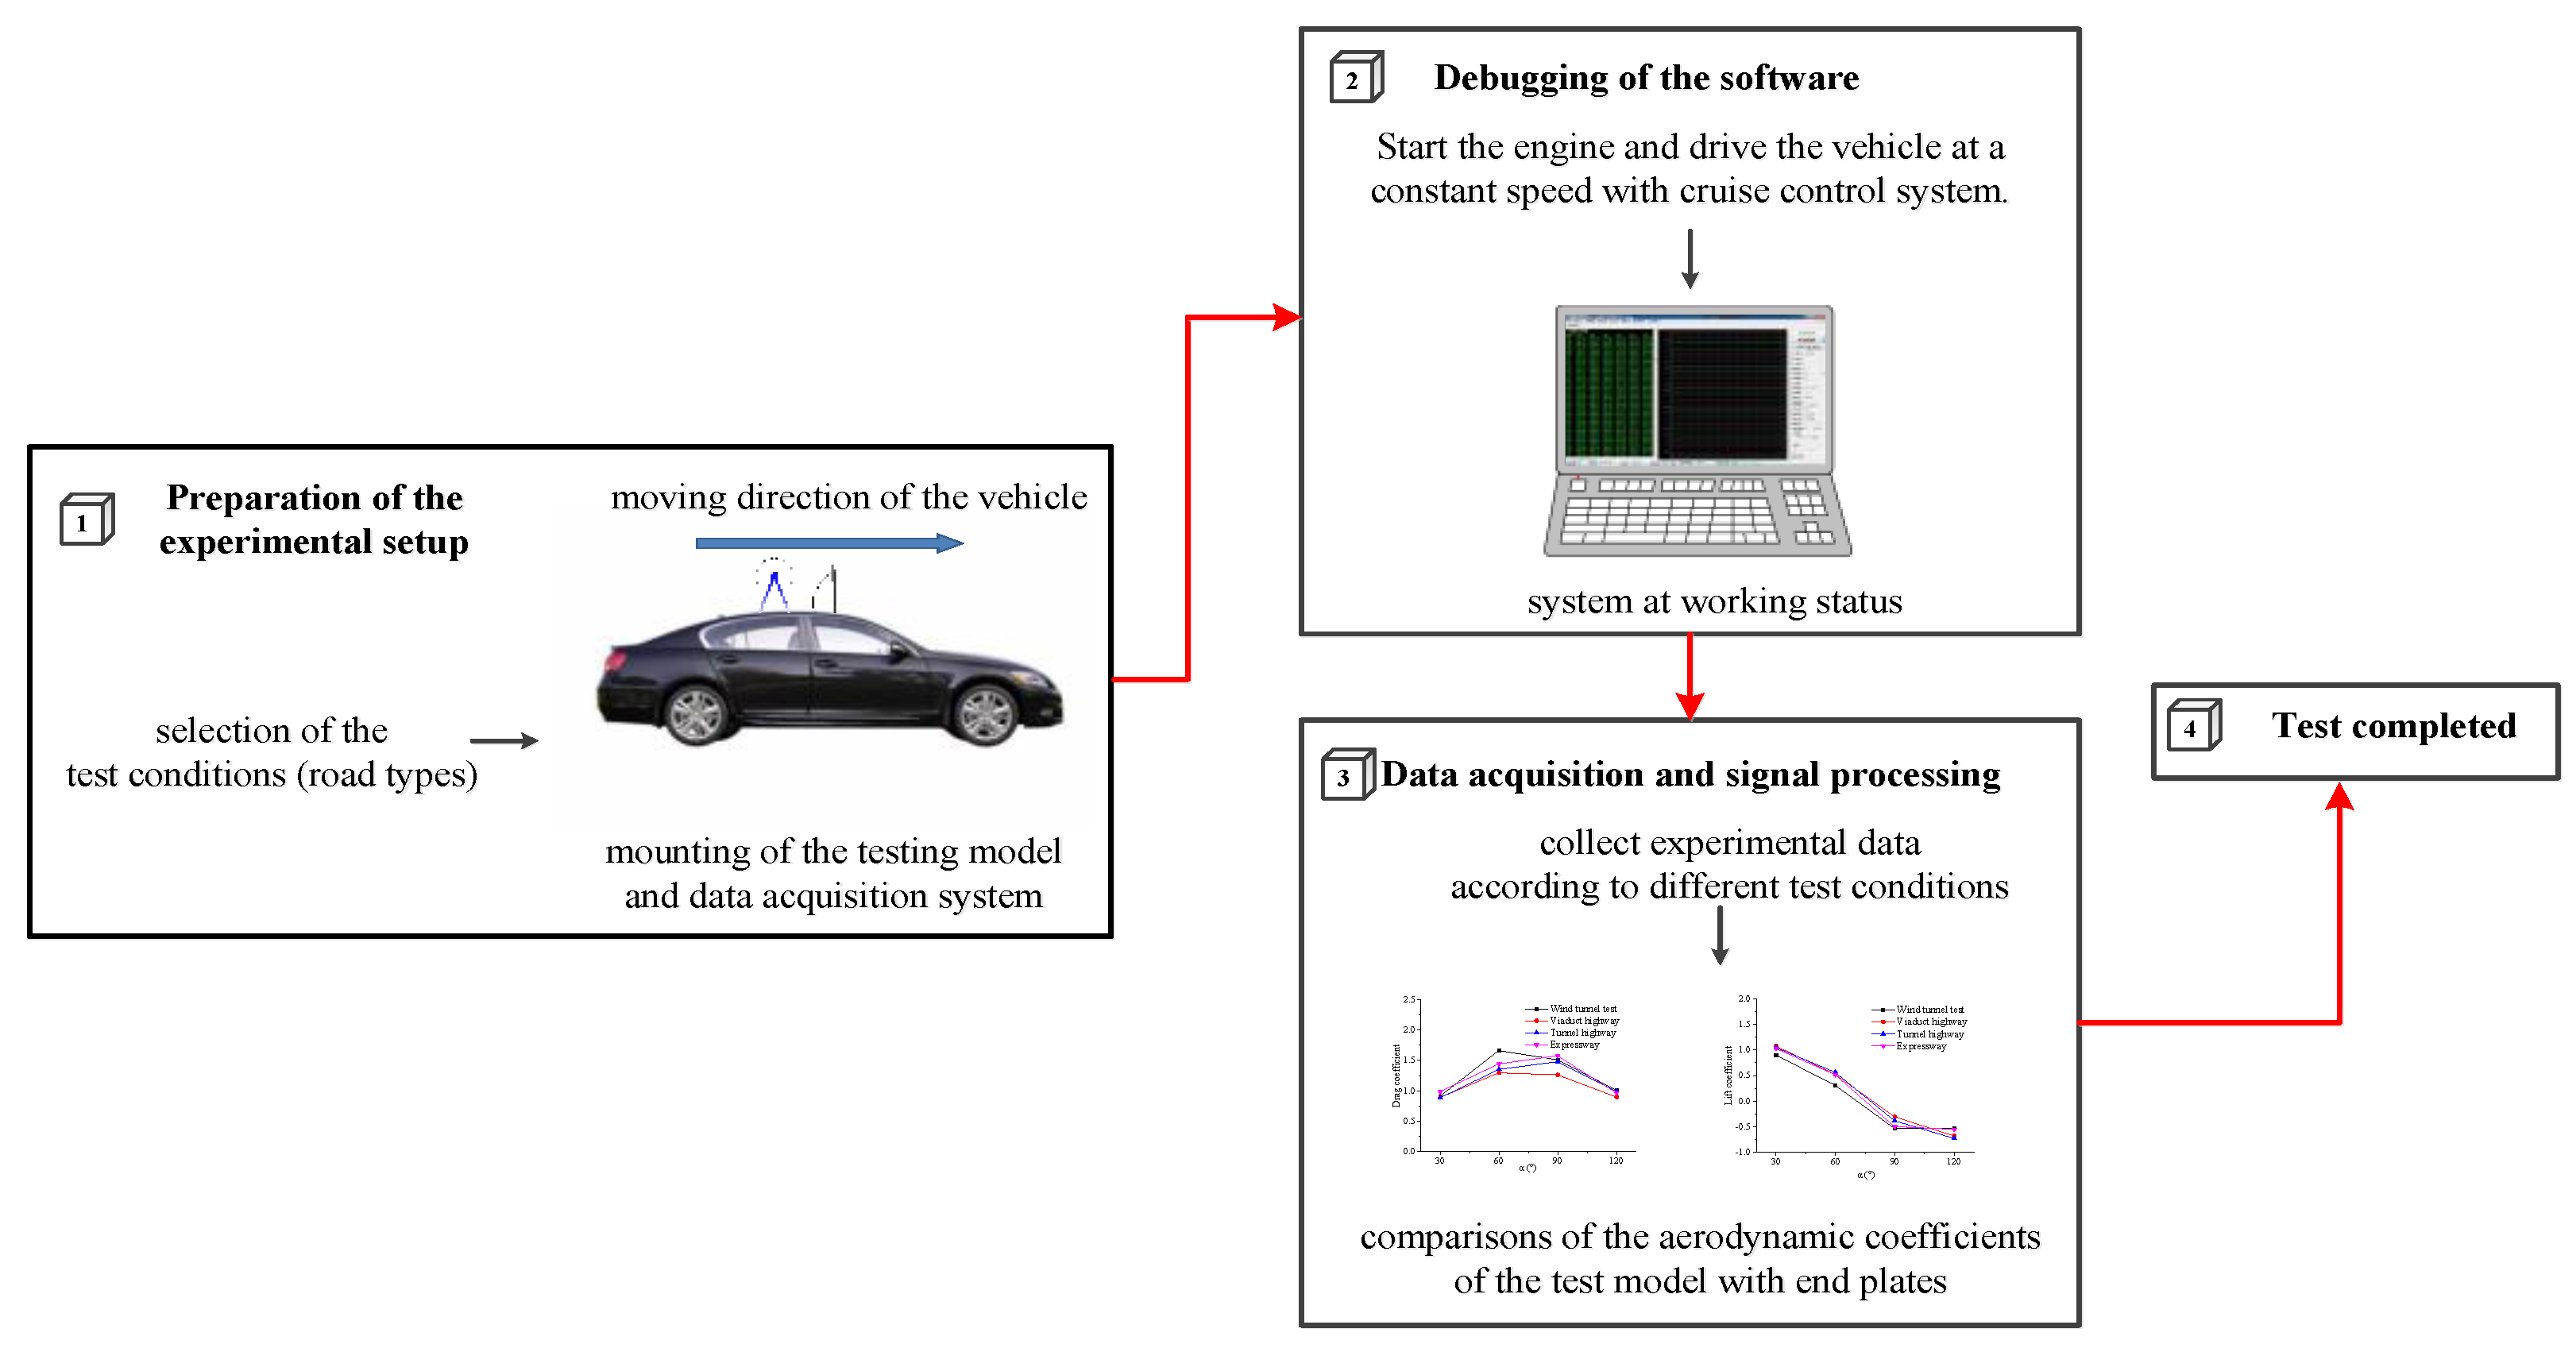
Figure 1. Schematic of the testing procedure.
Processes 10 01471 g001
Figure 2. Test devices of transiting test for aerodynamic coefficient measurements on top of the testing vehicle.
Processes 10 01471 g002
Figure 3. Ultra-low-frequency accelerometers and corresponding data acquisition instrument.
Processes 10 01471 g003
Figure 4. Data acquisition systems of the transiting tests.
Processes 10 01471 g004
Figure 5. Prism model used in the transiting tests. (a) 30° Angle of attack, (b) 60° Angle of attack, (c) 90° Angle of attack, (d) 120° Angle of attack.
Processes 10 01471 g005
Figure 6. Ultrasonic anemometer (a) to measure the speed and direction of natural wind and its probability distribution (b).
Processes 10 01471 g006
Figure 7. Coefficient of variation of vehicle-driving wind speed of the wind field measured on the expressway.
Processes 10 01471 g007
Figure 8. Time histories of aerodynamic forces (at wind attack angle of 30°) and vibration accelerations in the corresponding direction, with test conditions of expressway and no end plates.
Processes 10 01471 g008
Figure 9. Time histories of aerodynamic forces (at wind attack angle of 30°) and vibration accelerations in the corresponding direction, with test conditions of viaduct highway and no end plates.
Processes 10 01471 g009
Figure 10. Time histories of aerodynamic forces (at wind attack angle of 30°) and vibration accelerations in the corresponding direction, with test conditions of tunnel highway and no end plates.
Processes 10 01471 g010
Figure 11. Spectrum diagrams of the aerodynamic force (at wind attack angle of 30°) and vibration accelerations in the corresponding direction under test condition of no end plates and expressway.
Processes 10 01471 g011
Figure 12. Spectrum diagrams of the aerodynamic force (at wind attack angle of 30°) and vibration accelerations in the corresponding direction under test condition of no end plates and viaduct highway.
Processes 10 01471 g012
Figure 13. Spectrum diagrams of the aerodynamic force (at wind attack angle of 30°) and vibration accelerations in the corresponding direction under test condition of no end plates and tunnel highway.
Processes 10 01471 g013
Figure 14. Time histories of the aerodynamic forces in conditions of viaduct highway and no end plates, at a wind attack angle of 30°.
Processes 10 01471 g014
Figure 15. Time histories of the aerodynamic forces in conditions of tunnel highway and no end plates, at a wind attack angle of 30°.
Processes 10 01471 g015
Figure 16. Comparisons of the aerodynamic coefficients of the test model with end plates measured by the wind tunnel test and transiting tests.
Processes 10 01471 g016
Figure 17. Comparisons of the aerodynamic coefficients of the test model without end plates measured by the wind tunnel test and transiting tests.
Processes 10 01471 g017
Figure 18. Aerodynamic coefficients comparison for the end plates effect.
Processes 10 01471 g018
Figure 19. Aerodynamic coefficients of the model at the wind attack angle of 30°, with changes in road types and end plates.
Processes 10 01471 g019
Table 1. Description of the transiting test devices.
Test DevicesPurpose
Ultra-low-frequency accelerometers and
Data collecting instrument
Measurement of wind speed and direction
Pitot tube and
Demodulation instrument
Measurement of air pressure
Vibration accelerometer and
Intelligent control instrument
Measurement of vibration acceleration
Force balanceMeasurement of lift and drag forces.
Table 2. Description of the transiting test conditions.
Test ConditionsRoad TypesEnd Plate ConditionsWind Attack AnglesAcquisition Time
Expressway, no end platesExpresswayNo end plates30°, 60°, 90°, 120°100 s
Expressway, end platesEnd plates
Viaduct highway, no end platesViaduct highwayNo end plates
Viaduct highway, end platesEnd plates
Tunnel highway, no end platesTunnel highwayNo end plates
Tunnel highway, end platesEnd plates
Table 3. Mitigations to cancel interferences for the transiting test.
Interfering FactorsInterference Mitigations
Vibrations induced by irregular motion of the vehicleTests conducted in straight road with flat surface, use of Cruise Control System
Ancillary facilities (road greening, etc.) along the highwayVehicle driven in center of the lane
Traffic densityTests carried out at night
Natural wind, temperature, and humidityTests done with 0.28 m/s natural wind speed, 3 °C temperature, and 42% humidity
Boundary layer (less than 10 cm) of the vehicle roofAt least a distance of 30 cm between the test model and experimental platform
Vibration of the test modelUse of steel frame to fix the plexiglass model to the experimental platform
Data acquisition systemInstruments placed in the vehicle with cables well arranged
Table 4. Measured coefficient of variation of vehicle-driving wind speed (%).
Test ConditionsWind Attack Angles
30°60°90°120°Average
Expressway, no end plates2.804.413.773.783.69
Expressway, end plates2.556.781.932.623.47
Viaduct highway, no end plate2.304.143.383.143.24
Viaduct highway, end plate3.926.151.682.453.55
Tunnel highway, no end plate2.053.232.491.772.39
Tunnel highway, end plate3.363.162.321.832.67
Wind tunnel test [29,30]≤4.00
Table 5. Three times repeatability precision (×10−2) of aerodynamic coefficients from transiting tests conducted.
Aerodynamic CoefficientsTest ConditionsWind Attack Angles
30°60°90°120°
Drag force coefficientsExpressway, no end plates0.453.883.065.04
Expressway, end plates1.054.230.762.93
Viaduct highway, no end plates5.982.151.742.63
Viaduct highway, end plates1.792.801.092.00
Tunnel highway, no end plates2.361.105.382.49
Tunnel highway, end plates4.504.832.651.70
Lift force coefficientsExpressway, no end plates1.301.362.354.64
Expressway, end plates0.463.354.162.44
Viaduct highway, no end plates5.583.032.301.39
Viaduct highway, end plates2.592.291.731.56
Tunnel highway, no end plates2.354.522.740.59
Tunnel highway, end plates5.711.771.300.96
Publisher’s Note: MDPI stays neutral with regard to jurisdictional claims in published maps and institutional affiliations.