Article

Influence of Guide Vane Profile Change on Draft Tube Flow Characteristics of Water Pump Turbine

1
School of Energy and Power Engineering, Lanzhou University of Technology, Lanzhou 730050, China
2
State Key Laboratory of Fluid Machinery and Systems, Lanzhou 730050, China
3
Huaneng Gansu Hydropower Development Co., Ltd., Lanzhou 730050, China
*
Author to whom correspondence should be addressed.
Processes 2022, 10(8), 1494; https://doi.org/10.3390/pr10081494
Submission received: 7 July 2022 / Revised: 26 July 2022 / Accepted: 27 July 2022 / Published: 29 July 2022
(This article belongs to the Special Issue CFD Modelling and Simulation of Water Turbines)

Abstract

:
In order to study the influence of the change of the guide vane airfoil on the flow characteristics in the draft tube of a reversible hydraulic turbine, a reversible hydraulic turbine was used as the object of study, and the effect of the change on the flow pattern, energy loss, and pressure pulsation in the draft tube area was studied based on the SST k-ω turbulence model. The results show that under low flow conditions, the modified movable guide vane directly affects the direction and speed of water entering the draft tube, reduces the density of vortex in the draft tube area, reduces the impact on the near wall of the draft tube during the rotation of the vortex belt, and improves the stability of the unit operation. The turbulent energy comparison graph shows that the energy loss in the bent elbow section and the diffusion section of the draft tube is reduced, and the energy return coefficient of the draft tube is improved by calculating that the energy recovery level of the draft tube is improved under different operating conditions. A comparative analysis of the pressure pulsation in the draft tube area before and after the modification in combination with the development of the vortex belt shows that the modified movable guide vane effectively reduces the vibration intensity in the draft tube area and improves the stable operation threshold of the unit.

1. Introduction

Under the “dual carbon” target (China clearly proposes the goal of “carbon peaking” in 2030 and “carbon neutrality” in 2060), the hydropower industry is highly valued by the country [1]. The pumped storage power station is a special power source in the power system with multiple functions, such as peak regulation, valley filling, frequency regulation, phase regulation, and accident backup, which has become an important part of China’s power system [2]. As the performance indexes of reversible turbine with high and ultra-high head become the need of industrial development, the stability of turbine operation also draws attention. For many years, domestic and foreign research scholars have been attaching great importance to the study of the draft tube area and have achieved many work results. In the early years, scholars used experimental and numerical methods to carry out experimental analysis and theoretical research on the draft tube area of hydraulic turbine units, trying to investigate the relationship between the water flow pattern and pressure pulsation in the draft tube area of hydraulic turbines in order to conduct a preliminary discussion on the pulsation mechanism [3,4,5]. In the 1970s, Kubota et al. conducted a systematic study on the relationship between the amplitude of pressure pulsation in the draft tube and the cavitation coefficient and flow rate using model tests, and proposed that the amplitude of pressure pulsation in the draft tube was mainly related to the ratio of operating flow rate to design flow rate [6,7]. Jacol et al. obtained the distribution characteristics of the pressure pulsation in the draft tube of a Francis turbine at different flow rates through field measurements of many prototype units, and also conducted a preliminary study on the causes of pressure pulsation in the draft tube under different operating conditions and improvement measures [8]. Nishi experimentally studied the relationship between the vortex excitation frequency and the operating head and flow rate, and proposed that the maximum pressure pulsation in the draft tube is related to the location of the vortex nucleus in the draft tube [9]. Iliescu measured the flow field characteristics inside the draft tube by PIV (Particle Image Velocimetry) and conducted a detailed study of the volume and center of the cavitation vortex zone with the variation of the cavitation number [10]. Wu Gang et al. investigated the relationship between pressure pulsation in the draft tube and the inlet flow field of the draft tube and the opening of the guide vane. On the basis of model tests, the results of water-pressure pulsation tests, flow field tests, and incipient cavitation observations were analyzed to study the effect of changes in the opening of the turbine’s movable guide vane on water-pressure pulsation in the draft tube [11]. The use of experimental methods is subject to the uncontrollable influence of experimental methods and relatively large costs, and are not easily carried out on a large scale. In recent years, due to the development of computer technology and numerical simulation technology, there are now many versions of simulation software to study the phenomenon of pressure pulsation in the vortex zone of the turbine draft tube [12,13,14,15]. Most of these studies use CFD (Computational Fluid Dynamics) flow field analysis software to simulate normal operating conditions of reversible hydraulic turbines. Li Qifei et al. found that the instability of the draft tube was one of the major causes of vibration in reversible hydraulic turbines. When the reversible turbine deviates from the optimal working conditions of the turbine, the impact of its vortex belt on the wall will cause violent pressure pulsations in the draft tube area, which will propagate upstream and cause vibration of the whole unit, which is not conducive to the stable operation of the reversible turbine [16]. Significant draft tube back-flow has a direct contact with the runner surface. Induced low-frequency fluctuations of the hydraulic thrust and torque explain severe vibrations of the runner [17]. Further upstream propagation of the vortex rope instabilities increases pulsations inside runner channels by superimposing pressure pulsations into inter-blade vortices [18]. Every disturbance downstream can be found throughout the hydraulic circuit and can be a major cause of system instability in certain load ranges [19,20]. Guo Tao et al. analyzed the vortex band evolution in the turbine draft tube region under different incoming flows by means of a slip-grid technique [21]. Numerical simulations are too idealistic, so nowadays, a combination of experimental and numerical simulations is used to analyze the problem. Experts have also never stopped exploring to improve the stability of the draft tube. Theoretical studies on the structural safety of the turbine draft tube found that the area of the low-velocity zone of the runner exit flow field directly affects the size of the vortex band and the pressure pulsation [22], and the outlet flow rate and direction also interfere with the shape of the vortex band [23,24]. Not only that, the influence of the eddy current on the unit will also play a decisive role in the stability of the entire water transmission and power generation system [25]. A considerable number of scholars have also considered the method of adding additional structures to the draft tube to improve its internal flow field, all with varying degrees of progress [26,27,28]. The effect of changing the structure affecting the incoming flow on the internal flow of the turbine has also been continuously studied by scholars. Liangbeng Rong et al. used the NACA0018 parent model to obtain the numerically optimized airfoil type and solved it with the MRF (model Multiple Reference Frame Model, also called the composite coordinate system model, a method provided by Fluent software to solve the problem of coexistence of static and dynamic regions), giving the calculation results and comparing them with the parent model to examine the degree of improvement in the energy utilization of the turbine [29]. Qifei Li et al. found that the change of the radius of the head circle of the guide vane would also have different degrees of influence on the excitation force of the turbine runner [30]. This paper investigates the effect of transient flow field characteristics in the draft tube of a reversible turbine unit under normal operating conditions by changing the structure of the movable guide vane wing, focusing on the effect of the guide vane opening on the evolution of the vortex zone shape, pressure pulsation, and energy loss in the draft tube.

2. Design Process and Model Building

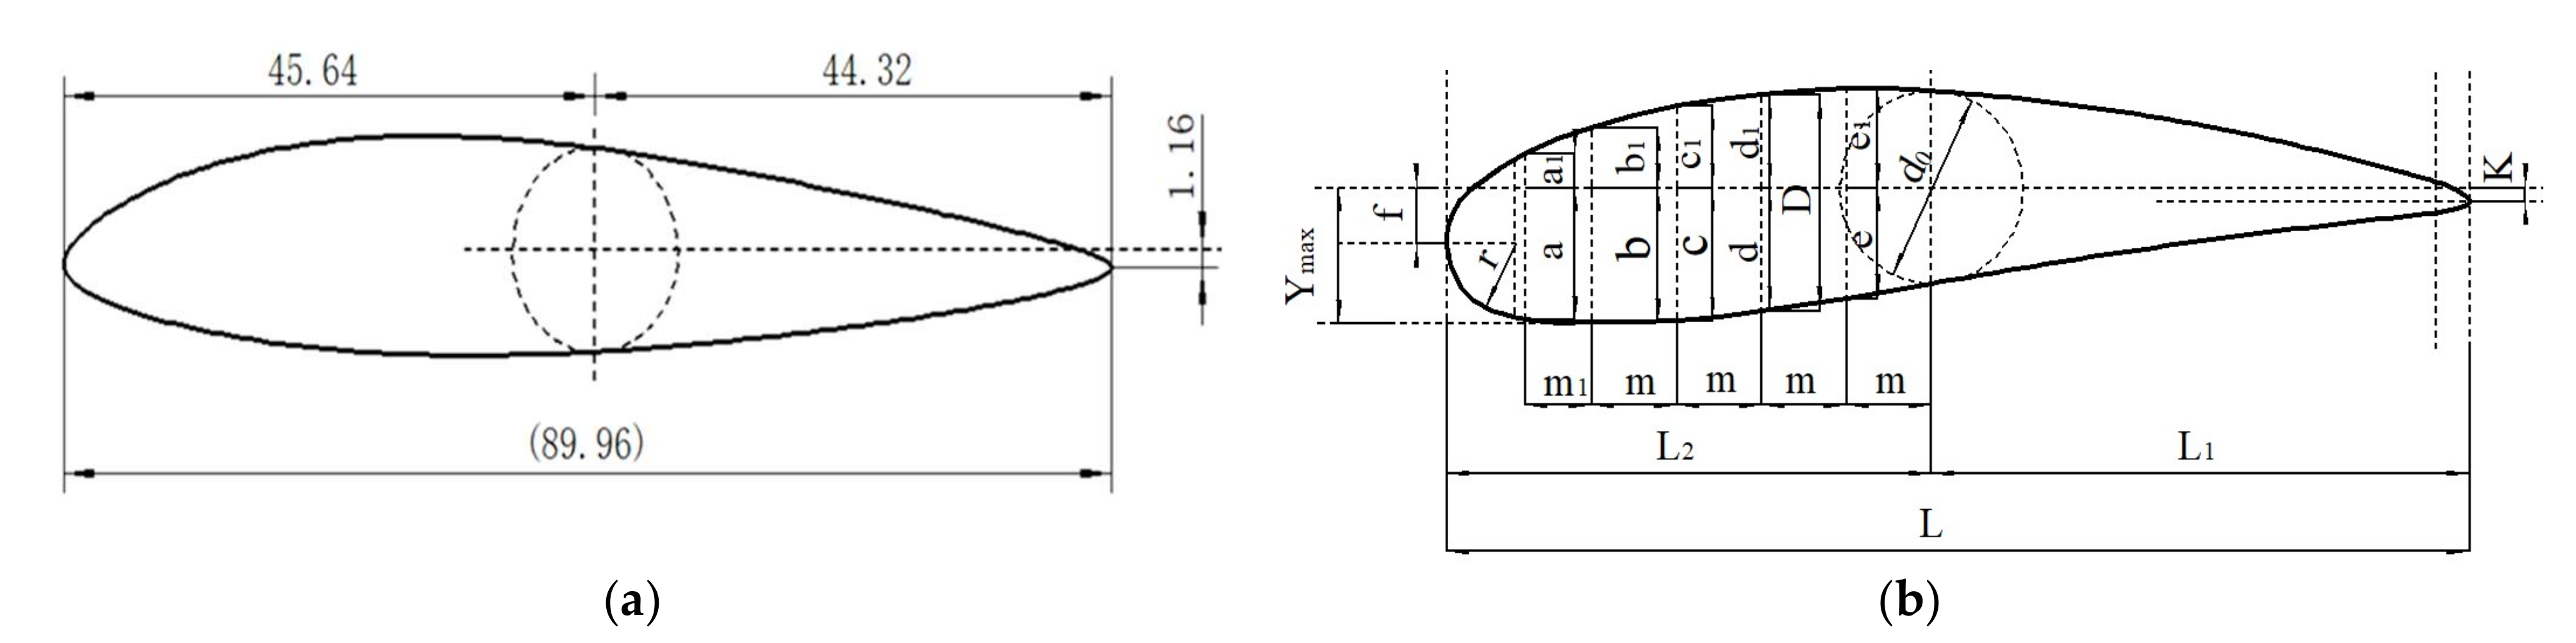
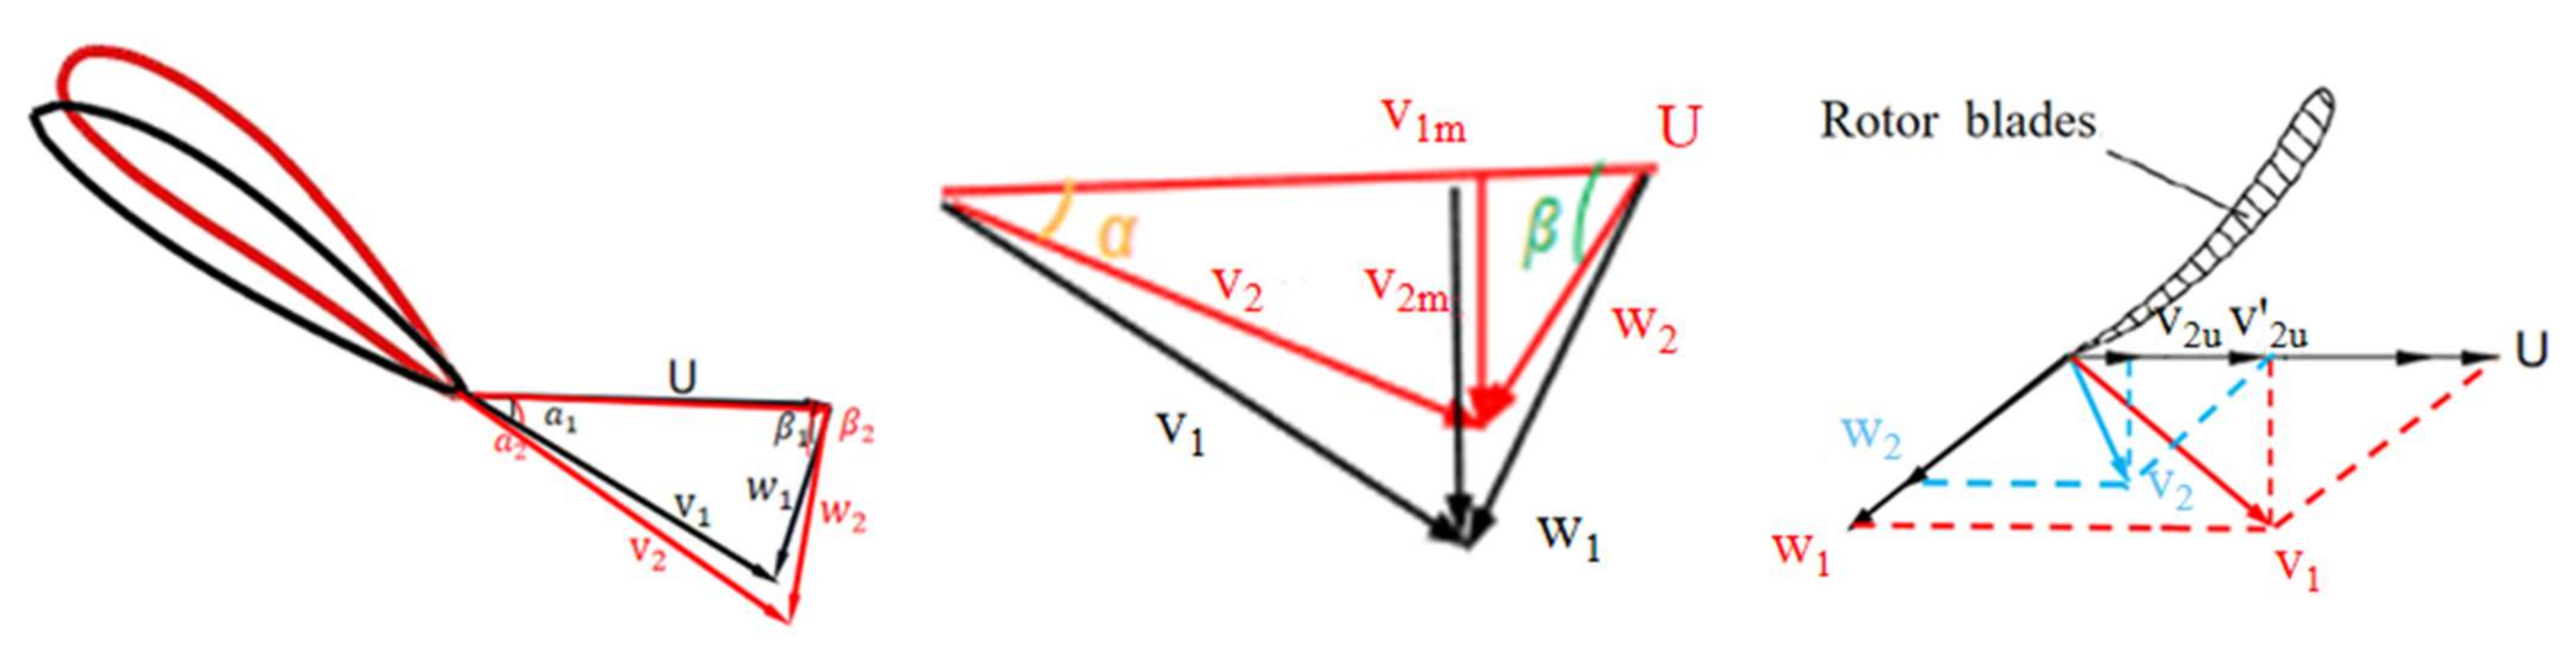
2.1. Activity Guide Leaf Design Process

As the water guide mechanism of the reversible turbine is cylindrical, the existing movable guide vane can be retrofitted by changing the wing profile of the movable guide vane. This paper refers to the excellent hydraulic design model of hydraulic turbine, the hydraulic turbine design manual guide vane section size table, and the original airfoil design data to modify the movable guide vane airfoil and design a new movable guide vane while keeping the original guide vane chord length unchanged. The “S” characteristic of the reversible turbine unit is improved by changing the direction and speed of water entry by changing the movable guide vane airfoil shape. The airfoil of the guide vane before and after the modification is shown in Figure 1.
By changing the head circle radius r of the original airfoil and increasing the maximum thickness D of the original guide vane airfoil, the influence of the increase of the head circle and maximum thickness of the guide vane on the internal flow characteristics of the draft tube is investigated to provide a reliable direction for the optimization of the design of the next guide vane airfoil. The parameters of the guide vane after changing the airfoil shape are shown in Table 1.
In terms of the theoretical analysis, as shown in Figure 2 below, we analyze the velocity triangle between the new guide blade airfoil shape and the original airfoil shape, by Formulas (1) and (2). A refers to the cross-flow area of the inlet side of the blade, the magnitude of the blade inlet angle is also measured by ANSYS CFD-POST (data processing analysis and visualization processing software), and the velocity triangle is derived from the blade inlet angle β, the absolute flow velocity V, and the axial surface flow velocity V1m. Under the assumption that the direction and magnitude of the circumferential velocity do not change, if the angle of the inlet water flow of the rotor (the angle between the relative velocity of the water flow and the circumferential velocity) and the blade inlet placement angle β are equal, there is shockless inlet condition, and its hydraulic loss is minimal. Therefore, the greater the impulse angle α, the greater the hydraulic loss. The angle of rotation of the movable guide vane remains unchanged, the diameter of the distribution circle of the movable guide vane increases, the absolute velocity direction is changed and reduced by the influence of the implicated velocity, the incoming liquid and the impulse angle α of the runner blade decreases, the effective overflow flow increases, and the hydraulic loss of the runner decreases accordingly. From the triangular comparison of the exit velocity of the rotor. After changing the airfoil, influenced by the upstream disturbance, the flow and runner inlet impulse angle changes, the absolute velocity changes, the circumferential velocity component decreases, the water flow loop volume of the draft tube decreases, the centrifugal force becomes smaller, and the draft tube vortex belt theoretical analysis shows that the strength will be weakened by a certain degree.
U = n π D 60
V 1 m = Q A

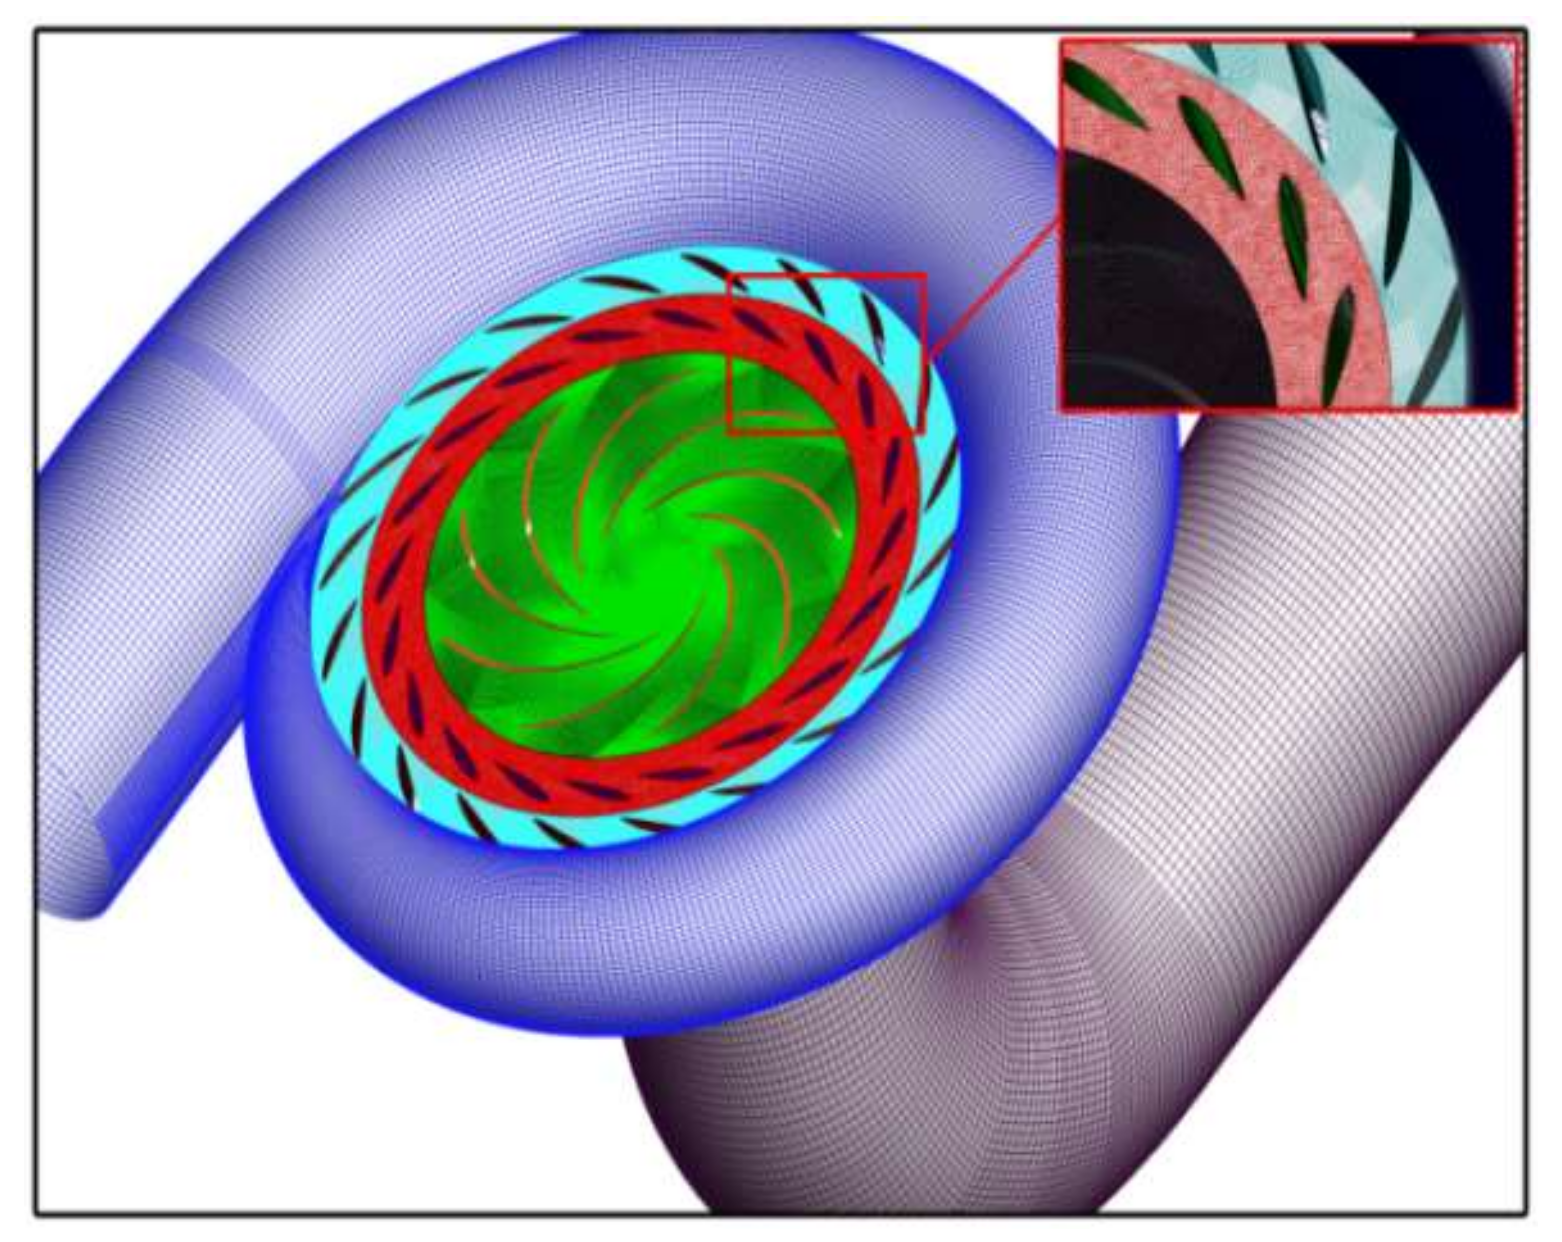
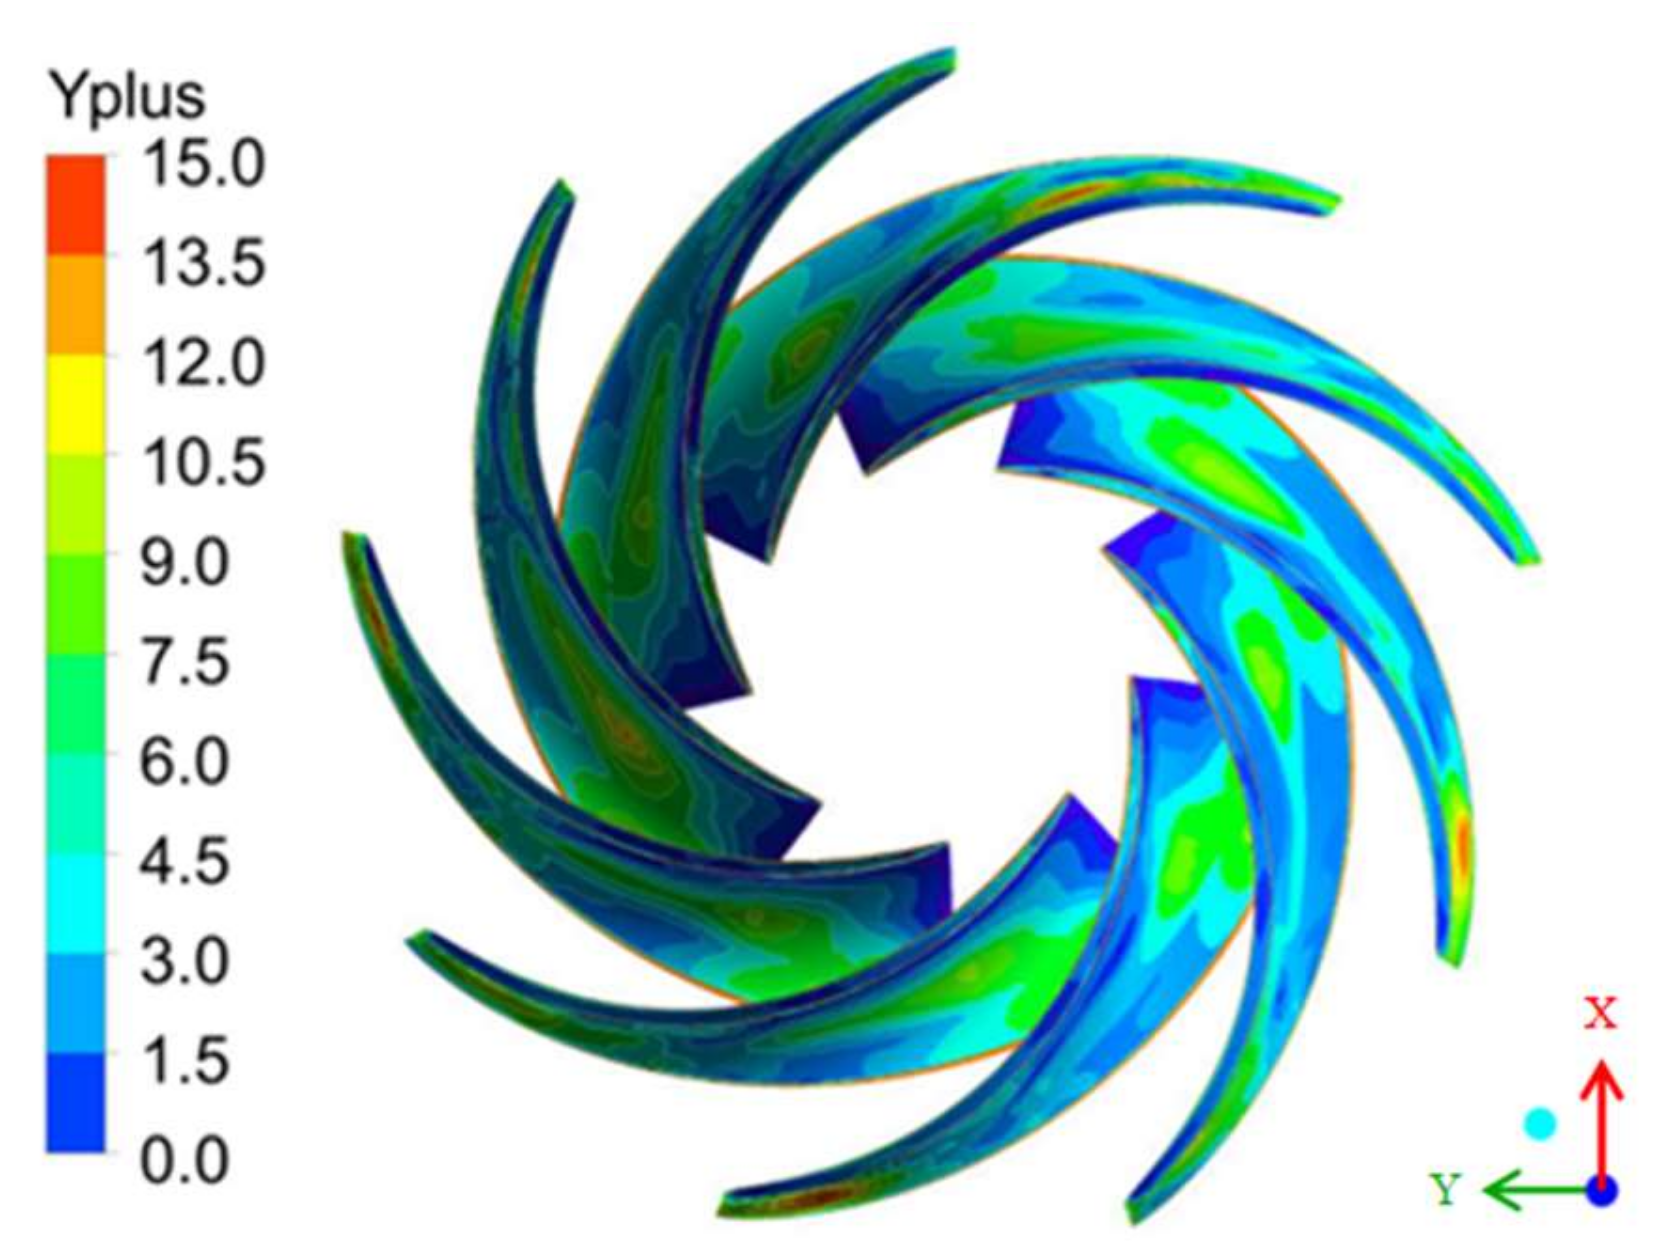
2.2. Mesh Classification and Model Building

The object of this study is a reversible hydraulic turbine model. The overflow components consist of spiral casing, fixed guide vane, movable guide vane, runner, and draft tube. The schematic diagram is shown in Figure 3 and the specific parameters are shown in Table 2.
In order to ensure that the numerical calculation results are feasible and reliable, this meshing was carried out using the sub-function ICEM (professional pre-processing software that provides efficient and reliable analytical models) of the commercial software ANSYS for full-flow channel hexahedral meshing. The results of the meshing are shown in Figure 4. The wall function method was used to add boundary layer mesh at the wall location. As the flow rate in the runner area is larger than that in other locations of the basin of the reversible turbine, it was chosen to look at the y+ distribution in the runner area. Figure 5 shows distribution of blade Y+ wall surface.
After grid-independent verification, the number of grids reaches 5.5 million, the calculation results are within the error tolerance, and, as the number of grids increases, the reference value Hm·Hc1 tends to level off, where Hm is the test head and Hc is the calculated head. When the ratio of the test head to the calculated head tends to be closer to 1, it means the more accurate the calculation results are. Figure 6 shows grid independence verification.

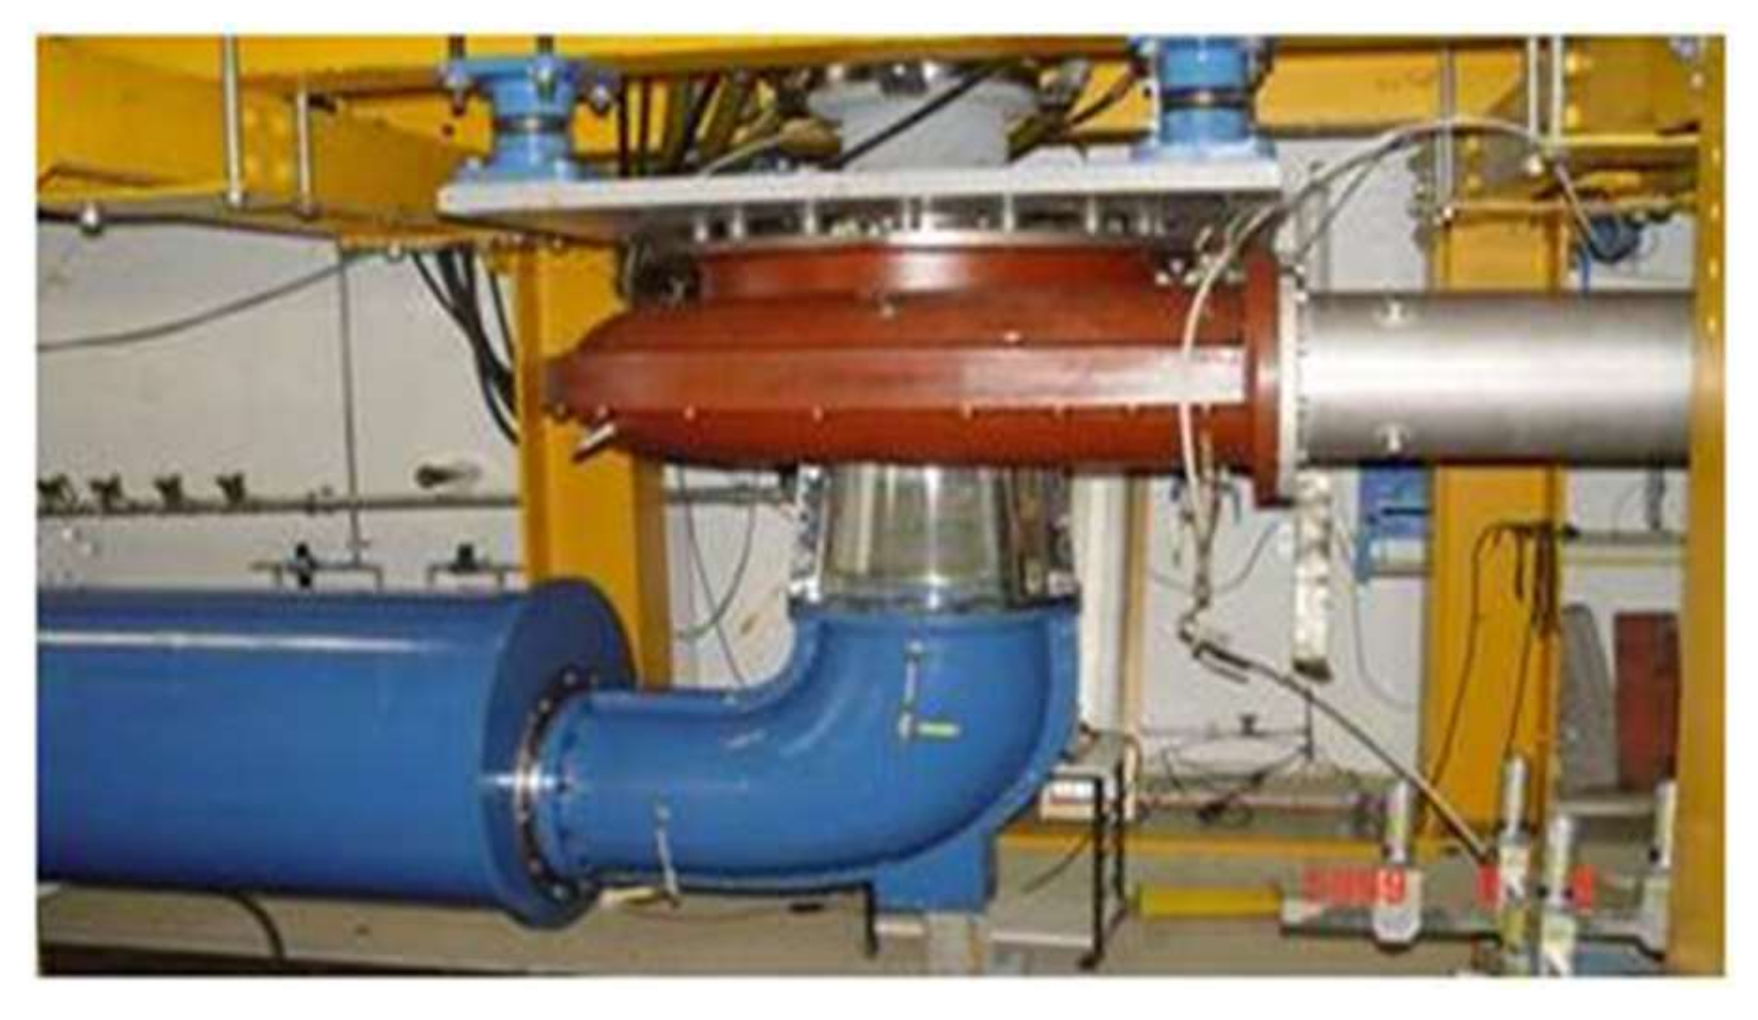
2.3. Introduction to the Test Rig and Numerical Calculation Methods

Introduction to the Test Setup and Conditions

In order to verify the reliability of the turbulence model and the feasibility of the modelling and numerical calculations, the numerical results are compared with the experimental results. The test stand is shown in Figure 7. The model was tested with a constant head of H = 30 m and the rotor speed and flow rate were measured using a torque meter and a flow meter and compared with the calculated results.

2.4. Turbulence Model and Boundary Conditions

Since the SST k-ω turbulence model (the method of studying the system of control body commonly used in fluid mechanics) can effectively capture the flow near the wall, especially for the complex geometric model of a reversible turbine with multiple guide vanes and blades, the SST k-ω turbulence model was chosen for this study to carry out numerical simulations [31]. The fluid medium is set to normal temperature water and the wall surface is set to a non-slip wall boundary condition. Inlet and outlet are set to mass flow inlet and free outflow, respectively. Data transfer between the stationary and rotational domains relies on INTERFACE boundary conditions. Using SIMPLE-C velocity-pressure coupling algorithm, the residual value is set to 10−6, and the time step is set to 3.867·10−4 s; 120 steps are needed to rotate one week, and each time step is rotated by 3° [32]. A total of 10 rotations of the runner rotation cycle are monitored, that is, T = 0.46404 s.

2.5. Calculation Results and Analysis

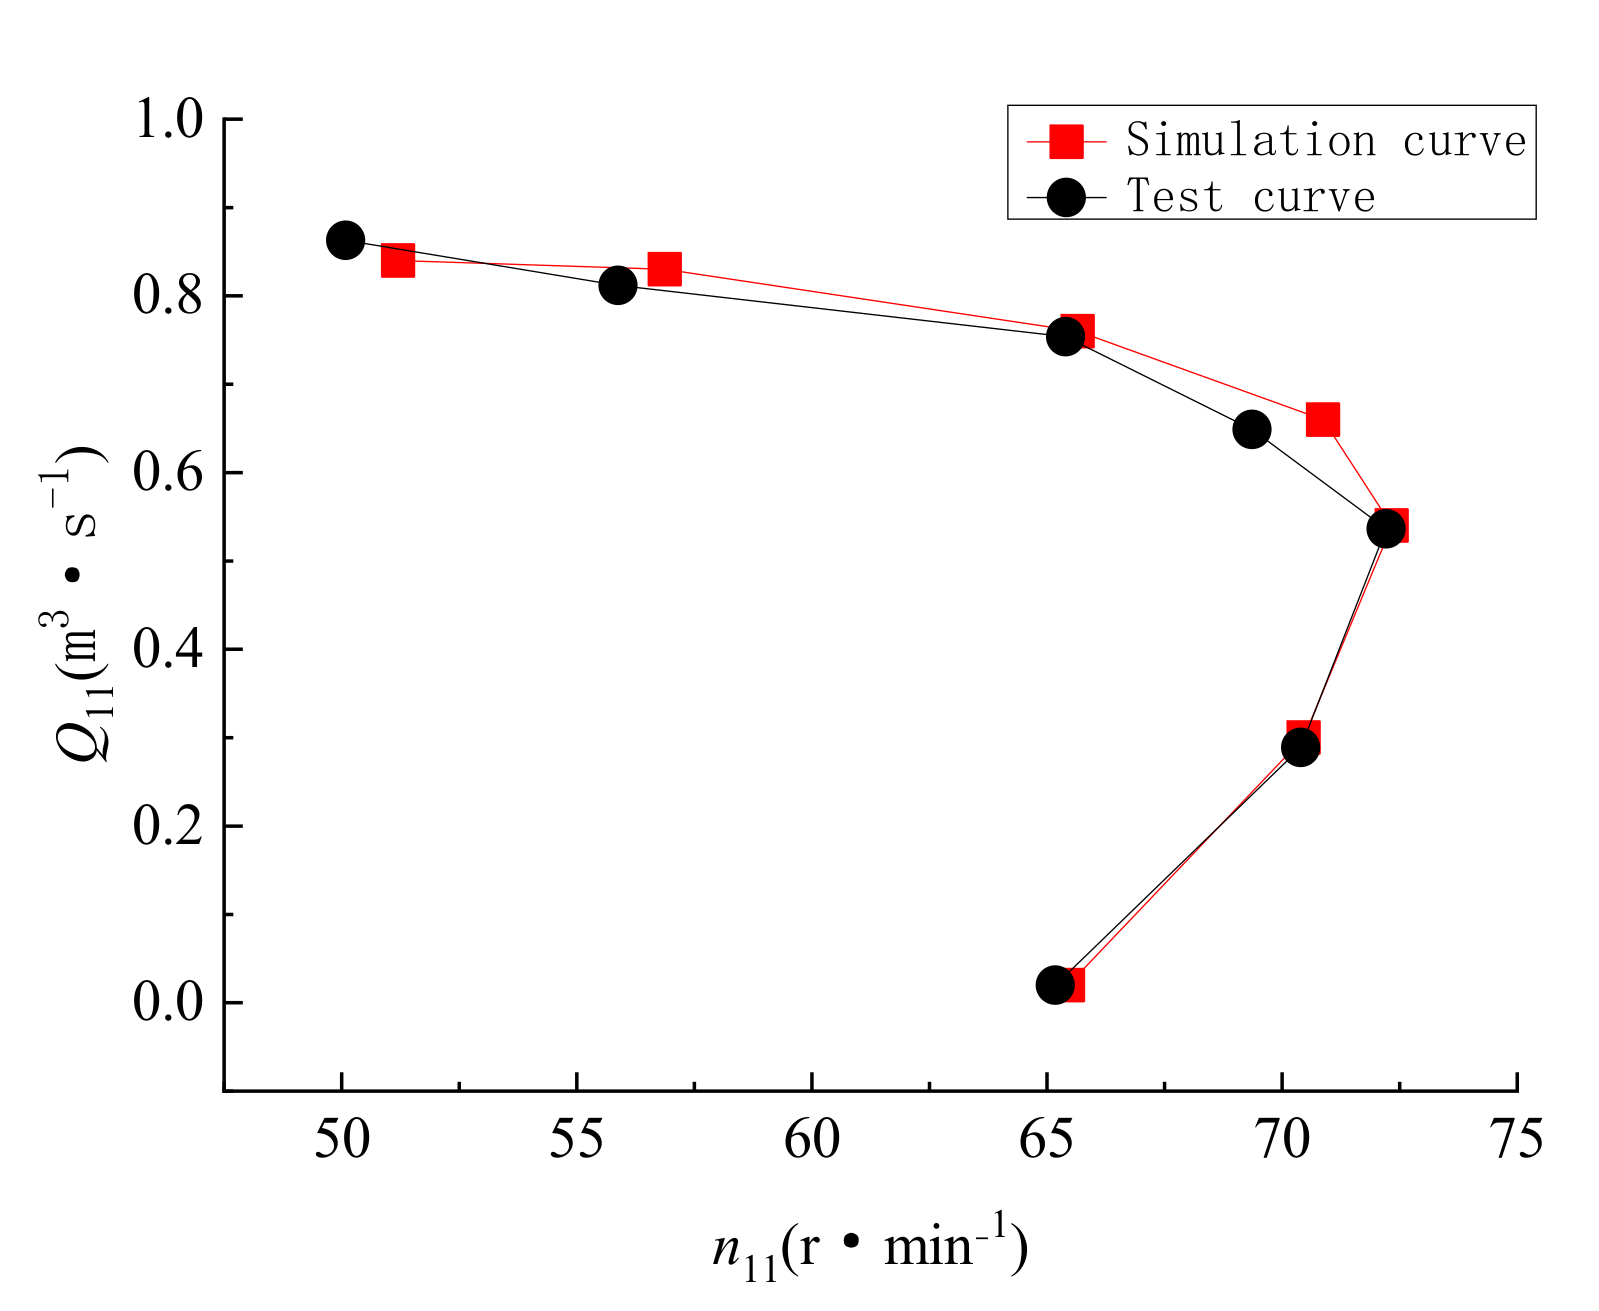
2.5.1. Reliability Verification

The model reversible hydraulic turbine movable guide vane a0 = 33 mm (moving guide vane opening under rated conditions) was selected for this study to verify the reliability of the numerical calculation. Seven operating points were selected for the constant numerical calculation. The result of the numerical calculation is converted to unit speed and unit flow rate with the following equation [33]. Table 3 is the flow-rate test data.
n 11 = n D 2 H
Q 11 = Q D 2 2 H
In the formula: Q is the calculated flow, m3·s−1; n is the rotational speed, r·min−1; D2 is the diameter of the low-pressure side of the runner, m; and H is the test head, m.
Q11 and n11 were obtained by conversion, and then the n11-Q11 characteristic curve was plotted. The n11-Q11 characteristic curve obtained by conversion is compared with the test curve, and the results are shown in Figure 8. Through comparison, the two have a high degree of agreement and the error value is kept near 4%, which meets the requirements of engineering research. Therefore, the model selected for this numerical calculation has a high reliability.

2.5.2. Reliability Analysis of Pressure Pulsation

The pressure pulsations are measured over all operating ranges of turbine operating conditions and at the cavitation factor (also known as Toma factor—the ratio of the necessary cavitation margin to the head release of a centrifugal pump) of the power plant unit. It is necessary to measure the amplitude and frequency of pressure pulsations between the spiral casing, runner, and guide vane as well as between the top cover and the upper crown of the runner. The sensor arrangement should be located where the maximum pressure pulsation amplitude can be measured (such as near the blade inlet). The pressure pulsations are recorded and analyzed. Spectrum analysis should be performed on the collected data to determine the principal frequency and amplitude of the pressure pulsation. ΔH to represent the degree of pressure pulsation in the turbine/pump, while H is the turbine head/pump head and is the characteristic amplitude. The eigenvalues are statistically calculated and the values outside the probability range of the given probability range will be ignored, so the peak pressure pulsation uses the confidence method. The turbine pressure pulsation test is conducted in the full range of operating conditions, corresponding to the pressure pulsation amplitude for the confidence level of 97% peak. The experimental results of pressure pulsation in the draft tube at 393.63 Pa, a0 = 33 mm are shown in Table 4. Each operating point and each measured signal of the turbine as a whole was analyzed and the experimental results are presented in Table 5.
After the test analysis, it is known that the pressure pulsation amplitude of each measurement point under the normal operating range of turbine conditions fully meets the design guarantee value requirements. Figure 9 shows the experimental observation map of the draft tube area.

3. Results

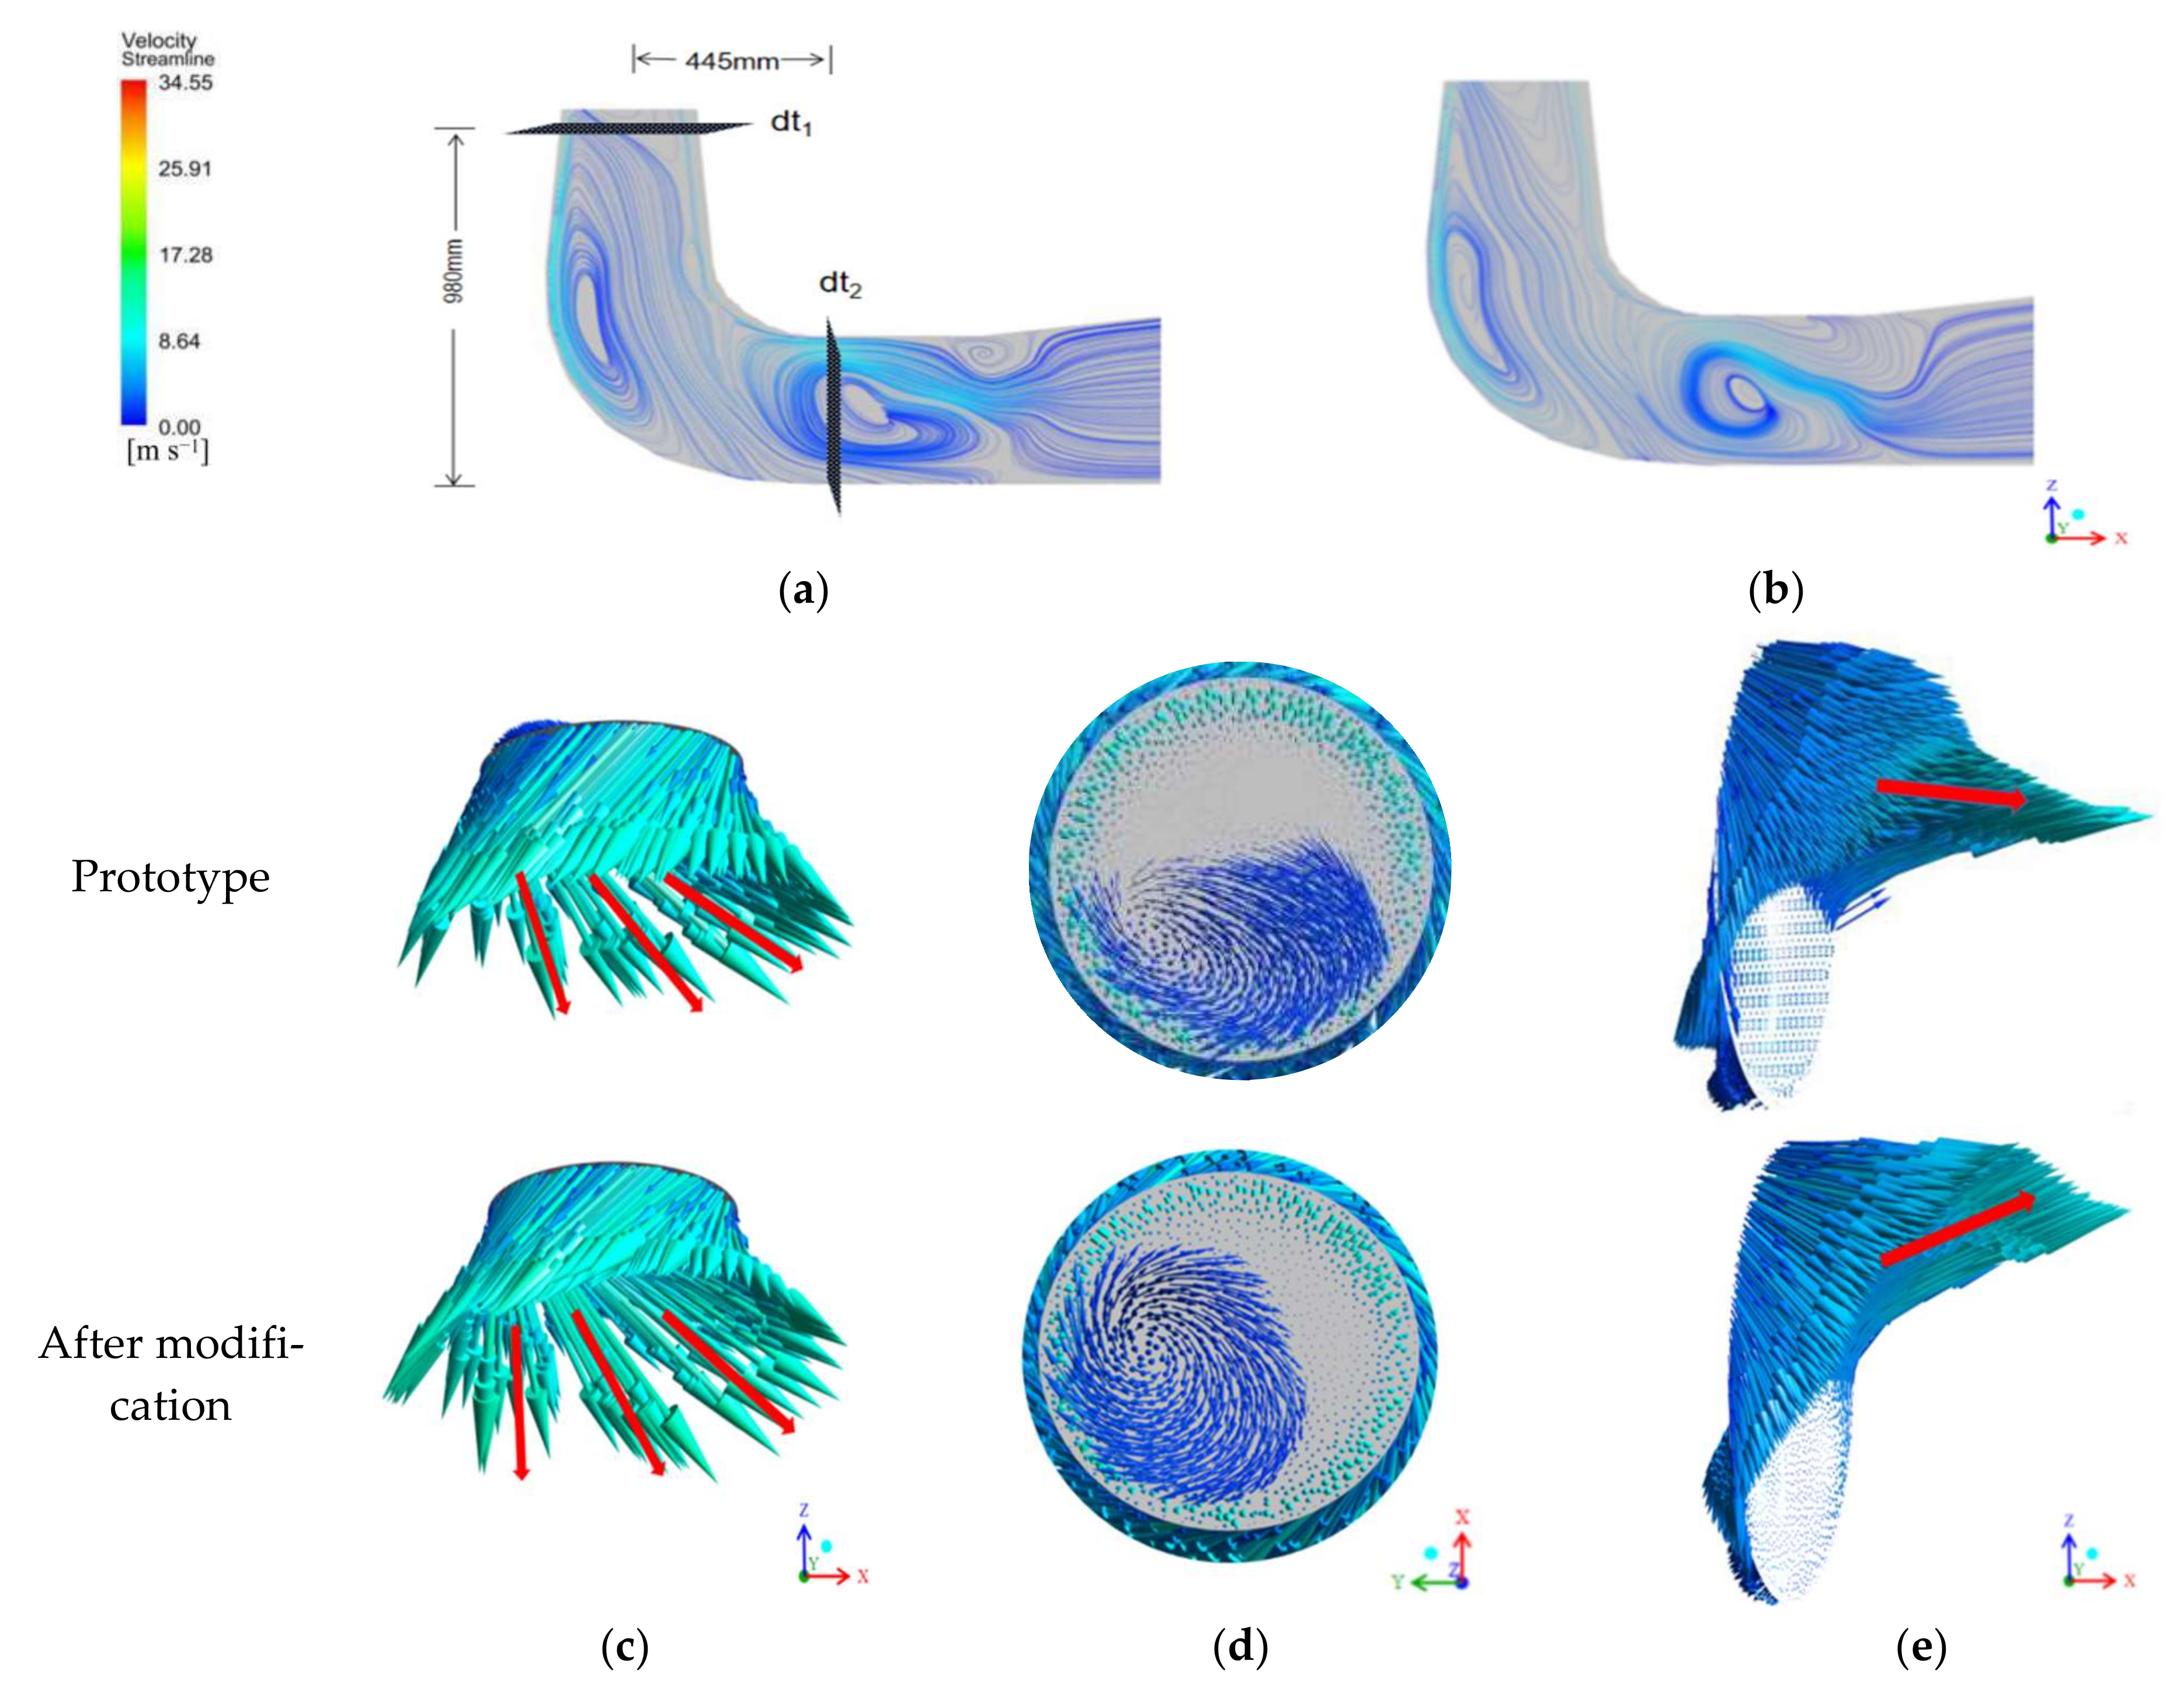
3.1. Draft Tube Local Flow Line Analysis

The streamline diagram can represent the running state of the water flow at a certain moment, and can roughly reflect the real movement of the water flow. In order to accurately analyze the internal flow characteristics of the draft tube area before and after the modification at low-flow conditions, the velocity flow diagram of the draft tube at the moment t = T was selected. It was found that the vortex appeared in the lower part of the elbow section and in front of the diffuser end of the draft tube. Therefore, two sections are selected at the inlet and diffusion section of the draft tube to observe the flow characteristics, as shown in Figure 10. From the dt1 cross-sectional velocity vector diagram, it can be seen that there is a difference in the flow direction at the inlet of the draft tube, and it is the change in direction that improves the phenomenon of partial upward flow in the middle of the pipe. From the top view of the same section, the phenomenon that the recirculation area is concentrated on one side has also changed, and there is a trend of uniform distribution of velocity streamlines, which also reduces the impact of the water flow on the pipe wall, increases the radial flow rate, and makes the water flow more uniform. The flow is passed down more smoothly, reducing the impact of the water flow on the draft tube wall. The cross-sectional view of the diffusion section of the draft tube dt2 also shows the phenomenon of local backflow, and the backflow intensity increases from the wall to the middle, and the upward flow is enhanced by the vortex. The cross-sectional velocity vector diagram as well as the overall flow line diagram can also show the vortex upward phenomenon caused by the change of direction of the vortex belt spinning into the draft tube. After the modification, the interference of the backflow to the normal water flow in the draft tube is weakened, the outflow of the turbine is increased, and the instability of the unit is reduced.

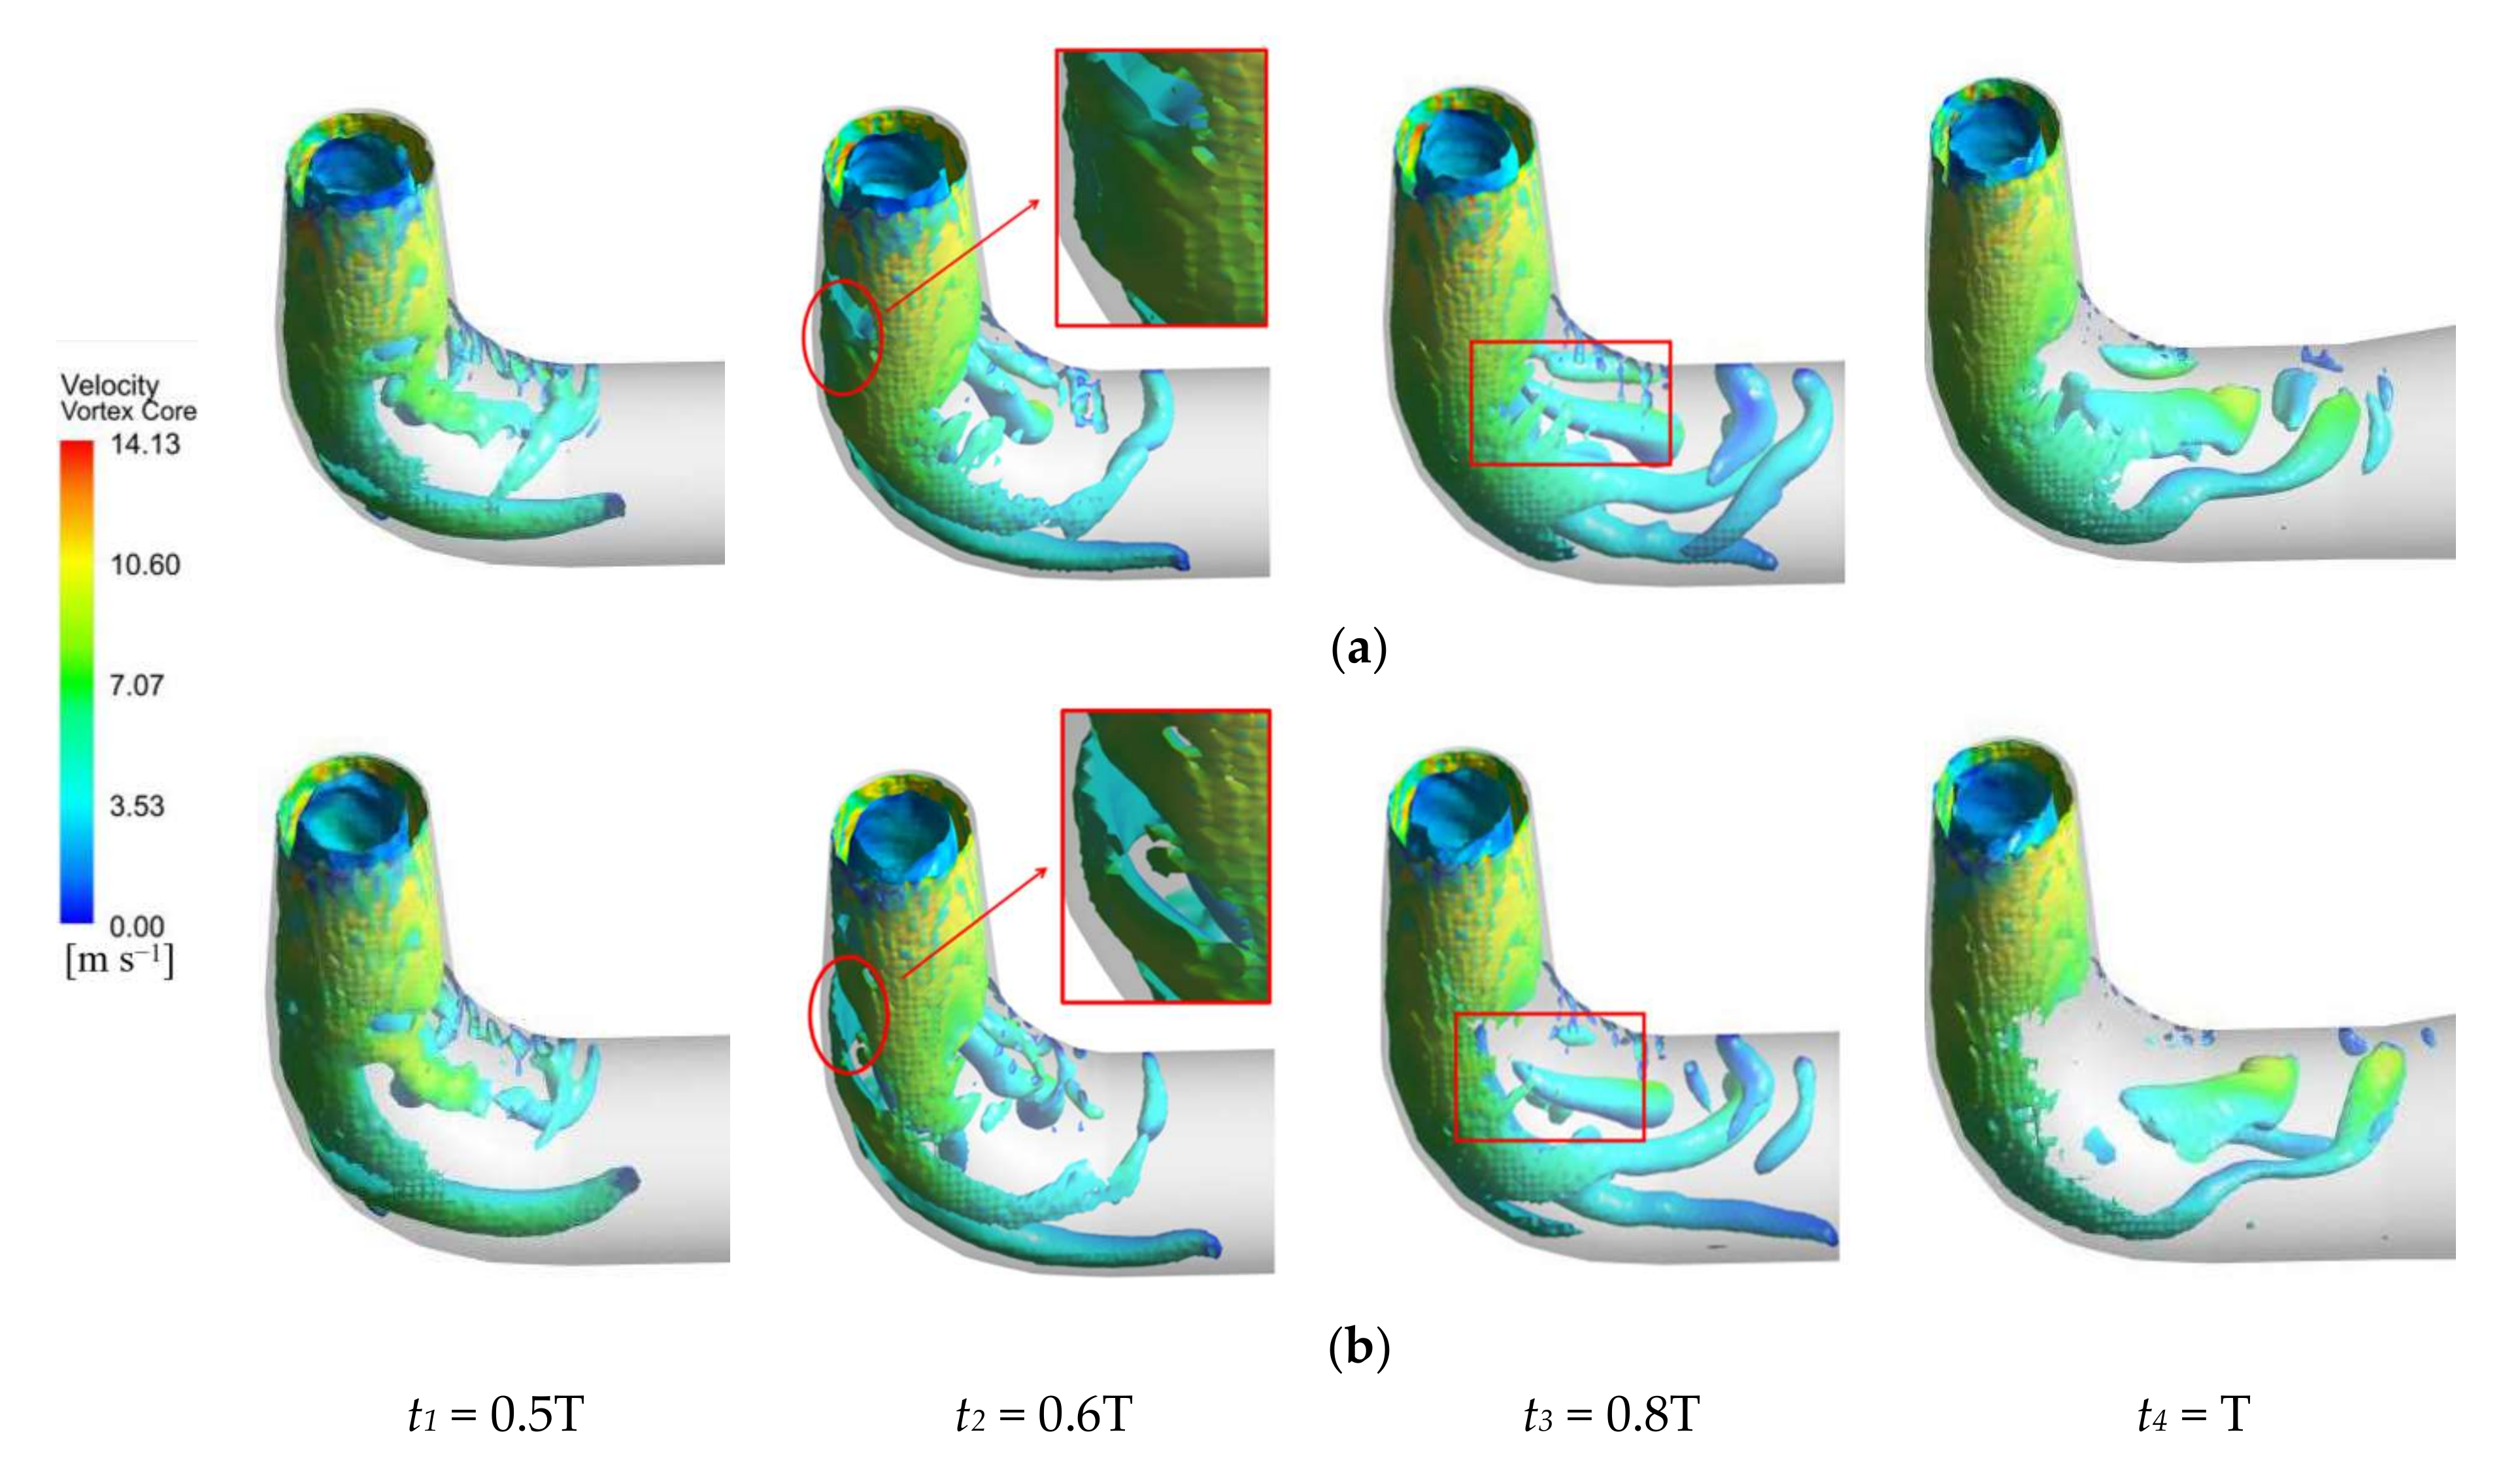
3.2. Variation of Vortex Band Morphology in the Draft Tube under Different Guide Vane Airfoil Types

Draft tube vortex band is a symptom of unstable flow in mixed-flow turbines, which can seriously lead to fatigue damage of the unit [21]. Figure 11 shows the distribution of vortex cores in the wake tube region under non-fixed-length numerical calculations. It can be found that the distribution of vortex nuclei in the draft tube area mainly contains two types of vortex nuclei. The vortex belt in the centre of the draft tube appears to make eccentric circular motion around the rotating axis of the runner, and the lamellar vortex nuclei near the wall also change speed and shape continuously with the rotation of the runner. As time progressed, the vortex band morphology shifted. The lamellar vortex zone in the straight conical section gradually merges with the curved elbow region and continues to merge with the eccentric vortex zone in the central area of the draft tube up to the front of the diffuser section, with low-velocity lamellar vortex zones also appearing in the inner part of the curved elbow region. In terms of velocity, the velocity tends to increase and decrease from the straight cone section of the draft tube to the vicinity of the diffusion section. This is because the fluid (water) moving into the draft tube inherited the speed and vortex of the rotor outlet, due to the impact of the rotor area outflow, and the effect of its vortex hysteresis will affect the eccentric vortex zone in the center of the draft tube area causing the middle water velocity to be lower than the wall water velocity. Also, as the water passes through the elbow section, the velocity direction changes sharply due to the pipe restriction, causing the vortex belt to change its direction of rotation and causing an increase in velocity near the inside of the elbow section. The contrast in the draft tube of the t1 = 0.5T time modification becomes progressively clearer, with a break in the area of the vortex band in the middle of the runner and a significant reduction in the number of vortex cores attached to the lower end of the straight cone. The modification increases the speed of vortex belt separation and the collapse of the vortex nucleus in the diffusion section of the draft tube changes the process of top–down vortex belt spinning in and affects the winding and entrainment of the nearby water flow, reducing the pulsating effect of the water flow on the wall, and improving the safe operation of the reversible hydraulic turbine.

3.3. Analysis of Turbulent Energy of Draft Tube at Different Moments with Different Guide Vane Airfoil Types

Due to the irregular distribution of vortex bands, there will be different degrees of energy dissipation in the draft tube region. The Figure 12 shows a cloud of turbulent kinetic energy changes in the middle flow surface of the draft tube of a reversible turbine. The above analysis of the flow lines and vortex bands shows that there is significant vortex flow in the draft tube area, so the effect on the energy dissipation in the draft tube before and after the modification is analyzed. It can be seen that in this condition, along with the time change, the turbulent kinetic energy gradually develops from the straight cone section and the curved elbow section to the diffusion section, all concentrated in the front. The large energy dissipation at the near wall of the draft tube inlet is due to the high velocity of the water flow at this location and the directional distribution is more concentrated on the rotating side of the area. The vortex belt also rotates with a certain angular velocity in the exit area of the rotor, with the linear velocity increasing further away from the axis. The draft tube vortex belt interacts with the wall in its development and constantly impacts with the draft tube wall, thus causing noise and turbulent energy dissipation problems in the draft tube wall. The turbulent kinetic energy is mainly derived from the time-averaged flow, which provides energy to the turbulent flow through Reynolds shear stress work, i.e., the energy dissipation within the time-averaged is greater near the wall and in its vortex zone, which becomes the main part of energy loss in the draft tube. The turbulent energy dissipation problem is somewhat alleviated by the modification, with a more similar distribution pattern but a significantly smaller overall area of high dissipation (draft tube inlet wall, upper elbow area, and front of diffusion area).
In addition to the role of smoothly directing the liquid flow from the runner outlet downstream, the draft tube also converts the liquid flow energy from the runner outlet and the potential energy above the downstream tailwater level into additional vacuum, allowing excess energy to be recycled and, thereby, increasing the efficiency of the turbine. In order to further compare the draft tube energy losses, a draft tube energy recovery factor is introduced [34]. The calculation formula is shown in Equations (5)–(8).
η w = v 2 2 2 g v 5 2 2 g Δ h w v 2 2 2 g
Δ h 1 = 3.2 ( tan θ 2 ) 1.25 v 2 2 v 5 2 2 g
Δ h 2 = v 5 2 2
Δ h w = Δ h 1 + Δ h 2
where v2 is the average velocity of the draft tube inlet (m·s−1); v5 is the average velocity of the draft tube outlet (m·s−1); Δhw is the energy loss of the draft tube (m); g is the acceleration of gravity (m·s2); and θ is the diffusion angle.
As can be seen from Table 6, the modified movable guide vane can, indeed, achieve the effect of improving the flow condition in the draft tube and enhancing its energy recovery performance.

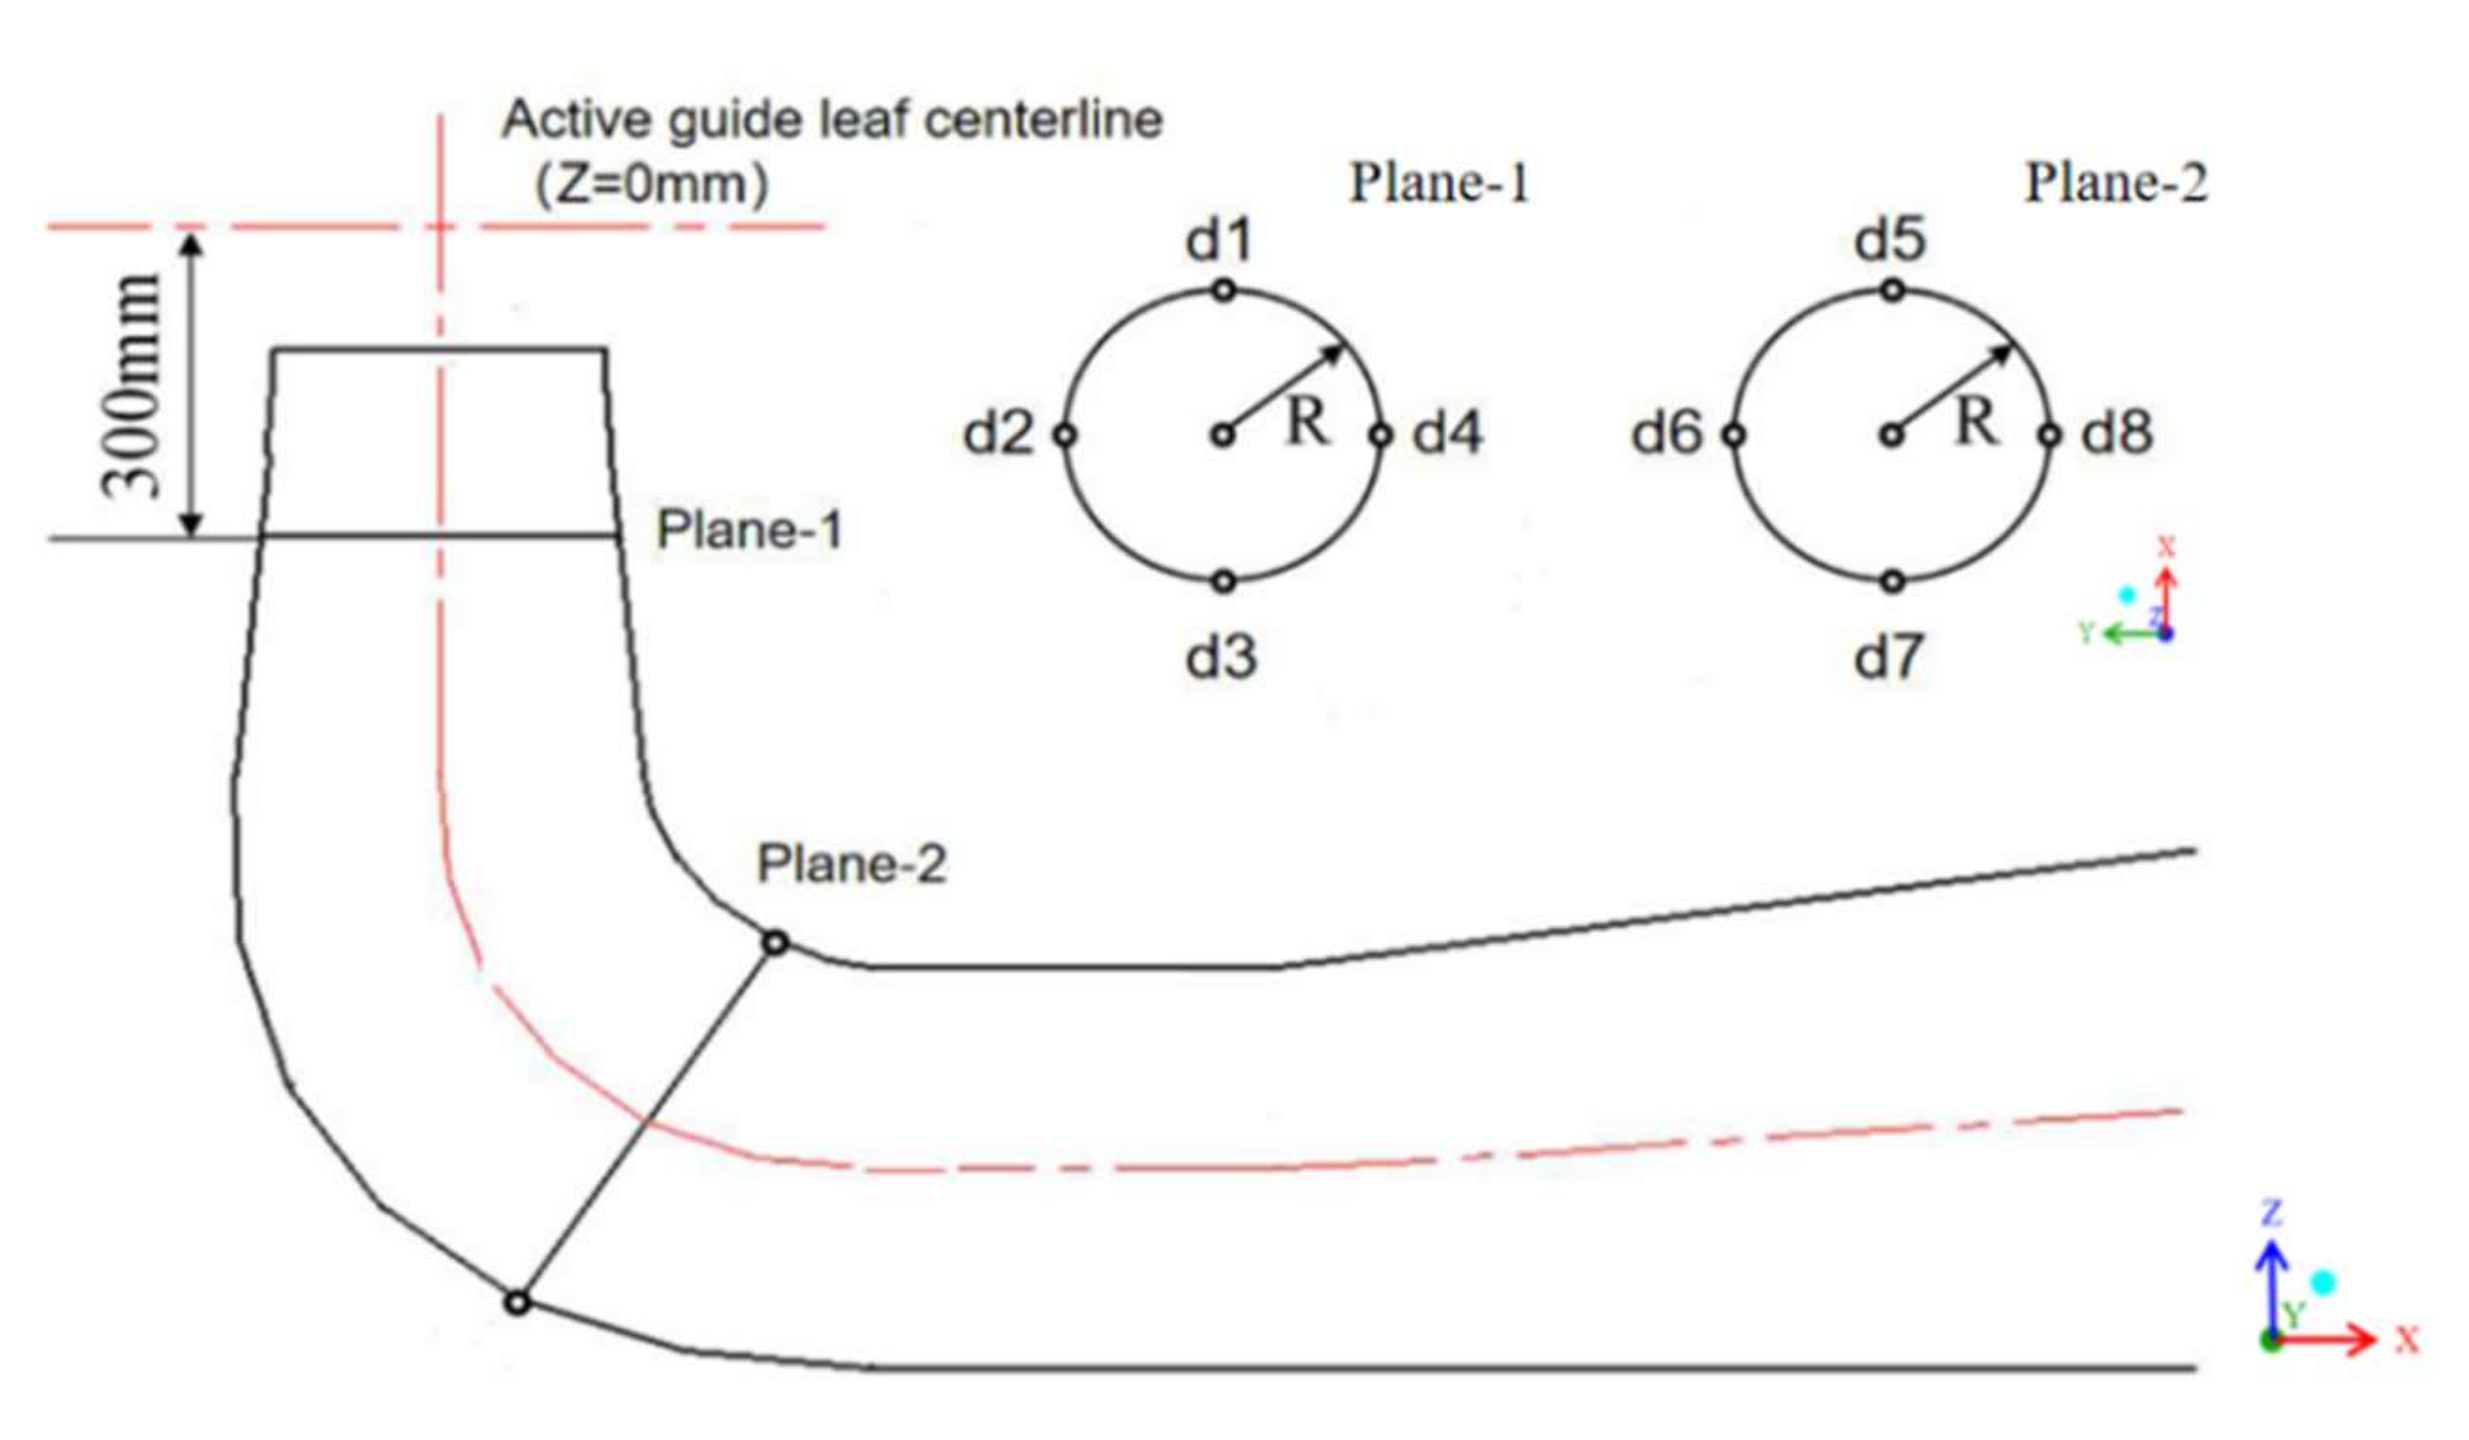
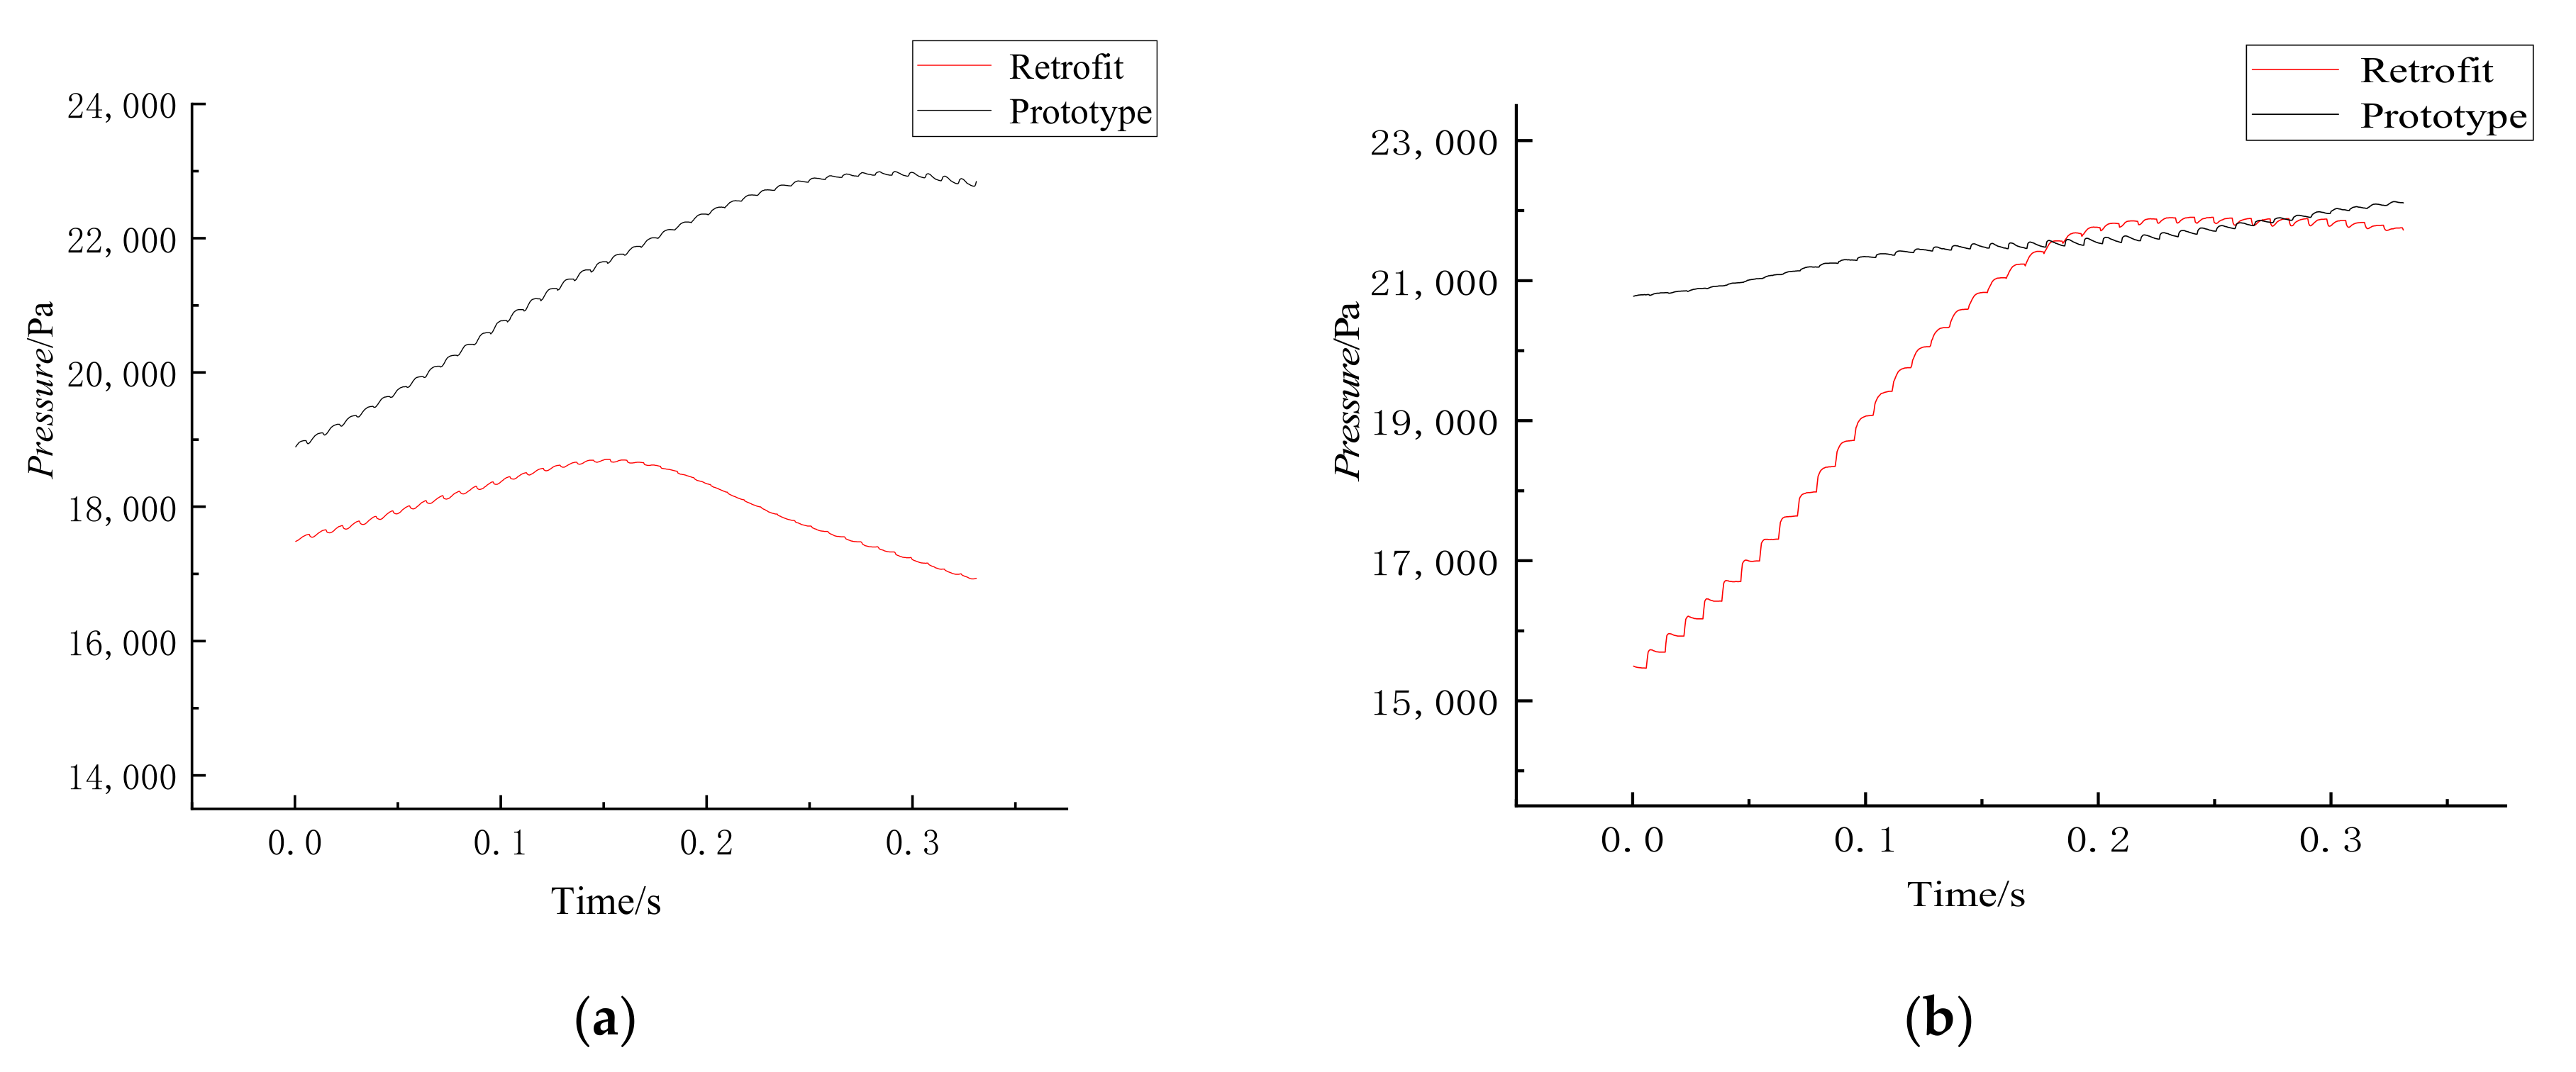
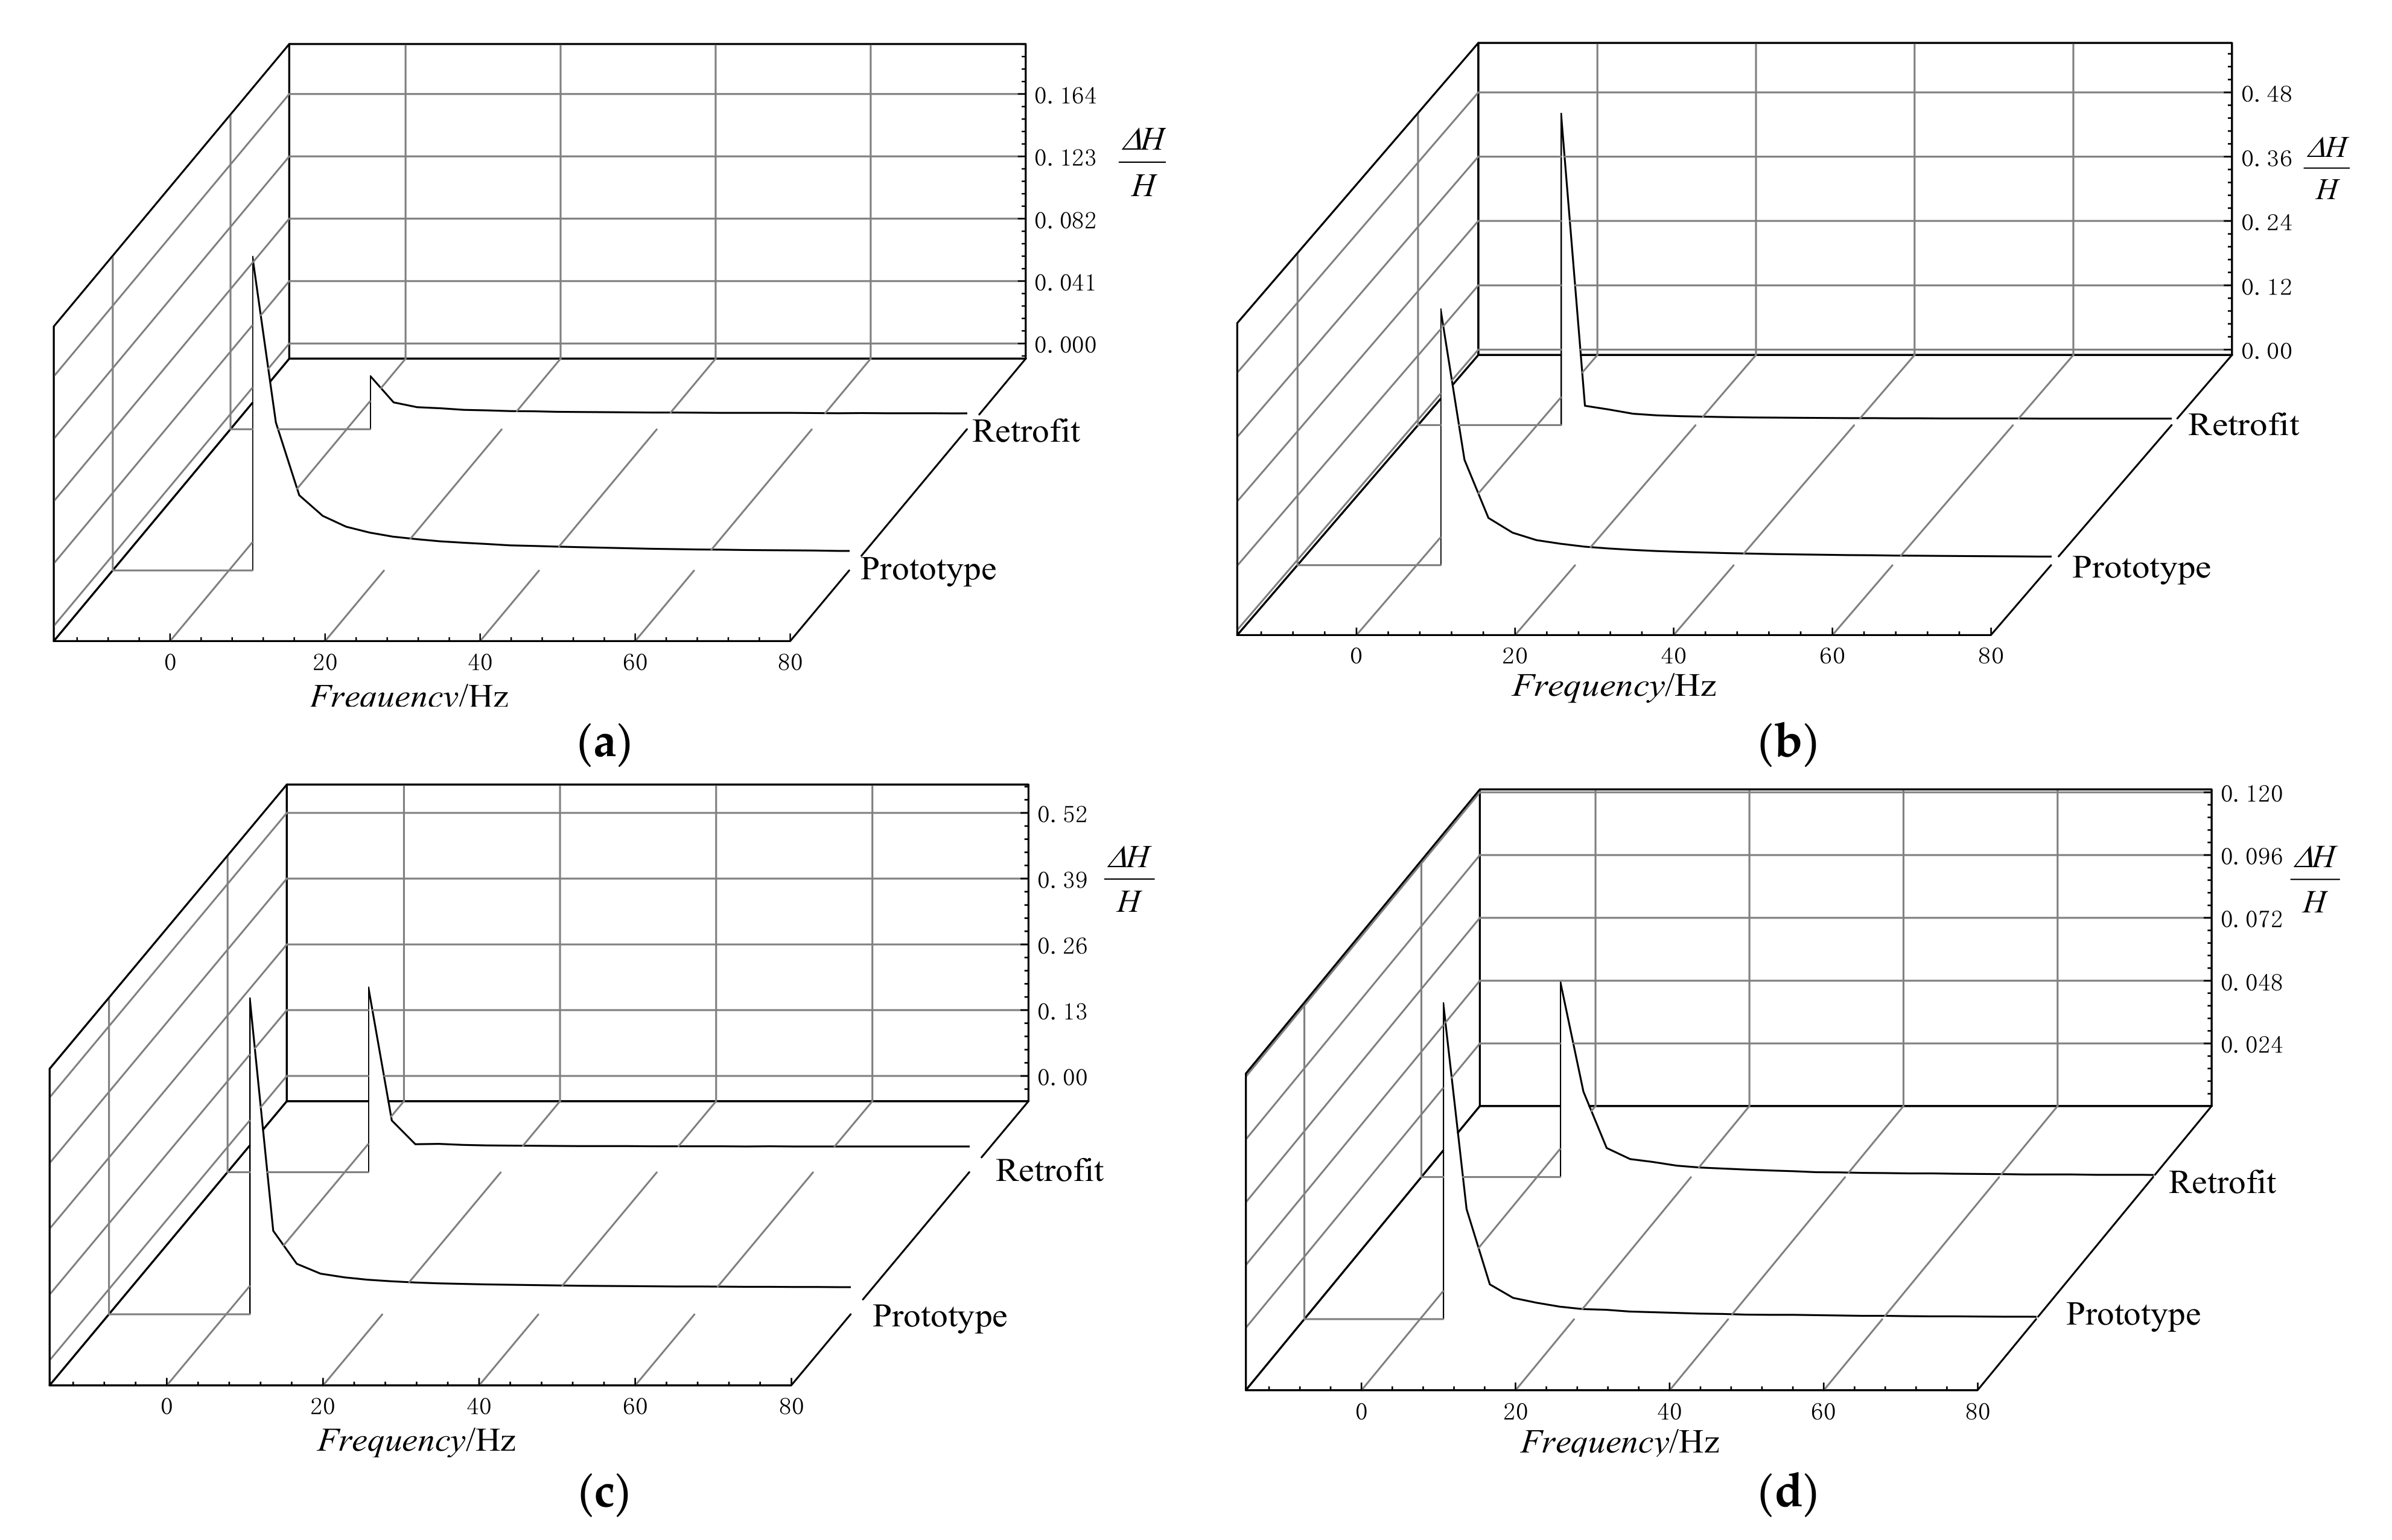
3.4. Analysis of Pressure Pulsation of Draft Tube under Different Guide Vane Airfoil Types

Draft tube pressure pulsation is one of the most important reasons for the stability of reversible turbines. Eight monitoring points are evenly set at the inlet end of the draft tube and the elbow section. The positions of the monitoring points are shown in Figure 13. Unsteady calculations are performed before and after the modification, and the time-domain and frequency-domain diagrams of pressure pulsation are drawn.
To facilitate better processing of monitoring point data, the dimensionless parameter ΔH·H−1 is introduced as a parameter to quantify the intensity of pressure pulsation in the lobeless zone of the pump turbine, as shown in Equation (9). Then the fast Fourier transform (FFT transform) is performed on the time domain pulsation signal to make the pressure pulsation frequency domain diagram.
Δ H H = P i P ¯ P ¯
where: Δ H H is the relative pulsation amplitude, %; Pi is the corresponding pressure monitoring value at point i, Pa; and P ¯ is the time-averaged pressure, Pa.
Figure 14 and Figure 15 are the time-domain and frequency-domain graphs of the pressure pulsation at the monitoring points, respectively. The pressure pulsation pattern at each monitoring point in the draft tube is generally consistent with that before and after the modification. This is due to the fact that the change in wing shape directly affects the speed and direction of the inlet water in the rotor area, which, in turn, affects the action of the water on the draft tube. The pressure frequency domain plot highlights the effect of the draft tube vortex band on pressure pulsation before and after the modification as it is taken from the last two turns, reducing the interference from other frequencies. The dominant frequency of the frequency domain curve at the d1 monitoring point is 3.02 Hz with dimensionless Δ H H 1 of 0.02 and 0.19, respectively. Due to the downward development of the vortex belt the speed of the spin-in process decreases and the compound superposition of other disturbances, the main frequency of some monitoring points will change, the main frequency of d5 monitoring point is 6.04 Hz, which is about 0.25 times of the rotation frequency, which is basically consistent with the measured results also consistent with the vortex core rotation time period. The reversible turbine also has an increase in pressure from the water flow downwards at the same opening, and because of the complex morphology of the vortex belt in the draft tube it also causes radially asymmetric pressure pulsations at different locations in the draft tube wall. Overall, the water flow state inside the draft tube under low-flow conditions is complex, and the interaction of vortex bands and backflow in the straight cone section, bent elbow section, and diffusion section causes pulsation instability in the draft tube region, and the improved draft tube reduces the pulsation intensity in terms of pressure pulsation and increases the threshold of stable operation of the reversible hydraulic turbine.

4. Conclusions

In this paper, a pumped storage single-stage, vertical shaft reversible turbine is used as a model to explore the effect of changing the airfoil shape on the internal flow characteristics of the draft tube of a reversible turbine, while keeping other overflow components unchanged.
(1)
Comparing the flow diagrams of the draft tube before and after the modification of the movable guide vane, it is found that the swirl area of the curved elbow section and the diffusion section of the draft tube is reduced after the modification. Further analysis of the vector diagrams of the dt1 and dt2 sections shows that the direction and velocity of the water entering the draft tube area (dt1 section) have changed due to the change in the airfoil shape, and the axial outflow has also increased, reducing the concentrated impact of the water in the inlet area on the wall of a certain area. And combined with the top view of the two cross-sections found that the interference of the return flow to the normal flow of water in the draft tube is reduced, increasing the outflow of the turbine. The combined effect caused a reduction in the swirl region of the draft tube. The instability of the unit is reduced.
(2)
The vortex belt evolution diagram of the draft tube before and after the modified movable guide vane can be found that the modified guide vane changes the direction of vortex belt rotation forward in a period of time, reduces the speed of rotation near the wall of the draft tube, and reduces the vortex density inside the vortex. t1 to t4 time to the wall of the bent elbow section and the middle of the diffusion section vortex belt accelerates the development of rupture, which makes the turbine operation more stable and reduces the risk of fatigue damage to the unit.
(3)
The change of turbulent energy before and after the modification of the movable guide vane shows that the change of the airfoil shape causes the change of the direction of the vortex belt in the wake pipe and accelerates the development of the vortex belt collapse, which reduces the turbulent energy near the vortex of the wake pipe. It is calculated that the change in airfoil shape improves the energy return coefficient of the draft tube by 0.69, 0.72 and 0.75 for Q11 = 0.83, 0.66 and 0.3 (m3·s−1), respectively, which improves the energy recovery level.
(4)
By analyzing the pressure pulsation of the tailwater pipe area section before and after the modification, the main frequency of the straight cone section of both tailwater pipes corresponds to the vortex belt rotation period, and the pulsation of the tailwater pipe area is not stable. The modification reduces the draft tube vortex belt rotation and tailwater pipe wall collision reduces the pulsation intensity, which leads to a lower value of pressure pulsation fluctuation (6–9%) and improves the threshold of stable operation of the reversible turbine.

Author Contributions

Conceptualization, L.X. and G.X.; methodology, Q.L.; software, Q.W.; validation, L.X., G.X. and S.L.; formal analysis, Q.W.; investigation, L.X.; resources, Q.L.; data curation, L.X.; writing—original draft preparation, L.X.; writing—review and editing, L.X.; visualization, S.L.; supervision, Q.L.; project administration, Q.L.; funding acquisition, Q.L. All authors have read and agreed to the published version of the manuscript.

Funding

The National Natural Science Foundation of China (52066011); Study on the effect of reversible hydraulic turbine movable guide vane wing shape optimization on internal flow characteristics.

Institutional Review Board Statement

Not applicable for studies not involving humans or animals.

Informed Consent Statement

Not applicable for studies not involving humans.

Data Availability Statement

Not applicable.

Conflicts of Interest

The authors declare no conflict of interest.

References

  1. Li, W.; Li, Z.; Qin, Z.; Yan, S.; Wang, Z.; Peng, S. Influence of the solution pH on the design of a hydro-mechanical magneto-hydraulic sealing device. Eng. Fail. Anal. 2022, 135, 106091. [Google Scholar] [CrossRef]
  2. Li, L. Review and outlook of pumped storage power plant design. Hydroelectricity 2010, 36, 1–2. [Google Scholar]
  3. Yu, J.; Cai, S.; Zheng, L.; Sun, J. Experimental analysis of pressure pulsation and velocity distribution of draft tube of Francis turbine. J. Huazhong Inst. Technol. 1981, 6, 63–70. [Google Scholar] [CrossRef]
  4. Chang, J. Similar law of unsteady periodic water flow in draft tube of Francis turbine. J. North China Inst. Water Resour. Hydropower 1981, 2, 18–28. [Google Scholar] [CrossRef]
  5. Cheng, L. On the hydraulic vibration of mixed-flow turbine. J. Huazhong Inst. Technol. 1981, 6, 57–62. [Google Scholar] [CrossRef]
  6. Kubota, T.; Matsui, H. Cavitation characteristics of forced vortex core in the flow of a francisturbine. Fuji Electr. Rev. 1972, 18, 102–108. [Google Scholar]
  7. Kubota, A.; Kato, H.; Yamaguchi, H. A new modeling of cavitating flow: A numerical study ofunsteady cavitation on a hydrofoil section. J. Fluid Mech. 1992, 240, 59–96. [Google Scholar] [CrossRef]
  8. Nishi, M. Surging Characteristics of Conical and Elbow Type Draft Tubes. In Proceedings of the 12th IAHR Symposium on Hydraulic Machinery and Systems, Stirling, UK, 27–30 August 1984; pp. 272–283. [Google Scholar]
  9. Jacob, T.; Prenat, J.E. Francis turbine surge: Discussion and data base. In Proceedings of the 18th IAHR Symposium, Valencia, Spain, January 1996. [Google Scholar]
  10. Lliescu, M.S.; Ciocan, G.D.; Avellan, F. Analysis of the cavitating draft tube vortex in a Francis turbine suing Particle Image Velocimetry measurements in two-phase flow. ASME J. Fluids Eng. 2008, 130, 021105-1-10. [Google Scholar]
  11. Wu, G.; Wei, C.; Tan, Y.; Zhang, K. The Effect of Gatage on the Pressure Fluctuation in Draft Tube of Francis Turbine. J. Huazhong Univ. Sci. Technol. 1999, 9, 27–29. [Google Scholar]
  12. Konstantinov, A.; Staroselsky, I.; Orszag, S.A.; Yakhot, V. Renormalization Group-Based Transport Modeling of Premixed Turbulent Combustion: I. Incompressible Deflagration Model. J. Sci. Comput. 1998, 13, 229–252. [Google Scholar] [CrossRef]
  13. Kurenkov, A.; Oberlack, M. Modelling Turbulent Premixed Combustion Using the Level Set Approach for Reynolds Averaged Models. Flow Turbul. Combust. 2005, 74, 387–407. [Google Scholar] [CrossRef]
  14. Gao, Z.; Deng, J.; Ge, X. Numerical simulation of three-dimensional unsteady vortex rope turbulent flow occurred to the draft tube of a Francis turbine. J. Hydraul. Eng. 2009, 40, 1162–1167. [Google Scholar]
  15. Zhang, C.; Diao, W.; You, J.; Xia, L. Numerical analysis of dynamic characteristics 0f the vortex rope in a francis turbine with splitter blades. J. Huazhong Univ. Sci. Technol. 2017, 45, 66–73. [Google Scholar]
  16. Li, Q.; Zhao, C.; Long, S.; Quan, H. Study on the evolution of draft tube vortex band under flyaway condition of reversible hydraulic turbine. Vib. Shock. 2019, 38, 222–228. [Google Scholar] [CrossRef]
  17. Fu, X.; Li, D.; Wang, H.; Zhang, G. Investigation on the fluctu ation of hydraulic exciting force on a pump-turbine runner during the load rejection process. In Proceedings of the IOP Conference Series: Earth and Environmental Science, Beijing, China, 16–19 November 2017; p. 012101. [Google Scholar]
  18. Gao, Z.; Zhu, W.; Meng, L.; Zhang, J. Experimental Study of the Francis Turbine Pressure Fluctuations and the Pressure Fluctuations Superposition Phenomen on Inside the Runner. J. Fluids Eng. 2017, 140. [Google Scholar] [CrossRef]
  19. Zhang, Y.; Zheng, X.; Li, J.; Du, X. Experimental study on the vibrational perform ance and its physical origins of a prototype reversible pump turbine in the pumped hydro energystorage power station. Renew. Energy 2019, 130, 667–676. [Google Scholar] [CrossRef]
  20. Zhang, Y.; Chen, T.; Li, J.; Yu, J. Experimental Study of Load Variations on Pressure Fluctuations in a Prototype Reversible Pump Turbine in Generating Mode. J. Fluids Eng. 2017, 139, 074501–074504. [Google Scholar] [CrossRef]
  21. Favrel, A.; Müller, A.; Landry, C.; Yamamoto, K.; Avellan, F. Study of vortex zone evolution and pressure pulsation in draft tube under upstream disturbance conditions. Exp. Fluids 2015, 56, 215. [Google Scholar] [CrossRef]
  22. Chen, M. Study on the Correlation Mechanism Between Flow Field Structure of Mixed-Flow Rotor Outlet and Pressure Pulsation Characteristics of Draft Tube. Master’s Thesis, Xi’an University of Technology, Xi’an, China, 2021. [Google Scholar] [CrossRef]
  23. Li, C.; Pu, F.; Yang, J.; Wu, C.; Zhang, X.; Yang, H.; Yu, R. Analysis of the effect of different velocity angles of draft tube inlet on its internal flow field. Yunnan Hydropower 2022, 38, 58–62. [Google Scholar]
  24. Wu, W.; Li, L.; Lv, R.; Yu, A. Research on pressure pulsation characteristics of pump turbine draft tube under different working conditions and improvement measures. Hydropower Pumped Storage 2021, 7, 11–19. [Google Scholar]
  25. Yan, W.; Yang, J.; Zhang, Z.; Zeng, Y.; Yang, J. Effect of draft tube cavity vortex on the stability of pumped storage power plant system. J. Hydropower Gener. 2022, 41, 113–121. [Google Scholar]
  26. Ma, Y.; Qian, B.; Feng, Z.; Liu, X.; Wang, B. Influence of cross-beam holes on the internal flow characteristics of the draft tube of axial-flow turbine. People’s Yellow River 2021, 43, 122–124. [Google Scholar]
  27. Yang, J.; Zhang, X.; Li, H.; Li, Y. Influence of draft tube deflector on the internal flow of centrifugal pump as a permeable level. Hydraul. Pneum. Seals 2021, 41, 60–60,63. [Google Scholar]
  28. Yang, L.; Yan, C.; Zhang, J.; Deng, Z. The effect of draft tube with rectifier on its internal flow pattern. J. Drain. Irrig. Mach. Eng. 2018, 36, 124–128,135. [Google Scholar]
  29. Rong, L. Hydrodynamic Analysis and Airfoil Optimization of Turbine Blades. Master’s Thesis, Harbin Engineering University, Harbin, China, 2006. [Google Scholar]
  30. Li, Q.; Ma, Q.; Xin, L. Effect of radius of guide vane head circle on hydraulic characteristics of water pump turbine. J. Huazhong Univ. Sci. Technol. (Nat. Sci. Ed.) 2022, 50, 94–100,115. [Google Scholar] [CrossRef]
  31. Zeng, H.; Li, Z.; Li, D.; Chen, H.; Li, Z. Vortex Distribution and Energy Loss in S-Shaped Region of Pump Turbine. Front. Energy Res. 2022. [Google Scholar] [CrossRef]
  32. Li, Z.; Li, W.; Wang, Q.; Xiang, R.; Cheng, J.; Han, W.; Yan, Z. Effects of medium fluid cavitation on fluctuation characteristics of magnetic fluid seal interface in agricultural centrifugal pump. Int. J. Agric. Biol. Eng. 2021, 14, 85–92. [Google Scholar] [CrossRef]
  33. Chen, X. Study on the Influence of Water Pump Turbine Guide Vane Wing Shape on “S” Characteristic. Master’s Thesis, Lanzhou University of Technology, Lanzhou, China, 2020. [Google Scholar] [CrossRef]
  34. Chen, A. Research on Vortex Band Characteristics of Water Pump Turbine Draft Tube and Improvement Method. Master’s Thesis, Harbin Institute of Technology, Harbin, China, 2017. [Google Scholar]
Figure 1. Schematic diagram of the modified anterior and posterior guide vane airfoils. (a) Prototype movable guide vane wing type (Unit is mm). (b) Modified movable guide vane wing type.
Processes 10 01494 g001
Figure 2. Comparison of the front and rear guide vane airfoil velocity triangles of the modification.
Processes 10 01494 g002
Figure 3. Model pump turbine calculation area.
Processes 10 01494 g003
Figure 4. Local grid diagram.
Processes 10 01494 g004
Figure 5. Distribution of blade Y+ wall surface.
Processes 10 01494 g005
Figure 6. Mesh independence verification.
Processes 10 01494 g006
Figure 7. Pump turbine experimental device.
Processes 10 01494 g007
Figure 8. Comparison of experimental and simulation results.
Processes 10 01494 g008
Figure 9. Experimental value of pressure pulsation of draft tube (a0 = 33 mm).
Processes 10 01494 g009
Figure 10. Overall velocity flow line of the draft tube before and after the modification and velocity vector diagram of the characteristic section at t = T (0.46404 s). (a) Prototype flow chart. (b) Modified flow chart. (c) dt1Cross-sectional streamline vector drawing. (d) dt1Cross-sectional flow vector top view. (e) dt2Cross-sectional streamline vector drawing.
Processes 10 01494 g010
Figure 11. Comparison of the shape of the draft tube vortex before and after changing the airfoil. (a) Prototype. (b) After modification.
Processes 10 01494 g011
Figure 12. Comparison of turbulent energy evolution of draft tube before and after changing airfoil type.
Processes 10 01494 g012
Figure 13. Schematic diagram of pressure pulsation monitoring points.
Processes 10 01494 g013
Figure 14. Time-domain diagram of monitoring point pressure pulsation. (a) d1Time domain curves. (b) d3Time domain curves. (c) d5Time domain curves. (d) d7Time domain curves.
Processes 10 01494 g014aProcesses 10 01494 g014b
Figure 15. Monitoring point pressure pulsation frequency domain diagram. (a) d1Time domain curves. (b) d3Time domain curves. (c) d5Time domain curves. (d) d7Time domain curves.
Processes 10 01494 g015
Table 1. Airfoil design parameters.
Parameter SymbolsNumerical Values (mm)Parameter SymbolsNumerical Values (mm)
D0638.639e9.271275397
a11.06607099e18.236239902
a12.851853121d016.09810526
b11.29730233m7.465468788
b15.021023256m15.890893513
c11.16517013k0.902903304
c16.815818849f4.71271481
d10.2842886r6.012014688
d17.718722154L89.96
L147.34736842L242.61263158
Table 2. Geometric parameters of model pump turbine.
Parameter NameNumerical Value
Number of blades/pc9
Active guide leaf/pc20
Rotor high-pressure side diameter/mm473.6
Spiral casing inlet diameter/mm315
Height of guide lobe b0/mm66.72
Number of fixed guide vane/pc20
Height of guide leaf/mm66.72
Rotor low-pressure side diameter/mm300
Draft tube outlet diameter/mm660
Table 3. Flow-speed test data.
Flow rate Q11 (m3·s−1)0.840.830.760.660.540.30.02
Speed n11 (r·min−1)51.200156.874765.656370.876272.334270.460665.4471
Table 4. Experimental value of pressure pulsation of draft tube (a0 =33 mm).
Monitor the Locationf (Hz)fn (Hz)ΔH·H1 (%)f·fn1
Upstream of the spinal canal3.4319.533.440.24
Downstream of the spinal canal3.4319.532.420.24
Inside the elbow tube5.5719.523.950.26
The outside of the elbow tube37.619.531.91.98
Table 5. Hydraulic turbine working conditions pressure pulsation test.
Location of
Measurement Points
Operating
Conditions
Test Results
H·H1)
Guaranteed Value
H·H1)
Spiral case import importAt rated operating conditions
Partial working conditions operation
2.02
2.14
<3%
<3%
Movable guide vane—
between runners
At rated operating conditions
Partial working conditions operation
2.64
5.76
<7%
<7%
Between top cover
and runner
At rated operating conditions
Partial-load or no-load operation
3.45
5.22
<7%
<7%
Draft tubeOptimum operating conditions
Partial-load or no-load operation
1.10
6.39
<2%
<7%
Table 6. Recovery coefficient of draft tube under different working conditions.
Before Modification
Working Conditions Q11 (m3·s1) Δ h w (−) η w (−)
0.830.5105150.691242
0.660.3876640.729541
0.30.3065140.759853
After Modification
Working Conditions Q11 (m3·s1) Δ h w (−) η w (−)
0.830.5515350.698520
0.660.3971120.738467
0.30.3299920.761053
Publisher’s Note: MDPI stays neutral with regard to jurisdictional claims in published maps and institutional affiliations.

