Article

Activated Carbon Modified by Ester Hydrolysis of Ethyl Acetate for Water Vapor Adsorption Enhancement

1
Education Ministry Key Laboratory of Renewable Energy Advanced Materials and Manufacturing Technology, School of Energy and Environmental Science, Yunnan Normal University, Kunming 650500, China
2
Yunnan Key Laboratory of Optoelectronic Information Technology, School of Physical and Electronic Information, Yunnan Normal University, Kunming 650500, China
*
Authors to whom correspondence should be addressed.
Processes 2022, 10(8), 1527; https://doi.org/10.3390/pr10081527
Submission received: 22 June 2022 / Revised: 27 July 2022 / Accepted: 29 July 2022 / Published: 3 August 2022
(This article belongs to the Section Chemical Processes and Systems)

Abstract

:
To improve water vapor adsorption, this study employed oxalic acid–ethyl acetate acidic hydrolysis to modify honeycomb activated carbon and introduce hydrophilic functional groups. Scanning electron microscopy (SEM), Boehm titration, Fourier transform infrared spectroscopy (FT-IR), and an automatic surface area analyzer (BET) were used to characterize the microscopic morphology, surface functional groups, specific surface area, and pore size changes. The results showed that, when the concentration of oxalic acid is 0.0006 mol/cm3, the specific surface area is 179.06 m2/g. After hydrolysis with ethyl acetate, the original functional groups became more abundant, while the number of total acidic functional groups on the surface grew from 0.497 mmol/g to 1.437 mmol/g. The static water vapor adsorption experiments were conducted on modified activated carbon under constant temperature and humidity conditions. Compared with unmodified activated carbon, the activated carbon modified with 0.0006 mol/cm3 oxalic acid increased the adsorption capacity of water vapor by 15.7%. The adsorption capacity of activated carbon after being combined with 0.0006 mol/cm3 oxalic acid and ester hydrolysis modification increased by 37.1%. At the same temperature, the adsorption capacity increased with a higher relative humidity. At the same relative humidity, the adsorption capacity decreased as the temperature rose. Therefore, this modification method may provide clues for the application of enhancing the hygroscopic ability of activated carbon.

1. Introduction

Activated carbon is a porous product made from the carbonization and activation of carbon-containing raw materials at high temperatures. The product has a black appearance and a porous interior structure. Due to its massive specific surface area, abundant surface chemical groups, and high adsorption capacity, activated carbon has been widely used as an adsorbent, catalyst, and catalyst carrier, which are commonly seen in separation, purification, and catalytic process. The performance of activated carbon as an adsorption material depends largely on the geometry, volume, and particularly the size of the pores in the material [1]. However, it is difficult for traditional methods to prepare high-quality activated carbon with specific functions. By changing the physicochemical properties of the activated carbon surface and optimizing the full potential of its adsorption properties, it is possible to satisfy the increasing needs of production, life, and engineering experiments.
The surface acidity of activated carbon is related to the surface oxygen content, which is closely influenced by the existence of acid groups, such as carboxyl, phenolic hydroxyl, and lactone in the structure. The purpose of the surface modification cationic method is to improve the surface acidity, mainly increasing the carboxylic acid content [2]. At present, oxidation modification is one of the main ways to enhance the surface acidity of activated carbon. Strong oxidants such as KMnO4, HNO3, ozone, and H2O2 are mainly used to oxidize activated carbon under certain conditions, thus introducing or increasing hydrophilic acidic oxygen-containing functional groups (lactone group, carbonyl group, carboxyl group, phenolic hydroxyl group, etc.) [3] on the surface of activated carbon, and improving the overall hydrophilicity of activated carbon. Lesaoana [4] impregnated Macadamia activated carbon (MAC) with concentrations of sulfuric acid, phosphoric acid, or nitric acid (20–60% v/v). The area of the pristine MAC surface increased from 545 to 824 m2/g upon the acid treatment. Recently, Yao et al. [5] reported an improvement in adsorption capacity from 68.14 to 91.66 mg/g following a secondary treatment of ACs with a nitric acid solution. Badie [6] studied the method of pyrolysis modified by H3PO4 and the results showed that it could promote the formation of oxygen-containing functional groups on the surface of activated carbon, and the adsorption capacity for Pb2+ would reach 299 mg/g about two times before modification. Wang et al. [7] found that the acetaldehyde adsorption capacity of activated carbon treated by oxidation, especially nitric acid, was significantly improved. On top of that, the number of acidic oxygen-containing groups in modified carbide-derived carbon (CDC) also increased, as the adsorption performance improved greatly. The adsorption energy of the acetaldehyde molecule and pristine graphene was 10.79 KJ/mol, while the adsorption energy of the acetaldehyde molecule and functionalized graphene increased to 39.95 KJ/mol. Lemus et al. [8] modified commercial activated carbon by heating and through oxidation (nitric acid and ammonium persulfate), which improved its alkalinity and adsorption capacity. In addition, the pore structure, specific surface area, volume, and pore size of modified carbon materials may also change. Kim et al. [9] used phosphoric acid (PA) to oxidize activated carbon (AC). In their study, granular type AC (30–35 mesh, Samchully, Korea), prepared from coconut shells was used after any impurities were removed through purification. Purified AC was prepared by boiling the AC for 5 h in a water bath five times, and it was dried for 12 h in a drying oven at 100 °C. Furthermore, they measured the adsorption capacity of modified activated carbon (PA/AC) against the mixed gas system of different components. The adsorption capacity of PA/AC for toluene and methyl ethyl ketone (MEK) became higher than that of unmodified activated carbon as the specific surface area and pore volume of PA/AC increased. The adsorbed MEK was almost completely desorbed by supplying a stream of toluene at 25 °C. The desorption efficiency of PA/AC for toluene and MEK was above 98% at 300 °C. Generally speaking, the oxygen-containing functional groups formed in the modification process have greatly influenced the performance of activated carbon adsorbents due to their enhancement of the polarity and wettability of carbon, and especially the improvement on the adsorption performance of polar organic compounds [3].
The specific surface area, pore structure, and surface chemical characteristics of activated carbon determine the adsorption performance of activated carbon. To be specific, specific surface area and the spatial layout of pore structure play a decisive role in the adsorption capacity of activated carbon [10,11,12]. As for surface chemical characteristics, such as the types and quantities of surface compounds, surface oxygen-containing functional groups, and surface heteroatoms, they greatly affect the interaction between polar adsorbates or nonpolar adsorbates and activated carbon [3]. The existence of these oxygen-containing functional groups affects the micro physicochemical properties of the activated carbon surface, either directly or indirectly, and affects the macro adsorption performance of activated carbon.
Although HNO3 and other strong oxidizing acids used to modify activated carbon will increase the oxygen-containing functional groups on the surface, the disadvantages are also obvious as they destroy the pore structure of activated carbon when the pore size is collapsed. This paper starts with changing the physical and chemical characteristics of the activated carbon surface. Firstly, the honeycomb activated carbon was modified by oxalic acid to avoid the shrinkage of pore size [1] and specific surface area decrease that may adversely affect the adsorption effect with strong acid modification. Then, the hydrolysis of ethyl acetate led to more oxygen-containing functional groups on the surface of the activated carbon, which improved the polarity of the activated carbon surface. Meanwhile, specific hydrophilic groups were introduced to enhance the selective adsorption of water vapor by activated carbon, which minimized damage to the pore structure and maintained the activated carbon’s quality. Given the above research, this paper highlighted changes to the micro-morphology surface functional groups and categorized them using a scanning electron microscope (SEM), Fourier transform infrared spectroscopy, Boehm titration, and automatic specific surface area analyzer before analyzing the effects of different modification conditions on the water vapor adsorption of activated carbon.

2. Preparation and Surface Properties of Hydrophilic Activated Carbon

2.1. Surface Modification

Surface acid modification: Soak 3 g of clean activated carbon in a large test tube in boiling water for 10 min, and stir continuously with a glass rod. After draining the water, then wash it with deionized water 3~5 times. Put the activated carbon into a drying oven and dry it at 50 °C for 12 h, which produces the unmodified original activated carbon. Put 3 g of unmodified activated carbon into a large test tube, and prepare oxalic acid solutions of volumes of 0.0003 mol/cm3, 0.0006 mol/cm3, 0.0009 mol/cm3, 0.0012 mol/cm3, and 0.0018 mol/cm3 in turn. Pour 30 mL of oxalic acid into the large test tube, and shake and place the tube in a constant temperature water bath of 40 °C. Stir the crystallization precipitation of the high-concentration oxalic acid solution once every hour with a glass rod instead of preventing the solution from being left still at a low temperature for a long time, which would affect the acid impregnation effect. After dipping for 24 h, take the activated carbon out, and wash it with deionized water several times to get a neutral pH. Then, dry the activated carbon at 80 °C. By then, label the activated carbon as acid-modified activated carbon.
Surface ester hydrolysis modification: Take 1 g of activated carbon modified by oxalic acid with different concentrations, and add oxalic acid solution and ethyl acetate solution with different concentrations at a ratio of 1:3. The oxalic acid solution should first be introduced into the surface of activated carbon before being poured into ethyl acetate solution. Finally, it should be placed in a constant temperature water bath at 40 °C for hydrolysis reaction. Due to excessive ethyl acetate, the previously added oxalic acid will react fully and eventually hydrolyze into acetic acid and ethanol. After being kept still for 24 h, wash the dry activated carbon with deionized water for subsequent use. In this process, the unreacted ethyl acetate and the generated ethanol in the activated carbon are volatile due to heat changes. After modification, only hydrophilic acetic acid molecules stay on the surface of activated carbon.

2.2. Analysis and Test Methods of Modified Activated Carbon
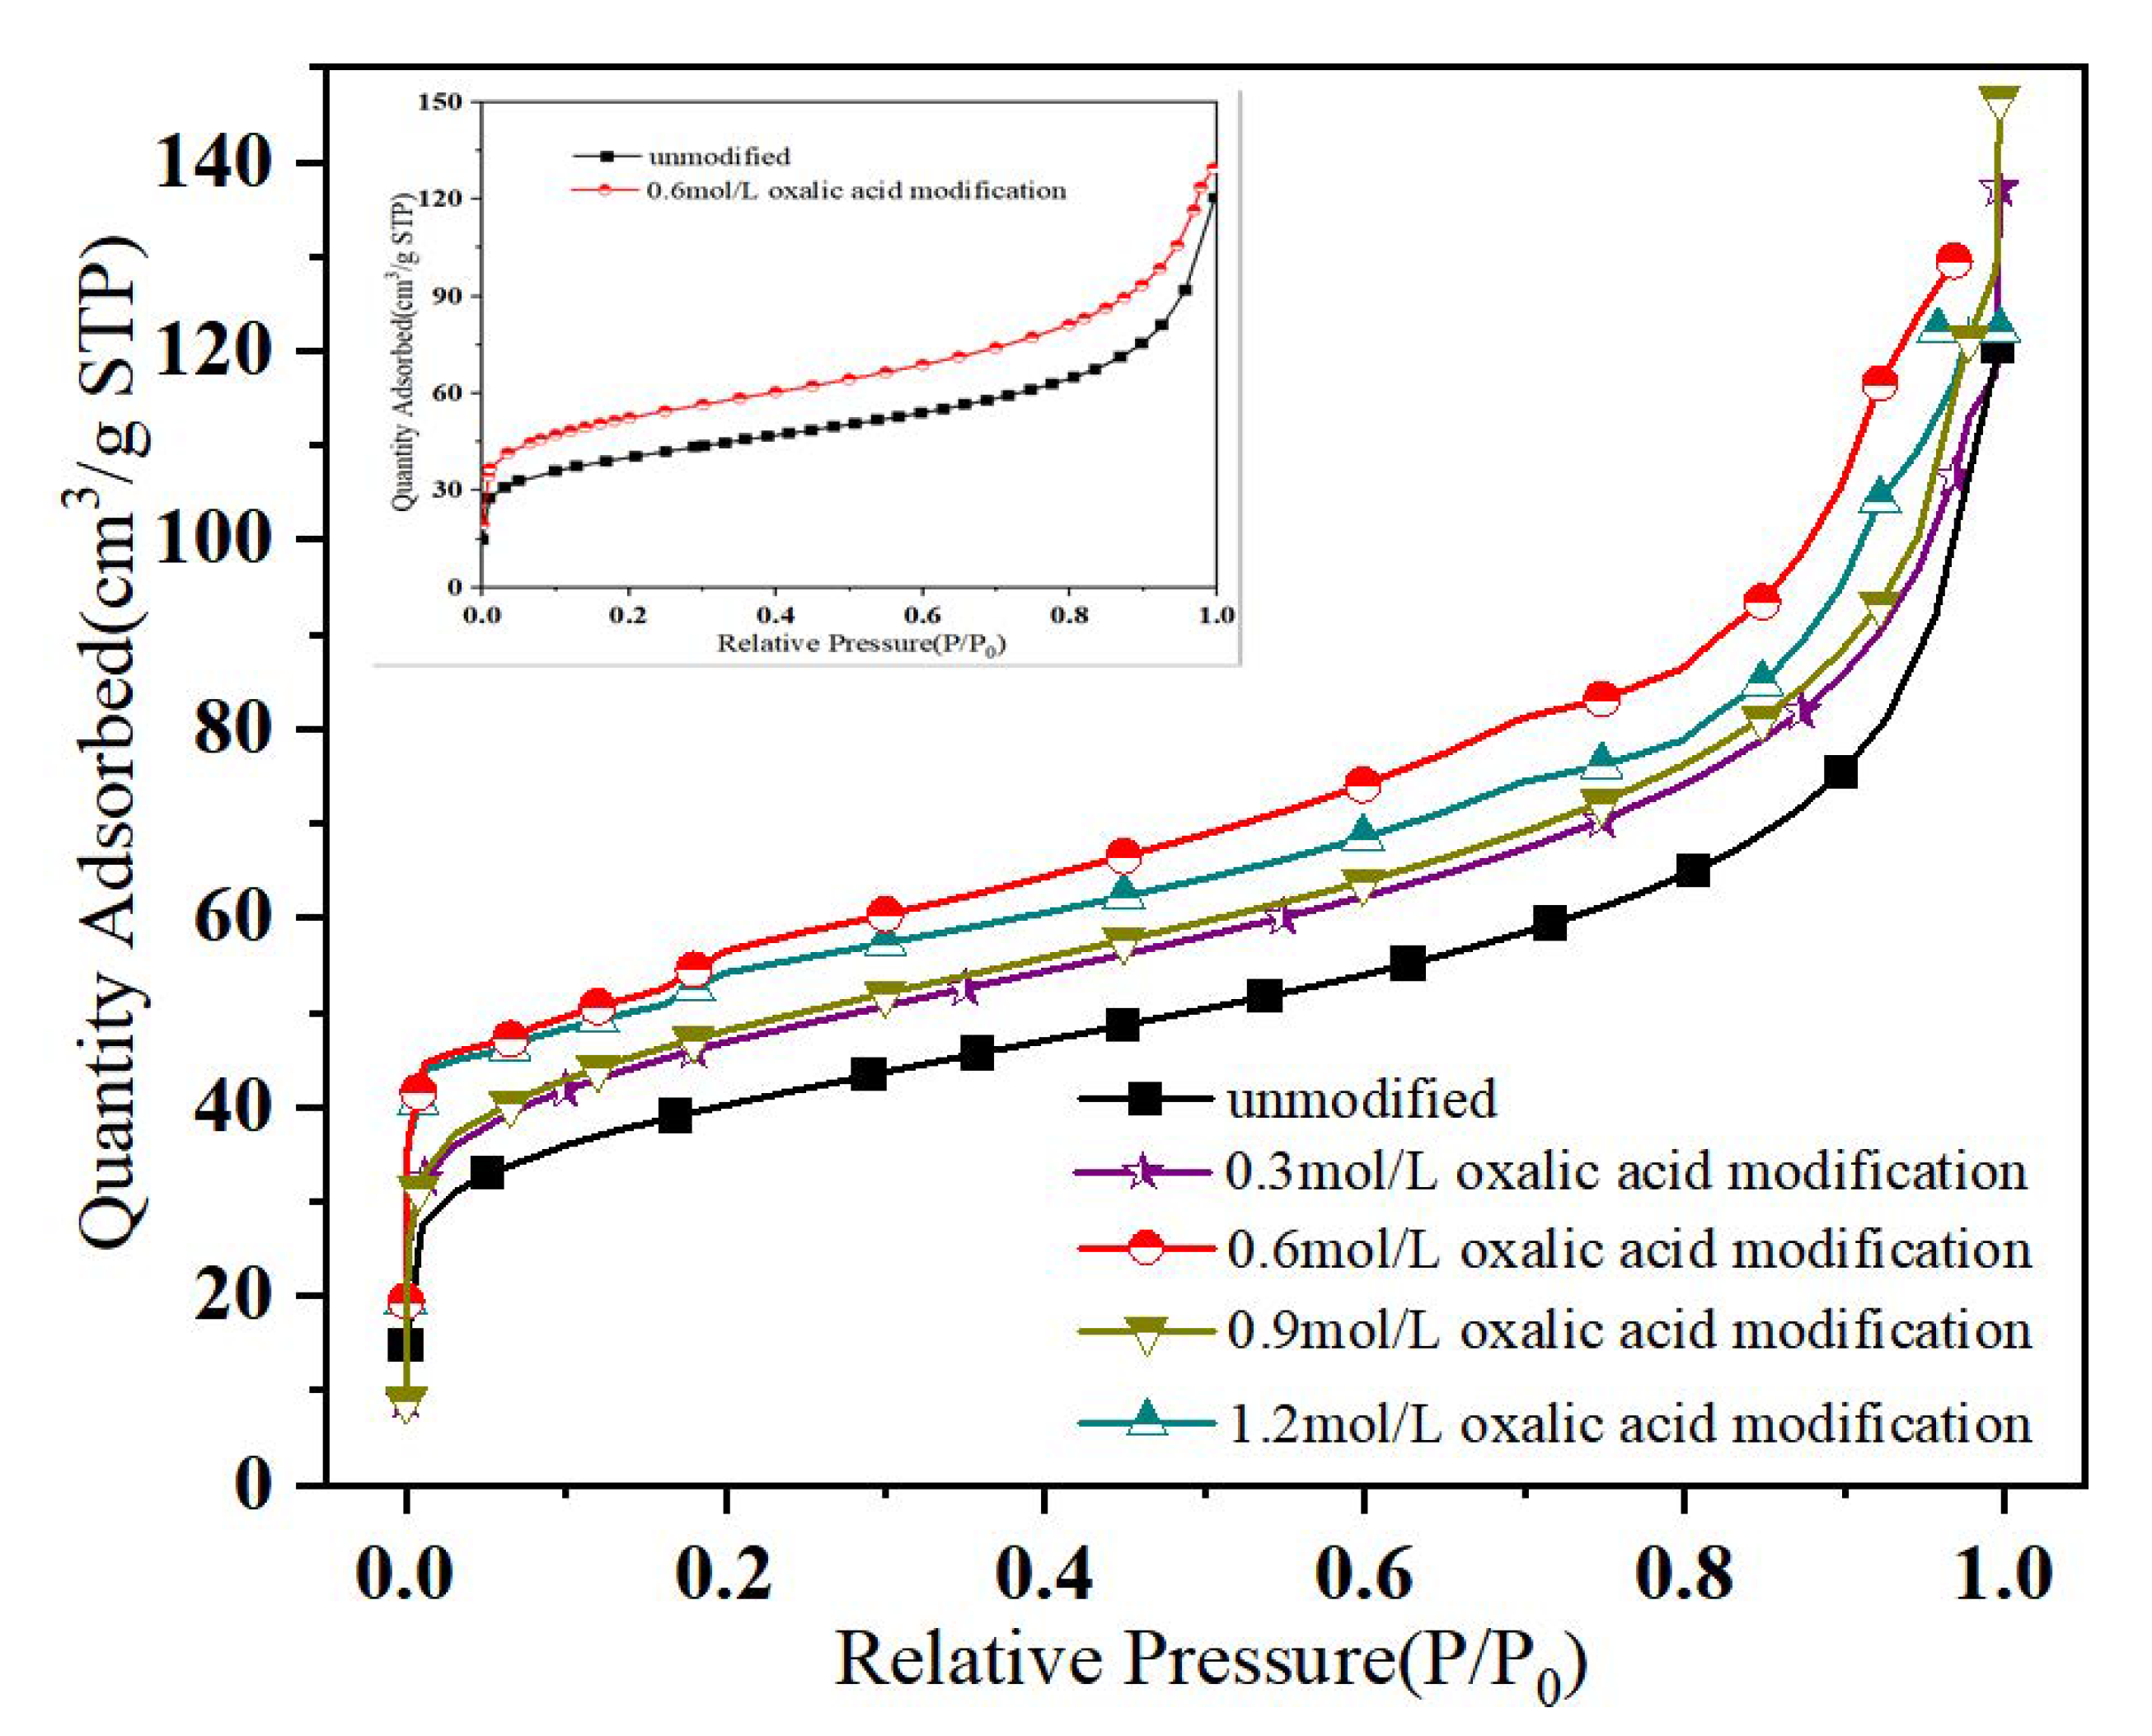
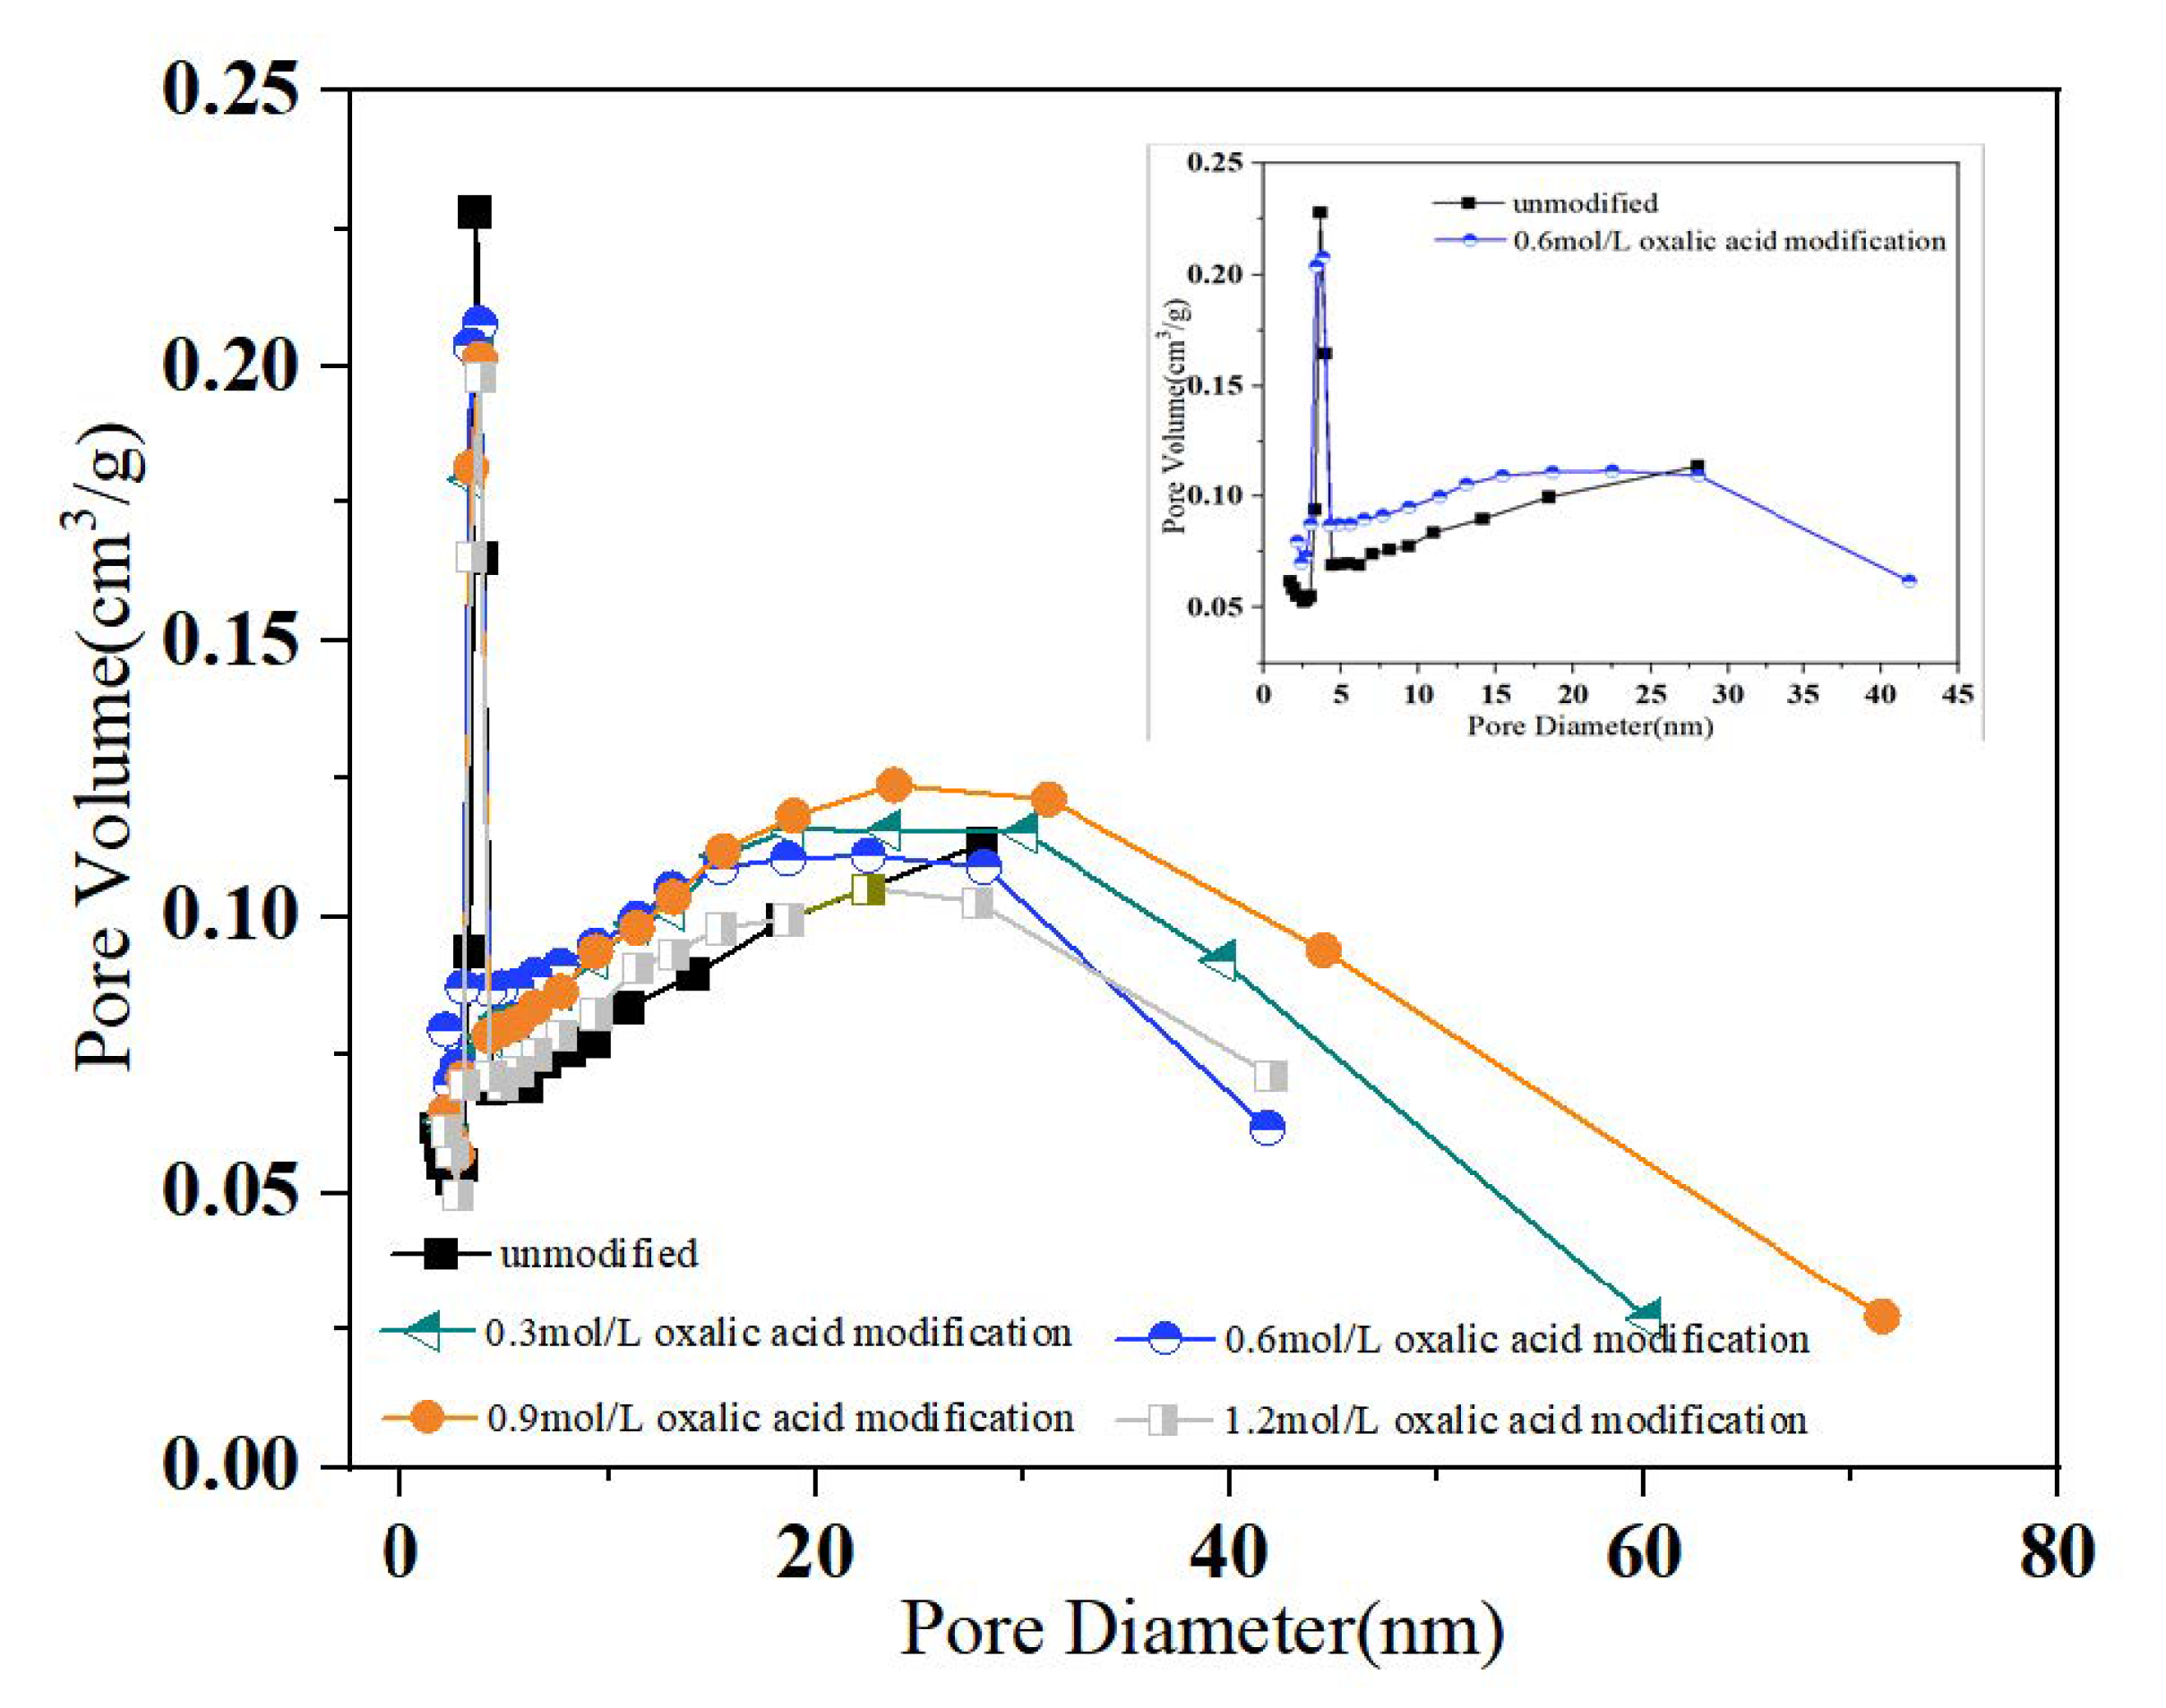
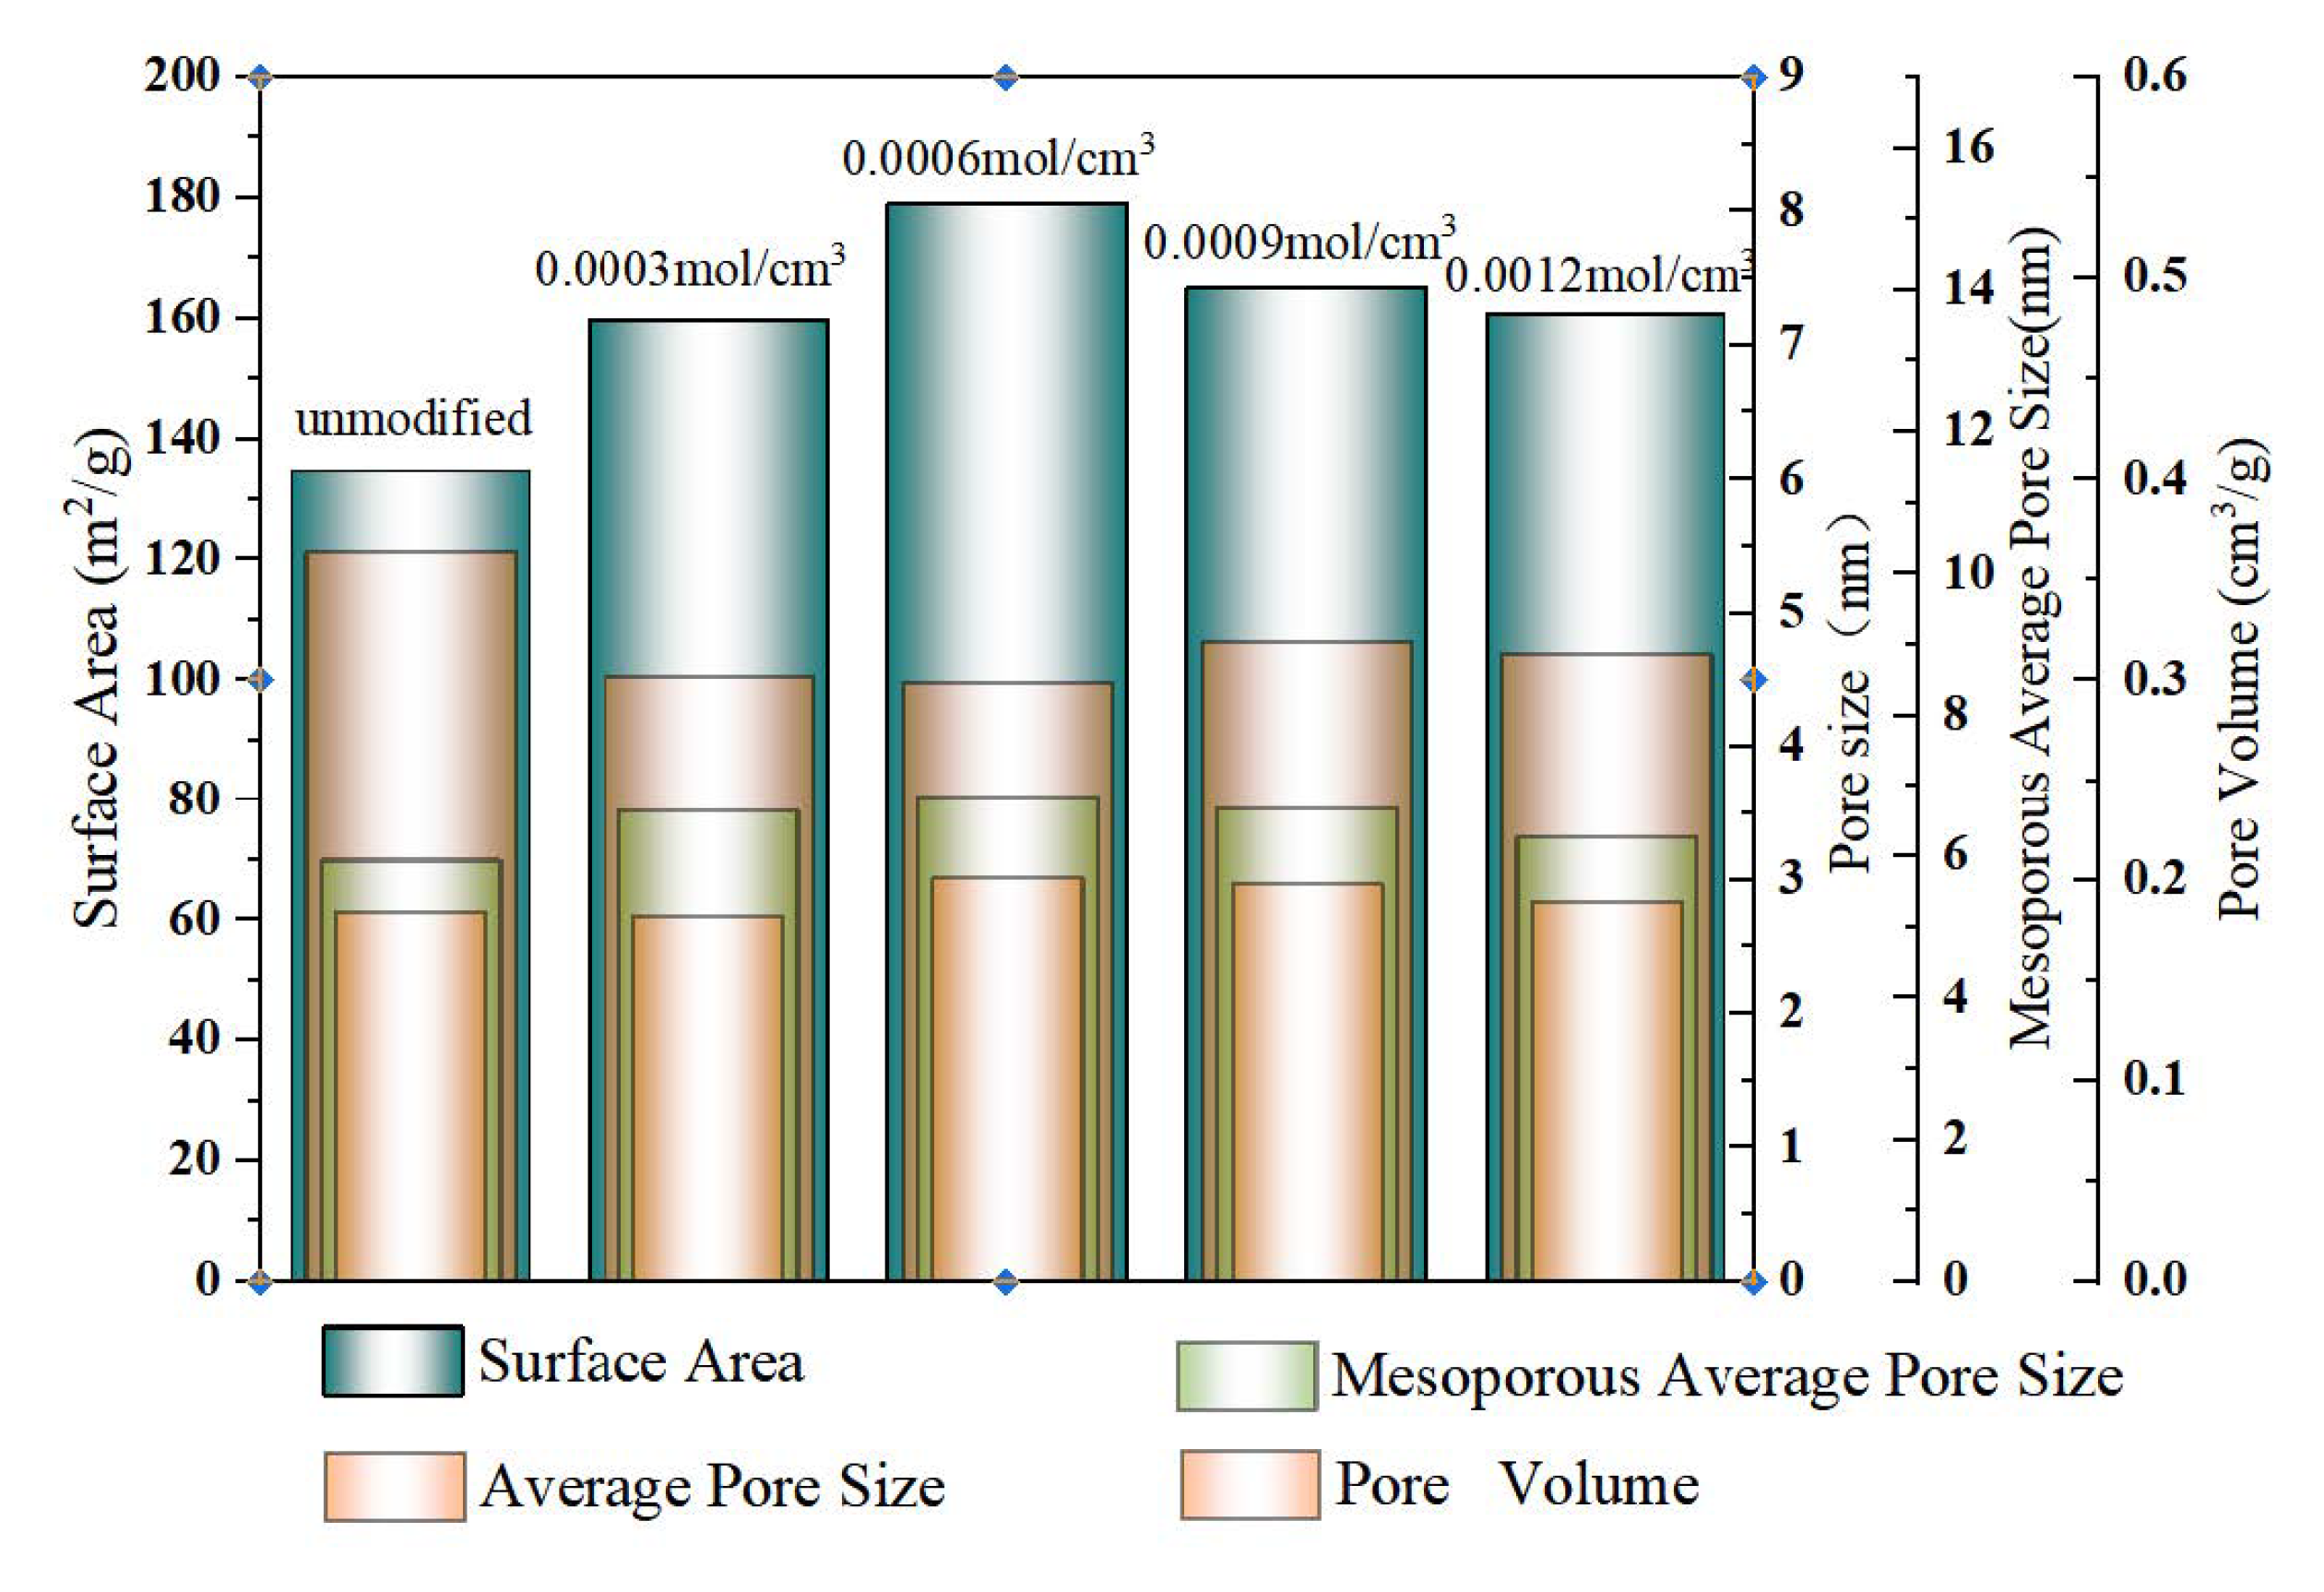
2.2.1. BET

The International Union of Pure and Applied Chemistry (IUPAC) grouped adsorption isotherms into six categories [13], laying out the evolution basis of actually various adsorption isotherms through different combinations. Therefore, the surface characteristics of adsorbent pore distribution and the interactions between adsorbents can be identified by different types of adsorption isotherms.
The automatic specific surface area pore size analyzer (BET) (model: ASAP 2460) measured the N2 adsorption−desorption isotherms of activated honeycomb carbon that is modified and unmodified by carbon oxalic acid with different concentrations at an ambient temperature of 77 K.

2.2.2. SEM

The scanning electron microscope (SEM) (model: TESCAN MIRA 4) monitored the surface morphology of activated carbon before and after the modification.

2.2.3. FT-IR

Fourier transform infrared spectroscopy (FT-IR) (model: Bruker MPA and Tensor 27, Billerica, MA, USA) recorded the changes in oxygen-containing functional groups on the surface of modified honeycomb activated carbon.

2.2.4. Boehm Titration

Oxygen on the surface of activated carbon exists as oxygen-containing functional groups, such as hydroxyl, carbonyl, carboxyl, and lactone groups to regulate its surface acidity and alkalinity [14]. The Boehm titration method was proposed by H.P. Boehm in 1962 to analyze types and quantities of functional groups as different acidic oxygen-containing functional groups on the surface of activated carbon that react differently in specific alkali solutions at various strengths [15,16]. Boehm titration is simple and easy, thus being widely used in the quantitative chemical analysis of the activated carbon surface. The method is mainly used to detect the content of carboxyl, phenolic hydroxyl, and lactone functional groups existing on the activated carbon surface [17,18,19].
Before the experiment, we prepared 0.0001 mol/cm3 standard solutions of sodium hydroxide, sodium carbonate, and sodium bicarbonate. For each measurement (taking the measurement of unmodified activated carbon as an example, the operation of modified activated carbon being similar), 1 g of the activated carbon sample was put into three conical flasks as the NaOH solution impregnation, Na2CO3 solution impregnation, and NaHCO3 solution impregnation, respectively. Then, 25 mL of NaOH solution, Na2CO3 solution, and NaHCO3 solution were respectively added to the labeled conical flasks. The solutions were then shaken for a while in a sealed bottle to mix the material before leaving them in a constant temperature water bath at 25 °C for 24 h for later filtering. We then removed 10 mL of filtrate with a pipette and diluted it to 50 mL. Then, the filtrate impregnated with NaOH, Na2CO3, and NaHCO3 solution were titrated with hydrochloric acid standard solution (0.00001 mol/cm3), with methyl orange as the indicator of the titration end point. The titration ended as the color changed from light yellow to light red. The amount of change to the hydrochloric acid represented the consumption of NaOH solution, Na2CO3 solution, and NaHCO3 solution in the process. The neutralization value of NaHCO3 solution represents the content of carboxyl; the neutralization value of Na2CO3 solution represents the total content of lactone and carboxyl functional groups on the surface of activated carbon; and the neutralization value of NaOH solution represents the total content of carboxyl, lactone, and phenolic hydroxyl functional groups. The differences in the above mentioned alkali neutralization values indicate the number of single base groups. Therefore, the total number of acidic groups on the surface of activated carbon can be denoted as (1):
a = V × C NaOH + 25 × C 0 50 × C HCL M
where the a represents the total number of acidic oxygen-containing groups measured by mmol/g; V is for the Volume of NaOH standard solution consumed for titration of excess hydrochloric acid measured by mL; C0 is for the concentration of lye used measured by mol/L; CHCl represents the concentration of hydrochloric acid solution used measured by mol/L; CNaOH reflects the concentration of NaOH solution used for titration of excess hydrochloric acid measured by mol/L; and M is the activated carbon sample quantity measured by g.
The content of the lactone group can be denoted as (2):
a lactone   group = a Na 2 CO 3 a NaHCO 3
The content of phenolic hydroxyl group can be denoted as (3):
a phenolic   hydroxyl = a NaOH a Na 2 CO 3

3. Water Vapor Adsorption Performance of Modified Activated Carbon

3.1. Activated Carbon Adsorption Theory

Since the atomic force field on the adsorbent surface is unsaturated and has excess capacity, the solid can adsorb other substances. When gas molecules move to the solid surface and collide with it, some of them will be adsorbed by the solid and release a certain amount of adsorption heat. However, solid surfaces saturated with adsorption will not be adsorbed again during the collision. For some adsorbed molecules, when the potential barrier of the gravity field of the adsorbent is lower than the kinetic energy of thermal motion, it will leave the adsorbent and return to the gas phase. In addition, the surface of adsorbed molecules is uniform and they will not be affected by each other. Furthermore, the opportunity to return to the gas phase is not affected by adjacent adsorbed molecules or adsorption positions.
According to the resulting contrast between the thickness of the gas adsorbed on the solid surface and the molecule, it can be classified into monolayer adsorption and multi-layer adsorption. The first molecular layer of multi-layer adsorption is usually called the monolayer. There is capillary condensation adsorption on the surface of mesopores and micropore volume filling adsorption inside micropores based on the pore size and adsorption location. As for the adsorption properties, there is physical adsorption and chemical adsorption, of which the latter is monolayer adsorption and the former is mostly multilayer adsorption, though monolayer adsorption may occur sometimes. In the actual adsorption process, there are no strict criteria to distinguish physical adsorption from chemical adsorption, and it is inappropriate to regard the process as a single physical adsorption or chemical adsorption. For the same substance, physical adsorption may change to chemical adsorption at different temperatures, and both adsorptions may also occur at the same time.

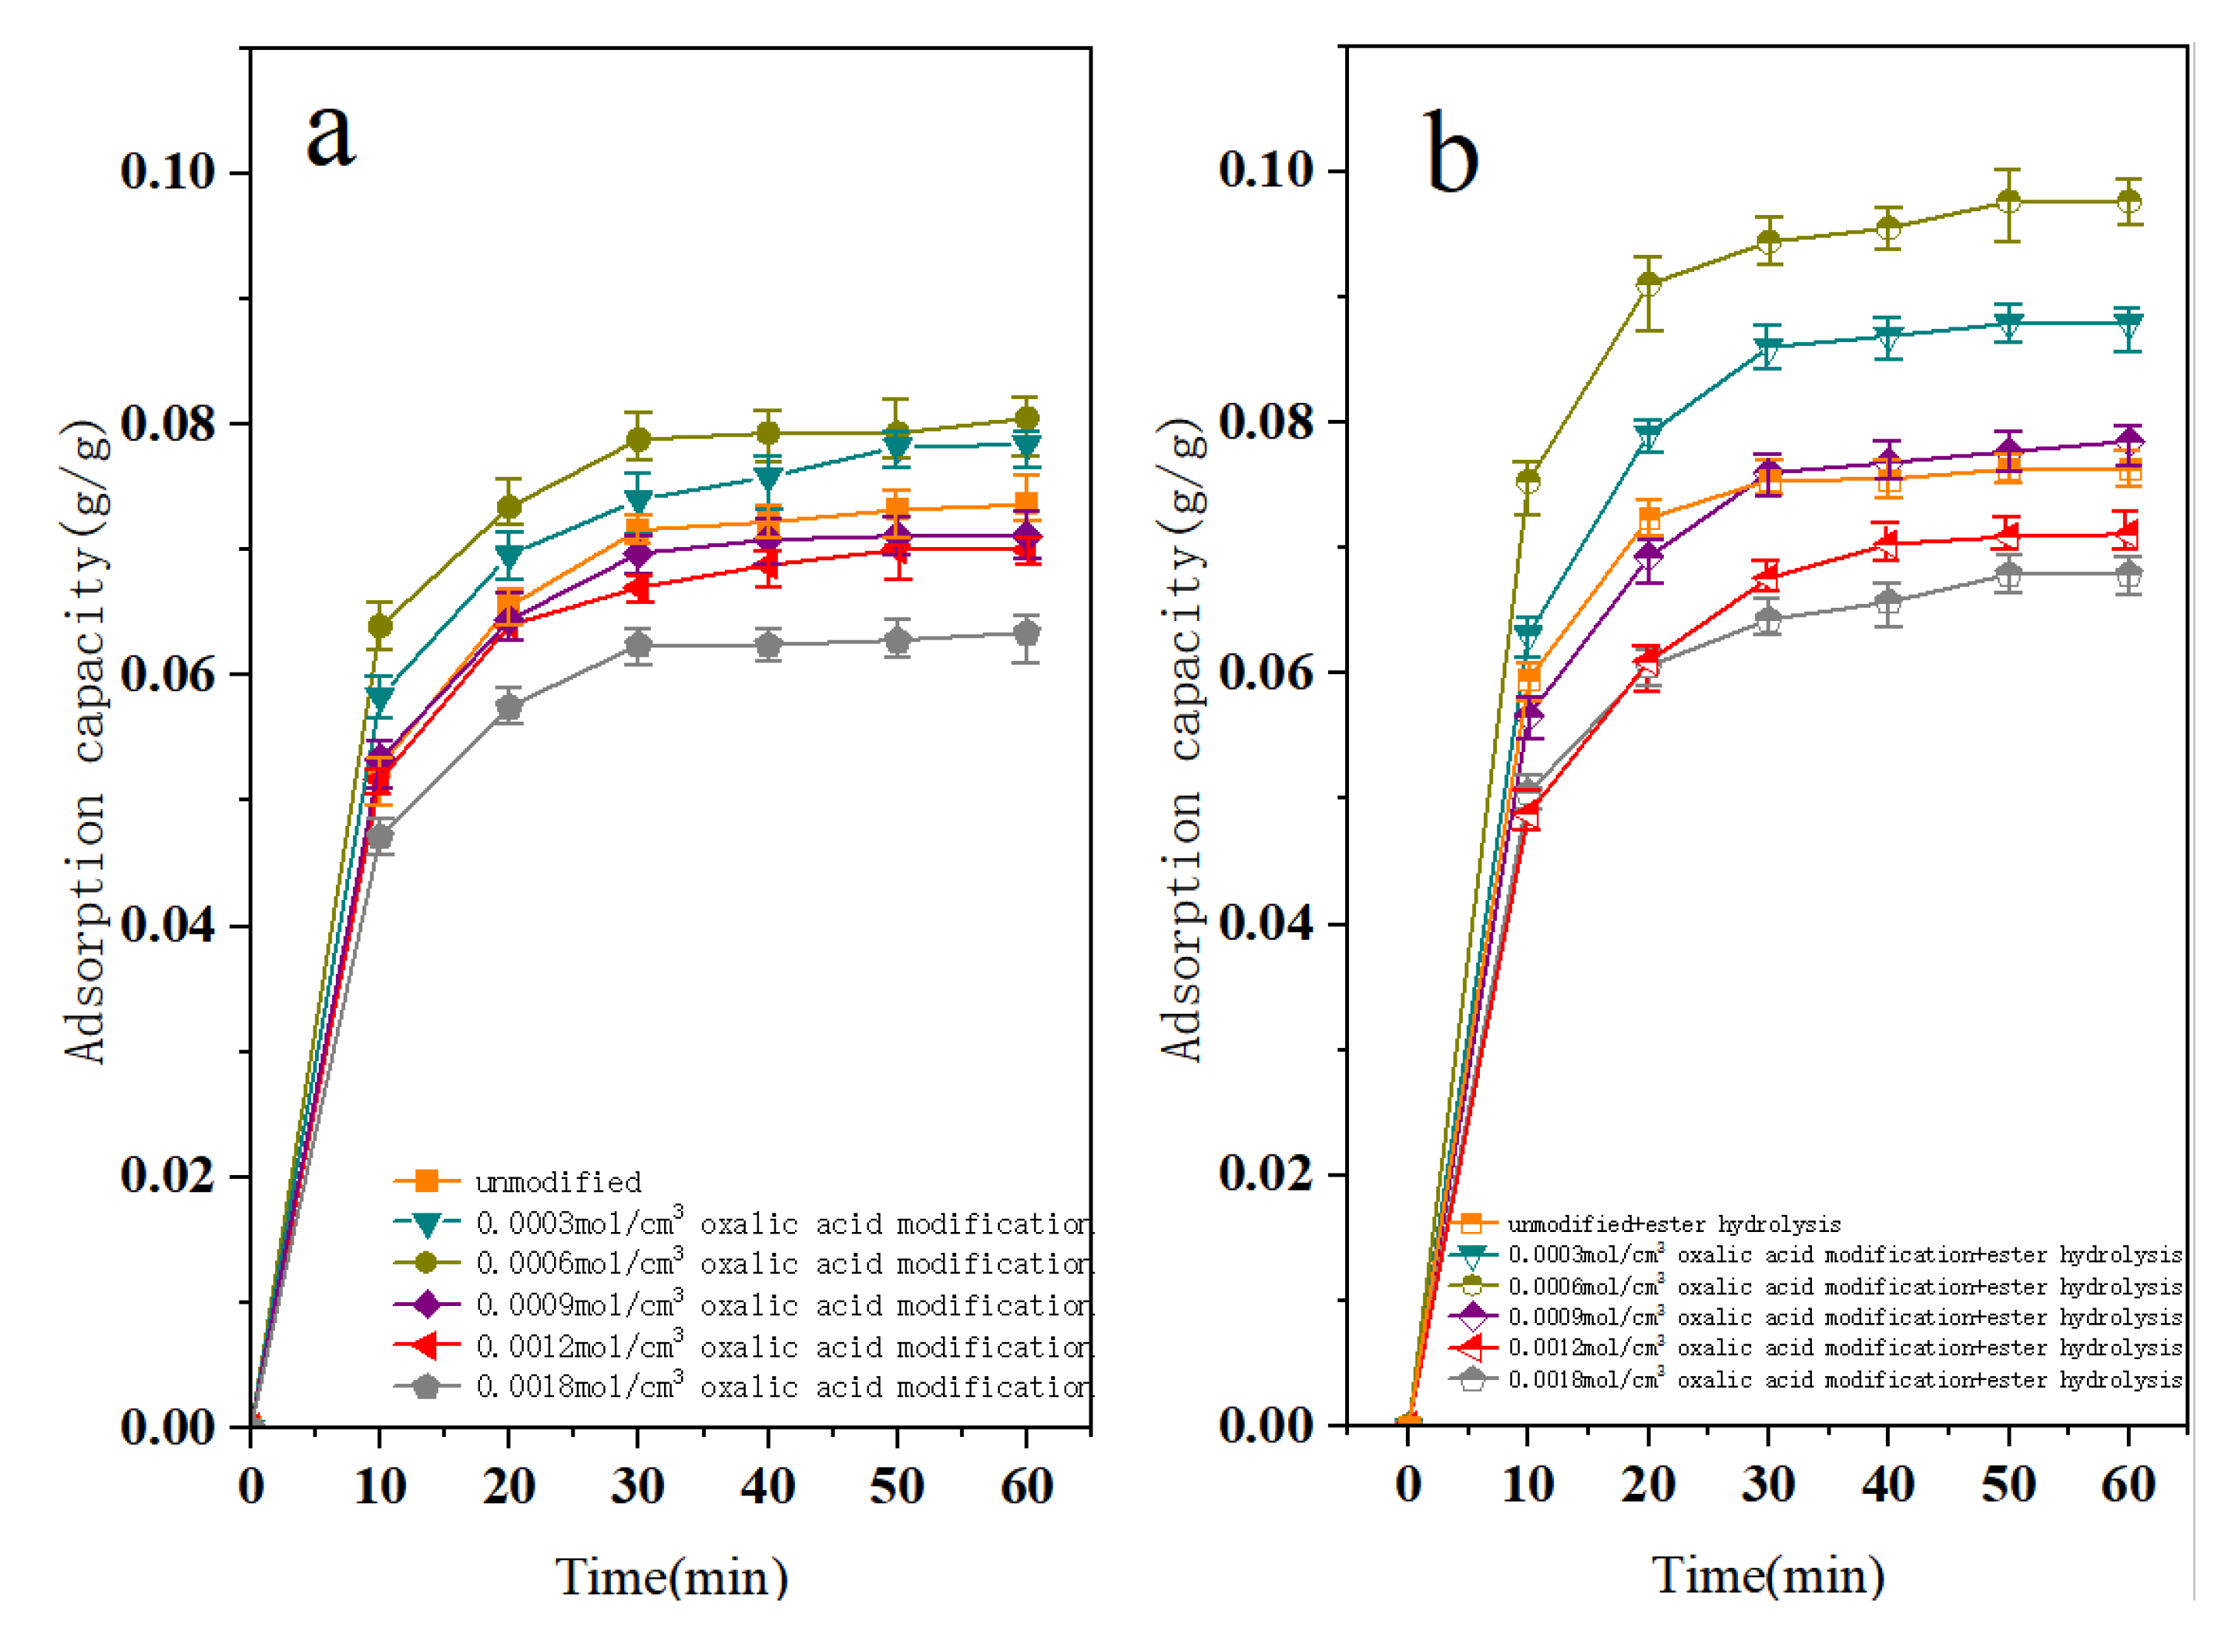
3.2. Static Adsorption Performance of Modified Activated Carbon for Water Vapor

A programmable constant-temperature–humidity cabinet (model: Byes-225L) performed the test of the temperature and humidity control accuracy of the water vapor adsorption capacity of the activated carbon under different modification methods, which is expressed by the mass of water vapor adsorbed by unit mass of activated carbon. The constant-temperature–humidity box ensures that activated carbon adsorbs water vapor under a relatively constant temperature and humidity condition. To meet this end, three groups of temperature and humidity conditions were set in the experiment, the overall temperature was controlled at 20.5 °C~30.5 °C, and the relative humidity was controlled at 60%~90%.
We weighed 1 g of activated carbon with an electronic balance (model: FA224C, accuracy: 0.001 g), and put it in a blast drying oven (model: LDO-9240A, temperature fluctuates) to dry at 120 °C for 30 min. When the activated carbon cooled down to room temperature in the oven, it was then put in a constant-temperature–humidity cabinet at preset temperature and humidity conditions. The activated carbon was weighed every ten minutes, and then it was immediately returned to the constant-temperature–humidity cabinet. During this process, it is necessary to avoid temperature and humidity fluctuations in the room caused by the door opening when entering or leaving the room. The experiment tested the weight-gaining changes of the activated carbon in an hour. When the difference between two groups of measured values is less than 2%, the adsorption capacity of activated carbon is considered to be saturated, thus calculating the dynamic change of water vapor adsorption capacity per unit mass. The adsorption capacity m per unit mass of activated carbon can be denoted as (4):
m = mt − m0
where m is the adsorption capacity of activated carbon per unit mass, m0 reflects initial mass of activated carbon measured by g, and mt represents mass weighed within test time t, measured by g.
The experiment process was repeated three times to avoid data randomness.

4. Results and Discussion

4.1. BET

As shown in Figure 1, all activated carbon samples show the pattern of Type II adsorption isotherm, also known as the inverse S adsorption isotherm. This illustrates that the adsorption in the samples affiliates to multi-molecular layer adsorption on the surface of a non-porous solid. When P/P0 < 0.03, the adsorption capacity of activated carbon for nitrogen increases rapidly. When P/P0 ranges between 0.03 and 0.8, the first half of the isotherm climbs slowly as the mesoporous adsorption plays a dominant role. Followed by an upward convex shape, the adsorption of the first layer is roughly completed, indicating the saturated adsorption capacity of the monolayer. When P/P0 > 0.8, the second layer of adsorption begins growing, and the isotherm exhibits an upward convex to form a steep slope. Under an increasing relative pressure, the adsorption capacity grows dramatically due to the capillary condensation of the adsorbate, while the adsorption isotherm in the second half tilts upwards rapidly. When P/P0 approaches the saturated vapor pressure, the adsorption saturation is not yet reached. As shown in Figure 2, the adsorption capacity of activated carbon for nitrogen follows the order of 0.0006 mol/cm3 oxalic acid modification > 0.0009 mol/cm3 oxalic acid modification > 0.0012 mol/cm3 oxalic acid modification > 0.0003 mol/cm3 oxalic acid modification > unmodified, indicating that the increase in mesopores enhances the adsorption capacity of activated carbon. With the increase in pores after modification, the order of specific surface area is consistent with the adsorption capacity. The larger the specific surface area, the greater the adsorption capacity.
In Figure 3, most of the pores in the activated carbon are mesopores with a width less than 5 nm, mainly 3.5 nm. After oxidation, the mesopores developed greatly, and the pore size ranged from 10 nm to 70 nm.
The specific surface area and cumulative pore volume of activated carbon modified by acid with different concentrations are shown in Figure 4. The specific surface area of untreated activated carbon is 134 m2/g, and the pore volume and pore size are 0.18406 cm3/g and 5.46 nm, respectively. As oxalic acid concentration increases, the specific surface area and pore volume grow and the pore size shrinks. When the oxalic acid concentration is at 0.0006 mol/cm3, the specific surface area reaches the maximum of 179.06 m2/g, 25.7% higher than that of unmodified honeycomb activated carbon. The pore volume increases by 9.09% to the maximum value of 0.20088 cm3/g. The average pore size of mesopores increases by 15.56% to 6.86 nm. Since the impurities, ashes, and excessive binders on the surface of activated carbon cannot be eliminated at low impregnation concentrations, the surface structure of activated carbon may have been destroyed irreversibly with the extremely high concentration of the impregnation solution, leading to the collapse of internal pores and the decrease in specific surface area, pore volume, and average mesoporous pore size.

4.2. SEM

Figure 5a–c shows SEM images of the unmodified activated carbon at 100 μm, 20 μm, and 1 μm, while images a′, b′, and c′ correspond to 0.0006 mol/cm3 oxalic acid modification at magnifications of 100 μm, 20 μm, and 1 μm SEM images of the activated carbon. It can be seen from the figure that the surface of the sample before modification is smooth and the number of surface mesopores is small. Upon oxalic acid modification, the micro-morphology of the activated carbon surface changes significantly, resulting in uneven, rough, porous, irregular pore shape and pore distribution, etc. These changes improve the specific surface area and pore structure, which is more conducive to the absorption of polar substances, such as water vapor, by activated carbon.

4.3. FT-IR

The FT-IR spectra of honeycomb activated carbon before and after modification are shown in Figure 6. For the original activated carbon, a wide absorption peak appears at 3427 cm−1 on the IR spectra due to the contracting vibrations of O-H in the phenolic hydroxyl and carboxyl functional groups. The absorption peak at the wave number 1055 cm−1 is presented by the stretching vibrations of -C-O-C in the alcohol hydroxyl group. The carbonyl absorption peak of the unmodified activated carbon appeared at 1447 cm−1 due to the asymmetric stretching vibration of the C=O bond in the carboxyl group. The peak at 480 480 cm−1 may be caused by the stretching vibrations of the metal–oxygen compound [20,21].
Compared with unmodified activated carbons, the activated carbon modified by 0.0006 mol/cm3 oxalic acid and by 0.0006 mol/cm3 oxalic acid and ester hydrolysis not only show absorption peaks at around 1055 cm−1, but also reach new absorption peaks at 1622 cm−1 and 1320 cm−1 as a result of the vibration of -C=O and -C-H, respectively. This indicates that some chemicals containing such functional groups were successfully introduced into the surface of the activated carbons. The modified C-O bond of the lactone group (C-O-C) will break, resulting in an increase in oxidizing groups on the surface of the activated carbon [6].
Compared with the unmodified honeycomb activated carbon, the honeycomb activated carbon after ester hydrolysis has a higher absorption peak intensity at 3200~3700 cm−1, indicating that the carboxyl functional groups on the surface of the honeycomb activated carbon modified by ester hydrolysis increase with the apparent stretching vibrations in the O-H bond. The endolipid group at 1320 cm−1 is derived from the carboxyl group, which can greatly enhance its adsorption capacity [22,23]. The peak intensity of the stretching vibrations of the modified C-O bond at 1055 cm−1 is stronger. At 3434 cm−1, 1622 cm−1, and 1055 cm−1, the intensity of the absorption peak on the two kinds of modified honeycomb activated carbon is significantly higher than that of the original activated carbon. This means that the hydroxyl contained by the modified honeycomb activated carbon is higher than that of the original activated carbon.
Spectral analysis shows that the modification of oxalic acid may cause the oxygen-containing functional groups on the surface to increase drastically, and so would the content of the acidic oxygen-containing functional groups (such as the ester group, carbonyl group, and carboxyl group) [13]. Moreover, oxalic acid surface oxidation modifies the functional groups on activated carbon, increases the abundance of oxyacid functional groups, and enhances its polarity and hydrophilicity. In general, the surface modification method for the purpose of increasing surface acidity must be targeted at increasing the carboxylic acid content [2].

4.4. Boehm Titration

Based on the titration calculation, Table 1 and Table 2 show the changes to the functional groups on the surface of the honeycomb activated carbon before and after modification.
In comparison, the total number of oxygen-containing functional groups on the surface of 0.0006 mol/cm3 oxalic acid-modified honeycomb activated carbon increases from 0.497 mmol/g to 0.7914 mmol/g, which is about 1.6 times higher than that of the unmodified carbon. The total number of oxygen-containing functional groups on the surface of 0.0006 mol/cm3 oxalic acid-modified and ester-hydrolyzed honeycomb activated carbon grows to 1.4377 mmol/g, which is about 2.9 times higher than that of the unmodified carbon. From the micro perspective, the acidity of the activated carbon surface increases with the growing accumulative acidic oxygen-containing functional groups, further improving the water vapor adsorption capacity of the activated carbon [24,25].
The combination of strong hydrophilic groups, such as hydroxyl and carboxyl groups, forms hydrogen bonds in newly introduced molecules with water molecules [26]. Facilitated by this, oxalic acid modification and ester hydrolysis change the types and quantities of functional groups on the surface of activated carbon, and optimize the physical and chemical properties of activated carbon, which improves the adsorption performance of activated carbon. The carboxyl group has significant polarity. There are two dipoles; the dipole moment of the hydroxyl group is greater than that of water, and the polarity of the carbonyl group is close to that of water because of the formation of a carbon–oxygen double bond. A carboxyl group can form two hydrogen bonds with a water molecule (double bond oxygen and hydrogen in water, oxygen in water and hydroxyl hydrogen of the carboxyl group), thus obviously improving the adsorption capacity for polar substances, such as water vapor [27,28].

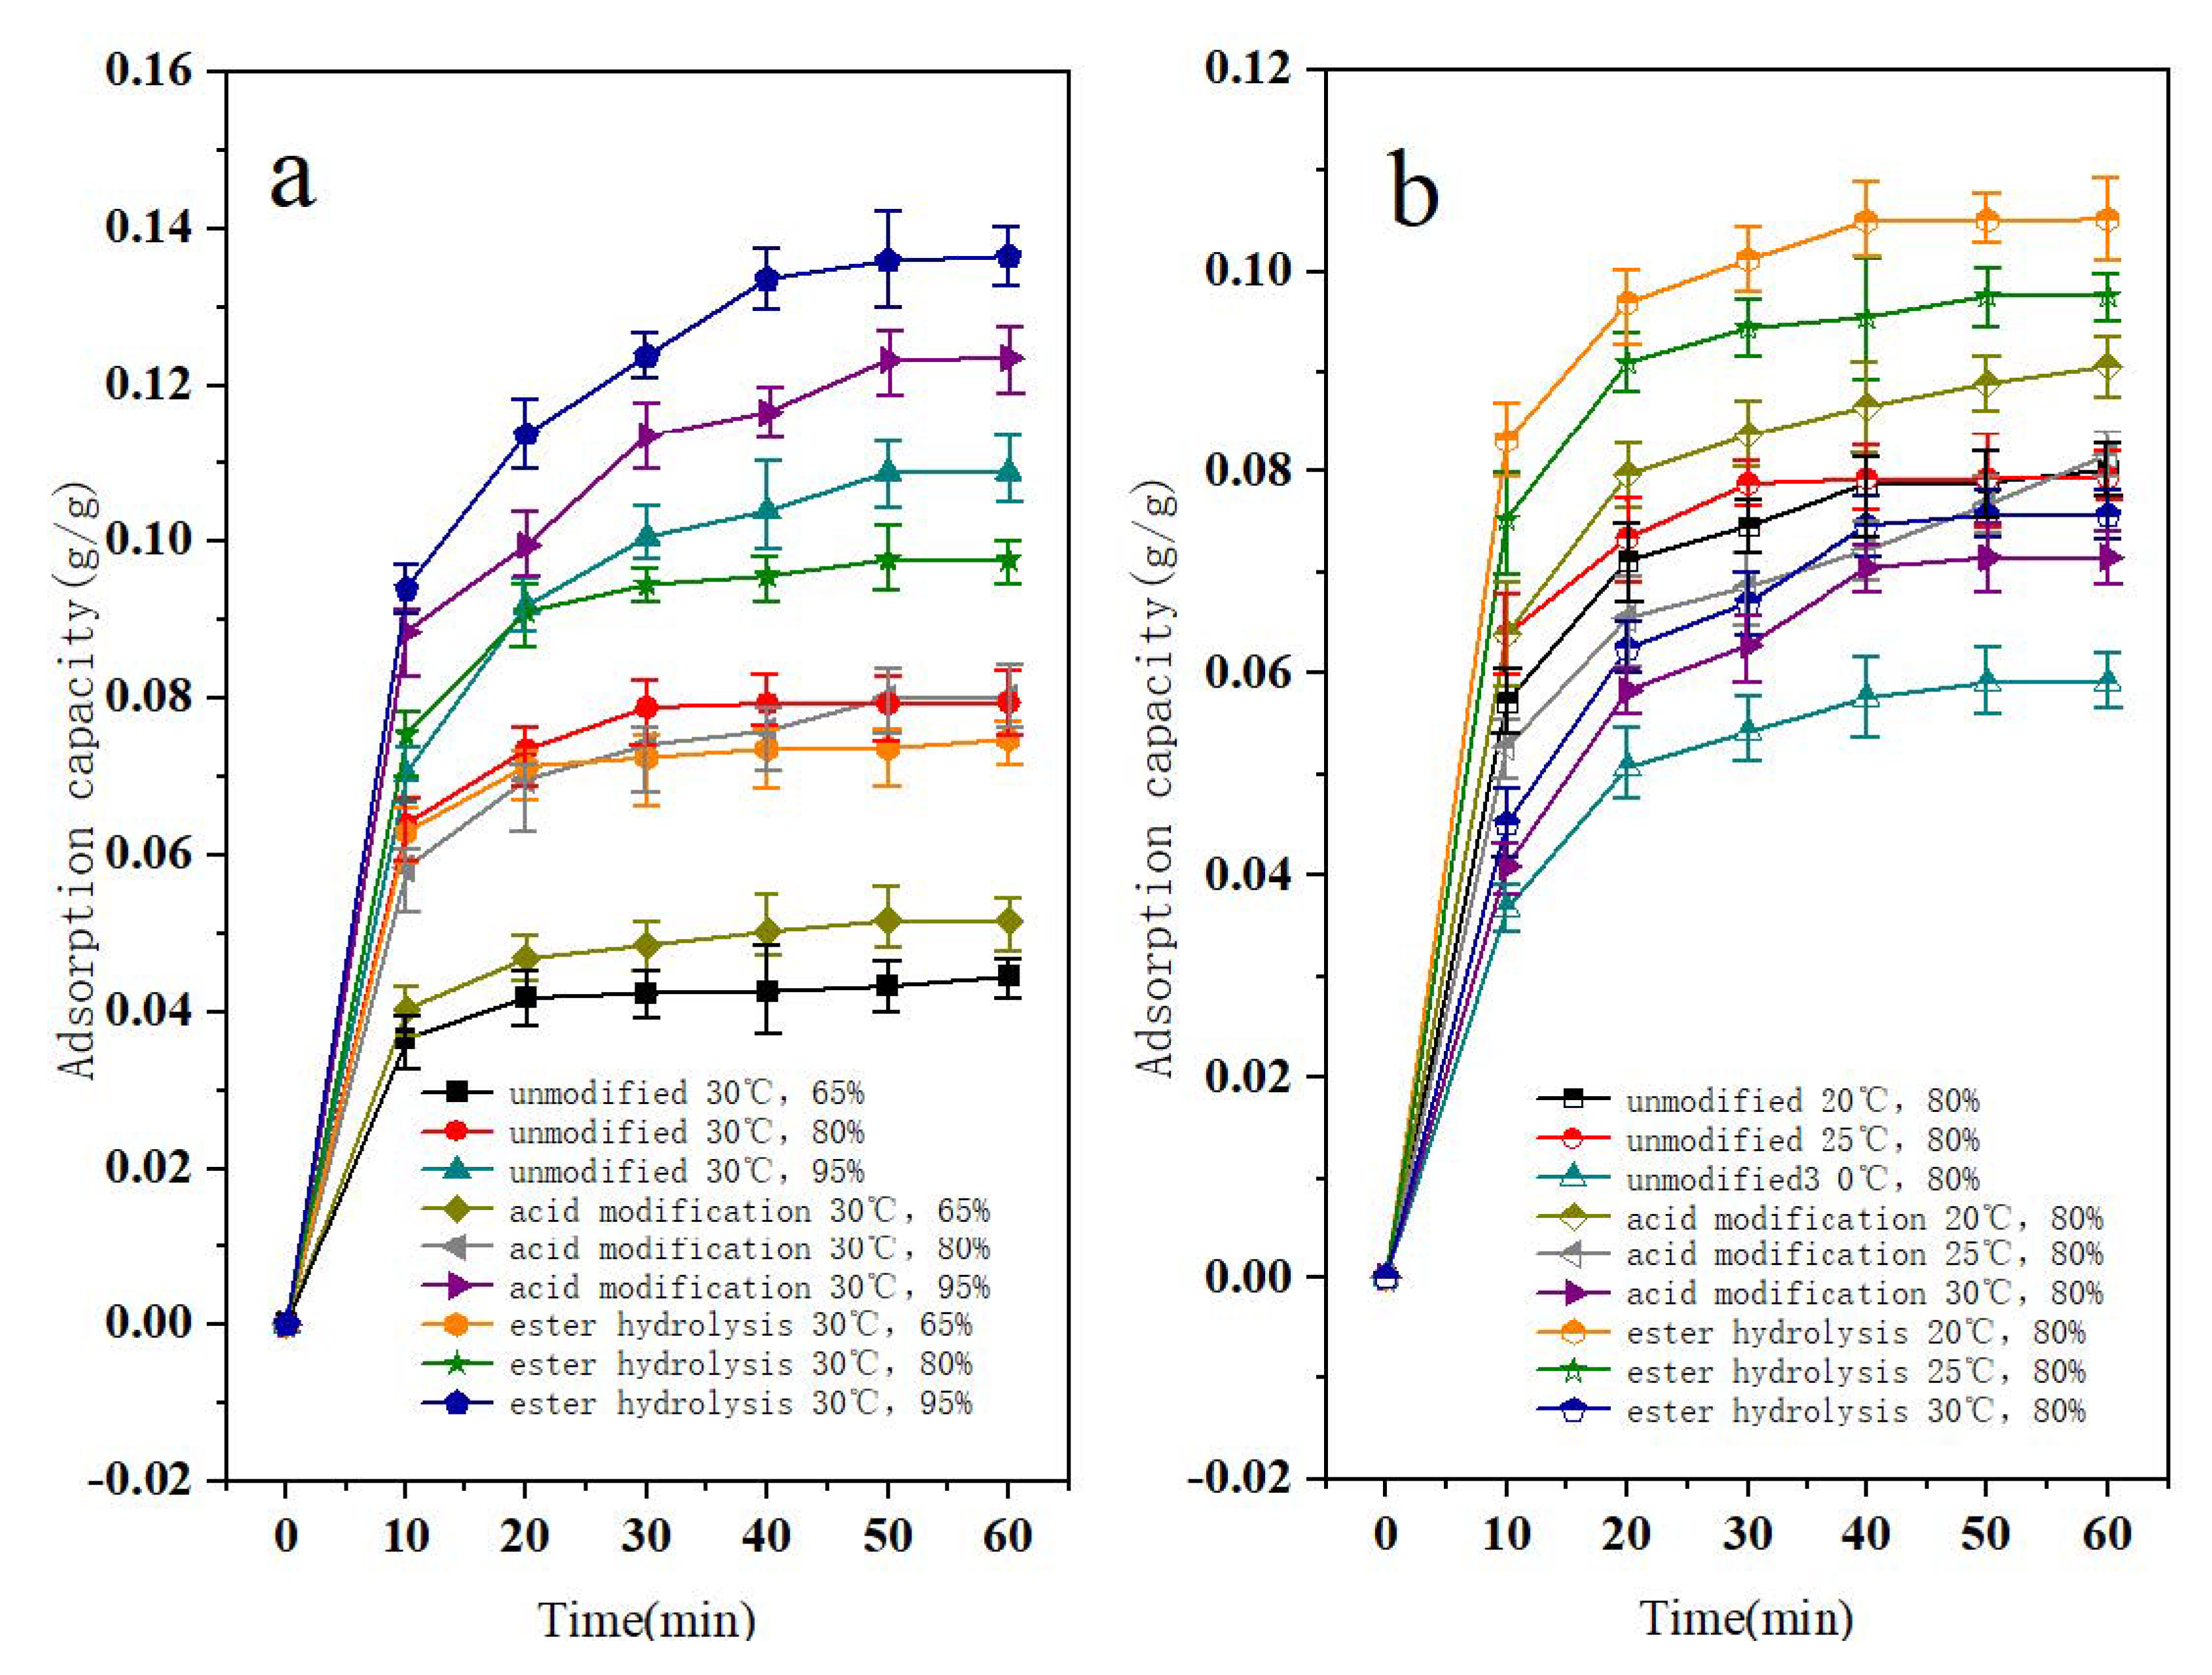
4.5. Data Analysis of Adsorption Performance of Modified Activated Carbon for Water Vapor

Given the same temperature and humidity (30 °C, 80%), Figure 7 illustrates the static adsorption curves of activated carbon under different modification methods. In the first 10 min, the adsorption rate of activated carbon is obviously faster and the weight rises. Then, 30 min later, the adsorption capacity is close to saturation with a slowed rising speed. As shown in Figure 7a, the cumulative adsorption capacity of unmodified activated carbon reaches 0.07 g/g. The 0.0006 mol/cm3 oxalic acid-modified activated carbon exhibits a higher adsorption rate and a larger cumulative adsorption capacity of 0.081 g/g than that of unmodified and other modified activated carbon with varied acid concentrations. When comparing with the unmodified activated carbon, the adsorption capacity increased by 15.7%. The adsorption capacity of 0.0003 mol/cm3 oxalic acid-modified activated carbon is slightly higher than that of unmodified activated carbon, while the concentrations of 0.0009 mol/cm3, 0.0012 mol/cm3, and 0.0018 mol/cm3 oxalic acid-modified activated carbon were lower than that of the unmodified activated carbon in turn. The static adsorption results are similar to that of the specific surface area changes of activated carbon, which further illustrates an increasing specific surface area due to oxalic acid modification and the pore volume of honeycomb activated carbon. It is a useful means to improve the adsorption capacity of activated carbon [29].
Figure 7b demonstrates the dynamic curves of water vapor adsorption after the ester hydrolysis of unmodified or activated carbon modified with acid of different concentrations. The adsorption capacity of activated carbon is modified by 0.0006 mol/cm3 oxalic acid, so the ester hydrolysis changes significantly. In addition, the max adsorption capacity can reach 0.096 g/g, representing an increase of 37.1% compared with that of unmodified activated carbon. This illustrates that functional groups introduced after hydrolysis further improve the adsorption performance of activated carbon.
As shown in Figure 7a,b, the standard deviation of both figures is less than 1%, and the error of the experimental results is small.
The moisture absorption contrast experiments analyzed the water vapor adsorption properties of activated carbon that was unmodified, 0.0006 mol/cm3 oxalic acid modified, 0.0006 mol/cm3 oxalic acid modified, and ester hydrolyzed under different humidity or temperature conditions. As shown in Figure 8a, at the same temperature, the adsorption rate of activated carbon improves as the relative humidity increases in the space and the adsorption level grows higher. For activated carbon that is 0.0006 mol/cm3 oxalic acid modified and ester hydrolyzed, the cumulative adsorption capacity increases by 0.025 g/g for every 15% increase in relative humidity at a temperature of 30 °C. The max adsorption capacity per hour can reach 0.14 g/g when the relative humidity reaches 95%.
As shown in Figure 8b, under the same relative humidity, both the adsorption capacity and the adsorption rate of activated carbon decreases as the space temperature increases, accelerating the moisture absorption rate. For 0.0006 mol/cm3 oxalic acid-modified and ester-hydrolyzed activated carbon under 80% relative humidity, the cumulative adsorption capacity decreases by 0.02 g/g for every 5 °C increase in the temperature. Based on the theory of gas adsorption, the thermal movement of water vapor molecules accelerates as the temperature rises, generating sufficient kinetic energy to overcome the potential barrier of the gravitational field on the surface of activated carbon, and this separates the adsorbed water vapor from the activated carbon to recover to the gas phase.
When the relative pressure of water vapor is low, the many hydrophilic functional groups distributed on the surface of activated carbon play a leading role by connecting with water molecules with hydrogen bonds. As the relative pressure rises, the water molecules subsequently entering the activated carbon are adsorbed on the previously adsorbed water molecules in a sequence to form water molecular clusters. Following this, the water clusters break down and start filling pores when they grow to a certain size.
Tiny water molecules in the micropores of activated carbon first leave the activated carbon with an increasing temperature, and those gathered in the upper part of the cluster are resolved and desorbed after being heated. Finally, water molecules linked to hydrophilic groups by hydrogen bonds leave the activated carbon continuously due to the breakage of hydrogen bonds after heating. This shows that water molecules connected with hydrophilic functional groups through hydrogen bonds have better thermal stability than those of water molecules filled in micropores [30].
According to the results of the water vapor adsorption experiments, Fourier transform infrared spectroscopy, and Boehm titration, the adsorption properties of honeycomb activated carbon are closely correlated to the types and quantities of the oxygen-containing functional groups on its surface. When the honeycomb activated carbon is modified by 0.0006 mol/cm3 oxalic acid and ester hydrolysis, the content of the oxygen-containing functional groups on the surface of the carbon rises, thus improving the water vapor adsorption performance of honeycomb activated carbon.
As shown in the Figure 8a,b, the standard deviation of both figures is less than 5%, and the error of the experimental results is small. Both are within the acceptable range.

5. Conclusions

The modification of honeycomb activated carbon makes the types of oxygen-containing functional groups on the surface more abundant, which plays a vital role in the water vapor adsorption performance of honeycomb activated carbon. As the oxalic acid concentration increases, the specific surface area rises before it then decreases. When the concentration of oxalic acid is 0.6 mol/L, the specific surface area of modified activated carbon is 20% higher than that of unmodified activated carbon. The results of FT-IR and the Boehm titration showed that the hydrolysis with ethyl acetate led to more abundant original functional groups and a higher number of total acidic functional groups on the surface. In addition, the hydrophilicity of the activated carbon was optimized.
The more oxygen-containing functional groups were on the surface of the honeycomb activated carbon, the better the performance of the water vapor adsorption of honeycomb activated carbon was. When the concentration of oxalic acid was 0.0006 mol/cm3, the specific surface area reached the maximum of 179.06 m2/g, an increase of 20% compared with that of the unmodified activated carbon. After hydrolysis with ethyl acetate, the abundance of the original functional groups increased, and the number of the total acidic functional groups on the surface grew from 0.497 mmol/g to 1.437 mmol/g. The static water vapor adsorption experiments of the modified activated carbon were performed with 60–90% relative humidity at 20 °C–30.5 °C. Compared with unmodified activated carbon, the water vapor adsorption capacity of activated carbon after 0.0006 mol/cm3 oxalic acid modification reached 0.7914 g/g and increased by 15.7%. The adsorption capacity of activated carbon after 0.0006 mol/cm3 oxalic acid combined with ester hydrolysis modification reached 1.4377 g/g, increasing by 37.1%. At the same temperature, the adsorption capacity increased with the increase in relative humidity. When the temperature was 30 °C, the adsorption capacity increased by 0.025 g/g for every 15% increase in relative humidity. At the same relative humidity, the adsorption capacity decreased with the increase in temperature. When the relative humidity was 80%, the adsorption capacity decreased by 0.02 g/g for every 5 °C increase in temperature.
Activated carbon is a widely used adsorbent in environmental treatment. With the development of activated carbon modification technology, activated carbon can be modified according to the characteristics of the pollutants to be treated, playing a more targeted role in environment cleaning. At the same time, efforts to explore optimized modification methods, enhance the hygroscopic ability of activated carbon through modification, and remove the adsorption heat of activated carbon in time will promote the application of activated carbon to dehumidification.

Author Contributions

J.X., H.Z. and Q.F.: writing original draft preparation, X.J. and Q.L.: review and editing. All authors have read and agreed to the published version of the manuscript.

Funding

This research received no external funding.

Institutional Review Board Statement

Not applicable.

Informed Consent Statement

Not applicable.

Data Availability Statement

The data used to support the findings of this study are available from the corresponding author upon request.

Acknowledgments

Thanks to all authors and editors.

Conflicts of Interest

The authors declare no competing financial interests.

References

  1. Macías-García, A.; Díaz-Díez, M.A.; Cuerda-Correa, E.M.; Olivares-Marín, M.; Gañan-Gómez, J. Study of the pore size distribution and fractal dimension of HNO3-treated activated carbons. Appl. Surf. Sci. 2006, 252, 5972–5975. [Google Scholar] [CrossRef]
  2. Pego, M.; Carvalho, J.; Guedes, D. Surface Modifications of Activated Carbon and Its Impact on Application. Surf. Rev. Lett. 2019, 26, 1830006. [Google Scholar] [CrossRef]
  3. Wang, X.; Cheng, H.; Ye, G.; Fan, J.; Yao, F.; Wang, Y.; Jiao, Y.; Zhu, W.; Huang, H.; Ye, D. Key factors and primary modification methods of activated carbon and their application in adsorption of carbon-based gases: A review. Chemosphere 2022, 287 Pt 2, 131995. [Google Scholar] [CrossRef]
  4. Lesaoana, M.; Mlaba, R.P.V.; Mtunzi, F.M.; Klink, M.J.; Ejidike, P.; Pakade, V.E. Influence of inorganic acid modification on Cr(VI) adsorption performance and the physicochemical properties of activated carbon. S. Afr. J. Chem. Eng. 2019, 28, 8–18. [Google Scholar] [CrossRef]
  5. Yao, S.; Zhang, J.; Shen, D.; Xiao, R.; Gu, S.; Zhao, M.; Liang, J. Removal of Pb(II) from water by the activated carbon modified by nitric acid under microwave heating. J. Colloid Interface Sci. 2016, 463, 118–127. [Google Scholar] [CrossRef] [PubMed]
  6. Girgis, B.S.; Attia, A.A.; Fathy, N.A. Modification in adsorption characteristics of activated carbon produced by H3PO4 under flowing gases. Colloids Surf. A Physicochem. Eng. Asp. 2007, 299, 79–87. [Google Scholar] [CrossRef]
  7. Wang, H.; Sun, Y.; Zhu, T.; Wang, W.; Deng, H. Adsorption of acetaldehyde onto carbide-derived carbon modified by oxidation. Chem. Eng. J. 2015, 273, 580–587. [Google Scholar] [CrossRef]
  8. Lemus, J.; Martin-Martinez, M.; Palomar, J.; Gomez-Sainero, L.; Gilarranz, M.A.; Rodriguez, J.J. Removal of chlorinated organic volatile compounds by gas phase adsorption with activated carbon. Chem. Eng. J. 2012, 211–212, 246–254. [Google Scholar] [CrossRef] [Green Version]
  9. Kim, K.-J.; Ahn, H.-G. The adsorption and desorption characteristics of a binary component system of toluene and methylethylketone on activated carbon modified with phosphoric acid. Carbon 2010, 48, 2198–2202. [Google Scholar] [CrossRef]
  10. Zhang, Y.; Pan, Z.; Yang, J.; Chen, J.; Chen, K.; Yan, K.; Meng, X.; Zhang, X.; He, M. Study on the suppression mechanism of (NH4)2CO3 and SiC for polyethylene deflagration based on flame propagation and experimental analysis. Powder Technol. 2022, 399, 117193. [Google Scholar] [CrossRef]
  11. Xi, M.; Fu, X.; Yang, H.; He, C.; Fu, L.; Cheng, X.; Guo, J. Predicted a honeycomb metallic BiC and a direct semiconducting Bi2C monolayer as excellent CO2 adsorbents. Chin. Chem. Lett. 2021, 33, 2595–2599. [Google Scholar] [CrossRef]
  12. Bai, B.; Rao, D.; Chang, T.; Guo, Z. A nonlinear attachment-detachment model with adsorption hysteresis for suspension-colloidal transport in porous media. J. Hydrol. 2019, 578, 124080. [Google Scholar] [CrossRef]
  13. Michota, L.J.; Villieras, F. Surface area and porosity. Dev. Clay Sci. 2013, 5, 319–322. [Google Scholar]
  14. Bouraada, M.; Ouali, M.S.; de Ménorval, L.C. Dodecylsulfate and dodecybenzenesulfonate intercalated hydrotalcites as adsorbent materials for the removal of BBR acid dye from aqueous solutions. J. Saudi Chem. Soc. 2016, 20, 397–404. [Google Scholar] [CrossRef]
  15. Javadian, S.; Sadrpoor, S.M. Demulsification of water in oil emulsion by surface modified SiO2 nanoparticle. J. Pet. Sci. Eng. 2019, 184, 106547. [Google Scholar] [CrossRef]
  16. Yang, B.; Ruan, D.; Zhang, Y.; Wang, C.; Qiao, Z. Structural changes of activated carbon electrodes for EDLCs in the manufacturing process. Trans. Tianjin Univ. 2020, 26, 391–398. [Google Scholar] [CrossRef]
  17. Boehm, H.P. Some aspects of the surface chemistry of carbon blacks and other carbons. Carbon 1994, 32, 759–769. [Google Scholar] [CrossRef]
  18. Boehm, H.P. Chemical Identification of Surface Groups. Adv. Catal. 1996, 16, 179–274. [Google Scholar]
  19. Goertzen, S.L.; Thériault, K.D.; Oickle, A.M.; Tarasuk, A.C.; Andreas, H.A. Standardization of the Boehm titration. Part I. CO2 expulsion and endpoint determination. Carbon 2010, 48, 1252–1261. [Google Scholar] [CrossRef]
  20. Oickle, A.M.; Goertzen, S.L.; Hopper, K.R.; Abdalla, Y.O.; Andreas, H.A. Standardization of the Boehm titration: Part II. Method of agitation, effect of filtering and dilute titrant. Carbon 2010, 48, 3313–3322. [Google Scholar] [CrossRef]
  21. Schönherr, J.; Buchheim, J.; Scholz, P.; Adelhelm, P. Boehm Titration Revisited (Part I): Practical Aspects for Achieving a High Precision in Quantifying Oxygen-Containing Surface Groups on Carbon Materials. C 2018, 4, 21. [Google Scholar] [CrossRef] [Green Version]
  22. Bai, B.; Wang, Y.; Rao, D.; Bai, F. The effective thermal conductivity of unsaturated porous media deduced by pore-scale sph simulation. Front. Earth Sci. 2022, 10, 943853. [Google Scholar] [CrossRef]
  23. Wang, J.; Ai, K.; Lu, L. Flame-retardant porous hexagonal boron nitride for safe and effective radioactive iodine capture. J. Mater. Chem. A 2019, 7, 16850–16858. [Google Scholar] [CrossRef]
  24. Chiang, H.L.; Huang, C.P.; Chiang, P.C.; You, J.H. Effect of metal additives on the physico-chemical characteristics of activated carbon exemplified by benzene and acetic acid adsorption. Carbon 1999, 37, 1919–1928. [Google Scholar] [CrossRef]
  25. Debarr, J.A.; Lizzio, A.A.; Daley, M.A. Adsorption of SO2 on Bituminous Coal Char and Activated Carbon Fiber. Energy Fuels 1997, 11, 267–271. [Google Scholar] [CrossRef]
  26. Long, C.; Li, Y.; Yu, W.; Li, A. Adsorption characteristics of water vapor on the hypercrosslinked polymeric adsorbent. Chem. Eng. J. 2012, 180, 106–112. [Google Scholar] [CrossRef]
  27. Yl, A.; Lla, B.; Qwa, B.; Xra, B.; Ma, A. Highly selective separation of acetic acid and hydrochloric acid by alkylamide based on double hydrogen bond coupling mechanism. Sep. Purif. Technol. 2021, 275, 119110. [Google Scholar]
  28. Ma, J.; Yang, Y.; Li, X.; Sui, H.; He, L. Mechanisms on the stability and instability of water-in-oil emulsion stabilized by interfacially active asphaltenes: Role of hydrogen bonding reconstructing. Fuel 2021, 297, 120763. [Google Scholar] [CrossRef]
  29. Nebol’sin, V.A.; Galstyan, V.; Silinac, Y.E. Graphene oxide and its chemical nature: Multi-stage interactions between the oxygen and graphene. Surf. Interfaces 2020, 21, 100763. [Google Scholar] [CrossRef]
  30. Zhang, Z.G.; Ren, J.H.; Ju, M.C.; Chen, X.; Xu, J.M.; Wang, Z.; Meng, L.X.; Zhao, P.Y.; Wang, H. Construction of new alternative transmission sites by incorporating structure-defect metal-organic framework into sulfonated poly (arylene ether ketone sulfone)s. Int. J. Hydrogen Energy 2021, 46, 27193–27206. [Google Scholar] [CrossRef]
Figure 1. N2 adsorption−desorption curves of activated carbon under different modification conditions.
Processes 10 01527 g001
Figure 2. N2 adsorption curves of activated carbon under different modification conditions.
Processes 10 01527 g002
Figure 3. Pore size distributions of oxalic acid-modified activated carbons with different concentrations using the BJH method.
Processes 10 01527 g003
Figure 4. Schematic diagram of specific surface area and pore diameter of oxalic acid-modified activated carbon with different concentrations.
Processes 10 01527 g004
Figure 5. SEM comparison of unmodified activated carbon and 0.0006 mol/cm3 oxalic acid-modified activated carbon. (ac) shows SEM images of the unmodified activated carbon at 100 μm, 20 μm, and 1 μm, while images (a′), (b′), and (c′) correspond to 0.0006 mol/cm3 oxalic acid modification at magnifications of 100 μm, 20 μm, and 1 μm SEM images of the activated carbon.
Processes 10 01527 g005
Figure 6. Fourier transformation infrared spectroscopy under different modification conditions.
Processes 10 01527 g006
Figure 7. Static adsorption curves of activated carbon under the same temperature and humidity (30 °C, 80%) and different modification methods. (a) Water vapor static adsorption curve of different concentrations oxalic acid modified activated carbon at the same temperature and humidity. (b) Water vapor static adsorption curve of different concentrations oxalic acid + ester hydrolysis modified activated carbon at the same temperature and humidity.
Processes 10 01527 g007
Figure 8. Dynamic adsorption curves of activated carbon under (a) the same temperature and different humidity, and (b) the same humidity and different temperature.
Processes 10 01527 g008
Table 1. Boehm titration test values of functional groups before and after activated carbon modification.
Functional Group TypeCarboxyl
Functional Group
(mmol/g)
Lactone
Functional Group
(mmol/g)
Phenolic
Hydroxyl Functional Group (mmol/g)
Total Acidic
Oxygen-Containing Functional Group (mmol/g)
Modification Method
Unmodified0.15430.12450.21820.497
0.0006 mol/cm3 oxalic acid
modification
0.25620.21320.3220.7914
0.0006 mol/cm3 oxalic acid
modification and ester hydrolysis
0.43220.58420.42131.4377
Table 2. Boehm titration test ratio of functional groups before and after activated carbon modification.
Functional Group TypeCarboxyl Functional Group RatioLactone Group Functional Group RatioPhenol Hydroxyl Functional Group RatioRatio of Total Acidic
Oxygen-Containing Functional Groups
Modification Method
0.0006 mol/cm3 oxalic acid
modification/Unmodified
1.66041.71241.47571.5924
0.0006 mol/cm3 oxalic acid
modification and ester hydrolysis/Unmodified
2.80104.69241.93082.8928
0.0006 mol/cm3 oxalic acid
modification and ester hydrolysis/0.0006 mol/cm3 oxalic acid modification
1.68702.74021.30841.8167
Publisher’s Note: MDPI stays neutral with regard to jurisdictional claims in published maps and institutional affiliations.

