Article

Optimization of Water Injection Strategy before Re-Stimulation Considering Fractures Propagation

1
State Key Laboratory of Petroleum Resource and Prospecting, China University of Petroleum (Beijing), Beijing 102249, China
2
Research Institute of Petroleum Exploration and Development, China National Petroleum Corporation, Beijing 100083, China
3
Engineering Technology Research Institute, Xinjiang Oilfield Company, PetroChina, Karamay 834000, China
*
Author to whom correspondence should be addressed.
Processes 2022, 10(8), 1538; https://doi.org/10.3390/pr10081538
Submission received: 11 July 2022 / Revised: 2 August 2022 / Accepted: 4 August 2022 / Published: 5 August 2022

Abstract

:
Water injection before re-stimulation has a positive effect to mitigate the “frac hit” and increase oil production in tight reservoirs. However, the study of water injection strategy optimization has not been thoroughly investigated. Some conclusions can be found in the existing literature, but the pressure and stress distribution, fractures morphology and oil production were not considered as a whole workflow during the study. In addition, the different reservoir deficit was not considered. Although technical experience and economic benefit have been obtained in some field tests, failed cases still exist. To fill this gap, a series of numerical models are established based on a tight reservoir located in northwest China. Under the different re-stimulation timing, the pressure distribution, stress distribution, and fractures morphology after water injection of different injection/production ratios are calculated, respectively. The oil and water production are predicted. The results show that, after a short period of production with a small deficit, the degree of “frac hit” is slight. Injecting water has an obvious effect on increasing oil production for both parent and infill well. After a long period of production with a large deficit, the problem of “frac hit” is very severe. Injecting water has an obvious effect on increasing oil production only for the parent well. The production of infill well is influenced by the fractures’ interference and pressure increasing comprehensively. For the well group, measured by the final cumulative oil production, the optimal injection/production ratio is different, but the water injection volume is similar, which is about 15,000 m3.

1. Introduction

The hydraulic fracturing of horizontal wells is a necessary method in unconventional reservoirs to create production capacity, which faces the problems of rapid production decline and low recovery. Drilling infill well is becoming a standard operational practice to increase production in unconventional reservoirs including tight oil and shale. Estimations from literature suggest that 50% of the remaining potential area in major US basins could be stimulated by drilling infill wells [1]. Similarly, as the largest conglomerate reservoir in the world, Mahu Oilfield in northwest China needs to drill infill wells to increase oil production and enhance oil recovery for the large well spacing between parent wells put into operation earlier.
However, according to the research and practice results, new fractures of infill well tend to propagate into the low-stress zones caused by pressure depletion after a long productive time, which is also known as “frac hit” [2,3]. There are some other descriptions [4,5,6,7] including frac bushing, well interference, and fracture-driven interaction. Frac hit can be detrimental to both parent wells and infill wells. In earlier times, Fisher reported a case in which five vertical wells were killed because of the hydraulic fracturing of nearby wells in Barnett [8,9]. In recent years, frac hit has been widely reported and analyzed under the context of more drilled infill wells.
Courtier [10] reported an infill well in Wolfcamp which was monitored through microseismic recorders during hydraulic fracturing and the results indicate that fractures are asymmetric along the horizontal wellbore. The half-length close to the parent well is obviously larger than another. Cipolla [11] reported a horizontal well group including a parent well and two infill wells in Bakken, North Dakota. Asymmetric fractures of infill well were monitored, and a numerical simulation method was used to study the influence of pressure depletion to well interference and group production. Chittenden [12] reported a case of Delaware Basin in Texas, which included a parent well and two infill wells. After the parent well has been put into production, 900 ft away, an infill well was fractured and preferential growth of fractures to depleted zones happened. For another infill well, which is farther away, the parent well has symmetrical fractures along horizontal wellbore. In addition to these field reports, a numerical study of infill well hydraulic fractures propagation rules can be retrieved in the literature [13].
The cases mentioned above focus on the phenomenon of well interference, and further discussion of its damage [14,15] to production is well investigated and understood in recent years. Rainbolt [16] reported a horizontal well in Wolfcamp losing the production rate during the infill well fracturing. Joslin [17] reported a case in Montney for which production of an infill well is only a half of the parent well when the cluster number is obviously greater. It seems like infill well drilling is a risky operation, and the interaction relationship between parent and infill wells needs further study. The degree of influence depends on the characteristic parameters of hydraulic fractures and the matrix [18]. The greater the fracture conductivity, the greater the number of fractures and the smaller the matrix permeability, and the greater the damage to the parent wells. King [4] suggested that SRV reduction and flow path obstruction may be the reasons for reducing the production rate. Ratcliff [19] found that the conductivity damage parameters can replicate the productivity degradation. Fowler [20] described three damage processes including conductivity damage, skin damage, and water block damage. Wang [21] suggested that the existence of natural fractures can lead to frac hit. Many possible reasons including physical plug, mechanical, and chemical problems are also mentioned.
Therefore, many researchers propose to carry out repeated fracturing or water injection for parent wells, and the energy increasing effect of liquid on the formation will lead to the increase of formation pressure and horizontal principal stress in depleted zones, which can avoid or mitigate the problem of frac hit. In Montana and North Dakota, production of five parent wells has been improved by water injection [22], which indicates that well interference was mitigated effectively. Bommer [23] reported that frac hit was mitigated successfully by injecting water to parent wells in Bakken, North Dakota. Whitfield [24] reported a successful case of mitigating frac hit by injecting water. They thought that the injected water volumes can vary from the small pre-loads of 500–1000 bbls to the large rate of more than 18,000 bbls. Gala [25] reported another case, and the effects of different injecting fluids including water and gas are compared. Due to compressibility of gas, gas injection needs more time than water. As for the influence of water injection to the stress reorientation, Singh [26] simulated the stress distribution around the injectors. The results showed that the maximum stress trajectories tend to align along injection wells. Safari [27] suggested that water injection does not change the stress significantly. Guo [28] suggested that the appropriate cumulative water injection depends on the reservoir volume production. The results of numerical simulation of stress distribution and fractures propagation based on the field data in Eagle Ford showed that, when the injection/production ratio is greater than 76.9%, fractures of infill well are more symmetrical. The cumulative production corresponding to different fracture morphology is not considered. Li [29] studied the key factors on successful water injection. They mentioned that the injection pressure should be equal to the initial reservoir pressure. Lower injection pressure could not mitigate the frac hit effectively. Furthermore, the integrated models [30] considering fracture propagation and production prediction were established to optimize the type of energy increasing medium and the cumulative injection. In this study, fracture growth of the infill well was simulated; meanwhile, no fracture growth or widening are expected in the parent well. Other measures which can increase pressure and stress in the depleted zones have the similar effects, for instance, re-fracturing [17,31] and surface shut-in [32]. In recent years, some new types of fluid medium [33,34,35,36,37] are introduced. The geomechanical controls [38] and increased offset spacing [39] are also mentioned. For the conglomerate reservoir in Mahu Oilfield, which is our main concern, it is necessary not only to drill infill wells, but to carry out re-fracturing of the parent well. The horizontal wells of Mahu conglomerate reservoir have high output in the initial stage after primary fracturing, but daily production decreases rapidly. It is necessary not only to ensure that the infill wells are unaffected, but also to reactivate the productivity of the parent well. It is worth noting that, before re-fracturing the parent wells, some protective measures should be conducted. After a long period of production, stress distribution around the parent wells is uneven. The directions of new fractures created by re-refracturing are not vertical to the horizontal wellbore, which will have a negative effect on increasing production. Injecting water to parent wells before re-fracturing is proposed to increase reservoir energy, control the new fractures direction, and reduce the negative fractures as well as well interference. At the same time, the water injected into the formation can replace the crude oil if the formation has strong water absorption. Some oil companies have conducted a field test of injecting water to the parent wells before re-fracturing. There were some successful cases in tight oil reservoirs located in northwest China [40,41]. The strategy of water injection before re-fracturing including total water injection, water injection rate, soaking time, and injection timing has been optimized [42], but fracture propagation was not considered.
In this paper, we propose a new re-stimulation measure of water injection before re-fracturing parent as well as drilling and fracturing infill well in the Mahu conglomerate reservoir. Based on an unconventional fractures model (UFM), the fractures morphology of parent well and infill well is simulated. The stress distribution before re-stimulation was calculated by single way coupling. The cumulative water injection volume was optimized based on the predicted cumulative oil production under different conditions.

2. Methods

The new re-stimulation measure consists of water injection before re-fracturing parent well as well as drilling and fracturing infill well. As shown in Figure 1, there are two wells at a certain distance in the model, and an ideal parent well will be put into production for a period and form a depleted zone around the parent well. The water will be injected into the parent well, increasing formation pressure and horizontal principal stress. Re-stimulation measures of re-fracturing parent well and fracturing infill well will be conducted simultaneously to avoid fractures interference. It should be noted that new fractures of the parent well are created during re-fracturing, and perforations are located in the center between existing primary fractures. Parent well and infill well will be put into production at the same time. Based on the cumulative oil production after re-stimulation, the cumulative water injection volume will be optimized under different conditions.

2.1. Model Description

A series of numerical models are established. To avoid boundary effects, a model with a size of 5 km × 3 km is established based on parameters of the Mahu conglomerate reservoir. The whole reservoir model consists of five layers with the total thickness of 200 m. The oil-bearing bed is in the center, with the thickness of 40 m, and the parameters are as shown in Table 1. The perforation is in the oil layer. The horizontal section length of ideal parent well is 1000 m. The primary fracturing of the parent well consists of eight stages with three clusters per stage. As mentioned earlier, new perforations are located in the center between primary fractures; therefore, the number of re-fracture clusters are the same as the primary. Hydraulic fractures of infill well and re-fractures of parent well are distributed as zipper-type.
Fractures propagation is simulated by the Unconventional Fractures Model [43]. It proposed a fully coupled solution of fracture propagation, rock deformation, and fluid flow simulation. UFM has a similar assumption and governing equations to a conventional pseudo-3D model but solves the equations for the complex fractures. The complex fractures are divided into a lot of connected elements with different heights which are constructed in a similar way to those in the pseudo-3D fracture model. Natural fractures are not very developed in the Mahu reservoir, and they are not considered in this study.
Considering the flow in fractures as laminar flow in a flat plate, the Poiseuille law is used to express the flow of the power law fluid [44]:
p s = α 0 1 w ¯ 2 n q H f l q H f l n 1
α 0 = 2 k n n 4 n + 2 n n
n = 1 H f l w z w ¯ 2 n + 1 n d z
where p is fluid pressure, Pa; s is the distance along the fracture, m; w ¯ is the average fracture width, m; n is fluid power-law index; q is the local flow rate in the fracture, m3/s; H f l is the height of the fluid in the fracture, m; k is the fluid consistency index; w z is fracture width as a function of depth z, m; z is the depth, m.
The material balance condition is given by the continuity equation:
p s + H f l w ¯ t + 2 h L C L t τ 0 s = 0 , t > τ 0 s
The following condition should be met:
0 t Q t d t = 0 L t H w ¯ d s + 0 L t 0 t 2 h L C L t τ 0 s d t d s
The sum of flow rate into all open perforations should be equal to injection rate:
q i t = Q t ,   i = 1 , ,   N p e r f
where t is injecting time, s; h L is the leakoff zone height, m; C L is the total leakoff coefficient, m/s0.5; τ 0 s is the time when each fracture element is first exposed to fluid, s; Q t is the total injection rate, m3/s; L t is the total fracture length at time t , m; H is the fracture height, m; q i is the injection rate into each cluster, m3/s; N p e r f is the number of clusters.
As mentioned earlier, the fractures are divided into a series of connected elements with different heights which are constructed in a similar way to the pseudo-3D fracture model. The 2D plane–strain solution for fracture width in pseudo-3D models is adopted. In a vertical fracture, the width profile can be determined by following equations:
w z = 4 E p c p σ n + ρ f g h c p H 4 + 2 π h i = 1 n 1 σ i + 1 σ i H 2 arccos H 2 H i H + z H z
where E is the Young’s Modules, Pa; p c p is the pressure at perforation depth h c p , Pa; σ n and σ i are the minimum horizontal principal stress at the section and ith layer, Pa; ρ f is the fluid density, kg/m3; H i is the fracture height of i t h layer, m.
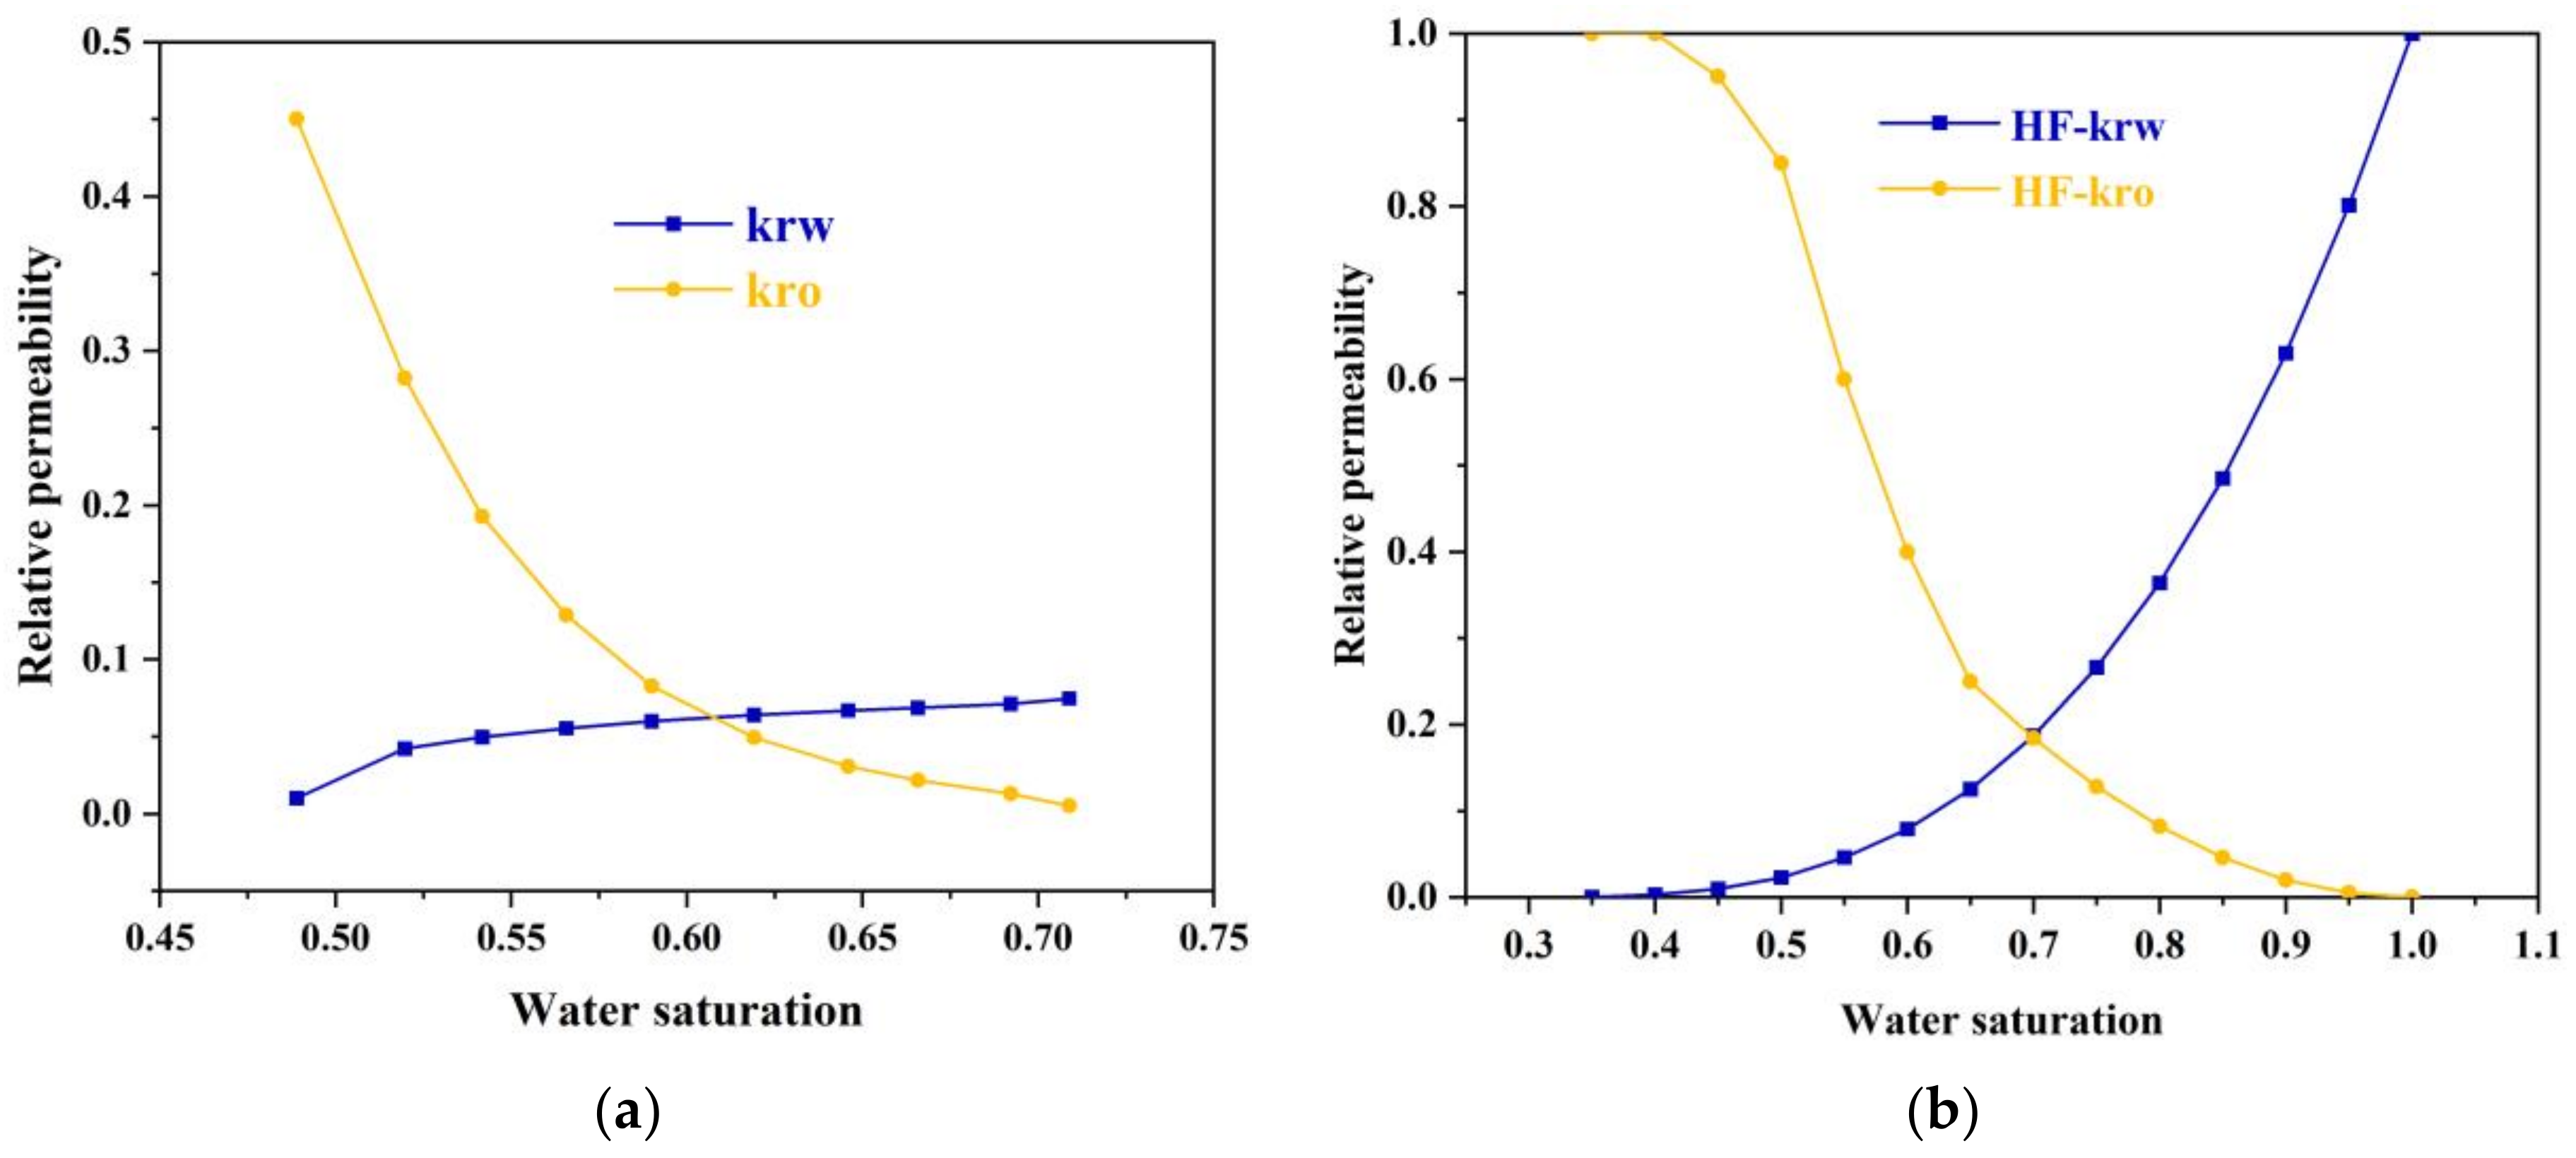
Based on the fractures morphology, the unstructured grid was generated automatically to establish a numerical model. To avoid the problem of differences between fracture width and matrix grid size, a single-porosity medium is used. Mesh refinement was applicated around the hydraulic fractures. The water-oil two-phase model was used since the bottom flow pressure is always greater than bubble-point. Relative permeability curves of matrix and fracture are shown in Figure 2.
After a period of production, a one-way coupled method is used to calculate the stress distribution. Generally, there are three coupling methods [45] including a fully coupled method [46,47], iterative coupled method [48,49], and a one-way coupled method [50,51,52]. In a one-way coupled model, the fluid flow equations are generally solved using a reservoir simulator, the results of pressure, temperature, and saturation are passed to the geomechanical simulator, but no results from the geomechanical simulator are used in the reservoir simulator. A one-way coupled method has the advantage of high computational efficiency, but the disadvantage of low accuracy relatively. However, our main concern is the water injection, and the commercial one-way coupled simulator (Visage [45]) is used in this study.

2.2. History Match

In order to confirm the reliability of the models we established, a production history match has been completed. The production history data are from a horizontal well in Mahu Oilfield. The well was drilled in 2013, and the primary fracturing was conducted then with 12 stages. It is a flowing well with an oil production rate of 35 m3/d during the initial stage. With production, formation energy and bottom flow pressure decreased, and the well was transformed into pumping after about 1000 days. Daily oil production and wellhead pressure were recorded precisely by a ground monitor. Wellhead pressure should be converted into bottom flow pressure by calculating liquid column pressure. Since the calculation of bottom flow pressure after the well started pumped involves more factors, only the production history of flowing period has been matched.
The control mode of bottom flow pressure was used in conjunction with field historical data to form well constraints. As shown in Figure 3, a simulated oil production rate is essentially in agreement with the data monitored, which confirms the reliability of the model. Based on the model after history match, the next work is to build the ideal wells as mentioned before.

3. Results and Discussion

Well A1 is a parent well fractured primarily earlier, then put into production with the daily oil production rate of 50 m3/d and the bottom hole pressure of 15 MPa. Well A2 is an infill well fractured primarily after that well A1 has been re-stimulated by injecting water and re-fracturing. The parent-infill well spacing is 250 m. To study the influence of re-stimulation timing on the optimized cumulative water injection volume, cumulative oil production of parent well and infill well are predicted separately after the parent well has been opening for 1 year and 4 years.

3.1. 1st Year

As shown in Figure 4, after the parent well has been put into production for one year with the final cumulative oil production of 18,068 m3 and water production of 6826 m3, reservoir pressure decreases to 25.8 MPa and minimal horizontal principal stress decreases to 41.2 MPa near fractures. In the middle zone between two fractures, pressure also decreases, but only slightly to 37.5 MPa. Accordingly, the decline range of minimal horizontal principal stress is also small. There is a deficit of 24,894 m3 in the total. The ratios of water injection to production are set to 0.2, 0.4, 0.6, 0.8, 1.0, and 1.2. The corresponding cumulative water injections are 4978.8 m3, 9957.6 m3, 14,936.4 m3, 19,915.2 m3, 24,894 m3, and 29,872.8 m3, respectively. According to earlier finds [42], long soaking time after water injection has a positive effect on increasing production. In this study, the soaking time is two months to ensure that pressure spreads more uniformly.
Pressure distribution corresponding to different injection/production ratios is shown in Supplementary Materials (Figure S1). With the increasing of injection/production ratio, reservoir pressure near the fractures increases gradually. The high-pressure areas are concentrated near fractures. Like the situation before water injection shown in Figure 4, in the middle zone between two primary fractures, reservoir pressure changes sightly compared to the initial pressure. It should be noted that reservoir pressure near the wellbore of A2 is unchanged.
Based on the pressure distribution, the stress distribution is calculated by a one-way coupled model. Minimal horizontal principal stress distribution corresponding to different injection/production ratios is shown in Supplementary Materials (Figure S2). With the increasing of the injection/production ratio, a minimal horizontal principal stress around wellbore increases gradually. However, the difference of stress distribution among these situations is slight. The minimum horizontal principal stress around wellbore is about 42.4 MPa while the injection/production is 0.2. The stress value in a few areas is slightly greater than the initial value if the ratio is greater than 1.0. As the short production time and small reservoir deficit, the problem of “frac hit” caused by reservoir depletion is slight.
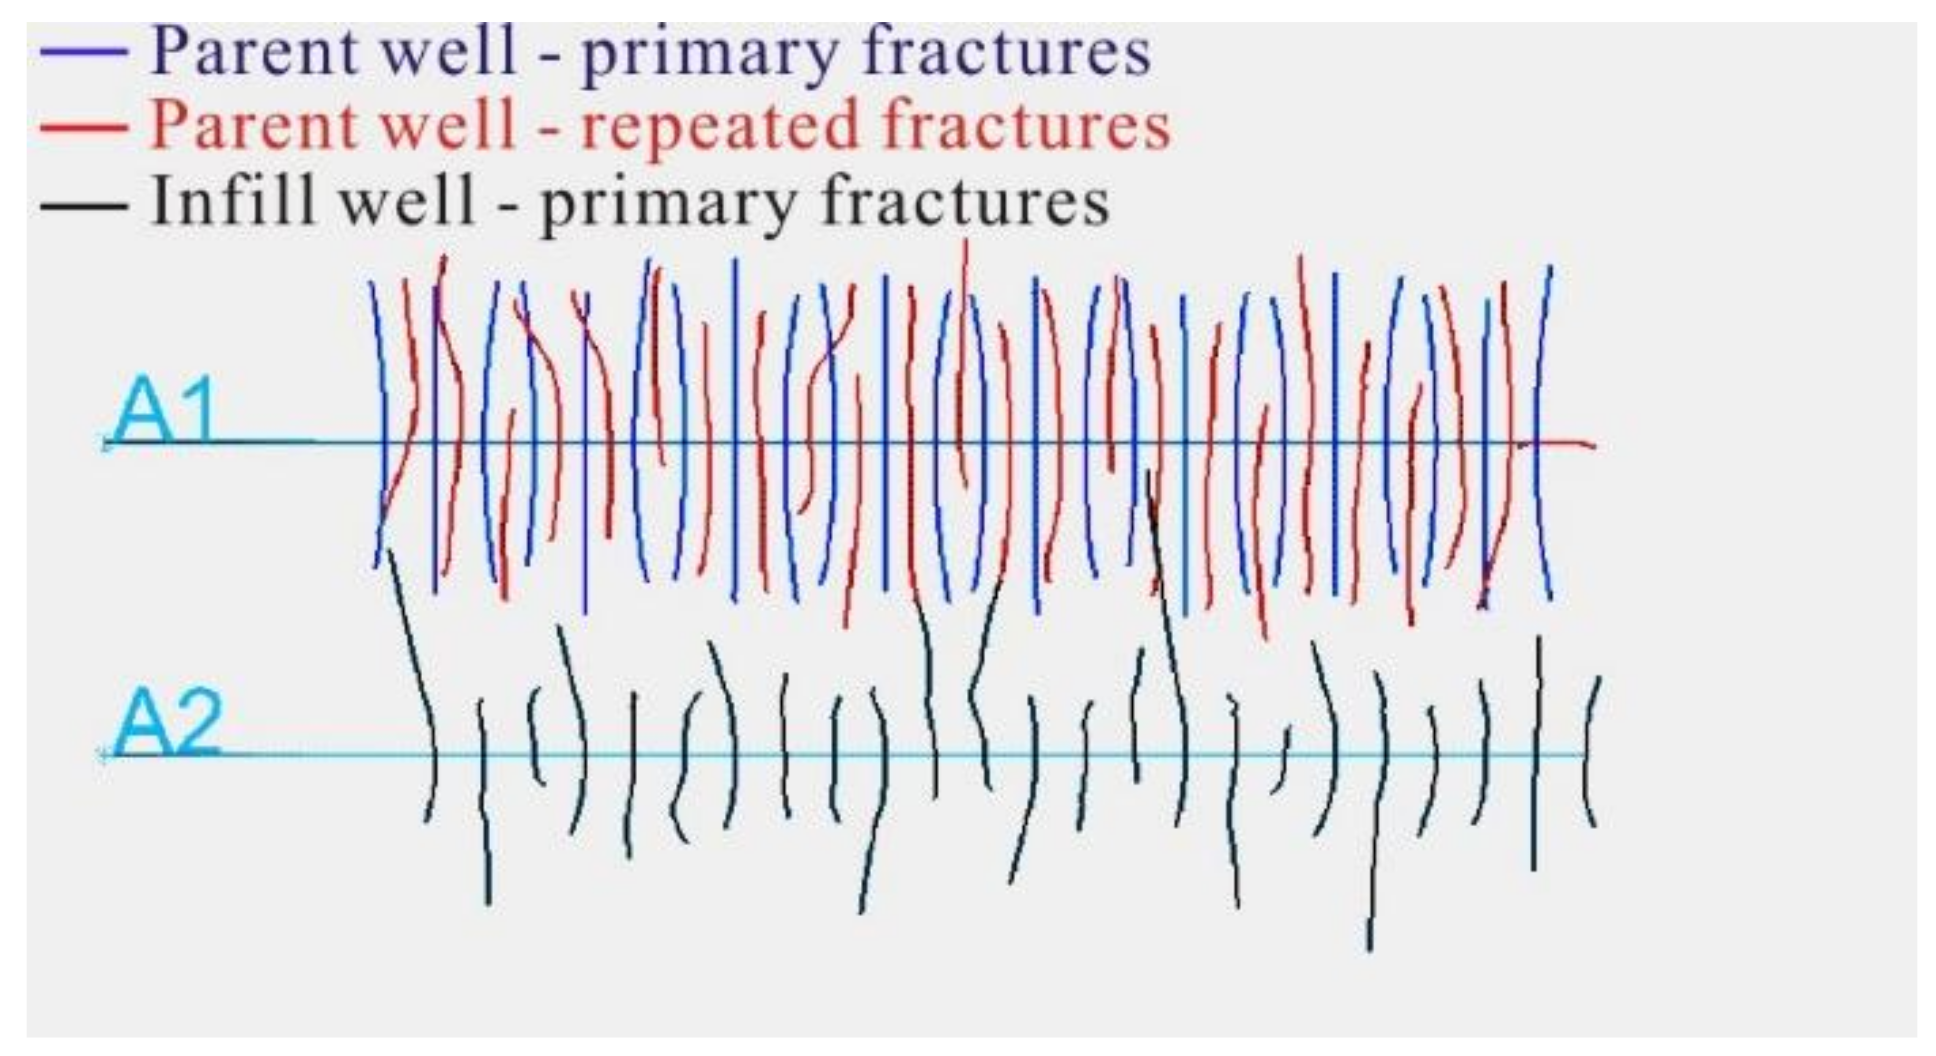
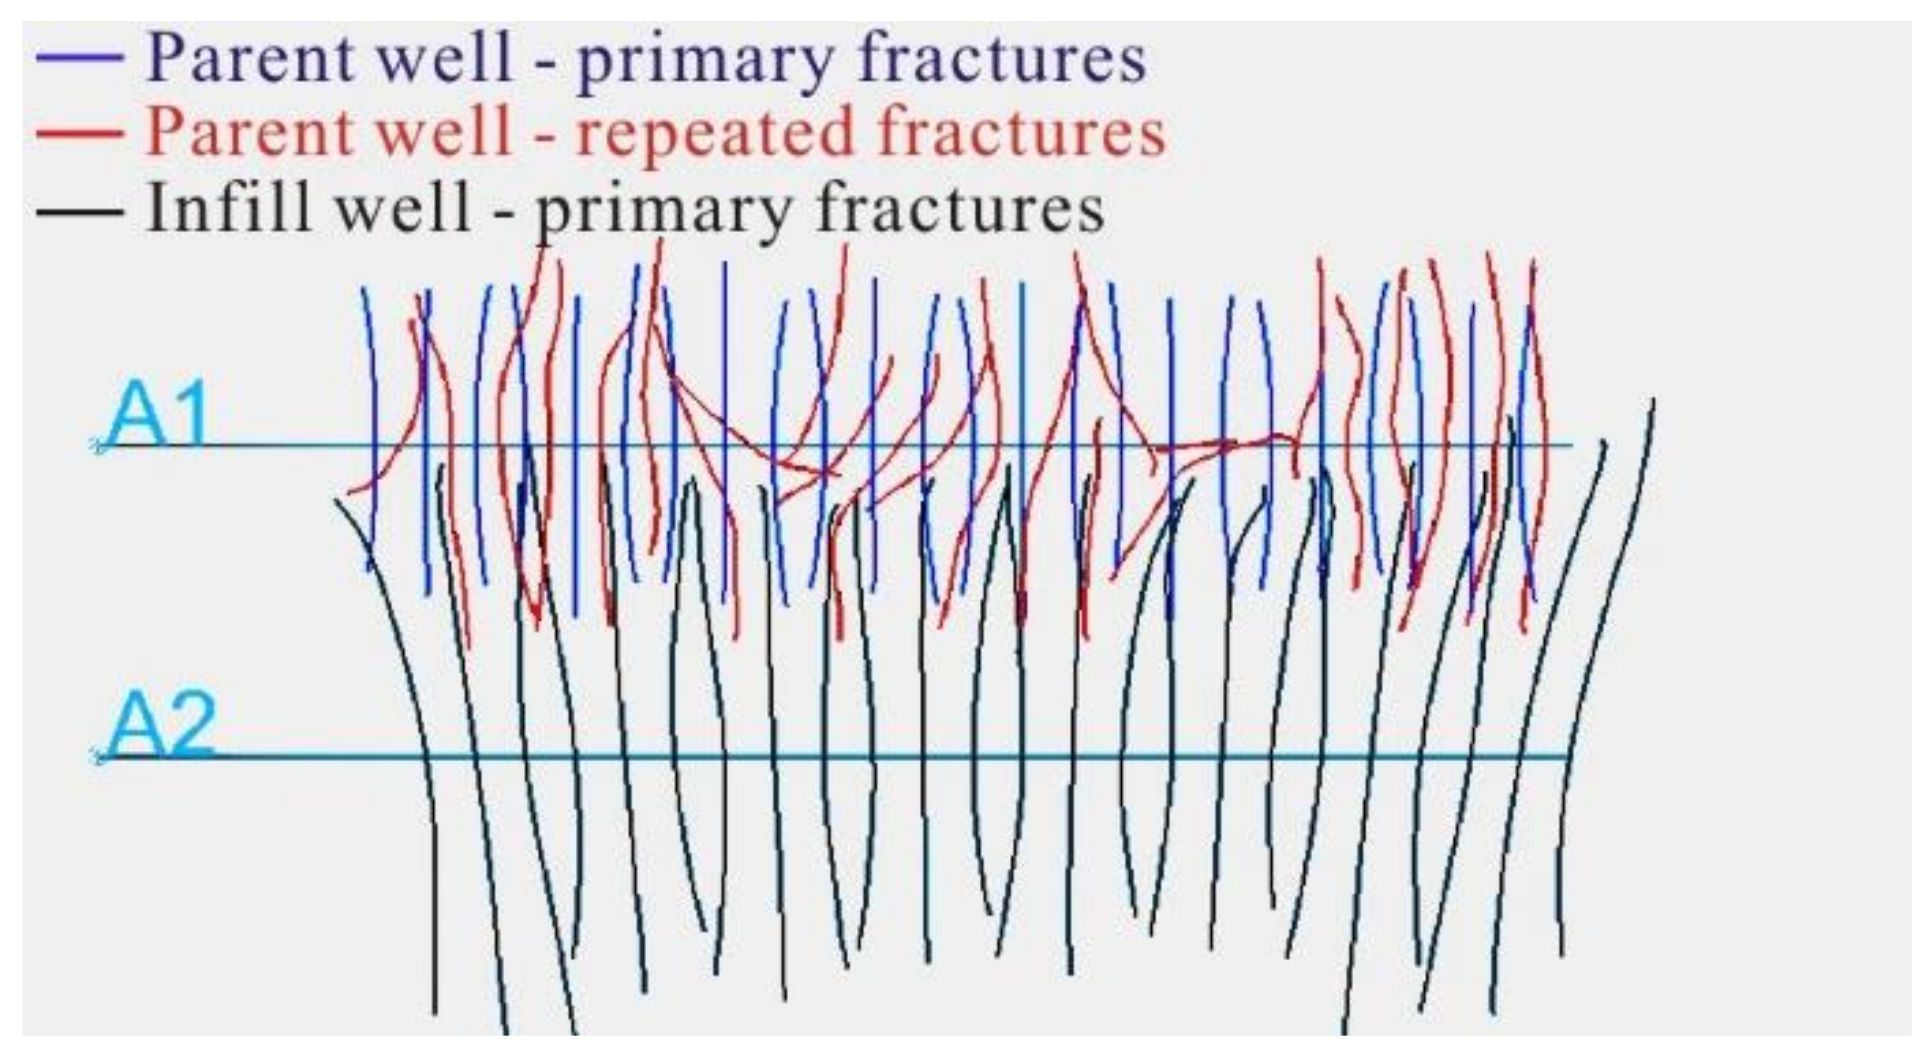
The fractures propagation of parent well and infill well after 1-year production is simulated utilizing the UFM model. Fracture morphology when no-water is injected is shown in Figure 5. Compared to primary fractures of the parent well, re-fractures are affected by ununiform stress distribution. Within one stage, the fracture length of each cluster varies greatly. As the direction of maximum horizontal principal stress changed from the initial state, some re-fractures divert and connect to the primary fractures uncontrollably, causing the fractures interference. As for the infill well, some fractures propagate into the depleted zone and connect to the factures of the parent well; in other words, frac hit happens. There are four clusters of infill well among twenty-four clusters in total communicating with the fractures of the parent well, which means the degree is slight.
Fractures morphology of parent well and infill well corresponding to different injection/production ratios is shown in Supplementary Materials (Figure S3). In general, the problem of “frac hit” is not serious because the production time is short and cumulative liquid production is not large enough. In each situation of different injection/production ratios, fracture interference and well interference happen. The number of infill well fractures which are communicating with fractures of parent well is small, generally less than five. The cluster spacing of parent wells becomes smaller because of the new perforations, and fractures interference usually happens among primary and repeated fractures of the parent well. Compared to the situation of no-water injection, the length of parent well re-fractures is larger.
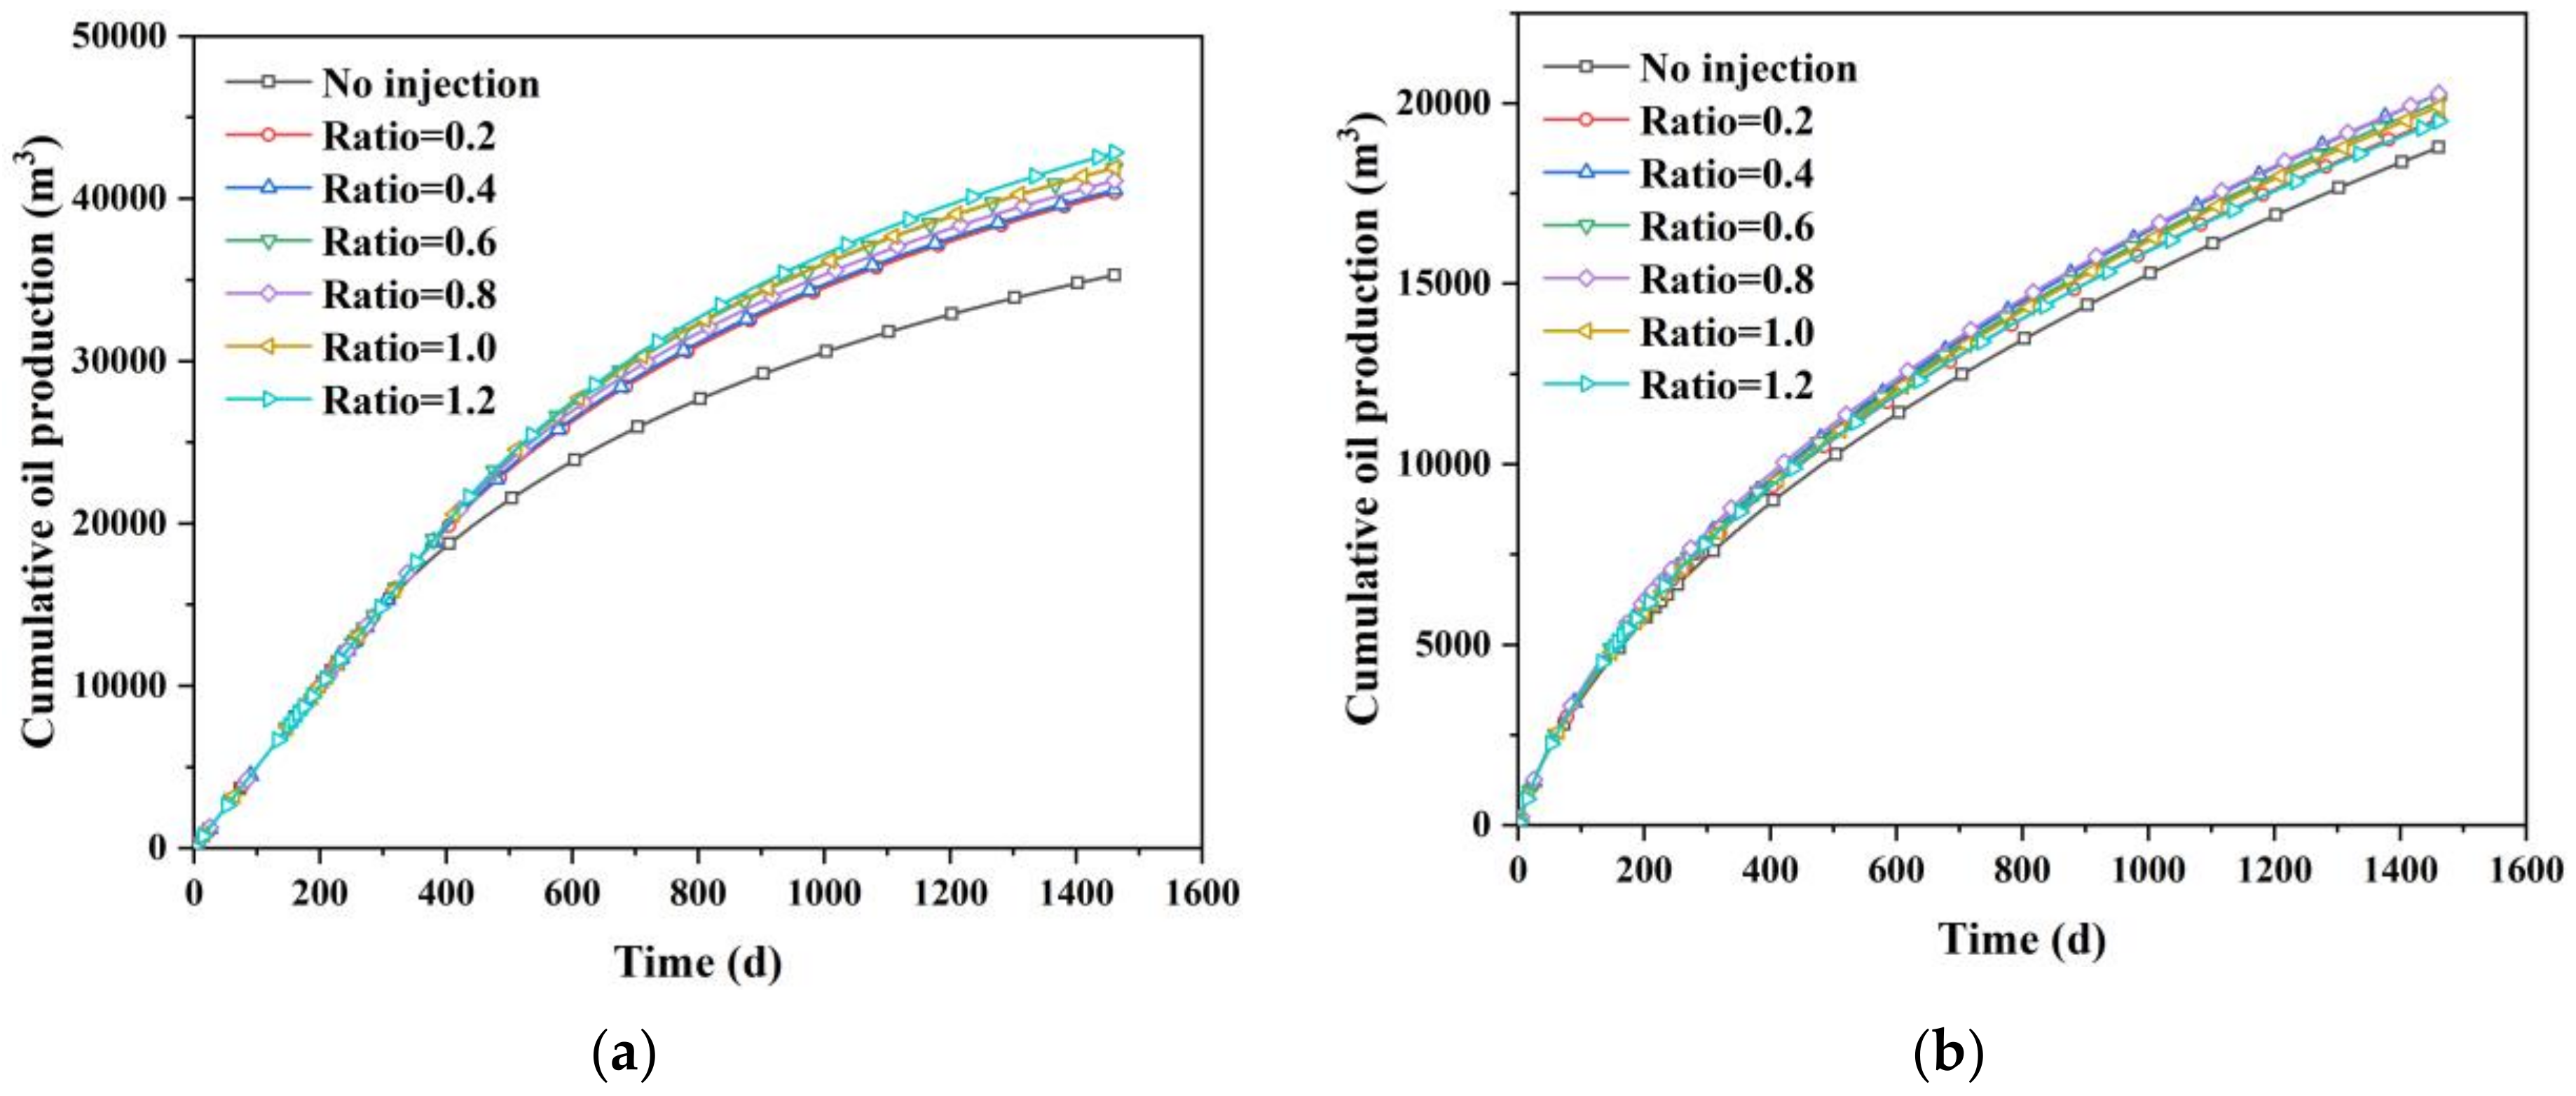
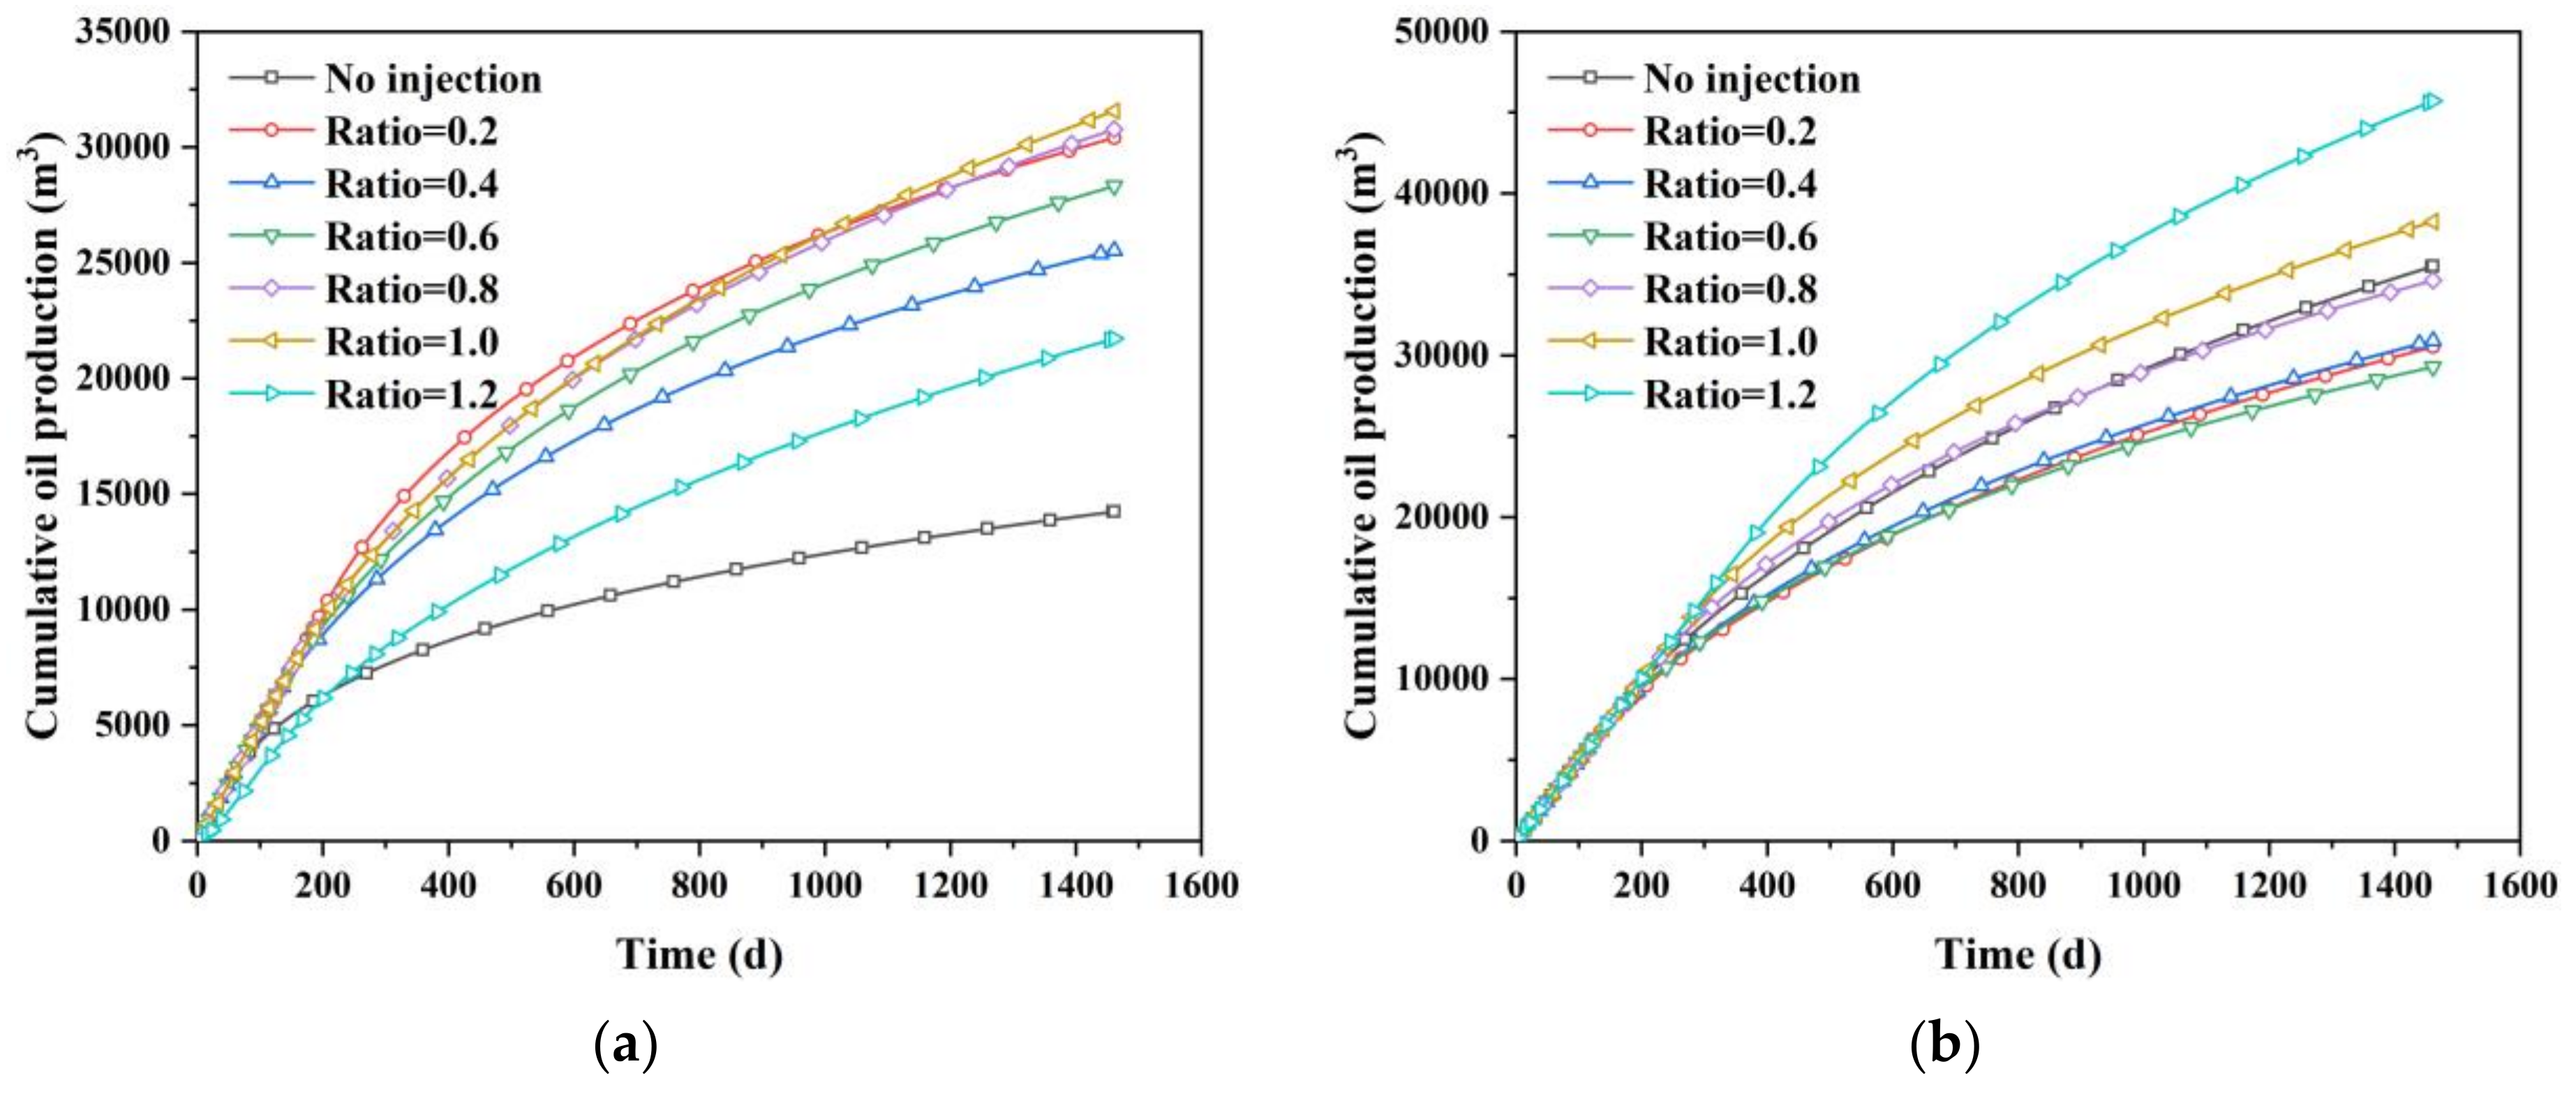
Based on fractures morphology, the numerical models with unstructured grids are generated. The cumulative liquid production of four years after re-stimulation corresponding to different injection/production ratios is predicted. The same constraint condition with primary production is used under different situations, which include the initial oil production of 50 m3/day and the given minimal bottom well pressure of 15 MPa. The predicted cumulative oil production is shown in Figure 6. It should be noted that, in the case of no water injection, the parent well has been soaked for a few days before being put into production, which is in accordance with the filed operation. Injecting water has an obvious effect on increasing oil production for both parent well and infill well, especially the parent well. Compared to oil production, under the condition of no water injection, different injection/production ratios work equally well for increasing oil production. There is no strict correlation between final oil production and injection/production ratio because of the difference of stress and pressure distribution and the resulting different degrees of fracture and well interference. The larger the ratio is, the higher the average formation pressure is, which favors oil production. However, the degree of stress and pressure heterogeneity corresponding to each injection/production ratio is different. If one fracture interferes with others severely, the final production could be influenced obviously, to a certain extent.
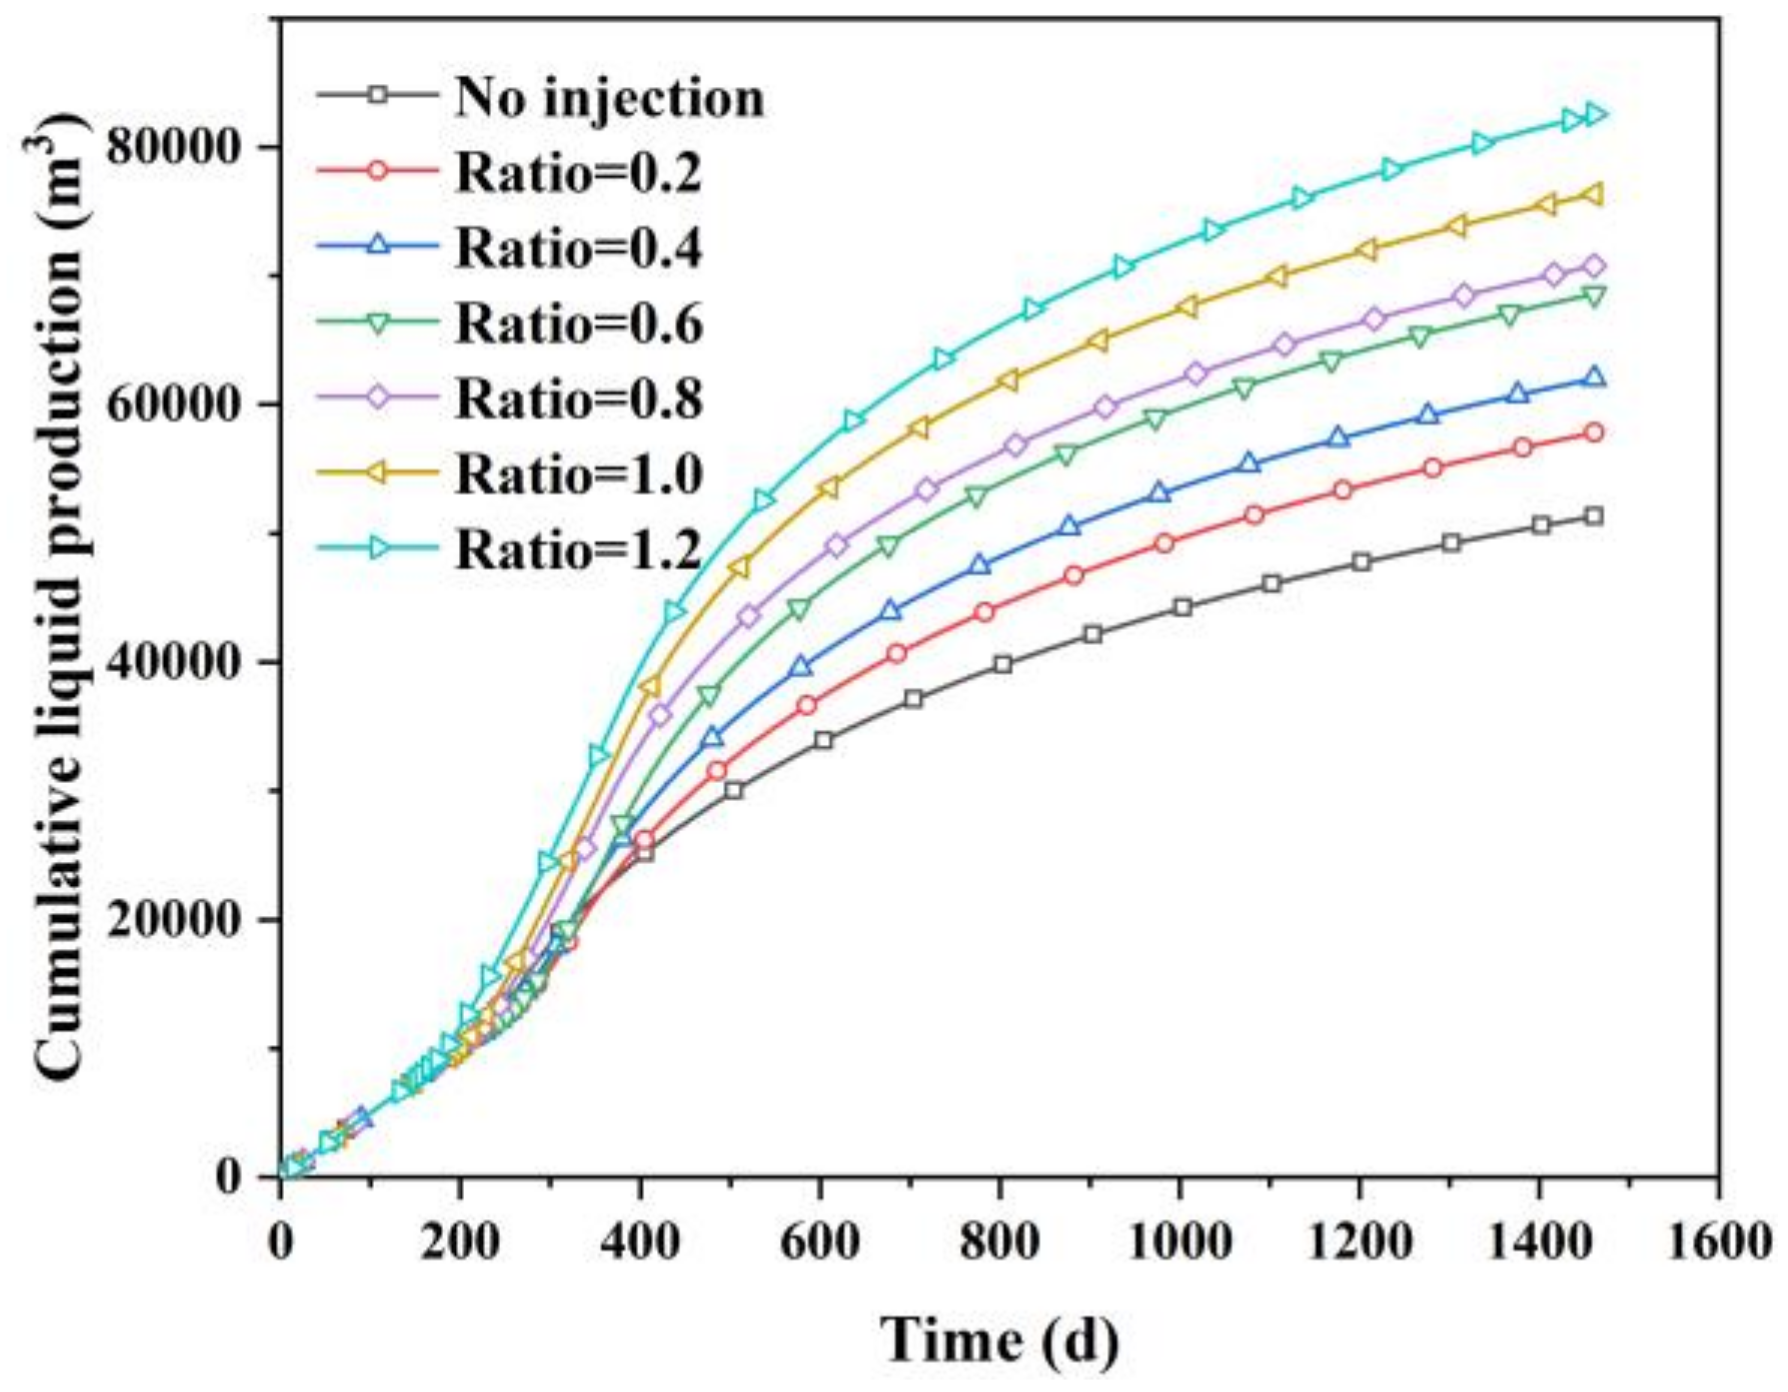
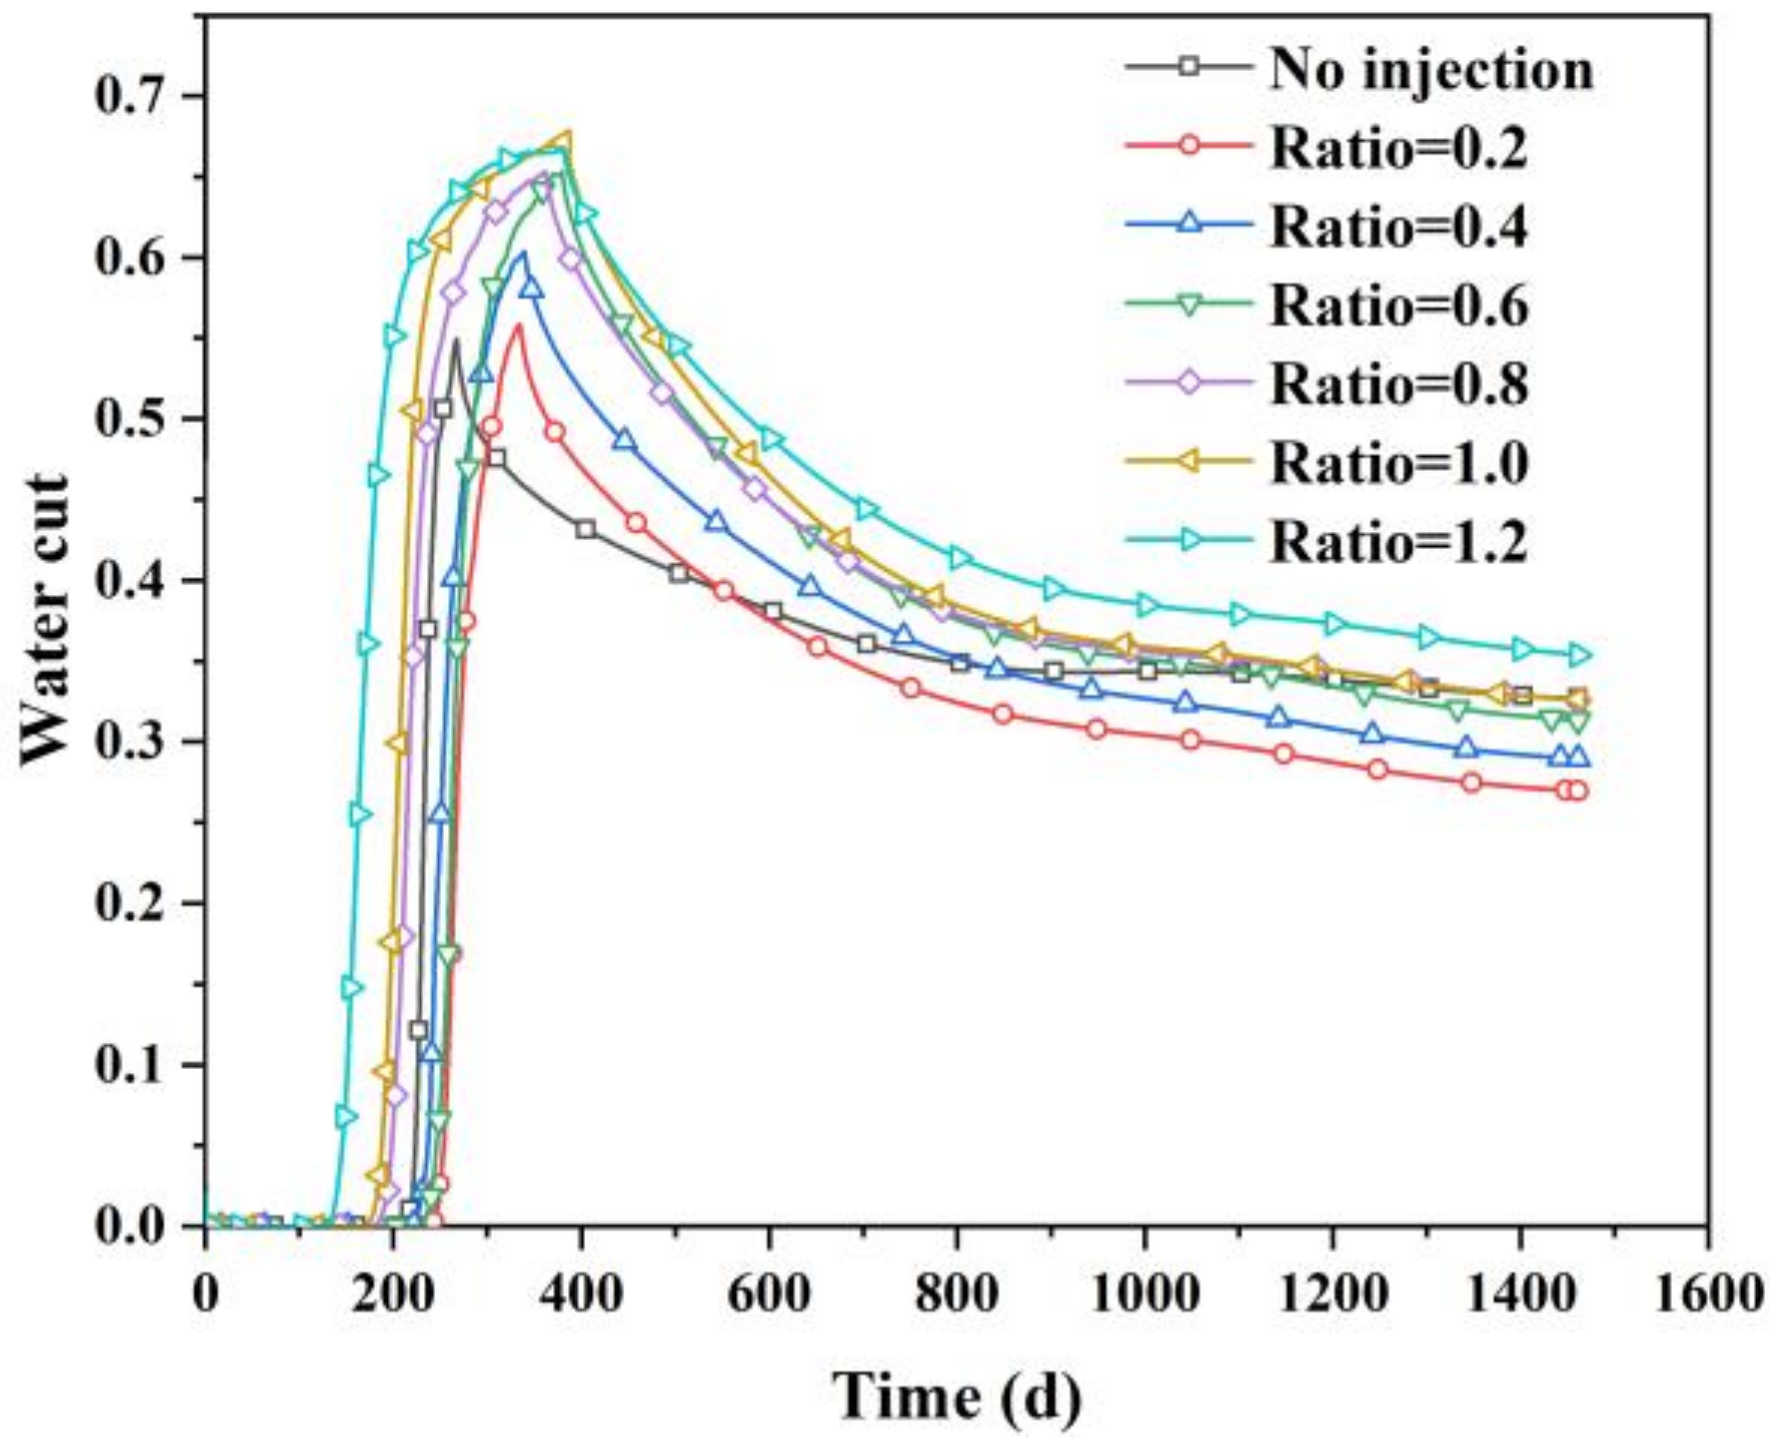
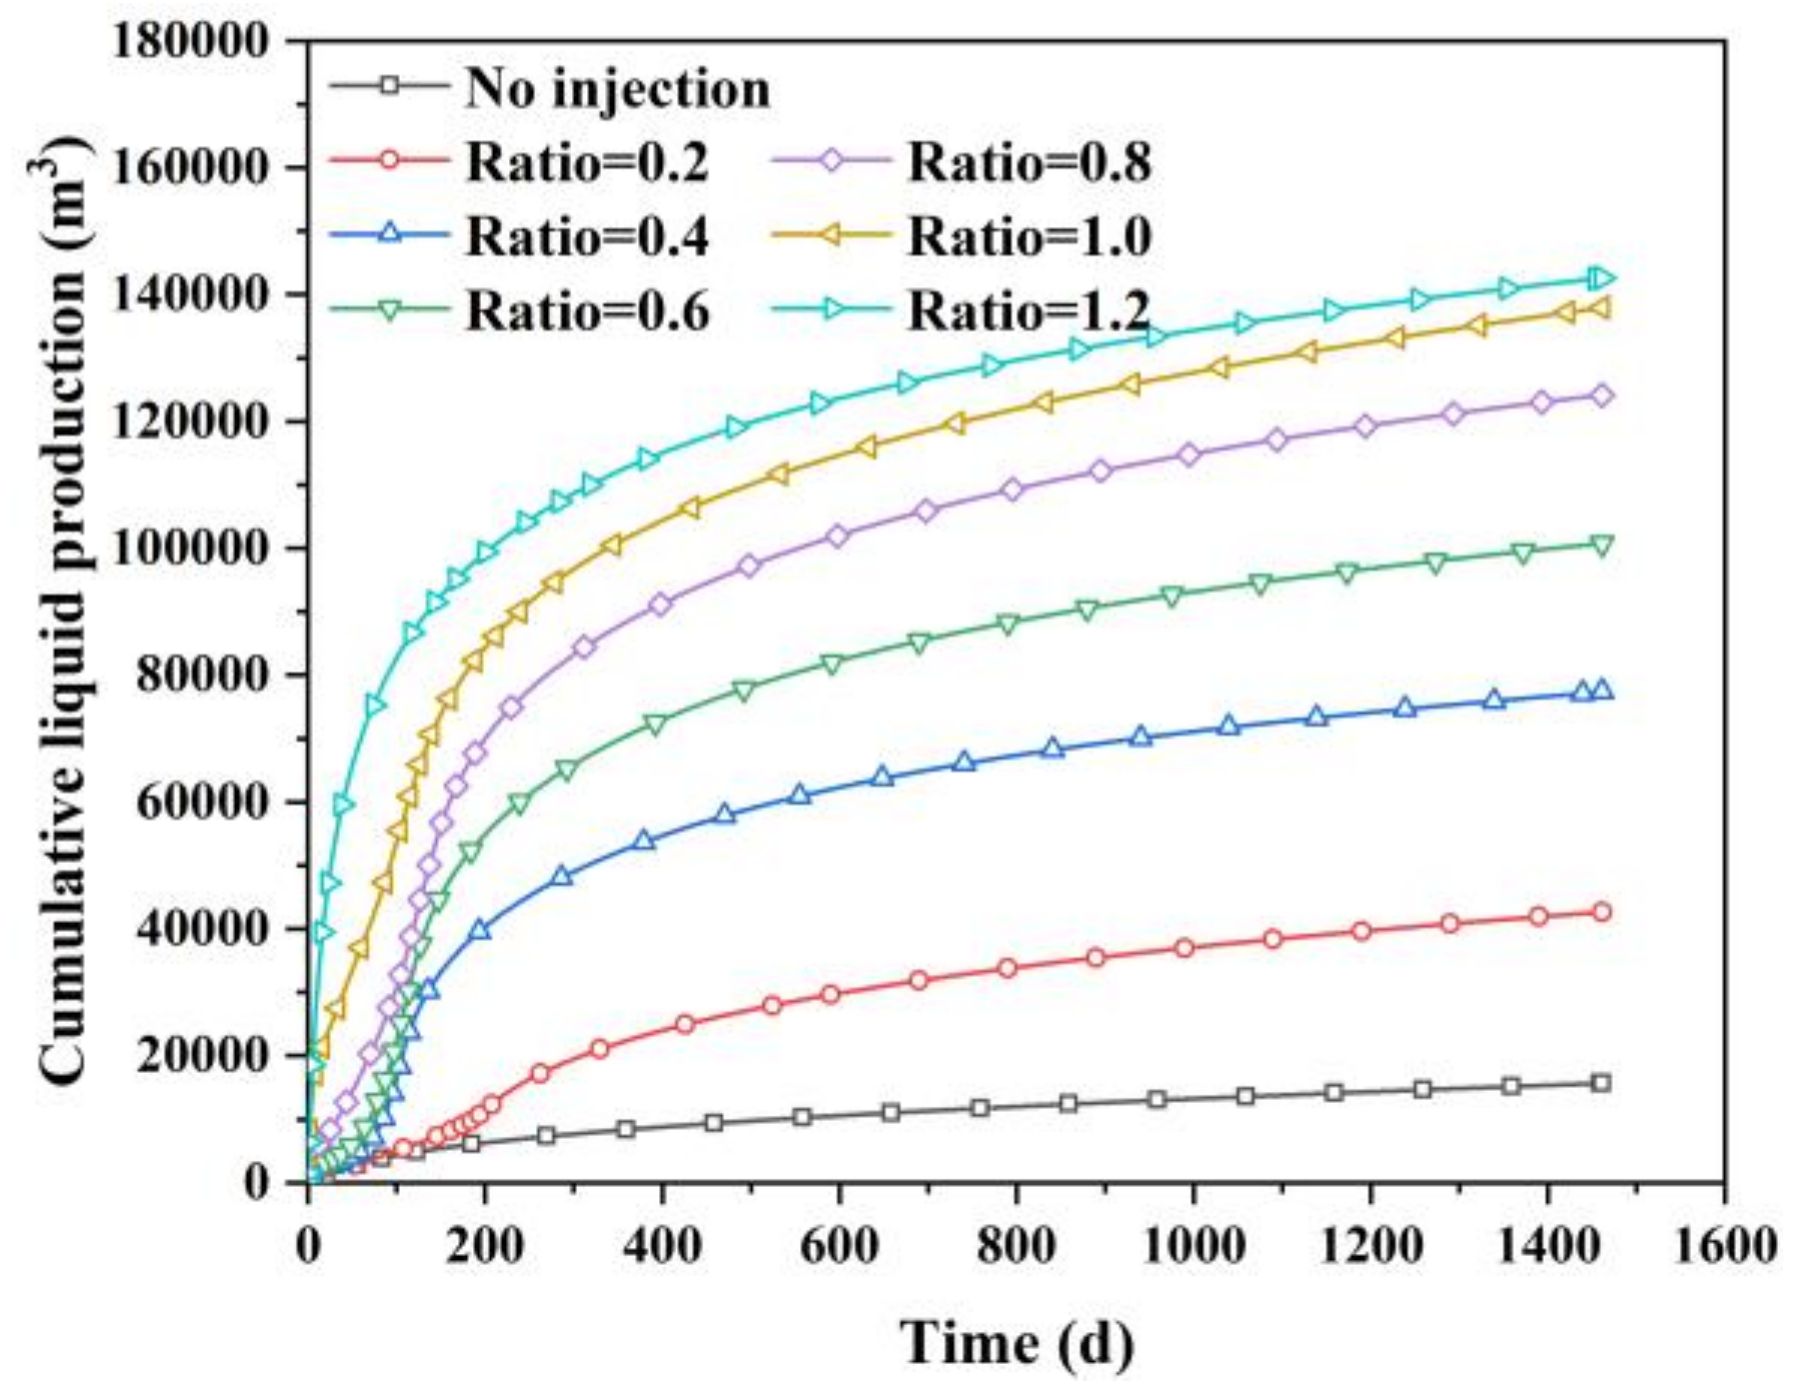
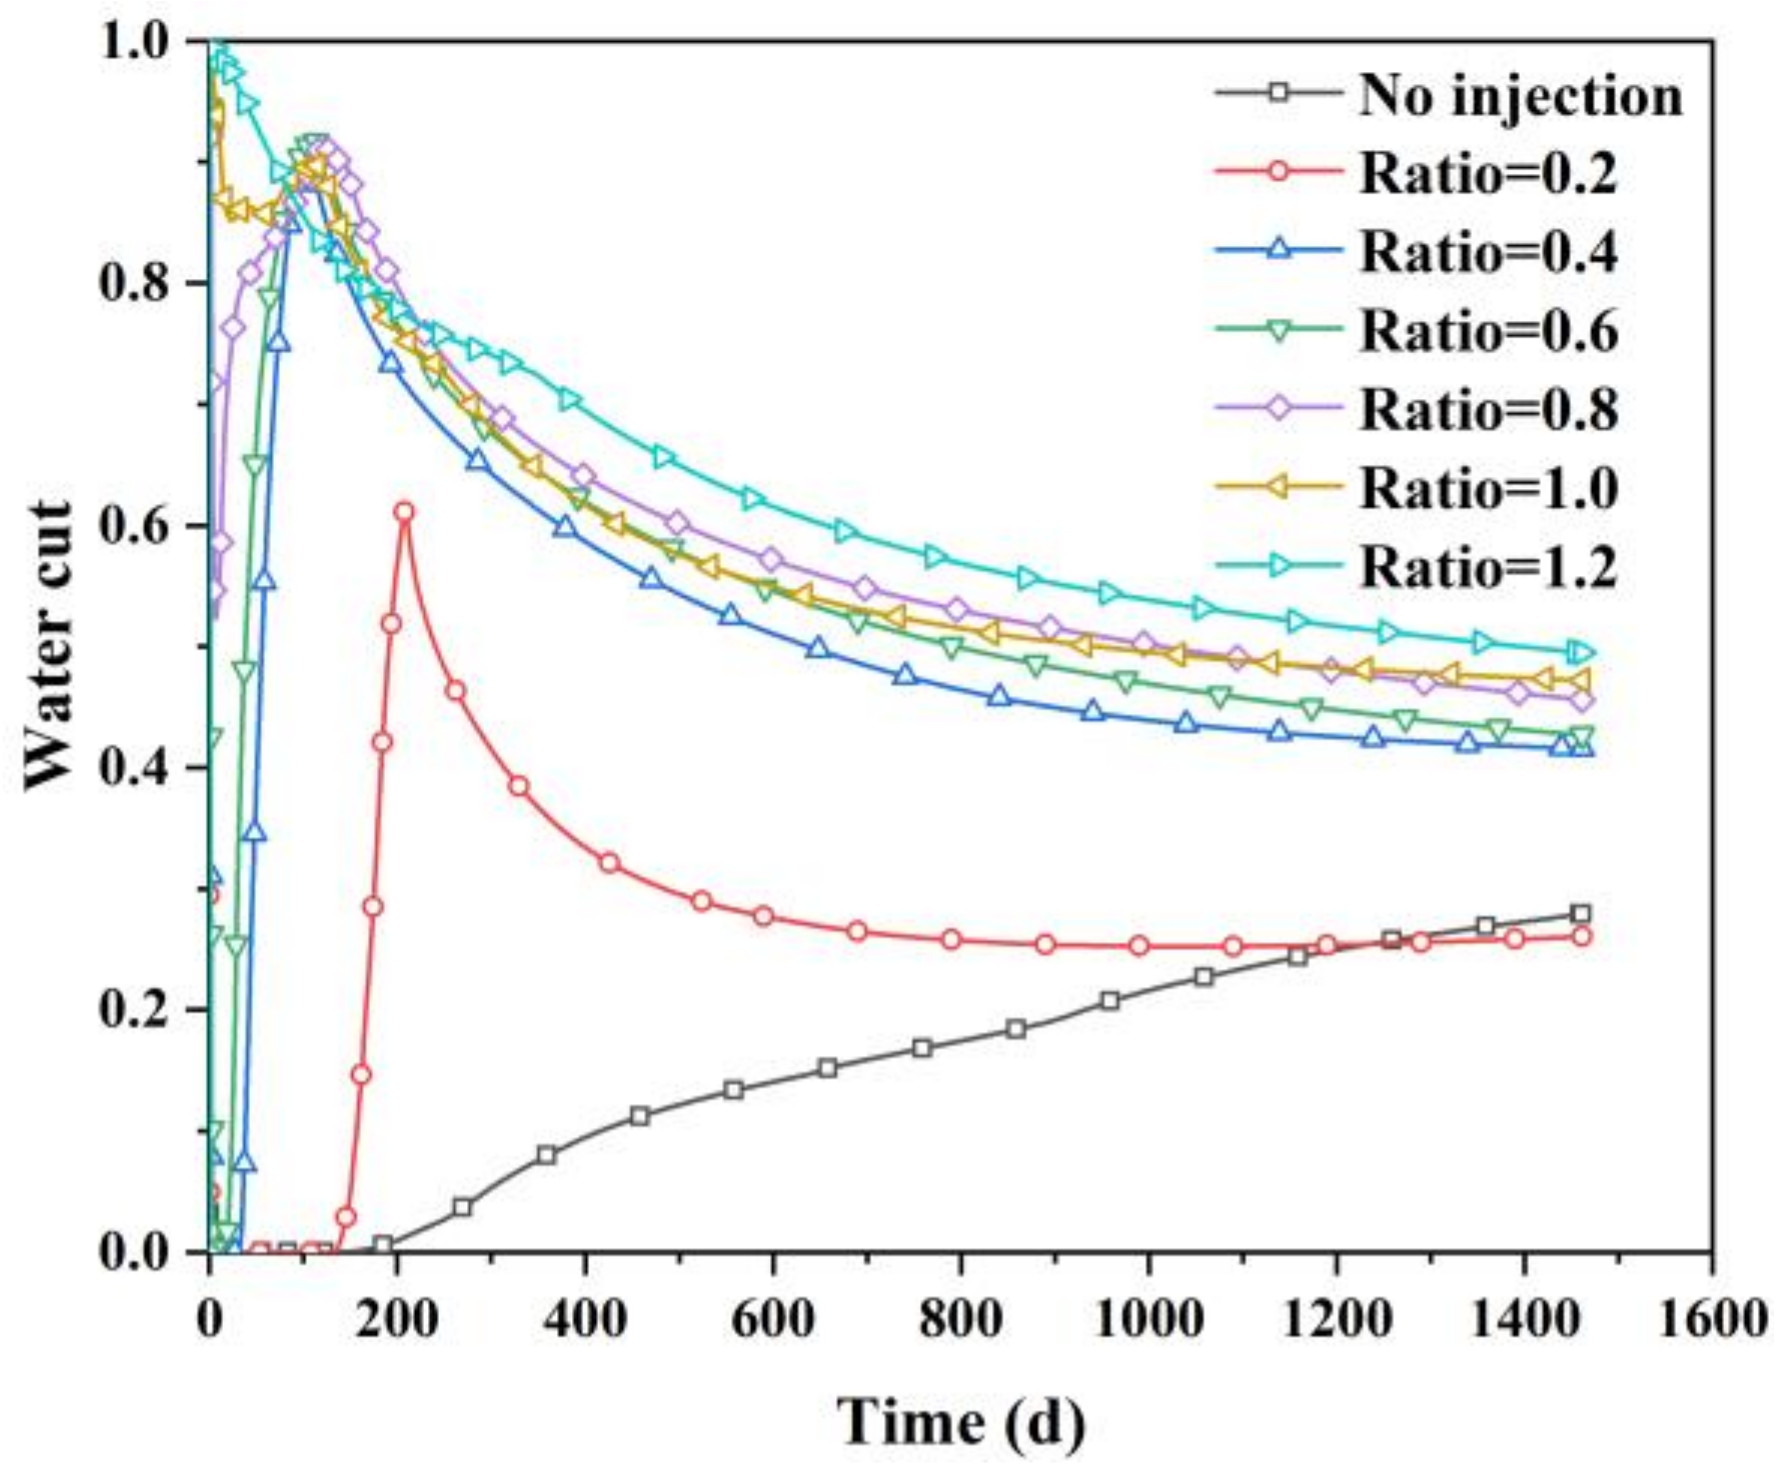
To describe the effect of injecting water on the liquid production of the parent well, the cumulative liquid production corresponding to different injection/production ratios is shown in Figure 7. It is obvious that, with the increase of the injection/production ratio from 0 to 1.2, the liquid production including water and oil keeps the increasing trend, which shows that more water injection will increase reservoir energy and benefit the producing of more liquid. As shown in Figure 8, with the injection/production ratio increases from 0.2 to 1.2, the water cut of the parent well is increasing with a positive correlation. However, water cut corresponding to the situation of no-injection is higher than those corresponding to the ratios of 0.2 to 0.6, and almost the same as the 0.8 and 1.0. As mentioned before, in the simulation case of no-injection, the parent well has been soaked for a period before the production to meet the field operation of re-stimulation. Therefore, water cut of the parent well during the initial production stage is 0. After a period of production, water cut is restored to a high level that is close to the state after 1-year production. In addition, as the capillary pressure is considered, water cut corresponding to the situation of no-injection is higher than water-injection.
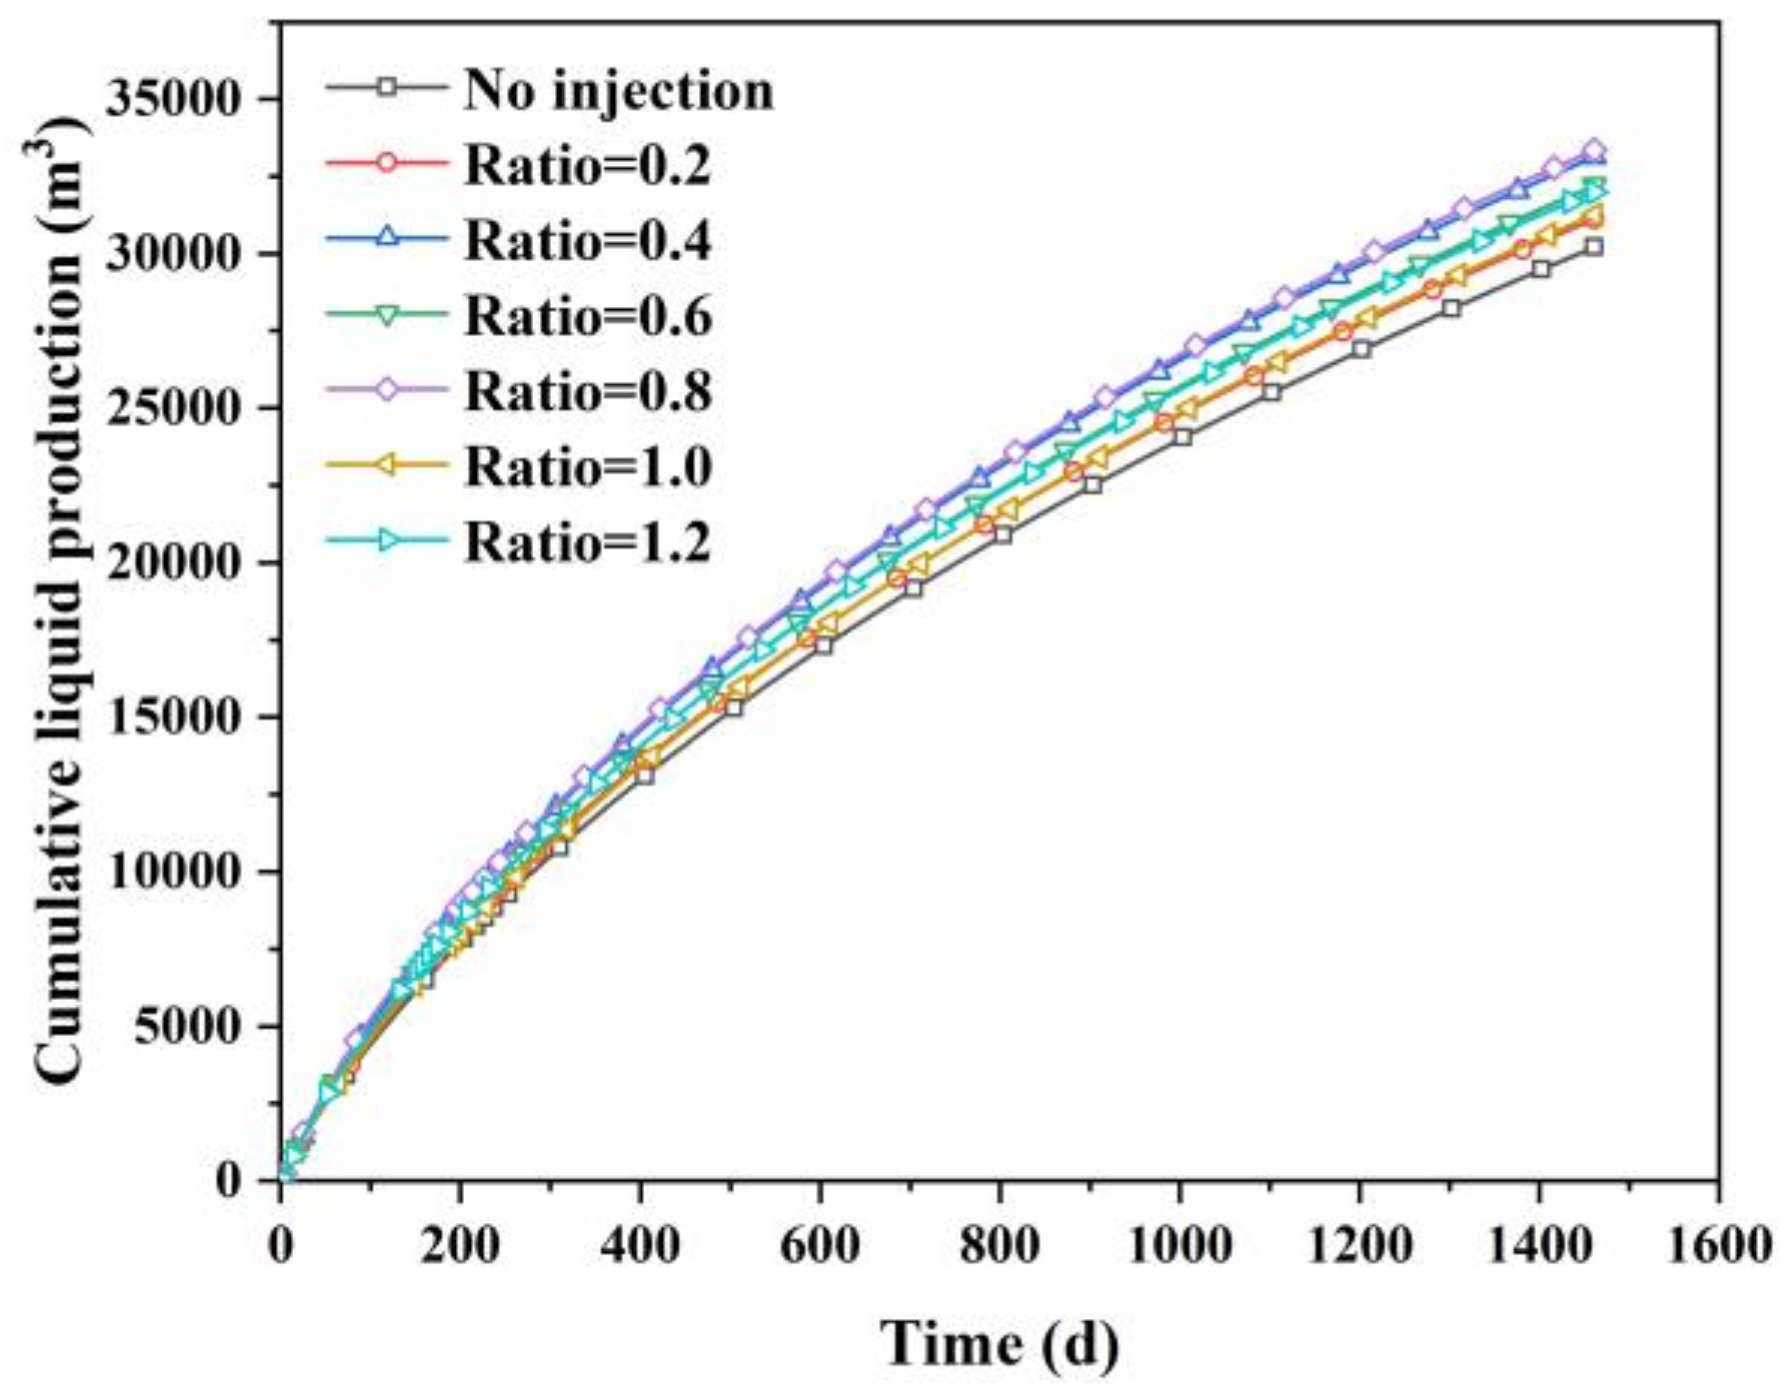
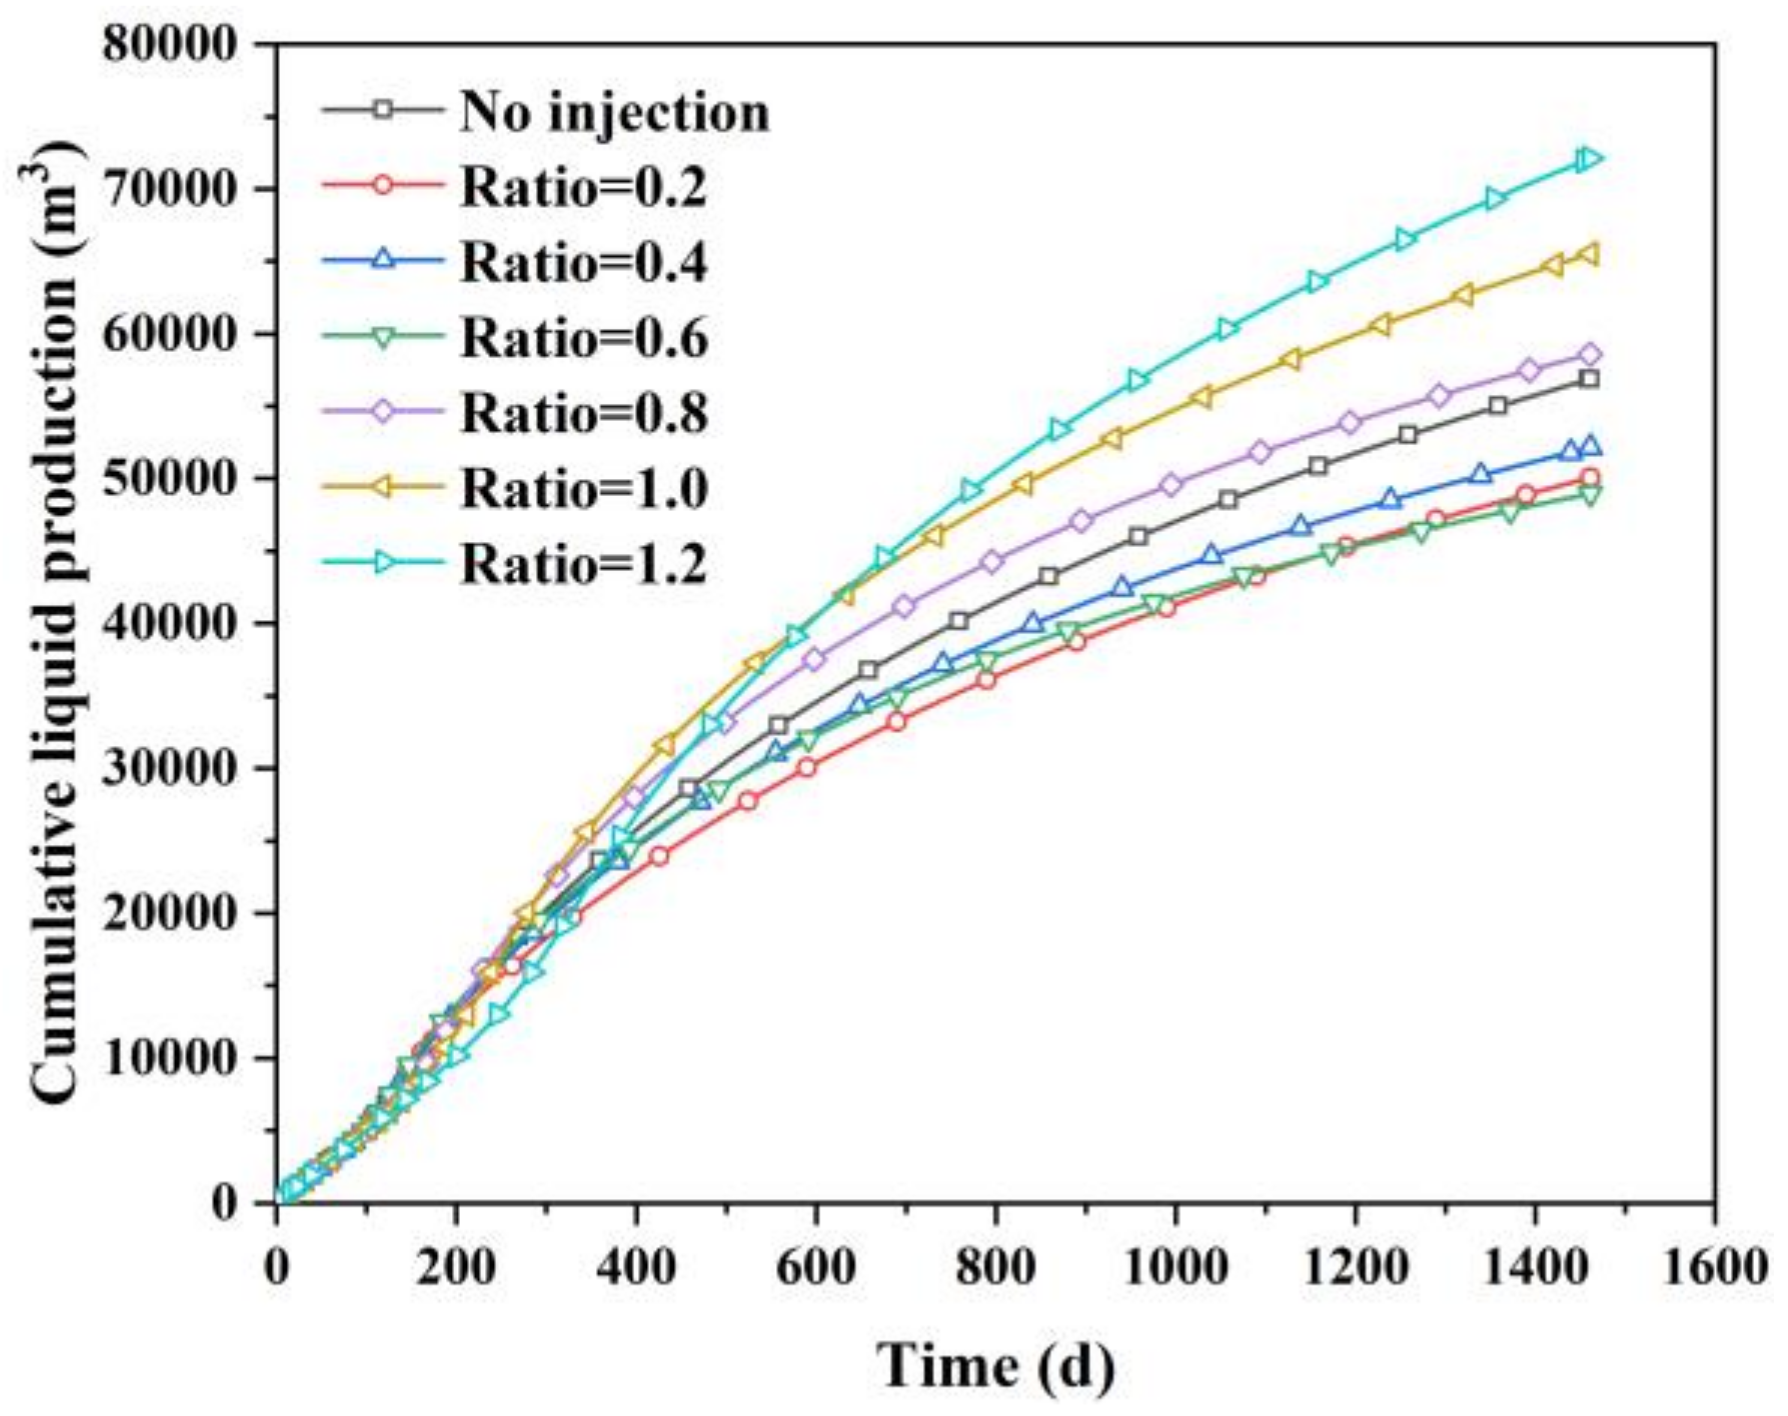
As for the infill well, the cumulative liquid production is shown in Figure 9. There is no strong correlation between injection/production ratio with cumulative liquid production. The cumulative liquid production corresponding to the situation of no water injecting is the lowest. Basically, as shown in Figure 9 and Figure 10, the cumulative liquid production and water cut corresponding to each situation are close because the degree of well interference is slight and universal.
Finally, the final cumulative oil production of the well group including parent well and infill well is used as a standard for determining the optimal injection/production ratio. As Figure 11 shows, when the injection/production ratio is 1.2, the maximum final cumulative oil production of the well group is 62,331 m3 with the final water cut of 0.455. However, the second highest oil production is 61,909 m3 with the final water cut of 0.386 when the injection/production ratio is 0.6. It means that producing 422 m3 of more oil brings 13,336 m3 of more water. In this case, the injection/production ratio of 0.6 is the optimal, and the injection volume is 14,396 m3.

3.2. 4th Year

As shown in Figure 12, after the parent well has been put into production for four years with the final cumulative oil production of 39,908 m3 and water production of 36,219 m3, the reservoir pressure decreases to 22.9 MPa, and the minimal horizontal principal stress decreases to 40.4 MPa near fractures. Unlike the situation after 1-year production, in the middle zone between two fractures, pressure also decreases significantly to 25.8 MPa. Accordingly, minimal horizontal principal stress decreases greatly too. There is a deficit of 76,127 m3 in the total. The ratios of water injection to production are set to 0.2, 0.4, 0.6, 0.8, 1.0, and 1.2. The corresponding cumulative water injection volumes are 15,225.4 m3, 30,450.8 m3, 45,676.2 m3, 60,901.6 m3, 76,127 m3, and 91,352.4 m3, respectively. The soaking time is two months to ensure that pressure spreads more uniformly.
Pressure distribution corresponding to different injection/production ratios after a 4-year production is shown in Supplementary Materials (Figure S4). Compared to the pressure distribution after 1-year production, there are more significant differences among various situations of different injection/production ratios. Unlike the phenomenon of high-pressure areas only being concentrated near fractures after one year, with the increasing of the injection/production ratio, reservoir pressure in the whole depleted zone increases gradually. When the injection/production ratio reaches 0.8, the high-pressure zone is gradually formed, in which the pressure is higher than the initial value. The reason for this is that the reservoir deficit of liqiud is huge, which leads to a great amount of water injection in the short run when the injection/production ratio is larger. The pressure propagation distance is limited. However, there is a transitional zone between a high-pressure zone after injecting water and the initial undeveloped reservoir.
Minimal horizontal principal stress distribution corresponding to different injection/production ratios after four years is shown in Supplementary Materials (Figure S5). With the increasing of the injection/production ratio, minimal horizontal principal stress around wellbore increases gradually. Compared to the situation after one year, the difference in stress distribution among different ratios is more obvious. The minimum horizontal principal stress around wellbore is about 42.7 MPa, while the injection/production is 0.2, and 45.8 MPa while the injection/production is 1.2. A few elements start with the slightly greater value than the initial state when the ratio is greater than 0.8. From the point of view of the stress distribution, when the injection/production ratio is greater than 0.8, the “frac hit” could be mitigated as the existence of high-stress areas.
Fractures morphology of parent well and infill well after a 4-year production as well as no-water injection is shown in Figure 13. The repeated fractures of parent well propagate in different directions, which is not perpendicular to the wellbore, especially in the middle stages. The fractures direction of the third stage is even parallel to the wellbore. After a long period of production, the interference of primary fractures with the repeat of the parent well is serious. As for the fractures of the infill well, the half-fractures close to the parent well have an obviously longer length than the other side, which means “frac hit” happens. It should be noted that the fracture length is longer, compared to those of the situation after 1-year production. Almost all fractures propagate to the depleted zones. Accordingly, the fracture width is smaller.
Fractures morphology of parent well and infill well corresponding to different injection/production ratios is shown in Supplementary Materials (Figure S6). In general, the problem of “frac hit” is very serious because the production time is long and the cumulative liquid production is very large. In each situation of different injection/production ratios, fractures interference and well interference happen. For the repeated fractures of parent wells, the length is getting larger with the increase of the injection/production ratio. When the injection/production ratio is 0.2, there are still some re-fractures that divert from the initial propagation direction. When it increases to 0.4 and 0.6, re-fractures morphology becomes similar to the primaries. However, as the ratio continues to increase, the re-fractures divert again. As mentioned before, some elements start with the slightly greater value than the initial state when the ratio is greater than 0.8. It shows that the injection/production of 0.8 is too large considering the stress distribution and fractures propagation. For fractures of the infill well, even if the injection/production ratio increases to 1.2, the fractures of infill well are still communicating with the primary fractures of the parent well, and a few propagate to the parent wellbore. When the injection/production ratio is greater than 0.6, although the fractures interference with the parent well happens, the fractures of infill well also propagate fully to the other side. In other words, when the injection/production ratio is greater than 0.6, on one side of the infill well, fractures interference happens, which is harmful to the production. On the other side, fractures propagate excessively, which is a benefit to the production. It shows that mitigating “frac hit” needs not only increases formation energy but also decreases the volume of re-fracturing fluid.
The cumulative oil production corresponding to different injection/production ratios is also predicted. The same constraint condition with primary production and re-frac production after one year is used, which includes the initial oil production of 50 m3/day and the given minimal bottom well pressure of 15 MPa. The predicted cumulative oil production is shown in Figure 14. The parent well has also been soaked for a few days before being put into production, which is same as the situation after one year.
When the infill well is stimulated after 1-year production of the parent well, injecting water has an obvious effect on increasing oil production for both parent well and infill well, especially the parent well. However, if the re-stimulation timing is the 4th year, injecting water may have a negative effect. For the parent well, when there is no water injected, cumulative oil production is the lowest, and the next is the ratio of 1.2. When the injection/production ratios are 0.2, 0.8, and 1.0, the parent well has the adjacent high cumulative oil production. For the infill well, the opposite has occurred. When the injection/production ratio is 1.2, cumulative oil production is the highest. Except for the ratios of 1.0 and 1.2, the cumulative oil productions of other situations are lower than the production of no-injecting.
Similarly, the cumulative liquid production corresponding to different injection/production ratios is shown in Figure 15. It is also obvious that, with the increasing of the injection/production ratio from 0 to 1.2, the liquid production of the parent well including water and oil keeps the increasing trend. From the slope of the cumulative liquid production curve, when the injection/production ratio is greater than 0.2, the oil production rate during the initial stage becomes higher quickly. However, as Figure 16 shows, different from the situation after 1-year production, the water cut keeps increasing as well. When there is no water injected into the parent well, the water cut remains at a low level. When the injection/production ratio is 0.2, the water cut firstly increases within the first 210 days, and then begins to decrease. When the injection/production ratio is greater than 0.2, the water cut remains at a high level. Comprehensively considering the water cut and the cumulative oil production of the parent well, the injection/production ratio of 0.2 is the best option for the parent well.
As for the infill well, the cumulative liquid production is shown in Figure 17. There is no strong correlation between the injection/production ratio with cumulative liquid production. The cumulative liquid production corresponding to the situation of no water injecting is higher than the ratios of 0.2 to 0.6. Considering the fracture morphology of parent well and infill well corresponding to different injection/production ratios, the fractures interference does have a negative effect on liquid production. At the same time, excessive propagation has a positive effect, as the stimulated reservoir area and volume are getting, larger. For the infill well, as shown in Figure 18, the water cut corresponding to the different injection/production ratio is numerically close because the “frac hit” is ubiquitous. Compared to the parent well, the average water cut of infill well is smaller.
Similarly, the final cumulative oil production of the well group including parent well and infill well is used as a standard for determining the optimal injection/production ratio. In this case, the injection/production ratio corresponding to the maximum final group production is 1.0, with the final cumulative oil production of 69,827 m3, and the final water cut is 0.656. However, as Figure 19 shows, the water production and water cut increase rapidly when the injection/production ratio is larger than 0.2. The final cumulative oil production of well group is 60,925 m3, and the final water cut is 0.342, when the injection/production ratio is 0.2. It means that producing 8902 m3 of more oil will bring 101,838 m3 of more water. In addition, the situations of ratios of 0.8 and 1.2 are similar. Therefore, as the re-stimulation timing is the 4th year, the optimal injection/production ratio is 0.2, and the injection volume is 15,224 m3.
We can see that the optimal injection/production ratio for different re-stimulation timing is different, but the corresponding injection volume is almost the same. It suggests that the maximum water injection volume, which can be effective for increasing oil production, is finite for a reservoir with certain physical properties. More water injection means more water production, which is mainly produced from the parent well after re-stimulation. Although the reservoir deficit volume is very large after a long period of production, the water injection volume is not suitable to be too large. From the pressure distribution mentioned before, it shows that the pressure increases in all of the depletion zones. However, the water saturation does not. The seepage distance of injected water is far less than the propagation distance of pressure. Therefore, the water centralized distribution near the fractures will be produced first. That is why the water cut of the parent well increases rapidly during the initial stage and remains at a high level, as the injection/production ratio is large. In addition, if the capillary pressure is greater than the field data we used, the optimal injection/production ratio and injection volume will be larger.
In addition, we think that the optimal water injection volume has more to do with the reservoir conditions than the liquid production or reservoir deficit. Whether the optimal water injection volume should be differentiated depends on the reservoir parameters. Therefore, the optimal injection/production ratio for a well block is not the best choice for another.
Furthermore, to mitigate the frac hit, the influence of changed stress distribution to fractures length of infill well must be considered. Increasing reservoir energy by injecting water is not enough; reducing the volume of fracturing fluid will play an important role in mitigating well interference.

4. Conclusions

When the re-stimulation timing is the 1st year and reservoir deficit is small, the high-pressure areas are concentrated near primary fractures of parent well after water injection. With the increasing of the injection/production ratio, minimal horizontal principal stress around wellbore increases gradually. In general, the problem of “frac hit” happens universally but is slight. Injecting water has an obvious effect on increasing oil production for both parent well and infill well, especially the parent well. For both parent well and infill well, the final cumulative oil productions corresponding to different injection/production ratios after re-stimulation are close. For the parent well, there are strong positive correlations between the final cumulative liquid production and the injection/production ratio. For the infill well, the cumulative liquid production corresponding to different situation is close.
When the re-stimulation timing is the 4th year and reservoir deficit is large, the reservoir pressure in the whole depleted zone increases apparently. With the increasing of the injection/production ratio, minimal horizontal principal stress around wellbore increases gradually. There are more obvious differences among different situations. For the parent well, the interference of primary fractures with the repeated is serious. The fractures length is longer than the situation after 1-year production. For the infill well, the half-fractures close to the parent well have an obviously longer length than the other side, which means “frac hit” happens in a severe way. Only for the parent well does injecting water have an effect on increasing oil production. There are also strong positive correlations between the final cumulative liquid production and the injection/production ratio for the parent well. For the infill well, under the comprehensive influence of excessive propagation and fractures interference, the cumulative liquid production corresponding to the situation of no water injecting is higher than the ratios of 0.2 to 0.6.
The optimal injection/production ratio for different re-stimulation timing is different, but the corresponding injection volume is almost the same, which is about 15,000 m3. When the water injection volume is large, more water injection means more water production, which is mainly from the parent well after re-stimulation. The water centralized distribution near the fractures will be produced first. The water cut of the parent well increases rapidly during the initial stage and remains at a high level as the injection/production ratio is large.

Supplementary Materials

The following supporting information can be downloaded at: www.mdpi.com/article/10.3390/pr10081538/s1, Figure S1: Pressure distribution corresponding to different injection/production ratios after 1-year production; Figure S2: Minimal horizontal principal stress distribution corresponding to different injection/production ratios after 1-year production; Figure S3: Fractures morphology of parent well and infill well corresponding to different injection/production ratios after 1-year production; Figure S4: Pressure distribution corresponding to different injection/production ratios after 4-years production; Figure S5: Minimal horizontal principal stress distribution corresponding to different injection/production ratios after 4-years production; Figure S6: Fractures morphology of parent well and infill well corresponding to different injection/production ratios after 4-years production.

Author Contributions

Conceptualization, X.M.; methodology, S.Z. and G.R.; software, G.D.; validation, X.M., S.Z. and Y.Z.; formal analysis, G.R.; investigation, G.R.; resources, G.R.; data curation, Y.Z.; writing—original draft preparation, G.R. and Q.X.; writing—review and editing, G.R. All authors have read and agreed to the published version of the manuscript.

Funding

This research was funded by the Research Foundation of the CNPC Strategic Cooperation Science and Technology Project (Key Technologies of Mahu Conglomerate Reservoir, ZLZX 2020-01-04-01).

Conflicts of Interest

The authors declare no conflict of interest.

References

  1. Miller, G.; Lindsay, G.; Baihly, H.; Xu, T. Parent well refracturing: Economic safety nets in an uneconomic market. In Proceedings of the SPE Low Perm Symposium, Denver, CO, USA, 5–6 May 2016. [Google Scholar] [CrossRef]
  2. Daneshy, A. Analysis of horizontal well fracture interactions, and completion steps for reducing the resulting production interference. In Proceedings of the SPE Annual Technical Conference and Exhibition, Dallas, TX, USA, 24–26 September 2018. [Google Scholar] [CrossRef]
  3. Abivin, P.; Vidma, K.; Xu, T.; Boumessouer, W.; Bailhy, J.; Ejofodomi, E.; Sharma, A.; Menasria, S.; Sergey, M. Data analytics approach to frac hit characterization in unconventional plays: Application to Williston Basin. In Proceedings of the International Petroleum Technology Conference, Dhahran, Kingdom of Saudi Arabia, 13–15 January 2020. [Google Scholar] [CrossRef]
  4. King, G.; Rainbolt, M.; Swanson, C. Frac hit induced production losses: Evaluating root causes, damage location, possible prevention methods and success of remedial treatments. In Proceedings of the SPE Annual Technical Conference and Exhibition, San Antonio, TX, USA, 9–11 October 2017. [Google Scholar] [CrossRef]
  5. Ajani, A.; Kelkar, M. Interference study in shale plays. In Proceedings of the SPE Hydraulic Fracturing Technology Conference, The Woodlands, TX, USA, 6–8 February 2012. [Google Scholar] [CrossRef]
  6. Rassenfoss, S. Rethinking fracturing: The problems with bigger fracs in tighter spaces. J. Pet. Technol. 2017, 69, 28–34. [Google Scholar] [CrossRef]
  7. Daneshy, A.; King, G. Horizontal well frac-driven interactions: Types, consequences, and damage mitigation. J. Pet. Technol. 2019, 71, 45–47. [Google Scholar] [CrossRef]
  8. Fisher, M.; Wright, C.; Davidson, B.; Goodwin, A.; Fielder, E.; Buckler, W.; Steinsberger, N. Integrating fracture mapping technologies to optimize stimulations in the Barnett Shale. In Proceedings of the SPE Annual Technical Conference and Exhibition, San Antonio, TX, USA, 29 September–2 October 2002. [Google Scholar] [CrossRef]
  9. Fisher, M.; Heinze, J.; Harris, C.; Davidson, B.; Wright, C.; Dunn, K. Optimizing horizontal completion techniques in the Barnett Shale using microseismic fracture mapping. In Proceedings of the SPE Annual Technical Conference and Exhibition, Houston, TX, USA 26–29 September 2004. [Google Scholar] [CrossRef]
  10. Courtier, J.; Gray, D.; Smith, M.; Stegent, N.; Carmichael, J.; Hassan, M.; Ciezobka, J. Legacy well protection refrac mitigates offset well completion communications in joint industry project. In Proceedings of the SPE Liquids-Rich Basins Conference–North America, Midland, TX, USA, 21–22 September 2016. [Google Scholar] [CrossRef]
  11. Cipolla, C.; Motiee, M.; Aicha, K. Integrating microseismic, geomechanics, hydraulic fracture modeling, and reservoir simulation to characterize parent well depletion and infill well performance in the Bakken. In Proceedings of the SPE/AAPG/SEG Unconventional Resources Technology Conference, Houston, TX, USA, 23–25 July 2018. [Google Scholar] [CrossRef] [Green Version]
  12. Chittenden, H.; Cannon, D.; Jeziorski, K.; Bowman-Young, S.; Lindsay, S. Understanding the role of well sequencing in managing reservoir stress response in the permian: Implications for child-well completions using high-resolution microseismic analysis. In Proceedings of the SPE Hydraulic Fracturing Technology Conference and Exhibition, The Woodlands, TX, USA, 31 January–2 February 2020. [Google Scholar] [CrossRef]
  13. Ajisafe, F.; Solovyeva, I.; Morales, A.; Ejofodomi, E.; Matteo, M. Impact of well spacing and interference on production performance in unconventional reservoirs, Permian Basin. In Proceedings of the SPE/AAPG/SEG Unconventional Resources Technology Conference, Austin, TX, USA, 20–22 July 2017. [Google Scholar] [CrossRef]
  14. Jacobs, T. What is really happening when parent and child wells interact? J. Pet. Technol. 2021, 73, 28–31. [Google Scholar] [CrossRef]
  15. Shahri, M.; Tucker, A.; Rice, C.; Lathrop, Z.; Ratcliff, D.; McClure, M.; Fowler, G. High fidelity fibre-optic observations and resultant fracture modeling in support of planarity. In Proceedings of the SPE Hydraulic Fracturing Technology Conference and Exhibition, Virtual, 4–6 May 2021. [Google Scholar] [CrossRef]
  16. Rainbolt, M.; Jacey, E. Frac hit induced production losses: Evaluating root causes, damage location, possible prevention methods and success of remediation treatments, Part II. In Proceedings of the SPE Hydraulic Fracturing Technology Conference and Exhibition, The Woodlands, TX, USA, 23–25 January 2018. [Google Scholar] [CrossRef]
  17. Joslin, K.; Ranjbar, E.; Shahamat, S.; Kiran, S. Pressure sink mitigation: Effect of preloading parent wells to better control infill hydraulic fracture propagation. In Proceedings of the SPE Canada Unconventional Resources Conference, Virtual, 28 September–2 October 2020. [Google Scholar] [CrossRef]
  18. Yu, W.; Wu, K.; Zuo, L.; Tan, X.; Ruud, W. Physical models for inter-well interference in shale reservoirs: Relative impacts of fracture hits and matrix permeability. In Proceedings of the SPE/AAPG/SEG Unconventional Resources Technology Conference, San Antonio, TX, USA, 1–3 August 2016. [Google Scholar] [CrossRef] [Green Version]
  19. Ratcliff, D.; McClure, M.; Fowler, G.; Elliot, B.; Austin, Q. Modelling of parent child well interactions. In Proceedings of the SPE Hydraulic Fracturing Technology Conference and Exhibition, The Woodlands, TX, USA, 31 January–2 February 2022. [Google Scholar] [CrossRef]
  20. Fowler, G.; Ratcliff, D.; Mark, M. Modeling frac hits: Mechanisms for damage versus uplift. In Proceedings of the International Petroleum Technology Conference, Riyadh, Saudi Arabia, 21–23 February 2022. [Google Scholar] [CrossRef]
  21. Wang, L.; Du, X.; Qiu, K.; Wu, S.; Zhuang, X.; Bai, X.; Wang, L.; Pan, Y. Frac hit in complex tight oil reservoir in ordos basin: The challenges, the root causes and the cure. In Proceedings of the SPE Annual Technical Conference and Exhibition, Virtual, 21–22 October 2020. [Google Scholar] [CrossRef]
  22. Vincent, M. Restimulation of unconventional reservoirs: When are refracs beneficial? J. Can. Pet. Technol. 2011, 50, 36–52. [Google Scholar] [CrossRef]
  23. Bommer, P.; Bayne, M.A. Active well defense in the Bakken: Case study of a ten-well frac defense project, McKenzie County, ND. In Proceedings of the SPE Hydraulic Fracturing Technology Conference and Exhibition, The Woodlands, TX, USA, 23–25 January 2018. [Google Scholar] [CrossRef]
  24. Whitfield, T.; Watkins, M.; Dickinson, L.J. Pre-loads: Successful mitigation of damaging frac hits in the Eagle Ford. In Proceedings of the SPE Annual Technical Conference and Exhibition, Dallas, TX, USA, 24–26 September 2018. [Google Scholar] [CrossRef]
  25. Gala, D.P.; Manchanda, R.; Sharma, M. Modeling of fluid injection in depleted parent wells to minimize damage due to frac-hits. In Proceedings of the SPE/AAPG/SEG Unconventional Resources Technology Conference, Houston, TX, USA, 23–25 July 2018. [Google Scholar] [CrossRef]
  26. Singh, V.; Roussel, N.P.; Sharma, M. Stress reorientation around horizontal wells. In Proceedings of the SPE Annual Technical Conference and Exhibition, Denver, CO, USA, 21–24 September 2008. [Google Scholar] [CrossRef]
  27. Safari, R.; Lewis, R.; Ma, X.; Mutlu, U.; Ghassemi, A. Infill-well fracturing optimization in tightly spaced horizontal wells. SPE J. 2017, 22, 582–595. [Google Scholar] [CrossRef]
  28. Guo, X.; Wu, K.; Cheng, A.; Tang, J.; Killough, J. Numerical investigation of effects of subsequent parent-well injection on interwell fracturing interference using reservoir-geomechanics-fracturing modeling. SPE J. 2019, 24, 1884–1902. [Google Scholar] [CrossRef]
  29. Li, N.; Wu, K.; Killough, J. Numerical investigation of key factors on successful subsequent parent well water injection to mitigate parent-infill well interference. In Proceedings of the SPE/AAPG/SEG Unconventional Resources Technology Conference, Denver, CO, USA, 22–24 July 2019. [Google Scholar] [CrossRef]
  30. Zheng, S.; Manchanda, R.; Gala, D.; Mukul, S. Preloading depleted parent wells to avoid fracture hits: Some important design considerations. SPE Drill Completion 2021, 36, 170–187. [Google Scholar] [CrossRef]
  31. Garza, M.; Baumbach, J.; Prosser, J.; Pettigrew, S.; Elvig, K. An Eagle Ford case study: Improving an infill well completion through optimized refracturing treatment of the offset parent wells. In Proceedings of the SPE Hydraulic Fracturing Technology Conference and Exhibition, The Woodlands, TX, USA, February 2019. [Google Scholar] [CrossRef]
  32. Gupta, J.; Zielonka, M.; Albert, R.; El-Rabaa, W.; Burnham, H.; Nancy, H. Integrated methodology for optimizing development of unconventional gas resources. In Proceedings of the SPE Hydraulic Fracturing Technology Conference, The Woodlands, TX, USA, 10 February 2012. [Google Scholar] [CrossRef]
  33. Xu, L.; Ogle, J.; Collier, T. Fracture hit mitigation through surfactant-based treatment fluids in parent wells. In Proceedings of the SPE Liquids-Rich Basins Conference—North America, Odessa, TX, USA, 7–8 November 2019. [Google Scholar] [CrossRef]
  34. Telmadarreie, A.; Li, S.; Bryant, S. Effective pressure maintenance and fluid leak-off management using nanoparticle-based foam. In Proceedings of the SPE Canadian Energy Technology Conference, Calgary, AL, Canada, 16–17 March 2022. [Google Scholar] [CrossRef]
  35. Cedeno, M. Unloading frac hits in gas wells: How does the nitrogen injection rate and pressure affect the unloading process? In Proceedings of the SPE Trinidad and Tobago Section Energy Resources Conference, Virtual, 28–30 June 2021. [Google Scholar] [CrossRef]
  36. Rasheed, M.; Shihab, S.; Sabah, O. An investigation of the structural, electrical and optical properties of graphene-oxide thin films using different solvents. J. Phys. Conf. Ser. 2021, 1795, 012052. [Google Scholar] [CrossRef]
  37. Abbas, M.; Rasheed, M. Solid state reaction synthesis and characterization of Cu doped TiO2 nanomaterials. J. Phys. Conf. Ser. 2021, 1795, 012059. [Google Scholar] [CrossRef]
  38. Kumar, D.; Ghassemi, A. Geomechanical controls on frac-hits. In Proceedings of the SPE International Hydraulic Fracturing Technology Conference & Exhibition, Muscat, Oman, 11–13 January 2022. [Google Scholar] [CrossRef]
  39. Haghighat, A.; Ewert, J. Child/Parent Well interactions; study the solutions to prevent frac-hits. In Proceedings of the SPE Canadian Energy Technology Conference, Calgary, AB, Canada, 15–16 March 2022. [Google Scholar] [CrossRef]
  40. Xiang, H. Refracturing practice of tight oil reservoirs in Ma 56 Block, the Santanghu Basin. Spec. Oil Gas Reserv. 2017, 24, 157–160. [Google Scholar] [CrossRef]
  41. Sui, Y.; Liu, D.; Liu, J.; Jiang, M.; Liu, J.; Zhang, N. A new low-cost refracturing method of horizontal well suitable for tight oil reservoirs: A case study on Ma 56 Block in Tuha Oilfield. Oil Drill. Prod. Technol. 2018, 40, 369–374. [Google Scholar] [CrossRef]
  42. Ren, G.; Ma, X.; Zhang, S.; Zou, Y. Optimization of water injection strategy before re-fracturing. In Proceedings of the ARMA/DGS/SEG 2nd International Geomechanics Symposium, Virtual, 1–4 November 2021. [Google Scholar]
  43. Weng, X.; Kresse, O.; Cohen, C.; Wu, R.; Gu, H. Modeling of hydraulic-fracture-network propagation in a naturally fractured formation. SPE Prod. Oper. 2011, 26, 368–380. [Google Scholar] [CrossRef]
  44. Nolte, K. Fracturing-pressure analysis for nonideal behavior. J. Pet. Technol. 2011, 43, 210–218. [Google Scholar] [CrossRef]
  45. Zhu, H.; Song, Y.; Tang, X. Research progress on 4-dimensional stress evolution and complex fracture propagation of infill wells in shale gas reservoirs. Pet. Sci. Bull. 2021, 6, 396–416. [Google Scholar] [CrossRef]
  46. Lewis, R.W.; Sukirman, Y. Finite element modelling for simulating the surface subsidence above a compacting hydrocarbon reservoir. Int. J. Numer. Anal. Methods Geomech. 1994, 18, 619–639. [Google Scholar] [CrossRef]
  47. Gutierrez, M. Fully coupled analysis of reservoir compaction and subsidence. In Proceedings of the European Petroleum Conference, London, UK, 25–27 October 1994. [Google Scholar] [CrossRef]
  48. Settari, A.; Walters, D.; Behie, G. Reservoir geomechanics: New approach to reservoir engineering analysis. In Proceedings of the Technical Meeting/Petroleum Conference of The South Saskatchewan Section, Regina, 15–17 October 1999. [Google Scholar] [CrossRef]
  49. Chin, L.; Thomas, L.; Sylte, J.; Pierson, R. Iterative coupled analysis of geomechanics and fluid flow for rock compaction in reservoir simulation. Oil Gas Sci. Technol. 2002, 57, 485–497. [Google Scholar] [CrossRef]
  50. Fung, L.; Buchanan, L.; Wan, R. Couplled geomechanical-thermal simulation for deforming heavy-oil reservoirs. J. Can. Pet. Technol. 1994, 33. [Google Scholar] [CrossRef]
  51. Koutsabeloulis, N.; Hope, S. “Coupled” stress/fluid/thermal multi-phase reservoir simulation studies incorporating rock mechanics. In Proceedings of the SPE/ISRM Rock Mechanics in Petroleum Engineering, Trondheim, Norway, 8–10 July 1998. [Google Scholar] [CrossRef]
  52. Minkoff, S.; Stone, C.; Arguello, J.; Bryant, S.; Eaton, J. Staggered in time coupling of reservoir flow simulation and geomechanical deformation: Step 1-one-way coupling. In Proceedings of the Annual Simulation Symposium, Houston, TX, USA, 3–6 October 1999. [Google Scholar] [CrossRef]
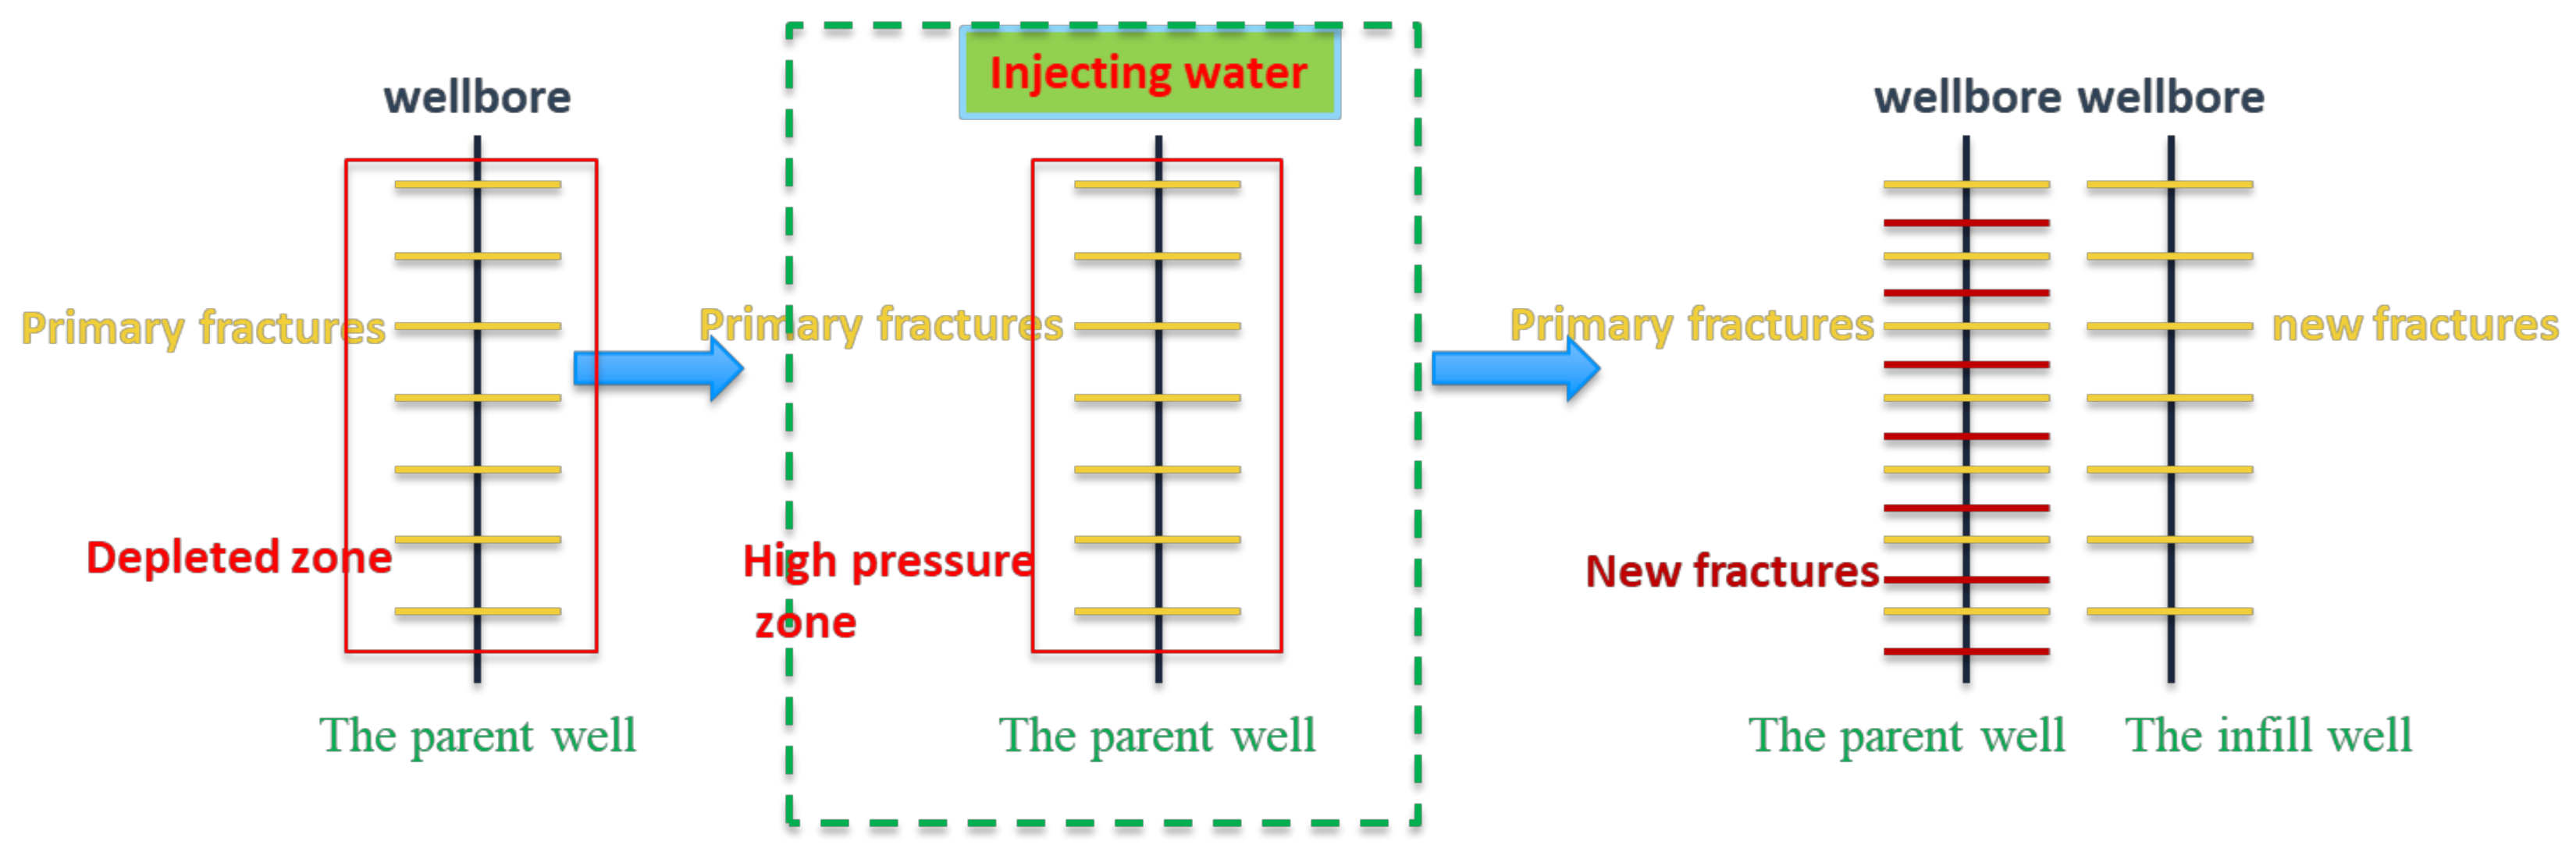
Figure 1. Illustration of the re-stimulation process.
Processes 10 01538 g001
Figure 2. Relative permeability of: (a) matrix; (b) hydraulic fractures.
Processes 10 01538 g002
Figure 3. Oil production history match.
Processes 10 01538 g003
Figure 4. Distribution of (a) pressure; (b) stress.
Processes 10 01538 g004
Figure 5. Fractures morphology of parent well and infill well after 1-year production (no water injected).
Processes 10 01538 g005
Figure 6. Cumulative oil production of different injection/production ratio, (a) parent well; (b) infill well.
Processes 10 01538 g006
Figure 7. Cumulative liquid production of parent well.
Processes 10 01538 g007
Figure 8. Water cut of parent well.
Processes 10 01538 g008
Figure 9. Cumulative liquid production of infill well.
Processes 10 01538 g009
Figure 10. Water cut of infill well.
Processes 10 01538 g010
Figure 11. Liquid production and water cut of the well group.
Processes 10 01538 g011
Figure 12. Distribution of: (a) pressure; (b) stress.
Processes 10 01538 g012
Figure 13. Fractures morphology of parent well and infill well after 4-year production (no water injected).
Processes 10 01538 g013
Figure 14. Cumulative oil production of different injection/production ratio, (a) parent well; (b) infill well.
Processes 10 01538 g014
Figure 15. Cumulative liquid production of parent well.
Processes 10 01538 g015
Figure 16. Water cut of parent well.
Processes 10 01538 g016
Figure 17. Cumulative liquid production of infill well.
Processes 10 01538 g017
Figure 18. Water cut of infill well.
Processes 10 01538 g018
Figure 19. Liquid production and water cut of the well group.
Processes 10 01538 g019
Table 1. Field data for oil layer of the base case.
ParametersValuesParametersValues
Matrix permeability, mD0.01Minimum horizontal principal stress, MPa45
Matrix porosity0.1Maximum horizontal principal stress, MPa55
Initial reservoir pressure, MPa39Overburden stress, MPa60
Initial oil saturation0.5Young’s modulus, GPa35
Reservoir thickness, m200Poisson’s ratio0.3
Bubble-point pressure, MPa15Tensile strength, MPa5
Total compressibility, kPa−12 × 10−6Reservoir temperature, °C85
Publisher’s Note: MDPI stays neutral with regard to jurisdictional claims in published maps and institutional affiliations.