Article

Incorporating Machine Learning in Computer-Aided Molecular Design for Fragrance Molecules

1
Department of Chemical and Environmental Engineering, University of Nottingham Malaysia, Broga Road, Semenyih 43500, Selangor, Malaysia
2
Center for Engineering and Sustainable Development Research, De La Salle University, 2401 Taft Avenue, Manila 0922, Philippines
*
Author to whom correspondence should be addressed.
Processes 2022, 10(9), 1767; https://doi.org/10.3390/pr10091767
Submission received: 31 July 2022 / Revised: 19 August 2022 / Accepted: 31 August 2022 / Published: 3 September 2022
(This article belongs to the Section Chemical Processes and Systems)

Abstract

:
The demand for new novel flavour and fragrance (F&F) molecules has boosted the need for a systematic approach to designing fragrance molecules. However, the F&F-related industry still relies heavily on experimental approaches or on existing databases without considering the consequences resulting from changes in concentration, which could omit potential fragrances. Computer-aided molecular design (CAMD) has great potential to identify novel molecular structures to be used as fragrances. Using CAMD for this purpose requires models to predict the olfaction properties of molecules. A rough set-based machine learning (RSML) approach is used to develop an interpretable predictive model for odour characteristics in this work. New rule-based models are generated from RSML based on the dilution and a number of different topological indices which identify the structure-odour relationship of fragrance molecules. The most prominent rules are selected and formulated as constraints in a CAMD optimisation model. The combination of several rules was able to increase the coverage of different classes of molecules. To model the performance indicators that vary over a range of properties, a disjunctive programming model is also incorporated into the CAMD framework. A case study demonstrates the utilisation of this methodology to design fragrance additives in dishwashing liquid. The results illustrate the capability of the novel RSML and CAMD framework to identify potential fragrance molecules that can be used in consumer products.

Graphical Abstract

1. Introduction

Fragrances are applied extensively as an attractive attribute in the formulation of many consumer products. The global flavours and fragrances (F&F) market size is expected to expand from the original value of USD 26.54 billion (2022) to USD 36.49 billion (2029) at a compounded annual growth rate of 4.7% [1]. The demand for novel fragrance molecules in the industry is greater than ever due to the stricter safety and environmental (e.g., biodegradability) regulations, which have led to the obsolescence of some existing products [2]. Unlike other senses, olfaction is poorly understood [2]. The design of fragrance molecules still heavily depends on empirical methods, either referring to the knowledge from experts or through experiments. This trial-and-error approach is too tedious to allow the exploration of all potential candidates, as fragrance molecules have complex structures. Thus, there is a risk of missing better fragrance molecules that have the potential to be incorporated into consumer products [3]. The conventional method is a resource-intensive process, which makes launching a new fragrance molecule costly and time-consuming [2]. Moreover, most of the fragrances’ odour descriptions in established databases are reported without the indication of concentration [2]. This could be another hurdle as the concentration of fragrance required in various products might be different.
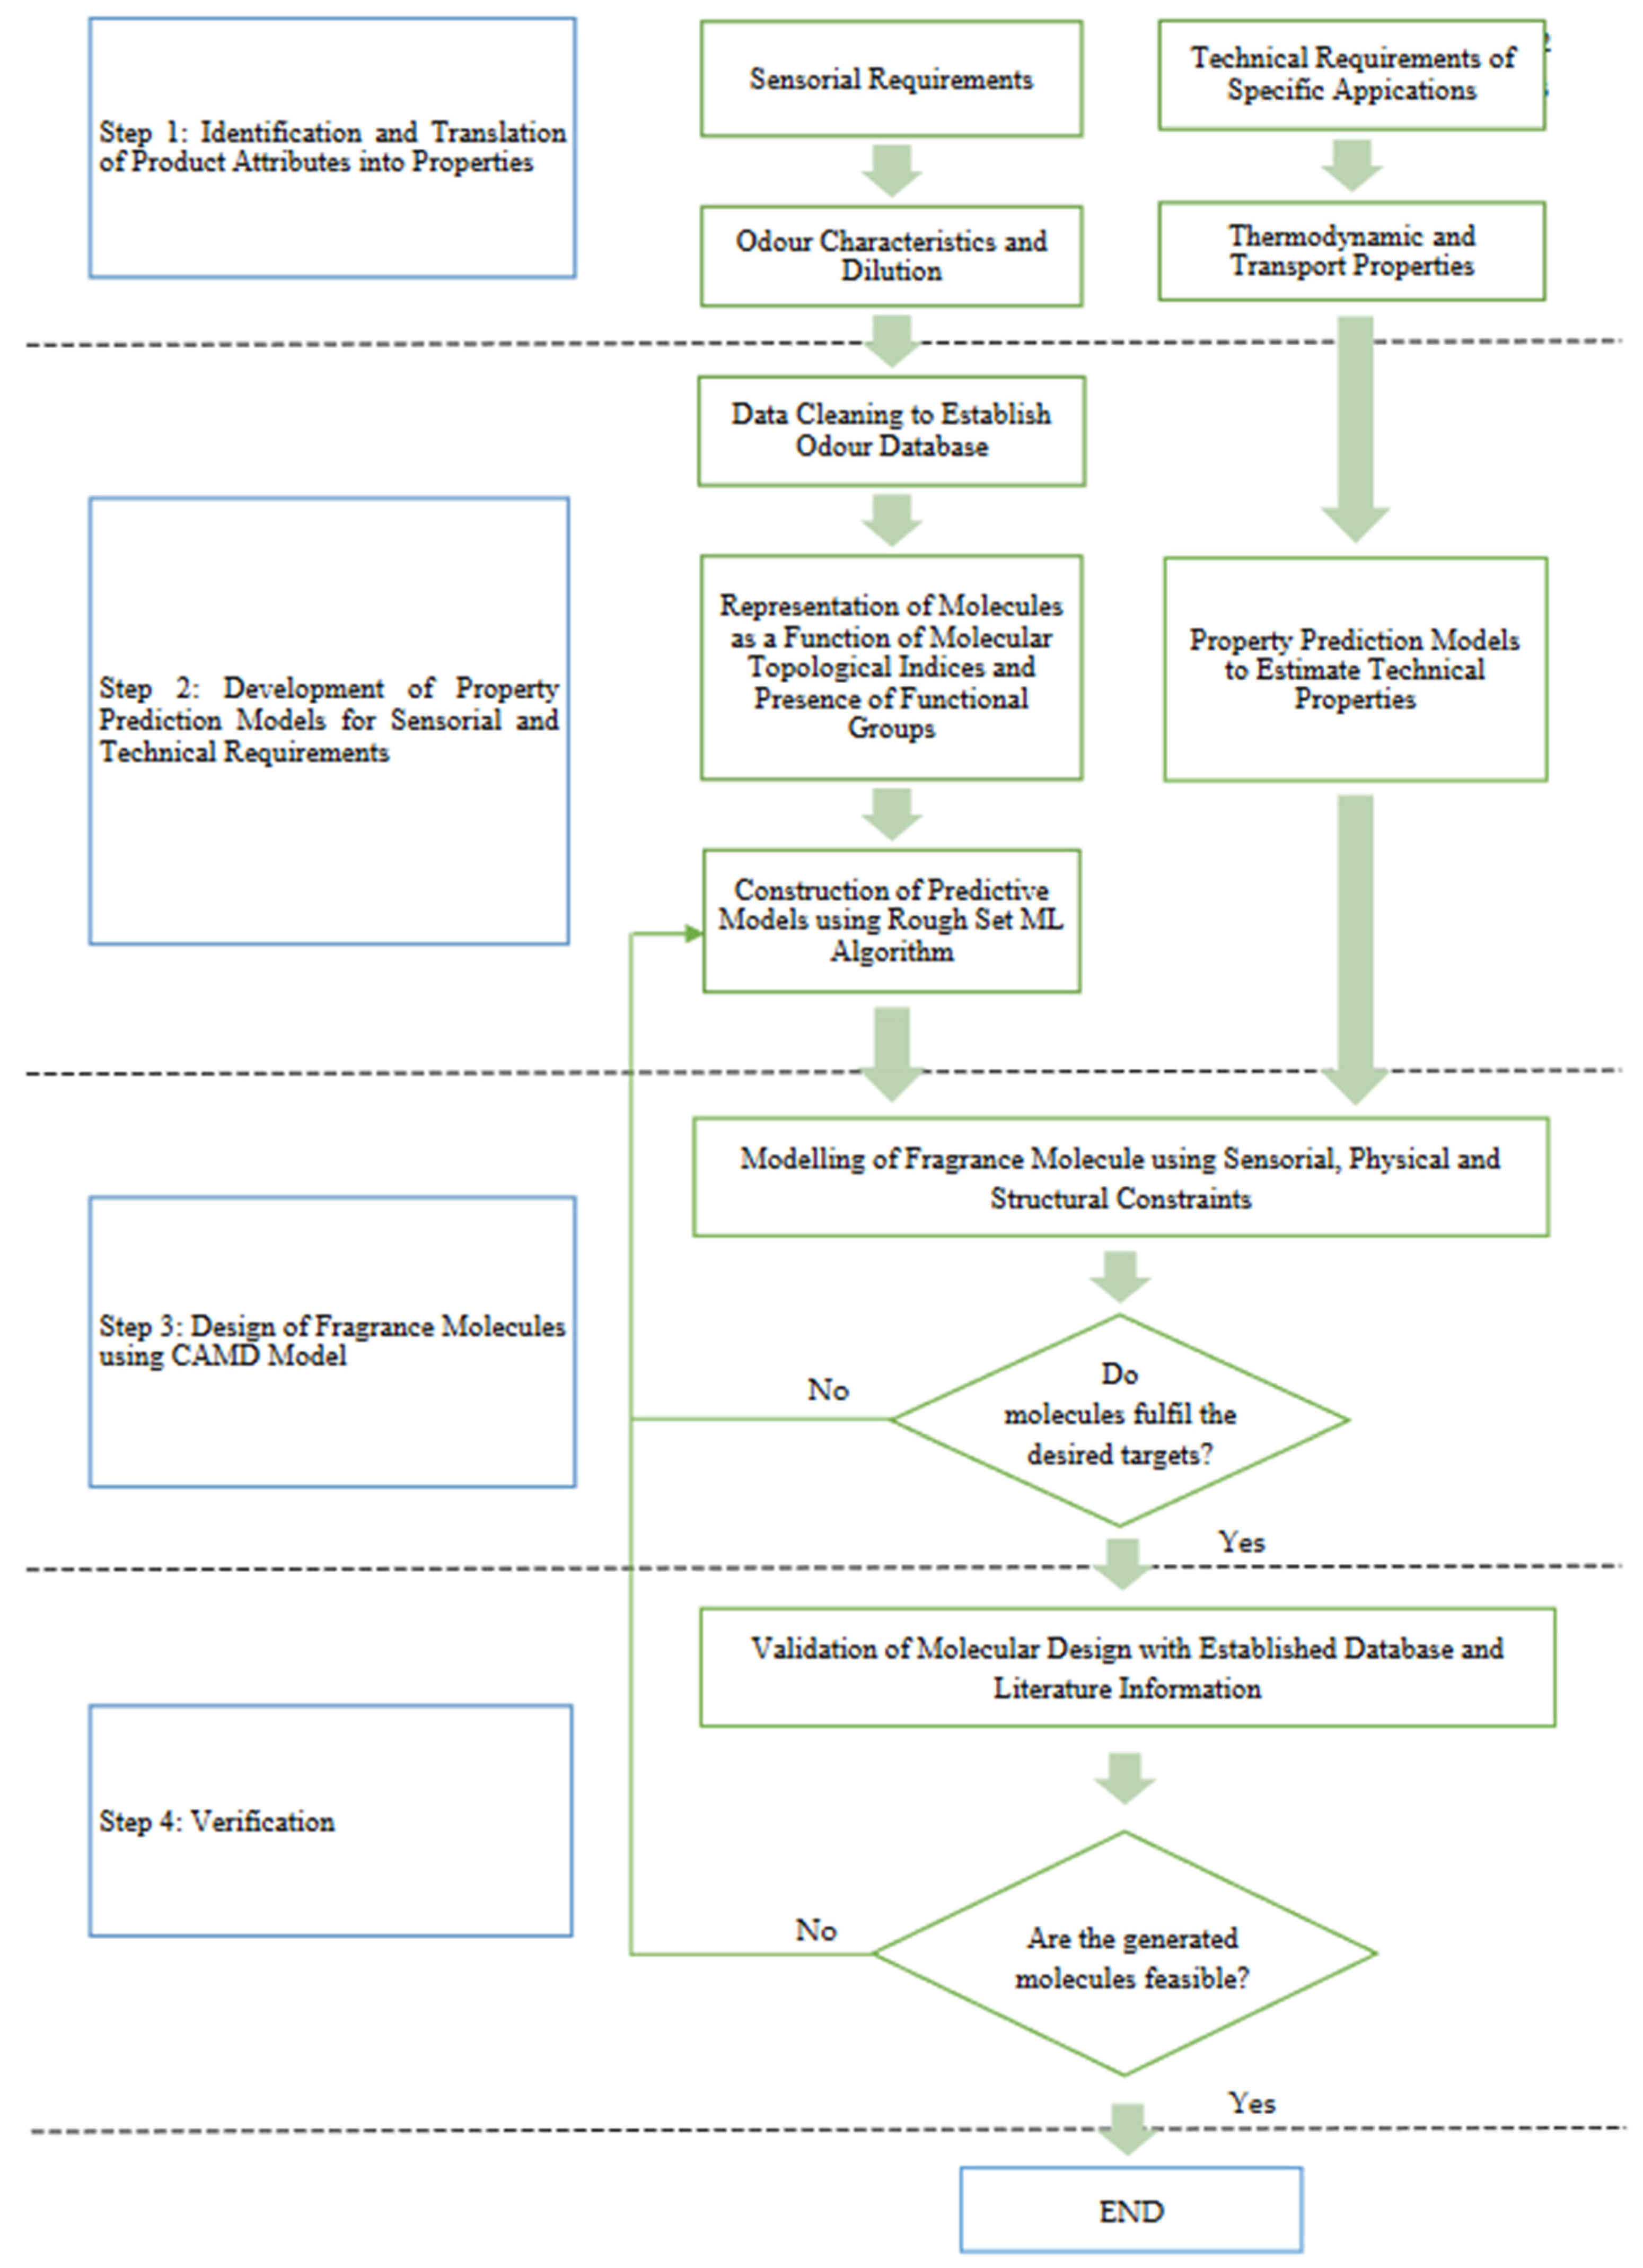
To address the challenges involved in the design of fragrance molecules, a systematic framework should be developed for designing and screening suitable fragrances that fulfil the product’s requirement before experimental verification. Computer-aided molecular design (CAMD) approach is a potential tool for the screening and/or design of fragrance molecules by predicting the molecular structure using a set of desired sensorial and technical properties. However, a pre-requisite for the initiation of CAMD modelling is property predictive models. Perceived odours are determined by the structure of a fragrance molecule, the latter of which can be described using structural, geometrical, topological, physicochemical, and electronic descriptors [4]. Hence, machine learning (ML) tools have the potential to develop prediction models by linking the molecular structure to properties using topological indices as the numerical representation of the structure.

1.1. Computer-Aided Molecular Design (CAMD)

CAMD is a reverse engineering approach to screening novel chemicals by combining structural groups systematically to yield high-performance molecules [5]. In CAMD, property prediction models, such as group contribution (GC) models, are required. GC methods assume that the properties of a molecule can be estimated by the number of occurrences of different sub-structures, known as “groups”. In addition to GC methods, topological indices (TIs), one of the structural descriptors, were employed by the quantitative structure-property relationship (QSPR) for property estimation. Some of the common TIs, which include connectivity index, shape index, etc., can be used to differentiate very similar structures like isomers [6].
CAMD is applied widely in various applications related to solvent design [7] and integrated process and product design problems [8]. In recent years, there have been several developments in the application of these tools in the field of product development as well. Liu et al. [9] coupled ML-based atom contribution (MLAC) with CAMD to forecast the surface-charged density profile and construct a solvent for ibuprofen with improved economic, safety, health, and environmental aspects. An artificial neural network model was utilized to generate the structure-odour relationship (SOR) model for aromatic component mixtures by utilising the profiles of molecular surface charge density (r-profiles) as the descriptors [10]. It was also employed for the identification of potential solvent candidates that allow bio-oil to satisfy targeted properties with minimal solvent addition [11]. Moreover, Yee et al. [12] developed a framework for personal care product design by incorporating safety, health, and performance aspects in CAMD. By imposing constraints for safety and health hazards in CAMD, molecules generated were less harmful while possessing excellent product performance. There are some recent works in the CAMD field related to fragrance products. MILP/MINLP models for the design and screening of fragrance in shampoo were developed by Zhang et al. [3]. The CAMD model was utilised to remove the molecules that are out of the range of the constraints and properties of fragrant molecule design. In addition, fragrances in body lotion were modelled using rules generated with an enhanced hyperbox ML coupled with CAMD [13]. The hybrid CAMD framework was able to produce a variety of viable compounds that met all structural and physical property requirements. In both works, CAMD was proven to be effective in developing potential fragrant molecules for consumer products. Comprehensive reviews of the latest developments in this field can be found in the review articles by Chemmangattuvalappil [14] and Zhang et al. [15].
A recent contribution has demonstrated that rough set-based machine learning (RSML) can be used to develop a model to predict the fragrance of molecules and used the developed model for identifying novel fragrant molecules [16]. In this previous work, a single molecular descriptor called molecular signature was used to build a predictive model for fragrance. However, the different molecular characteristics cannot be covered using a single descriptor. Moreover, the presence or absence of certain molecular signatures was used in building the predictive model. The shortcoming of such an approach was that typical databases contain different types of molecules with very few common signatures appearing in the different molecules. Therefore, the model had to be developed using a very small subset of the database. While this approach can develop models with a low number of false positives, it leads to a high percentage of false negatives. Finally, the dilution of the fragrance molecule was not incorporated in the development of the model. However, from the fragrance molecule database, it is clear that the same molecules possess different fragrance characteristics at different concentrations. To address the limitations of the previous RSML approach, there is a need for a model that makes use of various molecular descriptors that consider a variety of structural characteristics and also the ability to make use of the available data. The approach developed in this model has attempted to address these research gaps.
To conclude, CAMD is an important approach to expanding the portfolio of chemical product design. Prediction models for scent and physical properties must be available so that the desired attributes can be incorporated as constraints in CAMD. However, due to the lack of established mechanistic odour predictive models, it is necessary to develop an empirical model for aroma using ML. This approach can generate models from data by detecting and summarising the underlying patterns. The potential of ML to generate odour predictive models can address the inherent lack of understanding of the olfaction process.

1.2. Topological Indices (TIs)

In general, the models of group contribution (GC) are extensively applied to describe the pure component properties based on molecular structure. However, differentiation of molecule position in a compound cannot be achieved by the additive group contribution methods. Even a small distinction of group position in isomers might affect the odour characteristic of molecules [17]. Since fragrances are made up of multiple building blocks, there should be other structural attributes that contribute to fragrance in addition to the groups [3]. Thus, topological indices, the most used descriptors for chemical structure, have been used in this study to relate molecular structure to their fragrance.
Topological indices (TIs) are molecular structure descriptors that are generated from a chemical molecular graph that characterises its topology. There are a huge number of topological indices, which can be further categorised into a few groups such as degree, spectrum and distance [18]. Representing the chemical species using Tis provides convenience as they encode the topological structure into a mathematical form. TIs are applied extensively in developing QSPRs, which are mathematical correlations between molecular structures and molecular properties [19]. For instance, TIs were utilised in QSPR modelling to predict the biodegradability of the molecules for the development of safer fragrance molecules [20]. The results have shown that there are two remarkable TIs that contribute to the biodegradability of the molecules studied.
In a related study, De Mello Castanho Amboni et al. [21] explained that the structural parameters, including TIs, are related to the odour of aliphatic esters. From the QSAR study, it is notable that the TIs such as the electro topological state index and second order shape index, Kappa 2, are the relevant molecular descriptors for odour prediction. Nevertheless, the study conducted by Chacko et al. [22] has shown that the third-order shape index, Kappa 3, is one of the most crucial TIs for the categorisation of distinct odours. From the study by Ham and Jurs [23], the first-order chi connectivity index and molar refractivity are the distinguishing characteristics of musk and non-musks. Therefore, several TIs are used in this study for the development of odour-predictive models as they can shed light on the structure-odour relationship of fragrance molecules. Since there are no comprehensive predictive models for fragrance prediction, machine learning approaches have been explored to relate topological indices to olfaction.

1.3. Rough Set-Based Machine Learning (RSML)

ML is a subset of artificial intelligence (AI) and consists of techniques to discover patterns in data, which can then be used for future prediction or other related tasks [24]. Artificial neural networks (ANNs) and support-vector machines (SVMs) are particularly versatile and popular supervised ML techniques [25]. Despite the extensive applications of SVM and ANN in QSPR, QSAR, and GC modelling, their black box nature is a crucial weakness. The outputs of ANN and SVM cannot be translated into insights easily, making it difficult to support the decision provided by the algorithms [26]. This lack of inherent interpretability can only be addressed using additional algorithms [27]. One alternative approach is the utilisation of inherently interpretable models [28]. For example, hyperbox and RSML techniques can generate rule-based predictive models that are directly interpretable because they readily map to human thought processes. Because of this feature, they are better alternatives for the prediction of olfaction characteristics. Hyperbox ML has significant potential due to its ability to provide intuitive prediction accuracy in the identification of disjoint data regions [29]. However, there are computational challenges with large datasets with imperfections (e.g., non-deterministic patterns). On the other hand, RSML has advantages for the determination of more odour characteristics. RSML has proven to be especially robust for dealing with vagueness, imprecision, inconsistency and uncertainty in datasets [30].
Rough set theory (RST) which was first introduced by Pawlak [31], possesses the rough equality key concept for the designated sets in a given space. An approximation space is considered a pair ( U , R ) , where U is a certain set known as the universe and R U 2 is an indiscernibility relation [31]. In RST, any vague concept will be substituted by a pair of precise concepts, which is known as the lower and upper approximation of the vague concept [32]. The major advantage of utilising RST is that there is no preliminary or additional information required regarding the data [33]. RST has been applied in the areas of decision making, pattern recognition and knowledge acquisition. The very few early applications of rough set theory are mainly in the medical field for clinical data reduction applications and decision-making scenarios [34], rough classification of highly selective vagotomy (HSV) patients [35], reduction in information systems for medical diagnosis [36], etc. Recently, RSML has been employed to determine secure geological reservoirs to minimize the unintended release of CO2 by analysing data from secure and insecure storage sites of CO2. The results showed the prediction models generated from RSML are comparable with the site selection rules that were constructed based on proficient knowledge [37]. In addition, the RST was utilised as the front-end processor for deep learning to reduce the redundant influencing factors and to identify the critical factors of building energy consumption [38].
The key concept of RST is its indiscernibility relation, which could be tabulated into an information table. It is also known as an information system or attribute-value table, which consists of objects and their corresponding attributes [32]. The latter is comprised of conditional attributes (inputs) and decision attributes or classes of the object (outputs). An information system is defined by a pair ( U , A ) , where U is the finite nonempty set of objects (universe) and A is the objects ‘attributes. For every attribute a A , it has a value set defined by a value, V a as shown in Equations (1) and (2) [39].
a : U V a
α = ( U , C   { D } )
where C is the set of conditional attributes, and D is the decision attribute.
Furthermore, RST also enables the identification of reducts, defined as a minimal subset of attributes that preserve the indiscernibility relation. In the context of RSML, a reduct is a reduced set of attributes that can be used to generate a rule-based model. It should be noted that there may be more than one reduct set in a single dataset. Therefore, further analysis is required to determine which reduct can generate more feasible rules. Another important concept in RST is the intersection of all reducts, which is known as the core. It is the most important subset of attributes that contribute to classification accuracy [32].
For every information system, there is a set of decision rules known as a decision algorithm. Each decision algorithm reveals certain properties that fulfil both the total probability theorem and Bayes’ theorem [40]. Hence, these properties provide a new method for concluding the data by using three terms, namely strength ( σ x ) , certainty ( c e r x ) and coverage ( c o v x ) , as presented in Equations (3)–(5). Let S = ( U , C , D ) , where C is the conditions and D is the decisions [33].
σ x ( C , D ) = s u p p x ( C , D ) c a r d ( U )
c e r x ( C , D ) = c a r d ( C ( x )   D ( x ) ) c a r d ( C ( x ) ) = s u p p x ( C , D ) c a r d ( C ( x ) ) = σ x ( C , D ) π ( C ( x ) )
c o v x ( C , D ) = c a r d ( C ( x )   D ( x ) ) c a r d ( D ( x ) ) = s u p p x ( C , D ) c a r d ( D ( x ) ) = σ x ( C , D ) π ( D ( x ) )
where π ( C ( x ) ) = c a r d ( C ( x ) ) c a r d ( U ) and π ( D ( x ) ) = c a r d ( D ( x ) ) c a r d ( U ) .
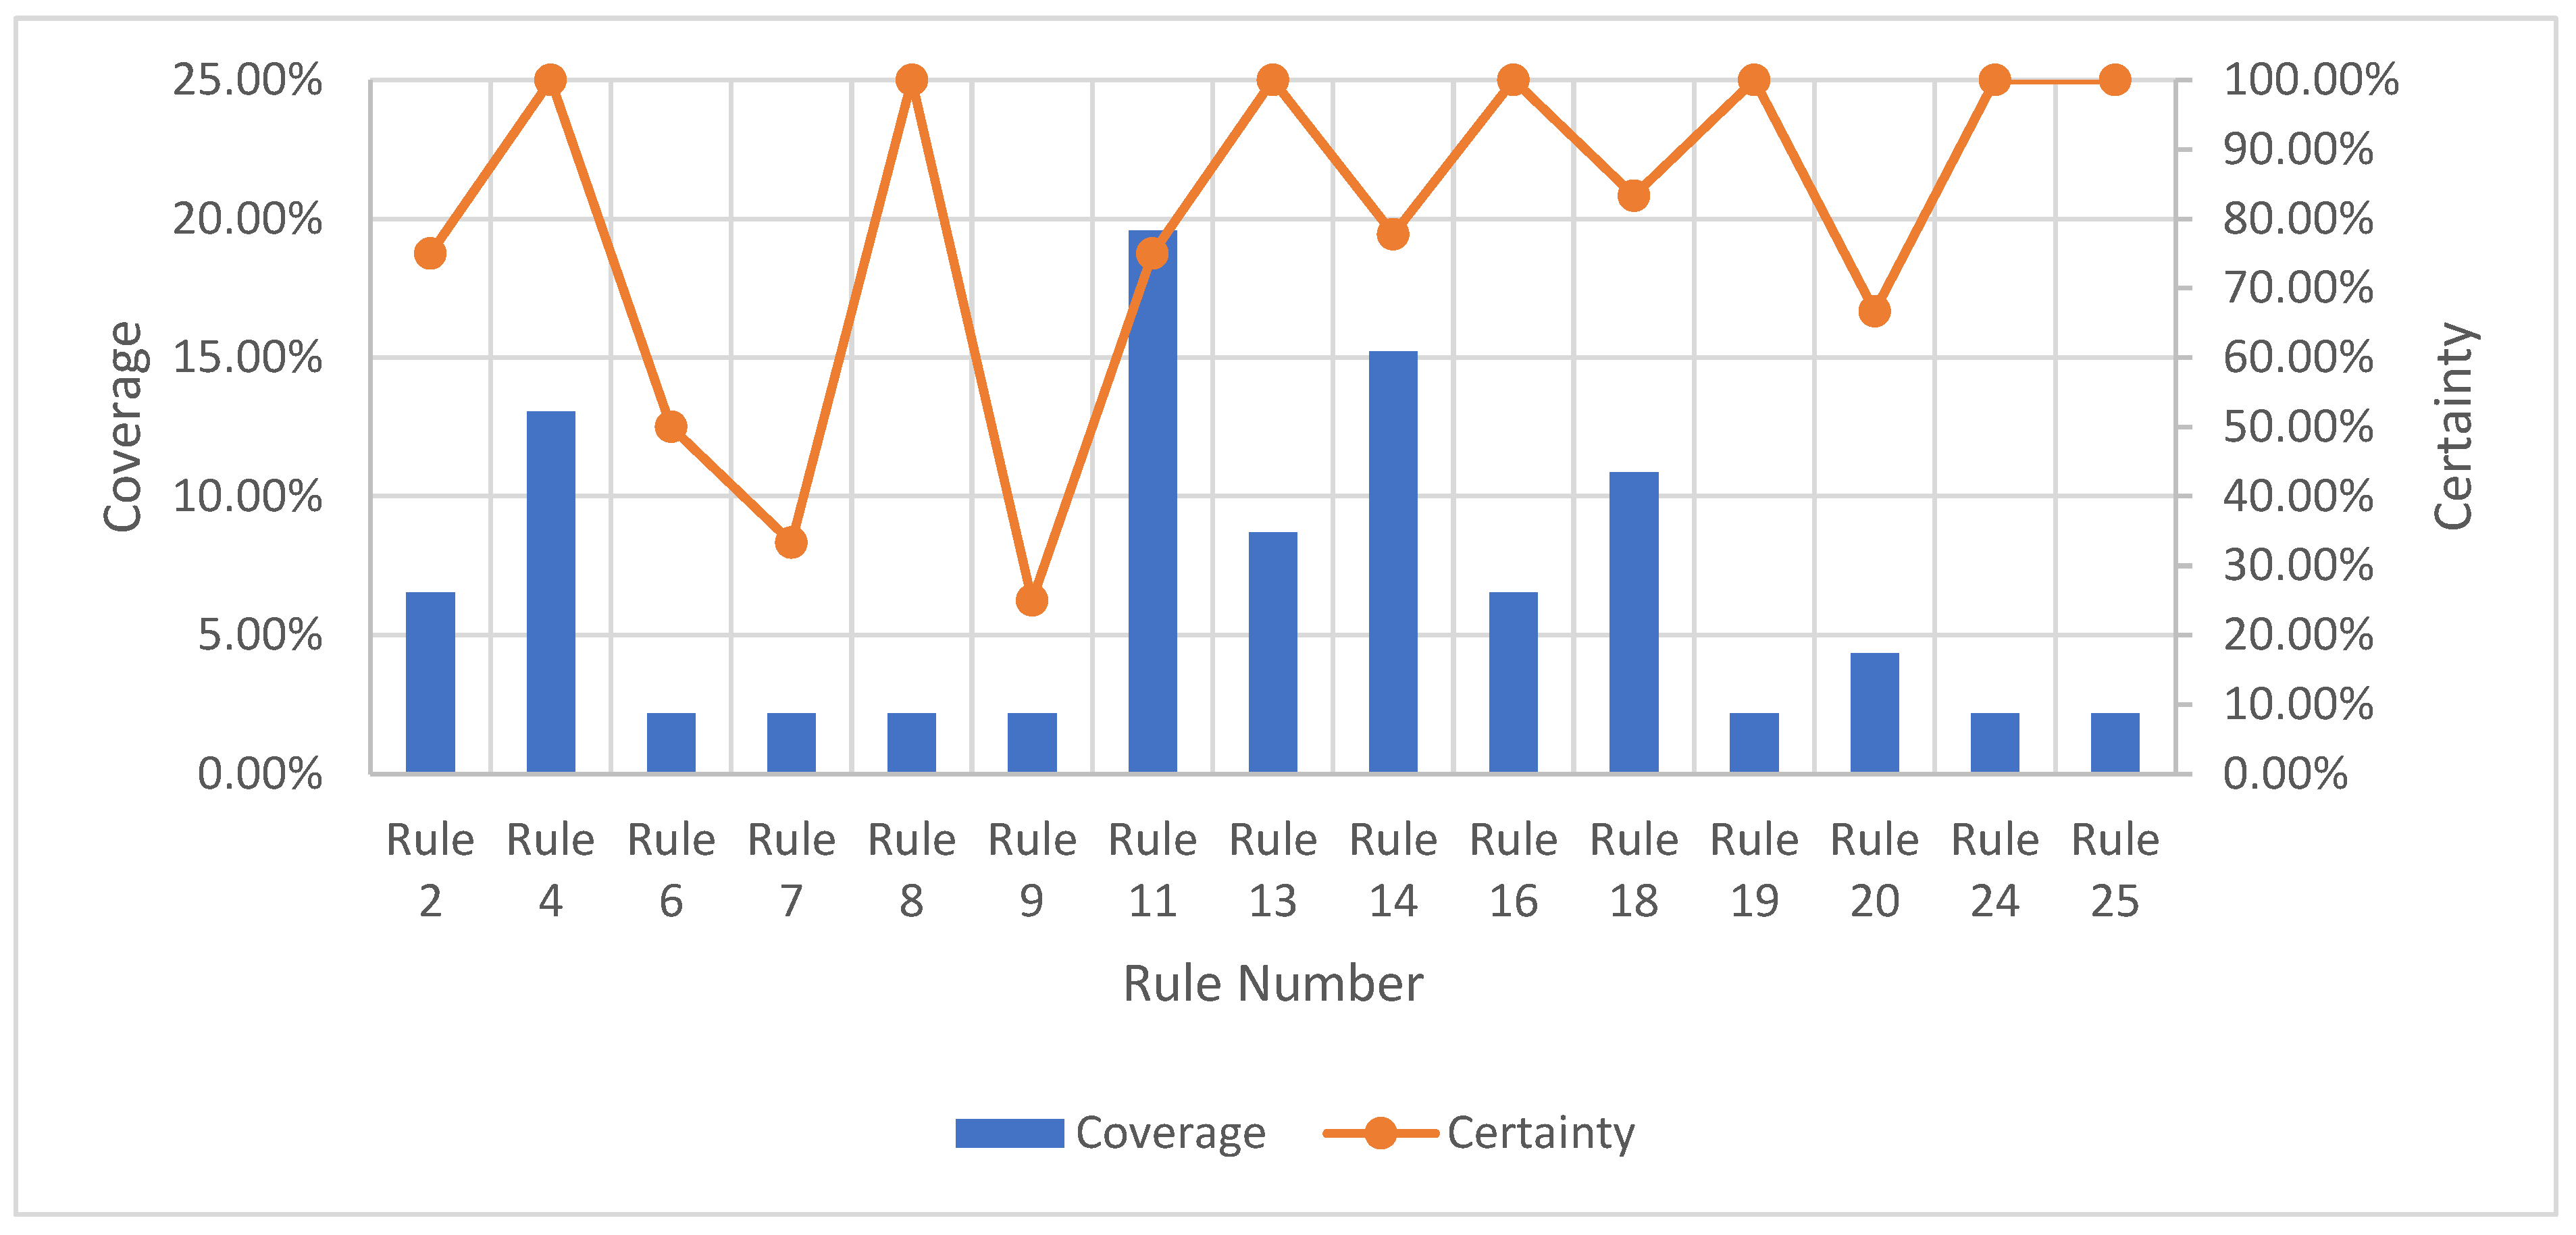
The strength represents the total number of samples that follow the generated rule divided by the total number of samples. The certainty factor is defined as the frequency of samples having the decision, D , in the sets of samples that fulfil conditions, C . Lastly, the coverage factor is the frequency of samples possessing conditions, C in the decision class. The former measures the predictive reliability of a rule, whilst the latter measures the generalisation power of a rule. A higher certainty indicates a lower chance of a molecule being misclassified, whereas a high coverage suggests that a rule is a good approximation of an underlying general principle. These three parameters will provide quantitative evidence to help select the most useful rule-based models.
In this work, a predictive model for olfaction has been developed through RSML using structural attributes and dilution in conditional attributes. Subsequently, the most promising deterministic rules generated from RSML were integrated as constraints into CAMD, along with the structural and physicochemical constraints. For the physical properties, such as the solubility parameter and LC50, property classification is carried out, as their impacts towards the functionality of fragrances are significant only when across ranges. It is to be noted that many of the target properties are not continuous in nature. For example, the impact of toxicity and volatility does not change continuously. Therefore, the decisions on these attributes have to be measured based on the classification of toxicity or volatility classes. Current CAMD approaches only treat the properties that are continuous in nature. Therefore, disjunctive programming has been used to treat the properties where the changes over property ranges are significant. The fragrance molecule design using CAMD is formulated as a multi-objective optimisation (MOO) problem and solved using the fuzzy optimisation approach.

2. Materials and Methods

For the design of fragrance molecules, an integrated ML and CAMD framework is developed and divided into 4 main steps, as illustrated in Figure 1. The physical properties of the fragrance molecules are estimated using GC-based models, whereas predictive models for sensorial attributes are developed using the RSML algorithm.

2.1. Step 1: Identification and Translation of Fragrance Attributes into Properties

In various types of consumer products, the role of fragrances in the formulation is to improve odour qualities. In addition to the odour characteristics and the endurance of the fragrances, the molecules must also meet several requirements for the product. It has to be safe for use, must function effectively, and must be able to mix homogeneously. In terms of safety and health, LC50 is identified as a crucial parameter to ensure the molecule is within the safety threshold limit and can be applied safely on the skin. Moreover, the solubility of fragrance is vital to ensure that a homogeneous product is formed. Overall, the needs required in the design of fragrance molecules are categorised into both technical and sensorial requirements. Once the target attributes of the fragrance molecules in a specific product are identified, they are incorporated into quantitative properties, as shown in Table 1.

2.2. Step 2: Development of Property Predictive Models for Sensorial and Technical Requirements

Prior to the formulation of the CAMD model, the aforementioned attributes for both technical and sensorial requirements of fragrances have been approximated using relevant predictive models of property. There are no adequate existing models that can be implemented to predict the structure/odour relationship. Therefore, rough set machine learning was applied for the development of predictive models to predict olfaction characteristics using topological indices.

2.2.1. Step 2(a): Development of Predictive Model for Sensorial Requirements Using Cheminformatics and ML Tools

Based on the above-mentioned works, topological indices, including connectivity index, electro-topological state index and second and third order Kappa indices, were utilised as the numerical representation of odour characteristics to cover the sensorial requirement in this study. Apart from this, the contributions of functional groups such as esters, ethers, and aldehydes in fragrance molecules were considered as well. In addition, dilution (concentration) was taken into consideration as one of the conditional attributes as it might affect the odour intensity, pleasantness, and familiarity. Moreover, certain molecules might pose different odour characteristics at different dilutions. For instance, the five main descriptors for 1-heptanoic acid at high concentrations are “paint”, “chemical”, “varnish”, “woody” and “musty”, but at low concentrations, the five main descriptors are “paint-like”, “herbal”, “violets”, “fruity” and “floral” [41]. The conditional attributes used in this work are summarised in Table 2.

Data Cleaning

To develop an ML predictive model that relates the structure of fragrance to its odour, an existing database was required for the training and validation of the conditional attributes. In this work, a database that consists of 55,000 entries from Keller and Vosshall [42] was used. Of the 55,000 entries, there are a total of 480 molecules with different dilutions. A total of 55 subjects rated their perception on the most dominant odour characteristic for 480 molecules, each present at two distinct dilutions. The odour characteristics were classified into 20 semantic descriptors, namely “edible”, “bakery”, “sweet”, “fruit”, “fish”, “garlic”, “spices”, “cold”, “sour”, “burnt”, “acid”, “warm”, “musky”, “ammonia/urinous”, “decayed”, “wood”, “grass”, “flower” and “chemical”. Based on the subjects’ ratings, the odour characteristic of each molecule was converted on a scale of 0 to 100. A score of “0” indicates that the specific descriptor is not applied to the smell of the tested molecule, whereas a score closer to “100” represents the descriptor is more suited to the molecule’s smell. For each entry, there was information on whether the molecules were odourless or vice versa. For those with detectable smell, these were listed as “can smell” whereas the molecules with no detectable smell were regarded as “cannot smell” by each subject. Since the focus is on those molecules with detectable smell, the percentage of the total number of entries for each molecule at 2 different dilutions with a detectable smell was evaluated for further analysis. For those molecules with detectable smells equal to or larger than the lower boundary of 70%, the semantic descriptor with the highest value was classified as their final odour. The final descriptor for each molecule was then further categorised into 3 main classes: pleasant, no smell, and unpleasant, as shown in Table 3. In the classification, a 0.1 extra score was added for the unpleasant class descriptor to minimise false positive results. Each molecule at the specific dilution can be classified under one odour characteristic only.

Evaluation of Topological Indices and Presence of Functional Groups

The topological indices used in this work are listed in Table 4. Firstly, the connectivity index, χ 1 v , which is defined as the sum of specific bond contributions estimated from the hydrogen suppressed molecular graph’s vertex degrees, δ i , was developed from Randi’s branching index [43]. The identification of the atoms, as well as their connectivity in the molecular skeleton, are encoded by the 1st-order chi index [44]. The bond contributions to the connectivity index, C 1 s v , can be calculated using Equation (6). Here, χ 1 v is a first-order connectivity term that may be defined as the sum of edges (bond) terms, C 1 s v , represented in Equations (7) and (8).
Next, the electro-topological state (E-state) index is an atom-level descriptor that encodes an atom’s inherent electronic state while taking into account the electronic effect of other atoms in the molecule [45]. Equation (9) expresses the E-state index for the atom i. In a molecule, the presence of other atoms causes disturbance to the intrinsic value of the atom since different atoms might have different electronegativities [46]. Thus, the intrinsic value, I i of an atom can be determined from Equation (10), where N i indicates the principal quantum number, and δ i v and δ i are valence electron counts and sigma electron number in the hydrogen suppressed graph. The perturbation factor, Δ I i , shown in Equation (11), can be used to assess the influence of a molecule’s electronic field on a given atom inside that molecule, where r i j represents the graph separation factor, which is the number of skeletal atoms in the shortest path between atoms i and j [45].
The Kappa shape index takes into account the spatial density of atoms and encodes information on the size, cyclicity degree, and centralization degree or branching separation degree [47]. The second-order shape index, 2 κ , refers to the count of two-bond paths, P 2 i and is represented in Equation (12), where A is the number of atoms present in the molecule, P 2 i is the number of two-path fragments (two adjacent bonds), and α is the increment or decrement of the counting of a particular atom based on its size contribution relative to C(sp3) [44]. The basis of the third-order shape index, 3 κ , is the count of three contiguous paths, P 3 i , and is presented in Equations (13) and (14), respectively, where P 3 i is the number of three-path fragments [45].
Furthermore, molecular groups which consist of an aromatic ring and oxygen, such as esters and ethers, are commonly present in fragrance molecules, wherein the ether groups assist in differentiating sweet and non-sweet molecules, whereas ester groups assist in identifying fruity odour compounds [3,23]. The evaluation of these topological indices and identification of the presence of functional groups of fragrance molecules were done by using RDKit. It is an open-source chemoinformatic tool used in descriptor generation for machine learning which assists in the calculation of topological indices.

Construction of RSML Property Predictive Model

As mentioned earlier, RSML was selected to develop predictive property models for sensorial requirements as it is an interpretable model. Table 5 tabulates a simplified version of the fragrance information system, where C1 is a continuous attribute, whereas C2 and C3 are integer attributes.
After completing the information system, the input data were used to conduct the attribute reduction to minimise the unnecessary attribute subsets that enable the same element classification. In Table 5, U = { X 1 ,   X 2 ,   ,   X 8 } is the finite non-empty set, whereas R = { C 1 , C 2 , C 3 } is the attribute set. The indiscernibility ( I ) of complete relation R , C 1 & C 2 , C 1 & C 3 and lastly, C 2 & C 3 are displayed in Equations (15)–(18) individually.
I ( R ) = { X 1 , X 5 } , { X 2 , X 6 , X 8 } , { X 4 , X 7 } , { X 3 }
I ( R { C 3 } ) = I ( R )
I ( R { C 2 } ) = I ( R )
I ( R { C 1 } ) = { X 1 , X 2 , X 5 , X 6 , X 8 } , { X 3 , X 4 , X 7 }
From Equations (16)–(18), attributes C 2 and C 3 are superfluous, as their removal from the relation R would not affect the results. Attribute C 1 , therefore, can be stated as indispensable. Hence, it can be concluded that the classification power of all conditional attributes C 1 , C 2 , C 3 is identical to the attribute classification pairs of C 1 & C 2 or C 1 & C 3 . C 1 poses as the reduct intersection; thus, it is also identified as the core of attributes. Since the pairs of I ( C 1 , C 2 ) I ( C 1 ) and I ( C 1 , C 2 ) I ( C 2 ) , attributes C 1 & C 2 are classified as independent and { C 1 & C 2 } is generalised as a reduct of R . Similarly, { C 1 & C 3 } is also proven to be a reduct by using the same approach. Next, each reduct was utilised to generate a set of deterministic rules separately by omitting the superfluous attribute. For example, attribute C 3 was omitted during rule generation for reduct { C 1 & C 2 } . A total of 4 rules were generated in this example, as described:
  • Rule 1: (C1 < 2.535) ⇒ (D = 1)
  • Rule 2: (C1 < 3.63) & (C2 < 1) ⇒ (D = 1)
  • Rule 3: (C1 ≥ 2.535) & (C2 ≥ 1) ⇒ (D = 2)
  • Rule 4: (C1 ≥ 5.775) ⇒ (D = 3)
For this study, in the actual information table, there are 8 conditional attributes and 1 decision attribute with 3 categories, namely “pleasant”, “no smell” or “unpleasant”. In this work, out of 954 molecules (477 molecules at two distinct dilutions), 207 molecules were utilised as a training set, whereas 88 were used as the validation set. Some of the molecules are excluded because the original dataset contains a large number of molecules with no smell, or the scores given by the subjects were inconclusive. Reducts were generated from training data inputted and applied to the decision algorithm to generate decision rules. Subsequently, the rules generated were then validated using the validation dataset to evaluate the coverage and certainty of each rule. Based on the rule validation results using the validation dataset, those rules with higher coverage and certainty higher than or equal to 75% were selected to be used as the constraint for sensorial requirements in CAMD. The complete coverage of molecules is not possible as the condition of all molecules satisfying one rule is unreasonable. The lower bound of certainty was set as bigger than or equal to 75% after accounting for the possibility of variation due to olfaction subjectivity. The reducts and rule generation were conducted using ROSE2 [48].

2.2.2. Step 2(b): Development of Predictive Property Model for Technical Requirements Using Group Contribution (GC) Method and Connectivity Indices

GC methods were utilised for the prediction of technical attributes, which are identified in Step 1. The general form of the property estimation model is depicted in Equation (19).
f ( X ) = i N i C i
where C is the property contribution of group i, and N is the group occurrence number in the molecule. All the property models for desired attributes are depicted in Table A1 of Appendix A.
However, for some properties, there are several missing group contributions. Therefore, the atom-connectivity index-based method introduced by Gani et al. [49] was employed to calculate the corresponding missing group contributions. Equation (20) dictates the pure-component property model used for viscosity [50].
F ( θ ) = i ( a i A i ) + b ( χ 0 v ) + 2 c ( χ 1 v ) + d
where F ( θ ) is the viscosity function, χ 0 v and χ 1 v are the zero and first-order connectivity indices, A i is the number of occurrences of the ith atom in the molecule, a i is the atom contribution, b and c are the adjustable parameters and d is a constant.

Disjunctive Programming Algorithm

To ensure that the generated fragrance molecules will result in a homogeneous mixture and will be non-hazardous, the property constraints of the solubility parameter and LC50 were incorporated. However, there is no advantage in maximising the solubility parameter or minimising LC50 directly. This is because the generated fragrance molecule is considered feasible if its solubility parameter and LC50 fall within the ranges. Therefore, the solubility parameter and LC50 constraints were represented through the property range, whilst the property value must fall within this range to make sure the molecules fulfil the specified requirements. In these property ranges, there exist several property intervals, and the property is considered to be of the same level of acceptability within that interval. Those intervals have produced a disjunction for the constraint. Disjunctive programming is one of the modelling approaches that utilises discontinuous functions to overlap abrupt changes over decision variables [51]. Thus, it is suitable to be applied for these properties.
Let the property class change to a different class above a boundary value p s w i t c h . A score of I A is allocated below p s w i t c h . Meanwhile, another score, I B , is assigned above or equal to p s w i t c h . A general equation to illustrate the classification score model is shown in Equation (21) [52].
I p = {     I A     p < p s w i t c h     I B     p p s w i t c h
The functions are then converted into mixed-integer formulation by incorporating a binary integer variable, I , as listed in Equation (22).
I p = I A I + I B ( 1 I )
subjected to I = {   0   p p s w i t c h   1   p < p s w i t c h .
Therefore, in the CAMD modelling, the constraint shown in Equation (23) is included to ensure that the correct value of I is being assigned to satisfy the condition above.
( p L p s w i t c h ) ( 1 I ) p p s w i t c h < ( p U p s w i t c h ) ( I )           I { 0 , 1 }
where p L and p U refer to the lower and upper boundaries for a feasible p value. When p is smaller than p s w i t c h , the term “ p p s w i t c h ” becomes negative, causing I to be 0 to fulfil the constraint. In contrast, the term “ p p s w i t c h ” becomes positive when p is larger than p s w i t c h , forcing I to be 1.

2.3. Step 3: Design of Fragrance Molecule Using CAMD Model

In the formulation of a fragrance design problem, a mixed integer linear program (MILP) is used. The objective function of the CAMD model was laid out based on property and structural constraints. The generated RSML algorithm decision rules were then included based on the sensorial requirements in Step 2(a). Since there can be numerous rules generated to classify a “pleasant” molecule, the rules with the highest degree of coverage and certainty were utilised as the constraint in the optimisation model.

2.3.1. Step 3(a): Formulation of Structural Constraints

For a set of building blocks, some structural constraints are defined to generate feasible molecules that do not contain any free bonds. The first step is to determine a set of suitable first-order molecular groups that form the potential building blocks for fragrance molecule design. The first-order molecular groups considered in this design are shown in Appendix B. The structural constraints in the optimisation model are formulated in Equations (24)–(27). The following sets are defined:
G1 = {i|i is a first-order group};
ID = {id|id is a first-order group}.
Next, the binary variable y i 1 , i d 1 , i 2 , i d 2 indicates whether a group i 1 with id i d 1 ( i 1 , i d 1 ) is attached to another group i 2 with id i d 2 ( i 2 , i d 2 ) , in which i 1 , i 2 G 1 and i d 1 , i d 2 I D , as shown in Equation (24).
y i 1 , i d 1 , i 2 , i d 2 = { 1 ,         group   ( i 1 ,   i d 1 )   is   connected   to   group   ( i 2 ,   i d 2 ) 0 ,         otherwise
Besides that, another binary variable, z i 1 , i d 1 , was utilised to describe the existence of a group ( i 1 , i d 1 ) in the generated molecule, as depicted in Equation (25).
z i 1 , i d 1 = { 1 ,         group   ( i 1 ,   i d 1 )     exists   in   the   molecule 0 ,         otherwise
Based on the valencies of various structural groups, the octet rules display a simple relation for the structural feasibility of a molecule, which are further described using Equations (26) and (27) [53].
i G 1 ( 2 v i ) n i = 2 q
i 1 i 2 ; i 1 , i 2 G 1 n i 1 n i 2 ( v i 2 2 ) + 2                   i 2 G 1
where v i is the valency of group i , n i is the number of occurrences of first-order group i and q is 1, 0, or −1 for acyclic, monocyclic, and bicyclic compounds, respectively. In addition, Churi and Achenie [54] mathematical constraints were incorporated to ensure that a single molecule was generated.

2.3.2. Step 3(b): Multi-Objective Optimisation (MOO)

In the design of optimal fragrance molecule using CAMD, the objective comprises several important properties that may conflict with each other when they are optimised simultaneously. Therefore, fragrance molecule design is a multi-objective optimisation (MOO) problem, whereby a certain balance of objectives is required to obtain a compromise solution. To solve the MOO problem, fuzzy optimisation is used since it is applicable in situations with vague and uncertain data. Besides, with its flexible decision boundaries, it is characterised by the ability to adjust to a specific domain of application and more accurately reflect its particularities [55].
In fuzzy optimization, degree of satisfaction,   λ p , is introduced for each objective function, as shown in Equations (28) and (29), depending on whether the objective is to be maximised or minimised. The objective is to maximise the degree of satisfaction for each design objective. When maximisation of V p is desired, any V p higher than V p U p p e r will have   λ p of 1 (Equation (28)) and vice versa for minimisation of V p (Equation (29)). It should be noted that   λ p is a continuous variable which ranges from 0 to 1 as shown in Equation (30). A λ p value of 0 implies that the judgements are satisfied at the boundaries, whereas a λ p value of 1 indicates perfect consistency. The pattern of the degree of satisfaction curve is formulated as follows λ [56]:
  λ p = { 0 ,             V p V p L o w e r V p V p L o w e r V p U p p e r V p L o w e r ,             V p L o w e r V p V p U p p e r                             p ϵ P 1 ,             V p V p U p p e r
  λ p = { 0 ,             V p V p U p p e r V p U p p e r V p V p U p p e r V p L o w e r ,             V p L o w e r V p V p U p p e r                                 p ϵ P 1 ,             V p V p L o w e r
0   λ p 1                   p ϵ P
With that, the max-min aggregation method is applied to maximise the least satisfying degree of satisfaction in ensuring that all λp are partially fulfilled to the least degree of λ [56]. Thus, the objective function is written as shown in Equations (31) and (32).
m a x λ
  λ p   λ             p ϵ P
The MILP formulation is then solved to obtain optimal fragrant molecules. A case study on the design of fragrances for cosmetic products is presented based on the CAMD framework. However, if no feasible solution can be found, then the constraints are checked to ensure that none of them are too strict. If so, then the constraints can be relaxed by modifying the membership functions. If all the constraints are within an acceptable range, then the predictive models should be revised to generate the molecule.

2.4. Step 4: Verification

After generating a fragrance molecule from CAMD, it was checked against the existing database to verify its scent. If the generated molecule is absent in the database, a literature review was performed extensively to determine its odour characteristic. The model is considered to have an error in identifying suitable fragrance candidates if the generated molecule identified as fragrant is reported to be a different class. This is known as a false positive result, where the fragrance classification is given to the generated unpleasant molecule.
In contrast, if the generated molecule from CAMD can neither be found in the available databases nor in the literature, this demonstrates the ability of the RSML model to anticipate undiscovered novel molecules which exhibit the potential to be used as a fragrance. Therefore, further verification via experimental methods, which is beyond the scope of this study, would be necessary to validate the molecule property. If the designed molecules cannot meet the desired properties, the rule-based model is modified to enhance the accuracy and reliability of prediction.

3. Case Study

Dishwashing detergent is a useful product that enhances domestic hygiene and cleanliness in daily life [57]. Fragrances are often incorporated in the formulation of dishwashing detergents to enhance consumers’ sensorial properties [58]. In this work, the desired fragrance molecules that can be used in liquid dishwashing products have been designed. These molecules must meet several properties along with the constraints for both technical and sensorial requirements, as tabulated in Table 6.
The objective is to maximize the diffusion coefficient and solubility parameter classification score, while the viscosity and −logLC50 classification score should be minimized to ensure that the fragrances will be suitable for dishwashing liquid detergents. The diffusion coefficient is prioritised as diffusion governs the motion of fragrance molecules in the air [59]. A fragrance with a high diffusion coefficient is desired so that the aroma scent can be perceived from a longer distance. In addition, the viscosity of the fragrance molecule is minimised to prevent drastic disruption to the viscosity of the final product. Fragrances usually decrease the viscosity but occasionally will increase the viscosity in a surfactant system [60].
Most of the common solvents that are available at a lower cost, such as ethanol ( 21.87   MPa 0.5 ) , propylene glycol ( 25.45   MPa 0.5 ) , or phenoxyethanol ( 22.47   MPa 0.5 ) , have higher solubility parameters. On the contrary, some specialty solvents such as 3-methoxy-3-methyl-1-butanol, which can be applied for dishwashing detergents, have a lower solubility parameter of 19.87   MPa 0.5 . Therefore, a higher solubility parameter for the fragrance molecule is desired so that common and cheaper solvents can be used. For both −log (LC50) and the solubility parameter, a disjunctive programming algorithm is conducted to convert the input molecular property values into their corresponding classification scores, which will be further discussed in detail in Section 4.

4. Results and Discussion

Since the development of fragrance predictive models is a pre-requisite for CAMD formulation, the deterministic rules generated from RSML will be discussed thoroughly before incorporating them as constraints into the CAMD model. Next, the generation of fragrance molecules for dishwashing liquid additives will be presented.

4.1. Development of Odour Predictive Model Using RSML

The RSML algorithm was applied to develop odour predictive models, which were then used as the constraint for generating potential fragrances candidates. The detailed discussions include the generation of the core and the reducts, training the model to generate the rules, model validation, and final selection of the most prominent rules.

4.1.1. Cores and Reduct Sets Generation

In this case study, the information system was made up of the conditional attributes shown in Table 2, whereas the column on decision attribute has three different categories: pleasant (class 1), no smell (class 2), and unpleasant (class 3) molecules based on the olfaction database. Two reduct sets were generated from the training data inputted. Reduct 1 consisted of dilution, E-state index, and third order Kappa index, while reduct 2 was made up of dilution and Chi 1v. Hence, dilution was determined to be the core along with the classification quality of 98.07%. However, the rules generated from reduct 2 were not extended further in this work as the certainty was low.

4.1.2. Rules Generated from Reduct Set

The reduct is composed of dilution, the third-order Kappa index, and the electro-topological state index. A total number of 66 deterministic rules were generated; 26 rules belong to decision class 1, 20 rules belong to decision class 2, and 20 rules belong to decision class 3. Table 7 provides sample rules from each decision class. It should be noted that variables A, B, C, and D indicated in the dilution column represent 1/10, 1/1000, 1/100,000 and 1/10,000,000, respectively.
Referring to Table 7, rule 11 is demonstrated by 11 out of 250 molecules in the training set and thus has a strength of 4.40%. It can be used as a constraint in the optimization model, ensuring that Kappa 3 and the electro-topological index fulfill the values indicated in Rule 11. Besides that, it also indicates that the molecule generated from this rule might be a pleasant molecule only at low dilution or high concentration (i.e., 1/10 or 1/1000). Subsequently, other rules can be interpreted in a similar manner. Since there are many rules generated for the pleasant class, further analysis and interpretation of the rules must be made to select the most plausible rules.
From the rule generation, a noteworthy observation is that almost all the rules generated are comprised of Kappa 3 value but not dilution and e-state value, except for rules 28, 52, 58 and 66. In decision class 1, all the rules generated are comprised of Kappa 3. The possible reason which led to such results is that for two molecules with an identical set of building blocks, they could exhibit the exact same e-state value but distinct Kappa 3 values. The full set of rules generated for 3 different classes is listed in Table A3 in Appendix C, along with their respective strength, coverage, and certainty.
In addition, Table A4 summarises the strength, coverage, and certainty of the rules generated that correspond to each class. It can be noticed that the coverage of the rules is considered low. The main reason is the large dataset, and all the molecules inside the training set were selected randomly. The chemical structures are diverse for the molecules in the dataset. Furthermore, it should be noted that the exact same molecule could be found in more than one rule under the same decision class if the range of e-state and/or Kappa 3 overlap. Additionally, it should be noted that the certainty of all the rules in the training set is 100%. Since only the rules with high certainty are used in CAMD, it can be guaranteed that the identified molecules have a very high potential to be used in fragrant products. In general, it can be summarised that RSML exhibits high potential to generate plausible rules for odour predictive models in designing fragrant molecules. The combined coverage of the rules used in CAMD is more than 50%, and all the rules have a certainty of more than 83%.

4.1.3. Evaluation of Model Performance Based on Validation Set

Next, all the generated rules from the reduct set were tested using the validation dataset, which was comprised of 88 molecules. The molecules were classified into one of the classes (pleasant, no smell, or unpleasant). If a molecule satisfies one or more of the rules in one of the decision classes, it would be classified into that decision class. A rule is used for classification only if the certainty is high. Since the major focus was pleasant molecules, only rules in decision class 1 will be further analysed in this section. Figure 2 illustrates the coverage and certainty of molecules in the validation set. It should be noted that rules that were not matched by any molecule in the validation data set were eliminated from further analysis. Coverage indicates the percentage of predicted molecules that fall in decision class 1, as shown in Equation (5). On the other hand, certainty denotes the accuracy of the rules in classifying the molecules. For instance, 4 molecules in the validation set fulfil the range of dilution, Kappa 3, and electro-topological indices dictated by rule 2. However, only 3 out of 4 of these molecules are classified into class 1 accurately, which means that the prediction accuracy of the RSML algorithm is 75% for this rule.
Referring to Figure 2, there are 4 rules (rule 4, 11, 14 and 18) with coverage higher than 10% and certainty higher than or equal to 75%, with rule 4 having a certainty of 100%. Table 8 summarises the performance of these rules when tested using the validation dataset. Although there are 6 other rules (rules 8, 13, 16, 19, 24 and 25) having a prediction certainty of 100%, their coverage is lower than 10%; thus, they are not considered in this work.
It is noticed that rules 4 and 14 do not use dilution as a necessary condition for classification. This could be explained by the range of Kappa 3 and the electro-topological state values in both rules being applicable for fragrance molecules, which are dilution-independent. This statement can be supported by the observation that the “sweet” odour character is dilution-independent [22]. The main reason might be that the “sweet” odour is associated with the molecule despite the changes in dilution, even though it might not be the most dominant characteristic. Among these 4 rules, rule 11 exhibited the highest coverage, while rule 4 showed the highest certainty. Interestingly, it can be seen that rules 4 and 18 impose similar e-state values but totally distinct Kappa 3 values. It is deduced that isomers with the same combination of groups but different branching can be generated through these two rules.

4.2. Generation of Fragrance Molecules

The aim of this case study is to design fragrances with pleasant smells, which will be suitable as an additive in dishwashing liquid. Therefore, rules 4, 11, 14, and 18 were added as constraints to the CAMD model for solving the optimisation problem. Additionally, the physicochemical constraints, as shown in Table 6, and structural constraints, which have been discussed in Section 2.3.1, were included in the model as well. Table A2 in Appendix B lists out all the first-order groups that are utilised as the building blocks in this work.

4.2.1. Disjunctive Programming for Classification

In the objective functions, the solubility parameter and LC50 are bound by lower and upper boundaries. Therefore, their property range can be divided into several intervals, with each interval denoted by several classifications. As mentioned in Section 2, the solubility parameter and LC50 were evaluated using the GC method, whilst disjunctive programming was employed to convert them into classification scores. Table 9 displays the classification for solubility parameter and −log (LC50).
Disjunctive programming on the solubility parameter is shown in this section. Referring to the score information in Table 9, the solubility parameter classification score, I S p may be 1, 2, 3 or 4 depending on the solubility parameter of the molecule. The I S p function was converted to the following mixed-integer formulation using three integer variables ( I S p 1 , I S p 2   &   I S p 3 ) , as shown in Equation (33).
I S p = 1 + I S p 1 + I S p 2 + I S p 3
It was then subjected to the following conditions:
I S p 1 = { 0         S p < 16 1         S p 16
I S p 2 = { 0         S p < 19 1         S p 19
I S p 3 = { 0         S p < 22 1         S p 22
To ensure that the correct values of I S p 1 , I S p 2 and I S p 3 were allocated to be either 0 or 1, satisfying the conditions above, the following constraints were imposed in CAMD as depicted in Equations (34)–(36).
( 13 16 ) × ( 1 I S p 1 ) S p 16 < ( 25 16 ) × ( I S p 1 )           I S p 1 { 0 ,   1 }
( 13 19 ) × ( 1 I S p 2 ) S p 19 < ( 25 19 ) × ( I S p 2 )           I S p 2 { 0 ,   1 }
( 13 22 ) × ( 1 I S p 3 ) S p 22 < ( 25 22 ) × ( I S p 3 )           I S p 3 { 0 ,   1 }
Similarly, the same approach was applied to the classification score of −log (LC50), I logLC 50 using disjunctive programming.

4.2.2. Optimisation Model

Fuzzy optimisation is applied to solve the MOO problem. In this method, the solution generated by the optimisation model achieves Pareto optimality since the level of satisfaction of the least-satisfied target property is maximized, λ [56]. Four objectives were targeted in this MOO problem, as depicted in Table 6. Equations (37)–(40) show the individual objective function for maximisation of diffusion coefficient, minimisation of viscosity, maximisation of solubility parameter classification score and minimisation of −log (LC50) classification score, respectively.
  λ 1 = { 0 ,             D A B D A B L o w e r D A B D A B L o w e r D A B U p p e r D A B L o w e r ,             D A B L o w e r D A B D A B U p p e r 1 ,             D A B D A B U p p e r
λ 2 = { 0 ,             μ μ U p p e r μ U p p e r μ μ U p p e r μ L o w e r ,             μ L o w e r μ μ U p p e r 1 ,             μ μ L o w e r
  λ 3 = { 0 ,             I S p I S p L o w e r I S p I S p L o w e r I S p U p p e r I S p L o w e r ,             I S p L o w e r I S p I S p U p p e r 1 ,             I S p I S p U p p e r
  λ 4 = { 0 ,             I l o g L C 50 I l o g L C 50 U p p e r I l o g L C 50 U p p e r I l o g L C 50 I l o g L C 50 U p p e r I l o g L C 50 L o w e r ,       I l o g L C 50 L o w e r I l o g L C 50 I l o g L C 50 U p p e r 1 ,             I l o g L C 50 I l o g L C 50 L o w e r
Subsequently, the final objective function of the MOO problem is written as shown in Equations (31) and (32). All the property targets were normalised to be used in the fuzzy optimisation framework. The CAMD problem was now formulated as an MILP problem which was solved using a global solver by LINGO extended version 18.0.56. There were 948 variables in total, with 915 integer variables, and the computational time tok around 1 min. The shape index was not included in the CAMD formulation and was instead used to confirm the validity of generated solutions, which have fulfilled all the desired requirements. Molecules that did not meet the rules on shape index were removed. To enumerate all possible feasible candidates, integer cuts were added. The results for fuzzy optimisation are presented in Table 10. In addition, the Pareto front was generated to obtain different possible solutions if the designer has different priorities. Figure 3 and Figure 4 illustrate the Pareto front obtained by using rule 4 and rule 18 as the constraint, respectively.

4.3. Verification and Potential of the Model

Referring to Table 10, all the potential candidates generated were not available in the Keller and Vosshall [42] database. This further indicates the effectiveness and robustness of the RSML algorithm in designing fragrances. Interestingly, it can be seen that the best solutions in rules 4 and 18 are isomers (methyl methoxyacetate and methoxymethyl acetate). Similarly, the second-best solutions in both rules, methyl 3-methoxypropionate and 2-methoxyethylacetate, are also isomers. The main reason is that the e-state index ranges in both rules are identical, as shown in Table 8. However, rules 4 and 18 can be differentiated by the dilution attribute and Kappa 3 index range.
Next, an extensive literature search was performed to verify whether these candidates are reported fragrances or not. Methyl methoxyacetate was found in the volatile composition of a green note aroma compound potential source, laksa plant (Polygonum hydropiper L.) [61]. Additionally, methyl metoxyacetate was detected as one of the compounds in the orchid (Steveniella satyrioides), which is perceived by the antennae of insects [62]. However, it was reported by Thermo Fisher Scientific [63] that it is odourless at 99 wt%. It was deduced that at low concentrations, methyl methoxyacetate has a pleasant smell, but at high concentrations, it is odourless. Therefore, this demonstrates the capability of machine-learning-based CAMD modelling to correct errors in fragrant databases which are prone to have errors. Nonetheless, further experimental verification is required when experimental results are not available. For methyl 3-methoxypropionate, there is no odour information available, but it has been reported that it is present as a volatile aroma component in the ponkan wine made from ponkan juice [64].
For feasible candidates in rule 18, there is no information available regarding the odour of methoxymethyl acetate, while 2-methoxyethyl acetate is reported to have a mild, ether-like odour [65]. Nevertheless, further experimental evaluation is required to verify their odour characteristic. Additionally, the constraints used in CAMD formulation are monitored using dual price values to ensure that there are no highly restricting constraints. Dual price is the amount that an objective would improve if an increase in one unit in the constant term of the constraint occurs. From the results obtained, it can be observed that all the dual prices for physical constraints are 0. This indicates that none of the constraints is too strict, and similar analyses were conducted for the CAMD problem using other rules as a constraint as well.
In addition, if the above candidates generated do not fulfill the odour characteristic that is desired, the redefined constraint can be loosened to generate other potential fragrance molecules. In this work, the solubility parameter and −log (LC50) classification scores were loosened. If the solubility parameter classification score is loosened, this indicates there might be a need for using a more expensive solvent for the homogeneous mixing of the fragrance in the final product due to the lower solubility parameter. However, this can be further verified using the literature to check whether the generated candidates are soluble in water or any conventional solvent such as ethanol. For the −log (LC50), if the molecule satisfies the constraint of 4.2 , it is considered safe to be used. Therefore, the fuzzy optimisation of rules 4 and 18 from the loosened constraints was conducted, and the results are tabulated in Table 10.
Both sec-butyl acetate and tert-butyl acetate are not found in the original database by Keller and Vosshall [42]. They are isomers with the same molecular formula but different combinations of bulding blocks and structure. Both molecules have relatively good diffusion coefficients, vapour pressure, and viscosity if compared to the previous candidates. The only drawback is they exhibit lower solubility parameters and higher −log (LC50) values. However, they are soluble in alcohol such as ethanol; thus, they are still considered prominent candidates in this study. In addition, sec-butyl acetate has a reported fruity and sweet odour, which can be found in concentrated apple juice [66]. Furthermore, tert-butyl acetate was determined to be camphoraceous in a study by Rossiter [67] and fresh fruity in a work by Miyazawa and Hashimoto [68].
In general, the results generated from fuzzy optimisation have proven the exceptional ability and flexibility of the CAMD model in designing or screening fragrance molecules. Non-intuitive molecules with favourable features have been found, although they are not included in the original database. Therefore, the proposed methodology has the potential to guide the experiments for the development of novel fragrant products.

4.4. Alternative Rule-Based Models

Except for the generation of non-cyclic or linear molecules, several structural constraints have been imposed to design cyclic molecules using rules 4 and 18 as the constraints. Besides that, rules 11 and 14 were utilised in the CAMD model separately to generate potential candidates. Table 10 depicts the feasible fragrances candidates generated using rules 4, 11, 14 and 18. All the generated feasible molecules listed are not in the original database.
For rule 4, all the properties of both generated molecules 7 and 8 fulfill all the constraints except for the Kappa 3 index value. Nevertheless, it is noteworthy that their Kappa 3 and e-state values are within the range of rule 20, as listed in Table A3 of Appendix C. However, rule 20 was not selected as one of the constraints to be incorporated into the CAMD model because its coverage is relatively low compared to other rules. The main reason might be due to the random selection of data for both the training and validation sets. Some molecules in the database that fulfil rule 20 were not chosen. Molecules 7 and 8 are reported to be fragrant in literature, whereby 2-(methoxyethyl) benzene is found to have a green and floral scent, and benzyl ethyl ether has a fruity, pineapple-like odour [69].
In addition, molecules 9 to 11 exist in established databases such as PubChem and ChemSpider, but there are no data available regarding their odour or smell. Molecules 9 and 11 fulfil all the constraints except the Kappa 3 index value in rules 11 and 18, respectively, whereas molecule 10, which is methyl 2-ethylbenzoate, fulfils all the requirements under rule 14. Molecule 12 is not available in any database or literature. Even though they do not have any odour information, they might be new potential fragrance molecules that can be utilised in different applications. The results illustrate that the integration of the RSML algorithm with CAMD for the design or screening of fragrance molecules is very useful. This is because promising candidates for various consumer products can be found, and a novel molecule that has never been discovered yet could also be designed using this approach.

4.5. Interpretability of RSML Model

From the CAMD results obtained, it is noteworthy that the design of fragrance molecules using a hybrid model that integrates the odour predictive models developed from the RSML algorithm and the physicochemical properties estimated using GC methods is very powerful. In this work, two topological indices, namely the electro-topological state index (E-state) and third-order shape index (Kappa 3), as well as dilution, were determined to be the most crucial attributes for classifying molecules into pleasant, no smell, and unpleasant categories by RSML. According to Sell [2], olfaction characteristics are concentration-dependent. A low concentration indicates that the molecule undergoes high dilution, and the odour description might vary at different concentrations. Despite this, an issue arises on which descriptor should be utilised for developing the structure-odour relationship. However, one should remember that some exceptions exist where certain odours might be concentration-independent, such as a “sweet” odour. Therefore, the application of the RSML algorithm has demonstrated its capability to generate different rules for both dilution-dependent and dilution-independent molecules. From a scientific viewpoint, the rules generated are logical because some fragrances can only be smelled within a certain dilution range. The majority of the rules for decision class 1 (pleasant) have an e-state ranging from 20 to 30, indicating that the chances of obtaining functional groups, such as ethers, esters, and aldehyde, are relatively high.
Based on the intrinsic value given in the literature, it was found that groups such as aldehyde (-CHO), ether (-COO) and ether (-CH3O, -CH2O, -CH-O, C-O) have relatively high e-state values [46]. Generally, molecules with esters, ethers and aldehydes groups have fruity [70], sweet [71], and floras [72] smells, respectively. For instance, ethyl ethanoate occurs in pineapples, 3-methylbutyl ethanoate occurs in apples and bananas, 3-methylbutyl-3-methylbutanoate in occurs apples, and octyl ethanoate occurs in oranges. Therefore, with the e-state ranges, it is likely to obtain a fragrant molecule with different functional groups. Furthermore, the electro-topological index provides insight into the atom’s availability to interact with a particular atom or group. It is expressed as the modified intrinsic value of an atom, whereby the intrinsic value is related to the valence-state electronegativity of the skeletal atom from the count of p and lone-pair electrons. From the e-state values, the atoms or groups in the molecule which contribute to the aromatic scent can be determined. For instance, the position of a widely known functional group that is associated with a fruity odour, ester, can be predicted using the e-state value. Subsequently, Kappa 3 encodes the atoms’ spatial density as well as the centrality of branching in a molecule. The value of Kappa 3 will increase if the length of the linear aliphatic chain increases, while its value decreases with the growth of branching. Besides that, it will increase if the number of three path fragments decreases. For example, for two isomers of C6H12O2, which are molecules 5 and 6 in Table 10, molecule 5 depicted a lower Kappa 3 value than molecule 6 despite molecule 6 having more branching. This is because the number of three path fragments in molecule 5 is six, whereas in molecule 6, this number is five.
Meanwhile, for Kappa 3, it is difficult to determine the sensible range for a fragrant molecule since there are several factors, such as the number of atoms present in the molecule, the number of three-path fragments as well as the increment or decrement of the counting of a particular atom based on its size contribution relative to C(sp3). as shown in Equations. 13 and 14. However, it is noteworthy that highly branched structures have lower Kappa 3 indices, which might be applicable to cyclic (aromatic and non-aromatic) compounds. Taking benzene, which has a sweet scent, as an example, it has a Kappa index of 0.5824 [73].
Additionally, referring to the rules generated from RSML, it can be observed that most of the rules are comprised of certain ranges of e-state and Kappa 3. Different combinations of rules dictate distinct molecular structures, whereby a series of patterns can be discovered from the rules. An interesting example can be demonstrated by rules 4 and 18 as both rules require very identical e-state ranges but divergent Kappa 3 values. Therefore, the linear molecules generated from these rules are usually structural isomers, with exactly the same E-state value but different Kappa 3 due to the difference in the number of branching or length of the aliphatic chain. Besides that, it is obviously shown that cyclic molecules generally have a lower Kappa 3 index value due to the aromatic ring itself already contributing 6 three-path fragments.
Since odour has a significant qualitative dimension, a few precautions must be taken to apply the developed models. Firstly, the organoleptic purity of fragrances should be noted. All stimuli in the database were applied at a purity of >97%, with a median purity of 98%. Notably, 3% traces of impurity can affect the perception, especially for those odourless molecules [42]. Furthermore, smell has no fixed reference points with measurable physical properties, and all the descriptions are associative. An odour can only be described by referring to other odours [2]. Another issue is the ambiguity of odour classification by subjects, as it is a subjective sense. Different individuals might have distinct perceptions of the same fragrance due to differences in age, culture, gender, and background. For instance, some people might perceive “spices” as a pleasant smell, but the rest might have the perception of an unpleasant smell. Hence, the misclassification of odour by the subjects might affect the determination of decision class in this work. Consequently, to extend the proposed methodology to other applications, a reasonably large set of data is essential to develop a reliable predictive model using RSML. In addition, those rules with low coverage and certainty should not be incorporated into the CAMD modelling as the prediction accuracy is low, which will lead to a false positive result. Finally, the interpretable nature of the RSML models allows individuals to assess the applicability of the model. If the interpretation of the developed model cannot be scientifically explained, the designer can discard the model even if the certainty is higher.

5. Conclusions

A systematic approach that integrates rule-based models from rough-set-based machine learning (RSML) into optimization models for computer-aided molecular design (CAMD) has been developed for the design of fragrance molecules. Group contribution-based methods were used to estimate the physicochemical properties of fragrance molecules, whereas RSML was utilised to generate deterministic rules that can predict the odour characteristic of the molecules based on their topological indices. Interestingly, some of the rules generated were related to the dilution of the fragrance molecules, but some were not. This result further proves that fragrance molecules are dilution-dependent. The rules were selected based on their coverage and certainty to ensure that they are reliable to be incorporated as the constraints in CAMD. None of the potential candidates generated exist in the original database. However, some molecules are reported as fragrances in the other database, while some potential molecules have odour information in other literature sources. The identification of molecules that do not have any odour information has demonstrated the ability of the model to identify new non-intuitive candidates, which require further experimental verification. The results show that the methodology developed here has the potential to be applied in the design of fragrance molecules in industry. The RSML predictive models were proven to be capable of predicting pleasant molecules’ odour characteristics. To improve the robustness and accuracy of the RSML model, more attributes that are related to the structure-odour relationship can be included. Additionally, the molecules could be classified into more specific scent classes, thus allowing specific odours to be targeted for specific applications. The developed framework can be modified and extended to discover or design molecules for other applications, provided that there are readily available predictive models or there are sufficient data to construct predictive models using machine learning. Using this approach, the time, cost, and resources required to develop a new product can be reduced significantly.

Author Contributions

Conceptualization, Y.P.H., N.G.C. and H.Y.L.; methodology, Y.P.H. and H.Y.L.; software, R.R.T. and K.B.A.; validation, J.W.C., K.B.A. and R.R.T.; formal analysis, Y.P.H.; investigation, J.W.C. and N.G.C.; resources, R.R.T. and K.B.A.; data curation, Y.P.H. and H.Y.L.; writing—original draft preparation, Y.P.H. and H.Y.L.; writing—review and editing, N.G.C., R.R.T. and K.B.A.; visualization, J.W.C.; supervision, N.G.C., R.R.T. and K.B.A.; project administration, N.G.C.; funding acquisition, N.G.C. All authors have read and agreed to the published version of the manuscript.

Funding

This research was funded by the Ministry of Higher Education, Malaysia, Grant number FRGS/1/2019/TK02/UNIM/02/1.

Institutional Review Board Statement

Not applicable.

Informed Consent Statement

Not applicable.

Data Availability Statement

Not applicable.

Acknowledgments

The authors would like to express sincere gratitude to the Ministry of Higher Education, Malaysia, for the realisation of this research project under the Grant FRGS/1/2019/TK02/UNIM/02/1.

Conflicts of Interest

The authors declare no conflict of interest.

Nomenclature

SymbolDescription
χ 1 v Connectivity (chi 1v) index
C 1 s v Bond contribution to connectivity index
δ i v δ j v Number of edges in the molecules with bond s terminating on vertices i and j
S i Electro-topological state index of atom i
I i Intrinsic electronic and topological status
Δ I i Perturbation factor due to the environment
δ i v Number of valence electrons
δ i Number of sigma electrons in the hydrogen suppressed graph
N i Principal quantum number
r i j Graph separation factor
κ 2 Second-order shape index, Kappa 2
A Number of atoms present in the molecule
P 2 i Number of two-path fragments
α Increment or decrement of the counting of particular atom based on its size contribution relative to C(sp3)
κ 3 Third order shape index, Kappa 3
P 3 i Number of three-path fragments
p s w i t c h Boundary property value
y i 1 , i d 1 , i 2 , i d 2 Connection between group ( i 1 , i d 1 ) and group ( i 2 , i d 2 )
z i 1 , i d 1 Existence of group ( i 1 , i d 1 )
v i Valency of group i
n i Number of occurrences of first-order group i

Appendix A. Group Contribution-Based Models

Table A1. Physical property models.
Target PropertyEquationsReferences
Normal   Boiling   Point ,   T b exp ( T b T b 0 ) = i N i T b 1 , i [74]
T b = Normal   boiling   point   ( K )
T b 0 = Universal constant, 244.5165 K
T b 1 , i = Contribution   of   the   first-order   group   of   type - i   that   occurs   N i   time
Density ,   ρ V m V m 0 = i N i v m 1 , i [74]
ρ = N i M i V m
V m   = Liquid   molar   volume   ( m 3 / kmol )
V m 0 = Universal   constant ,   0.0160   m 3 / kmol
v m 1 , i = Contribution   of   the   first-order   group   of   type   i   that   occurs   N i   times
ρ = Density   ( kg / cm 3 )
M i = Molecular weight
Hildebrand   Solubility   Parameter ,   δ δ δ 0 = i N i δ 1 , i [74]
δ   =   Hildebrand   solubility   parameter   ( MPa 0.5 )
δ 0 = Universal   constant ,   21.6654   MPa 0.5
δ 1 , i = Contribution   of   the   first-order   group   of   type   i   that   occurs   N i   times
Diffusion   Coefficient ,   D A B                                                       D A B = ( 3.03 ( 0.98 M A B 1 2 ) ) ( 10 3 )   T 3 2 P M A B 1 2 σ A B 2 Ω D
                                                                        M A B = 2 ( 1 M A + 1 M B ) 1
                                                                                        σ = 1.18 V m 1 3
                                                                                      σ A B = σ A + σ B 2
                                                                                        k = 1.15   T b
                              Ω D = A ( T * ) B + C exp ( D T * ) + E exp ( F T * ) + G exp ( H T * )
                                                                                      A B = ( A B ) 1 2
                                                                                                  T * = k T A B
With   σ B = 3.62 ,   B   = 97 , A = 1.06036 , B = 0.1561 , C = 0.193 ,
D = 0.47635 , E = 1.03587 , F = 1.2996 , G = 1.76474 , H = 3.89411
D A B = Diffusion   coefficient   ( cm 2 / s )
T = Temperature   ( K )
P   = Pressure   ( bar )
M A / M B = Molecular weight of A/B
σ A B = Scale parameter
V m = Liquid molar volume
T b = Normal   boiling   point   ( K )
[75]
Lethal   concentration   50 ,   L C 50 log ( LC 50 ) = i     N i α 1 , i [76]
LC 50 = Lethal concentration 50
α 1 , i = Toxicity contribution of the first-order group of type i that occurs N i times
Viscosity ,   η ln η = i N i T η , i [50]
η = Viscosity   ( c P )
T η , i = Contribution   of   the   first-order   group   of   type   i   that   occurs   N i times
Vapour   Pressure ,   P s a t l o g P s a t = 5.58 2.7 ( T b T ) 1.7 [77]
P s a t = Vapour pressure (mmHg)
T is the temperature at standard condition (K)

Appendix B. List of First-Order Group

Table A2. First-order groups.
First-Order Groups
CH3CH2CHCaCHaCOHCOOHCHOCOO
CH3OCH2OCH-OC-OCH2 (Cyclic)CH (Cyclic)C (Cyclic)O (Cyclic)-O-

Appendix C. Summary of Rules Generated from RSML

Table A3. Rules generated from reduct 1.
RuleDilutionKappa 3EstateStrengthStrengthCoverageCertainty
Pleasant (Decision Class 1)
1C4.8815.399≥27.4167 10.40%0.93%100%
2 2.6533.26224.95829.79252.00%4.67%100%
3C5.6377.68519.25024.95852.00%4.67%100%
4 3.0913.65419.25029.37572.80%6.54%100%
5C2.0542.572≥26.4167 20.80%1.87%100%
6A, C<1.334 ≥17.833 135.20%12.15%100%
7C<1.86665 ≥27.583 31.20%2.80%100%
8 1.3491.404 31.20%2.80%100%
9A, B2.2943.26229.12542.41762.40%5.61%100%
10A, B≥4.684 32.50034.91741.60%3.74%100%
11A, B≥2.054 24.75027.583114.40%10.28%100%
12A, B1.1561.349 41.60%3.74%100%
13A, B7.3517.685 93.60%8.41%100%
14 <1.8667 ≥27.917 166.40%14.95%100%
15 1.0811.147<24.583 52.00%4.67%100%
16A, B3.3743.87117.83338.58362.40%5.61%100%
17B≥5.637 28.25032.08310.40%0.93%100%
18A, B4.2925.63720.75030.83352.00%4.67%100%
19A, B1.7421.867 93.60%8.41%100%
20B2.1052.256<28.25 31.20%2.80%100%
21B8.37110.280 10.40%0.93%100%
22A5.5739.333 41.60%3.74%100%
23 1.0433.976 20.80%1.87%100%
24B0.8111.043 41.60%3.74%100%
25 <4.249 ≥44.167 41.60%3.74%100%
26 5.5125.573 10.40%0.93%100%
No Smell (Decision Class 2)
27C≥3.262 24.95832.50083.20%16.00%100%
28D ≥15.472 52.00%10.00%100%
29C3.6545.36611.91734.91762.40%12.00%100%
30 4.6576.445≥34.917 31.20%6.00%100%
31C2.1852.653<29.375 20.80%4.00%100%
32C1.9172.054 31.20%6.00%100%
33 2.2562.472<38.25 10.40%2.00%100%
34C1.3494.65711.91717.83310.40%2.00%100%
35 4.6575.196<33.833 31.20%6.00%100%
36C5.4765.687 20.80%4.00%100%
37A9.57013.774 10.40%2.00%100%
38B, C≥10.280 62.40%12.00%100%
39 <3.976 <10.917 62.40%12.00%100%
40D≥3.976 20.80%4.00%100%
41 2.8042.845 10.40%2.00%100%
42 <2.294 ≥38.250 10.40%2.00%100%
43 3.2623.288 10.40%2.00%100%
44C≥9.57 20.80%4.00%100%
45C1.3341.349 10.40%2.00%100%
46C<0.581 31.20%6.00%100%
Unpleasant (Decision Class 3)
47 ≥7.685 19.83323.08320.80%4.00%100%
48B1.8672.009≥24.417 20.80%4.00%100%
49 1.4042.10522.25022.83331.20%6.00%100%
50A≥9.333 <44.167 31.20%6.00%100%
51A, B3.7554.29228.25040.83341.60%8.00%100%
52 23.75023.91720.80%4.00%100%
53A, B, C≥0.5813 14.08317.500104.00%20.00%100%
54B1.0431.156≥25.750 20.80%4.00%100%
55B, C3.9235.476<20.750 41.60%8.00%100%
56C≥3.663 19.04219.83310.40%2.00%100%
57B≥4.336 27.58328.58310.40%2.00%100%
58 22.58322.83310.40%2.00%100%
59C2.2563.288≥29.917 10.40%2.00%100%
60 ≥1.8667 28.25028.58310.40%2.00%100%
61B1.4041.74219.25027.91731.20%6.00%100%
62 3.7554.65733.25034.58320.80%4.00%100%
63 <3.374 18.75019.25020.80%4.00%100%
64B0.5280.811 31.20%6.00%100%
65 1.5821.639<27.583 10.40%2.00%100%
66 13.33313.75010.40%2.00%100%
Table A4. Summary of generated rules.
ClassAverage Strength (%)Average Coverage (%)Average Certainty (%)
Pleasant2.064.82100.00
No Smell1.165.80100.00
Unpleasant0.984.90100.00

References

  1. Fortune Business Insights. Flavors and Fragrances Market Size, Share Report (2021–2028). 2021. Available online: https://www.fortunebusinessinsights.com/flavors-and-fragrances-market-102329 (accessed on 3 April 2022).
  2. Sell, C.S. Chemistry and the Sense of Smell; John Wiley & Sons, Incorporated: Somerset, CA, USA, 2014. [Google Scholar]
  3. Zhang, L.; Mao, H.; Liu, L.; Du, J.; Gani, R. A machine learning based computer-aided molecular design/screening methodology for fragrance molecules. Comput. Chem. Eng. 2018, 115, 295–308. [Google Scholar] [CrossRef]
  4. Korichi, M.; Gerbaud, V.; Floquet, P.; Meniai, A.H.; Nacef, S.; Joulia, X. Quantitative structure-Odor relationship: Using of multidimensional data analysis and neural network approaches. Comput. Aided Chem. Eng. 2006, 21, 895–900. [Google Scholar]
  5. Linke, P.; Kokossis, A. Simultaneous Synthesis and Design of Novel Chemicals and Chemical Process Flowsheets. In European Symposium on Computer Aided Process Engineering-12; Grievink, J., van Schijndel, Eds.; Elsevier: Amsterdam, The Netherlands, 2002; Volume 10, pp. 115–120. [Google Scholar]
  6. Austin, N.D.; Sahinidis, N.V.; Trahan, D.W. Computer-aided molecular design: An introduction and review of tools, applications, and solution techniques. Chem. Eng. Res. Des. 2016, 116, 2–26. [Google Scholar] [CrossRef]
  7. Zhou, T.; Zhou, Y.; Sundmacher, K. A hybrid stochastic–deterministic optimization approach for integrated solvent and process design. Chem. Eng. Sci. 2017, 159, 207–216. [Google Scholar] [CrossRef]
  8. Chemmangattuvalappil, N.G.; Ng, D.K.S.; Ng, L.Y.; Ooi, J.; Chong, J.W.; Eden, M.R. A review of process systems engineering (PSE) tools for the design of ionic liquids and integrated biorefineries. Processes 2020, 8, 1678. [Google Scholar]
  9. Liu, Q.; Zhang, L.; Tang, K.; Liu, L.; Du, J.; Meng, Q.; Gani, R. Machine learning-based atom contribution method for the prediction of surface charge density profiles and solvent design. AIChE J. 2021, 67, e17110. [Google Scholar] [CrossRef]
  10. Zhang, L.; Mao, H.; Zhuang, Y.; Wang, L.; Liu, L.; Dong, Y.; Du, J.; Xie, W.; Yuan, Z. Odor prediction and aroma mixture design using machine learning model and molecular surface charge density profiles. Chem. Eng. Sci. 2021, 245, 116947. [Google Scholar] [CrossRef]
  11. Mah, A.X.Y.; Chin, H.H.; Neoh, J.Q.; Aboagwa, O.A.; Thangalazhy-Gopakumar, S.; Chemmangattuvalappil, N.G. Design of bio-oil additives via computer-aided molecular design tools and phase stability analysis on final blends. Comput. Chem. Eng. 2019, 123, 257–271. [Google Scholar] [CrossRef]
  12. Yee, Q.Y.; Hassim, M.H.; Chemmangattuvalappil, N.G.; Ten, J.Y.; Raslan, R. Optimization of quality, safety and health aspects in personal care product preservative design. Process Saf. Environ. Prot. 2022, 157, 246–253. [Google Scholar]
  13. Ooi, Y.J.; Aung, K.N.G.; Chong, J.W.; Tan, R.R.; Aviso, K.B.; Chemmangattuvalappil, N.G. Design of fragrance molecules using computer-aided molecular design with machine learning. Comput. Chem. Eng. 2022, 157, 107585. [Google Scholar] [CrossRef]
  14. Chemmangattuvalappil, N.G. Development of solvent design methodologies using computer-aided molecular design tools. Curr. Opin. Chem. Eng. 2020, 27, 51–59. [Google Scholar] [CrossRef]
  15. Zhang, L.; Mao, H.; Liu, Q.; Gani, R. Chemical product design—Recent advances and perspectives. Curr. Opin. Chem. Eng. 2020, 27, 22–34. [Google Scholar] [CrossRef]
  16. Radhakrishnapany, K.T.; Wong, C.Y.; Tan, F.K.; Chong, J.W.; Tan, R.R.; Aviso, K.B.; Janairo, J.I.B.; Chemmangattuvalappil, N.G. Design of fragrant molecules through the incorporation of rough sets into computer-aided molecular design. Mol. Syst. Des. Eng. 2020, 5, 1391–1416. [Google Scholar] [CrossRef]
  17. Brookes, J.C.; Horsfield, A.P.; Stoneham, A.M. Odour character differences for enantiomers correlate with molecular flexibility. J. R. Soc. Interface 2009, 6, 75–86. [Google Scholar] [CrossRef]
  18. Islam, T.U.; Mufti, Z.S.; Ameen, A.; Aslam, M.N.; Tabraiz, A. On Certain Aspects of Topological Indices. J. Math. 2021, 2021, 9913529. [Google Scholar] [CrossRef]
  19. Dearden, J.C. The use of topological indices in QSAR and QSPR modeling. Chall. Adv. Comput. Chem. Phys. 2017, 24, 57–88. [Google Scholar]
  20. Blay, V.; Gullón-Soleto, J.; Gálvez-Llompart, M.; Gálvez, J.; García-Domenech, R. Biodegradability Prediction of Fragrant Molecules by Molecular Topology. ACS Sustain. Chem. Eng. 2016, 4, 4224–4231. [Google Scholar] [CrossRef]
  21. Amboni, R.D.D.C.; Junkes, B.D.; Yunes, R.A.; Heinzen, V.E.F. Quantitative structure—Odor relationships of aliphatic esters using topological indices. J. Agric. Food Chem. 2000, 48, 3517–3521. [Google Scholar] [CrossRef]
  22. Chacko, R.; Jain, D.; Patwardhan, M.; Puri, A.; Karande, S.; Rai, B. Data based predictive models for odor perception. Sci. Rep. 2020, 10, 17136. [Google Scholar] [CrossRef]
  23. Ham, C.L.; Jurs, P.C. Structure-activity studies of musk odorants using pattern recognition: Monocyclic nitrobenzenes. Chem. Senses 1985, 10, 491–505. [Google Scholar] [CrossRef]
  24. Belyadi, H.; Haghighat, A. Introduction to machine learning and Python. In Machine Learning Guide for Oil and Gas Using Python; Elsevier: Amsterdam, The Netherlands, 2021; pp. 1–55. [Google Scholar]
  25. Dey, A. Machine Learning Algorithms: A Review. Int. J. Comput. Sci. Inf. Technol. 2016, 7, 1174–1179. [Google Scholar]
  26. Rudin, C. Stop explaining black box machine learning models for high stakes decisions and use interpretable models instead. Nat. Mach. Intell. 2019, 1, 206–215. [Google Scholar] [CrossRef] [PubMed]
  27. Lundberg, S.M.; Lee, S.I. A unified approach to interpreting model predictions. Adv. Neural Inf. Process. Syst. 2017, 4768–4777. [Google Scholar]
  28. Dobbelaere, M.R.; Plehiers, P.P.; van de Vijver, R.; Stevens, C.V.; van Geem, K.M. Machine Learning in Chemical Engineering: Strengths, Weaknesses, Opportunities, and Threats. Engineering 2021, 7, 1201–1211. [Google Scholar] [CrossRef]
  29. Xu, G.; Papageorgiou, L.G. A mixed integer optimisation model for data classification. Comput. Ind. Eng. 2009, 56, 1205–1215. [Google Scholar] [CrossRef]
  30. Zhang, Q.; Xie, Q.; Wang, G. A survey on rough set theory and its application. CAAI Trans. Intell. Technol. 2016, 1, 323–333. [Google Scholar] [CrossRef]
  31. Pawlak, Z. Rough sets. Int. J. Comput. Inf. Sci. 1982, 11, 341–356. [Google Scholar] [CrossRef]
  32. Pawlak, Z. Rough set approach to knowledge-based decision support. Eur. J. Oper. Res. 1997, 99, 48–57. [Google Scholar] [CrossRef]
  33. Pawlak, Z. Some issues on rough sets. Lect. Notes Comput. Sci. 2004, 3100, 1–58. [Google Scholar]
  34. Mohamed, A.S.A. Application of rough set theory for clinical data analysis: A case study. Math. Comput. Model. 1991, 15, 19–37. [Google Scholar] [CrossRef]
  35. Słowiński, K. Rough Classification of HSV Patients. Intell. Decis. Support. 1992, 11, 77–93. [Google Scholar]
  36. Tanaka, H.; Ishibuchi, H.; Matsuda, N. Fuzzy Expert System Based on Rough Sets and Its Application to Medical Diagnosis. Int. J. Gen. Syst. 1992, 21, 83–97. [Google Scholar] [CrossRef]
  37. Aviso, K.B.; Janairo, J.I.B.; Promentilla, M.A.B.; Tan, R.R. Prediction of CO2 storage site integrity with rough set-based machine learning. Clean Technol. Environ. Policy 2019, 21, 1655–1664. [Google Scholar] [CrossRef]
  38. Lei, L.; Chen, W.; Wu, B.; Chen, C.; Liu, W. A building energy consumption prediction model based on rough set theory and deep learning algorithms. Energy Build. 2021, 240, 110886. [Google Scholar] [CrossRef]
  39. Raza, M.S.; Qamar, U. Rough Set Theory. In Understanding and Using Rough Set Based Feature Selection: Concepts, Techniques and Applications; Springer: Singapore, 2017; pp. 53–79. [Google Scholar]
  40. Pawlak, Z. Rough sets, decision algorithms and Bayes’ theorem. Eur. J. Oper. Res. 2002, 136, 181–189. [Google Scholar] [CrossRef]
  41. Laing, D.G.; Legha, P.K.; Jinks, A.L.; Hutchinson, I. Relationship between molecular structure, concentration and odor qualities of oxygenated aliphatic molecules. Chem. Senses 2003, 28, 57–69. [Google Scholar] [CrossRef]
  42. Keller, A.; Vosshall, L.B. Olfactory perception of chemically diverse molecules. BMC Neurosci. 2016, 17, 55. [Google Scholar] [CrossRef]
  43. Estrada, E. Physicochemical interpretation of molecular connectivity indices. J. Phys. Chem. A 2002, 106, 9085–9091. [Google Scholar] [CrossRef]
  44. Hall, L.H.; Kier, L.B. The Molecular Connectivity Chi Indexes and Kappa Shape Indexes in Structure-Property Modeling. In Reviews in Computational Chemistry; Lipkowitz, K.B., Boyd, D.B., Eds.; Wiley-VCH, Inc.: Toronto, ON, Canada, 2007; Volume 2, pp. 367–422. [Google Scholar]
  45. Roy, K.; Mitra, I. Electrotopological State Atom (E-State) Index in Drug Design, QSAR, Property Prediction and Toxicity Assessment. Curr. Comput. Aided Drug Des. 2012, 8, 135–158. [Google Scholar] [CrossRef]
  46. Kier, L.B.; Hall, L.H. An Electrotopological-State Index for Atoms in Molecules. Pharm. Res. Off. J. Am. Assoc. Pharm. Sci. 1990, 7, 801–807. [Google Scholar] [CrossRef]
  47. Hu, Q.N.; Liang, Y.Z.; Yin, H.; Peng, X.L.; Fang, K.T. Structural interpretation of the topological index. 2. The molecular connectivity index, the Kappa index, and the atom-type E-State index. J. Chem. Inf. Comput. Sci. 2004, 44, 1193–1201. [Google Scholar] [CrossRef]
  48. ProSoft. User’s Guide ROSE 2 Rough Set Data Explorer; Labratory of Intelligent Decision Support systems of the Institute of Computing Science: Poznan, Poland, 1999. [Google Scholar]
  49. Gani, R.; Harper, P.M.; Hostrup, M. Automatic creation of missing groups through connectivity index for pure-component property prediction. Ind. Eng. Chem. Res. 2005, 44, 7262–7269. [Google Scholar] [CrossRef]
  50. Conte, E.; Martinho, A.; Matos, H.A.; Gani, R. Combined group-contribution and atom connectivity index-based methods for estimation of surface tension and viscosity. Ind. Eng. Chem. Res. 2008, 47, 7940–7954. [Google Scholar] [CrossRef]
  51. El-Halwagi, M.M. Overview of Optimization. Sustain. Des. Process Integr. 2012, 255–286. [Google Scholar]
  52. Ten, J.Y.; Hassim, M.H.; Ng, D.K.S.; Chemmangattuvalappil, N.G. A molecular design methodology by the simultaneous optimisation of performance, safety and health aspects. Chem. Eng. Sci. 2017, 159, 140–153. [Google Scholar] [CrossRef]
  53. Odele, O.; Macchietto, S. Computer aided molecular design: A novel method for optimal solvent selection. Fluid Phase Equilib. 1993, 82, 47–54. [Google Scholar] [CrossRef]
  54. Churi, N.; Achenie, L.E.K. Novel mathematical programming model for computer aided molecular design. Ind. Eng. Chem. Res. 1996, 35, 3788–3794. [Google Scholar] [CrossRef]
  55. Tsipouras, M.G.; Exarchos, T.P.; Fotiadis, D.I. A methodology for automated fuzzy model generation. Fuzzy Sets Syst. 2008, 159, 3201–3220. [Google Scholar] [CrossRef]
  56. Zimmermann, H.J. Fuzzy programming and linear programming with several objective functions. Fuzzy Sets Syst. 1978, 1, 45–55. [Google Scholar] [CrossRef]
  57. Abeliotis, K.; Dimitrakopoulou, N.; Vamvakari, M. Attitudes and behaviour of consumers regarding dishwashing: The case of Patras, Greece. Resour. Conserv. Recycl. 2012, 62, 31–36. [Google Scholar] [CrossRef]
  58. Teixeira, M.A.; Rodríguez, O.; Gomes, P.; Mata, V.; Rodrigues, A.E. A Product Engineering Approach in the Perfume Industry. In Perfume Engineering; Elsevier: Amsterdam, The Netherlands, 2013; pp. 1–13. [Google Scholar]
  59. Teixeira, M.A.; Rodríguez, O.; Rodrigues, A.E. Diffusion and performance of fragranced products: Prediction and validation. AIChE J. 2013, 59, 3943–3957. [Google Scholar] [CrossRef]
  60. Munden, D. Effect of perfumes on the viscosity of surfactant systems. Cosmet. Toilet. 1988, 103, 65–67. [Google Scholar]
  61. Jiang, J. Volatile composition of the laksa plant (Polygonum hydropiper L.), a potential source of green note aroma compounds. Flavour Fragr. J. 2005, 20, 455–459. [Google Scholar] [CrossRef]
  62. Brodmann, J.; Twele, R.; Francke, W.; Luo, Y.B.; Song, X.Q.; Ayasse, M. Orchid mimics alarm pheromone of the pollinator to attract alerted wasps for pollination. Current Biol. 2009, 19, 1368–1372. [Google Scholar] [CrossRef]
  63. Thermo Fisher Scientific. Safety Data Sheet. In Material Safety Data Sheet; Thermo Fisher Scientific: Waltham, MA, USA, 2021; p. 7. [Google Scholar]
  64. Lee, J.S.; Chang, C.Y.; Yu, T.H.; Lai, S.T.; Lin, L.Y. Studies on the quality and Flavor of Ponkan (Citrus poonensis hort.) wines fermented by different yeasts. J. Food Drug Anal. 2013, 21, 301–309. [Google Scholar] [CrossRef]
  65. OSHA. 2-Methoxyethyl Acetate (Methyl Cellosolve Acetate; Ethylene Glycol Methyl Acetate). 2022. Available online: https://www.osha.gov/chemicaldata/111 (accessed on 8 April 2022).
  66. Yoda, T.; Miyaki, H.; Saito, T. Freeze concentrated apple juice maintains its flavor. Sci. Rep. 2021, 11, 12679. [Google Scholar] [CrossRef]
  67. Rossiter, K.J. Structure-odor relationships. Chem. Rev. 1996, 96, 3201–3240. [Google Scholar] [CrossRef]
  68. Miyazawa, M.; Hashimoto, Y. Antimicrobial and bactericidal activities of esters of 2-endo-hydroxy-1,8-cineole as new aroma chemicals. J. Agric. Food Chem. 2002, 50, 3522–3526. [Google Scholar] [CrossRef]
  69. TGSC. The Good Scents Company Information System. 2021. Available online: http://www.thegoodscentscompany.com/index.html (accessed on 8 April 2022).
  70. Ouellette, R.J.; Rawn, J.D. Carboxylic Acid Derivatives. In Organic Chemistry; Ouellette, R.J., Rawn, J.D., Eds.; Elsevier: Boston, MA, USA, 2014; pp. 699–745. [Google Scholar] [CrossRef]
  71. Hellman, T.M.; Small, F.H. Characterization of the Odor Properties of 101 Petrochemicals Using Sensory Methods. J. Air Pollut. Control Assoc. 1974, 24, 979–982. [Google Scholar] [CrossRef]
  72. Kim, M.; Sowndhararajan, K.; Choi, H.J.; Park, S.J.; Kim, S. Olfactory Stimulation Effect of Aldehydes, Nonanal, and Decanal on the Human Electroencephalographic Activity, According to Nostril Variation. Biomedicines 2019, 7, 57. [Google Scholar] [CrossRef]
  73. Cheremisinoff, N.P.; Rosenfeld, P.E. Sources of air emissions from pulp and paper mills. In Handbook of Pollution Prevention and Cleaner Production; Elsevier: Amsterdam, The Netherlands, 2010; pp. 179–259. [Google Scholar] [CrossRef]
  74. Hukkerikar, A.S.; Sarup, B.; Kate, A.T.; Abildskov, J.; Sin, G.; Gani, R. Group-contribution + (GC+) based estimation of properties of pure components: Improved property estimation and uncertainty analysis. Fluid Phase Equilib. 2012, 321, 25–43. [Google Scholar] [CrossRef]
  75. Reid, R.C.; Prausnitz, J.M.; Poling, B.E. The Properties of Gases and Liquids; McGraw-Hill Book: New York, NY, USA, 1988. [Google Scholar]
  76. Martin, T.M.; Young, D.M. Prediction of the acute toxicity (96-h LC50) of organic compounds to the fathead minnow (Pimephales promelas) using a group contribution method. Chem. Res. Toxicol. 2001, 14, 1378–1385. [Google Scholar] [CrossRef] [PubMed]
  77. Sinha, M.; Achenie, L.E.K. Systematic design of blanket wash solvents with recovery considerations. Adv. Environ. Res. 2001, 5, 239–249. [Google Scholar] [CrossRef]
Figure 1. Integrated ML and CAMD framework.
Processes 10 01767 g001
Figure 2. Results of rules generated for decision class 1 in the validation set.
Processes 10 01767 g002
Figure 3. Pareto front from rule 4.
Processes 10 01767 g003
Figure 4. Pareto front from rule 18.
Processes 10 01767 g004
Table 1. Fragrance molecule attributes.
Product AttributePhysicochemical Properties
Diffusion RateDiffusion Coefficient
Health and SafetyLC50
Evaporation RateVapour Pressure
Product Form (Liquid)Normal Boiling Point
SolubilityHildebrand Solubility Parameter
RheologyViscosity, Density
Table 2. Conditional attributes that affect odour.
List of Conditional Attributes
Connectivity index of order 2
Connectivity index of order 3
E-state index
Second order Kappa index
Third order Kappa index
Presence of functional groups
Dilution
Table 3. Classification of molecules.
Odour CharacteristicSemantic DescriptorNumber of Molecules
Pleasant (1)Sweet, Fruit, Flower, Edible, Bakery153
No Smell (2)-366
Unpleasant (3)Warm, Spices, Grass, Cold, Wood, Garlic, Fish, Burnt, Acid, Ammonia, Sweaty, Sour, Musky, Decayed435
Table 4. Topological indices.
Topological IndicesEquation
Connectivity Index, Chi 1v ( χ 1 v ) C 1 s v = ( δ i v δ j v ) s 1 2 (6)
χ 1 v =   C 1 s v (7)
χ 1 v =   ( δ i v δ j v ) s 1 2 (8)
Electro-topological State Index ( S i ) S i = I i + Δ I i (9)
I i = [ ( 2 N i ) 2 δ i v + 1 ] δ i (10)
Δ I i = j i ( I i I j ) / r i j 2 (11)
Second-Order Shape Index, Kappa 2 ( κ 2 ) κ 2 = ( A + α 1 ) ( A + α 2 ) 2 / ( P 2 i + α ) 2 (12)
Third-Order Shape Index, Kappa 3 ( κ 3 ) κ 3 = ( A + α 1 ) ( A + α 3 ) 2 ( P 3 i + α ) 2 ,   A   i s   o d d (13)
κ 3 = ( A + α 2 ) ( A + α 3 ) 2 ( P 3 i + α ) 2 ,   A   i s   e v e n (14)
Table 5. Simplified information system.
MoleculeConditional AttributesDecision Attribute
C1C2C3D
X11.65111
X23.59112
X33.59001
X47.88003
X51.89111
X63.67112
X79.42003
X83.18112
Table 6. Target Properties and their Constraints.
Target PropertyObjectiveConstraint
Odour Character (OC)-Pleasant
Vapour Pressure- 0 P s a t 100   kPa
Diffusion CoefficientMaximum D A B 0.15   m 2 / h
Lethal Concentration 50Minimum log ( LC 50 ) 4.2
Hildebrand Solubility ParameterMaximum 13 S p 25   MPa 0.5
Normal Boiling Point- T b 373.15   K
ViscosityMinimum μ 2 c P
Density- 800   ρ 1000   kg / m 3
Table 7. Sample rules generated from reduct 1.
RuleDecisionDilutionKappa 3E-StateStrengthCoverageCertainty
11PleasantA, B 2.0524.75 to 27.584.40%10.28%100%
29No SmellC3.65 to 5.3711.92 to 34.922.40%12.00%100%
53UnpleasantA, B, C & D 0.5814.08 to 17.504.00%20.00%100%
Table 8. Performance of rules 4, 11, 14 and 18 in validation.
Rule No.DilutionKappa 3EstateStrengthCoverageCertainty
4 3.09 to 3.6519.25 to 29.386.82%13.04%100.00%
11A, B 2.0524.75 to 27.5813.64%19.57%75.00%
14 < 1.87 27.9210.23%15.22%77.78%
18A, B4.29 to 5.6420.75 to 30.836.82%10.87%83.33%
Table 9. Classification for solubility parameter and −log (LC50).
ParameterScore InformationClassification
Solubility Parameter, S p (MPa0.5) 13 S p < 16 1
16 S p < 19 2
19 S p < 22 3
22 S p 25 4
−log (LC50) 0.01 logLC 50 < 1 1
1 logLC 50 < 2 2
2 logLC 50 < 3 3
3 logLC 50 4.2 4
Table 10. Fuzzy optimisation results.
ApproachFuzzy OptimisationFuzzy Optimisation with Loosened Constraint
Rule 441818418
SolutionBestSecond BestBestSecond BestBestBest
No.123456
Molecular nameMethyl methoxyacetateMethyl 3-methoxypropionateMethoxymethyl acetate2-methoxyethyl acetateSec-butyl acetateTert-butyl acetate
Molecular structure Processes 10 01767 i001 Processes 10 01767 i002 Processes 10 01767 i003 Processes 10 01767 i004 Processes 10 01767 i005 Processes 10 01767 i006
FormulaC4H8O3C5H10O3C4H8O3C5H10O3C6H12O2C6H12O2
CAS number6290-49-93852-09-34382-76-7110-49-6105-46-4540-88-5
Odour in literature* OdourlessN/AN/AMild, ether-likeFruityCamphor, fruity
ApproachFuzzy Optimisation (Cyclic Compound)
Rule4411141818
SolutionBestSecond BestBestBestBestSecond Best
No.789101112
Molecular name2-(methoxyethyl) benzeneBenzyl ethyl ether(1,1-dimethoxyethyl) benzeneMethyl 2-ethylbenzoate(1-ethoxyethyl) benzeneN/A
Molecular structure Processes 10 01767 i007 Processes 10 01767 i008 Processes 10 01767 i009 Processes 10 01767 i010 Processes 10 01767 i011 Processes 10 01767 i012
FormulaC9H12OC9H12OC10H14O2C10H12O2C10H14OC10H14O
CAS number3558-60-9539-30-04316-35-250604-01-83299-05-6N/A
Odour in literatureGreen, floralFruity, pineapple-likeN/AN/AN/AN/A
* At high concentration.
Publisher’s Note: MDPI stays neutral with regard to jurisdictional claims in published maps and institutional affiliations.

