
Using Natural Raw Materials and CEM Approach for the Design of Andean Volcanic Self-Compacting Concretes


Abstract
:1. Introduction
2. Theoretical Background
2.1. Multiscale Theory
2.2. Constitutive Equation
3. Materials and Methods
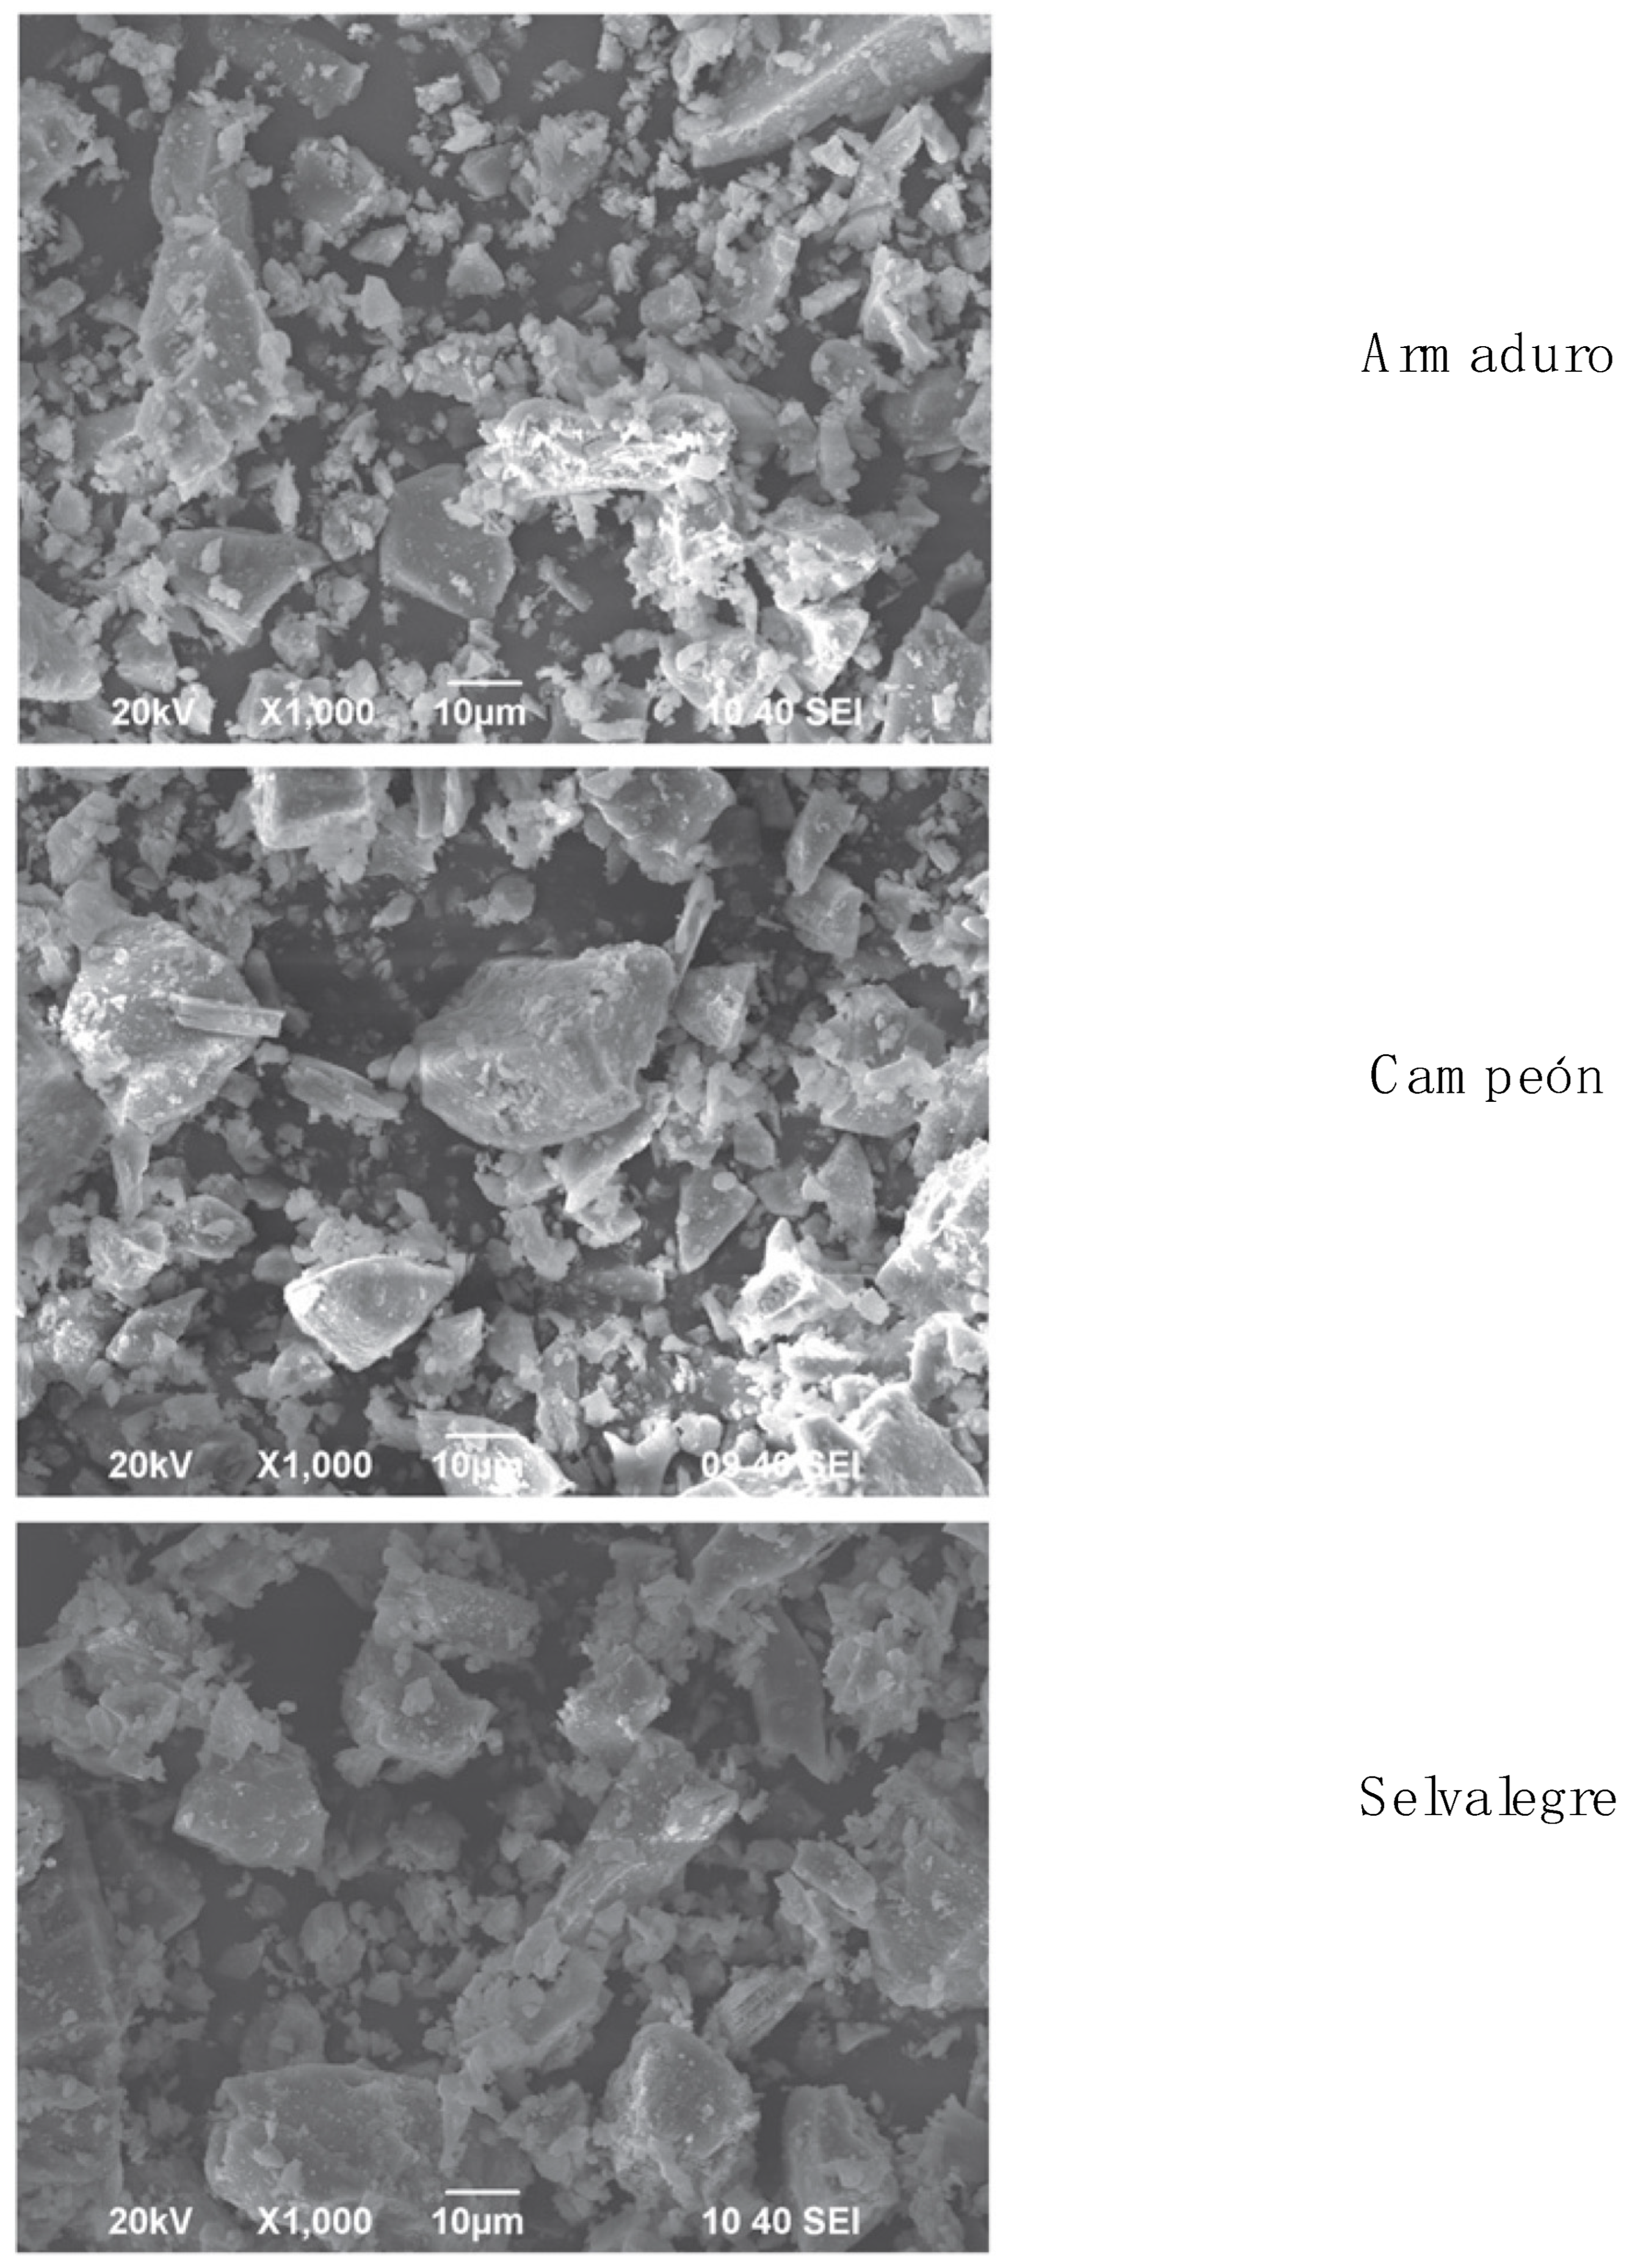
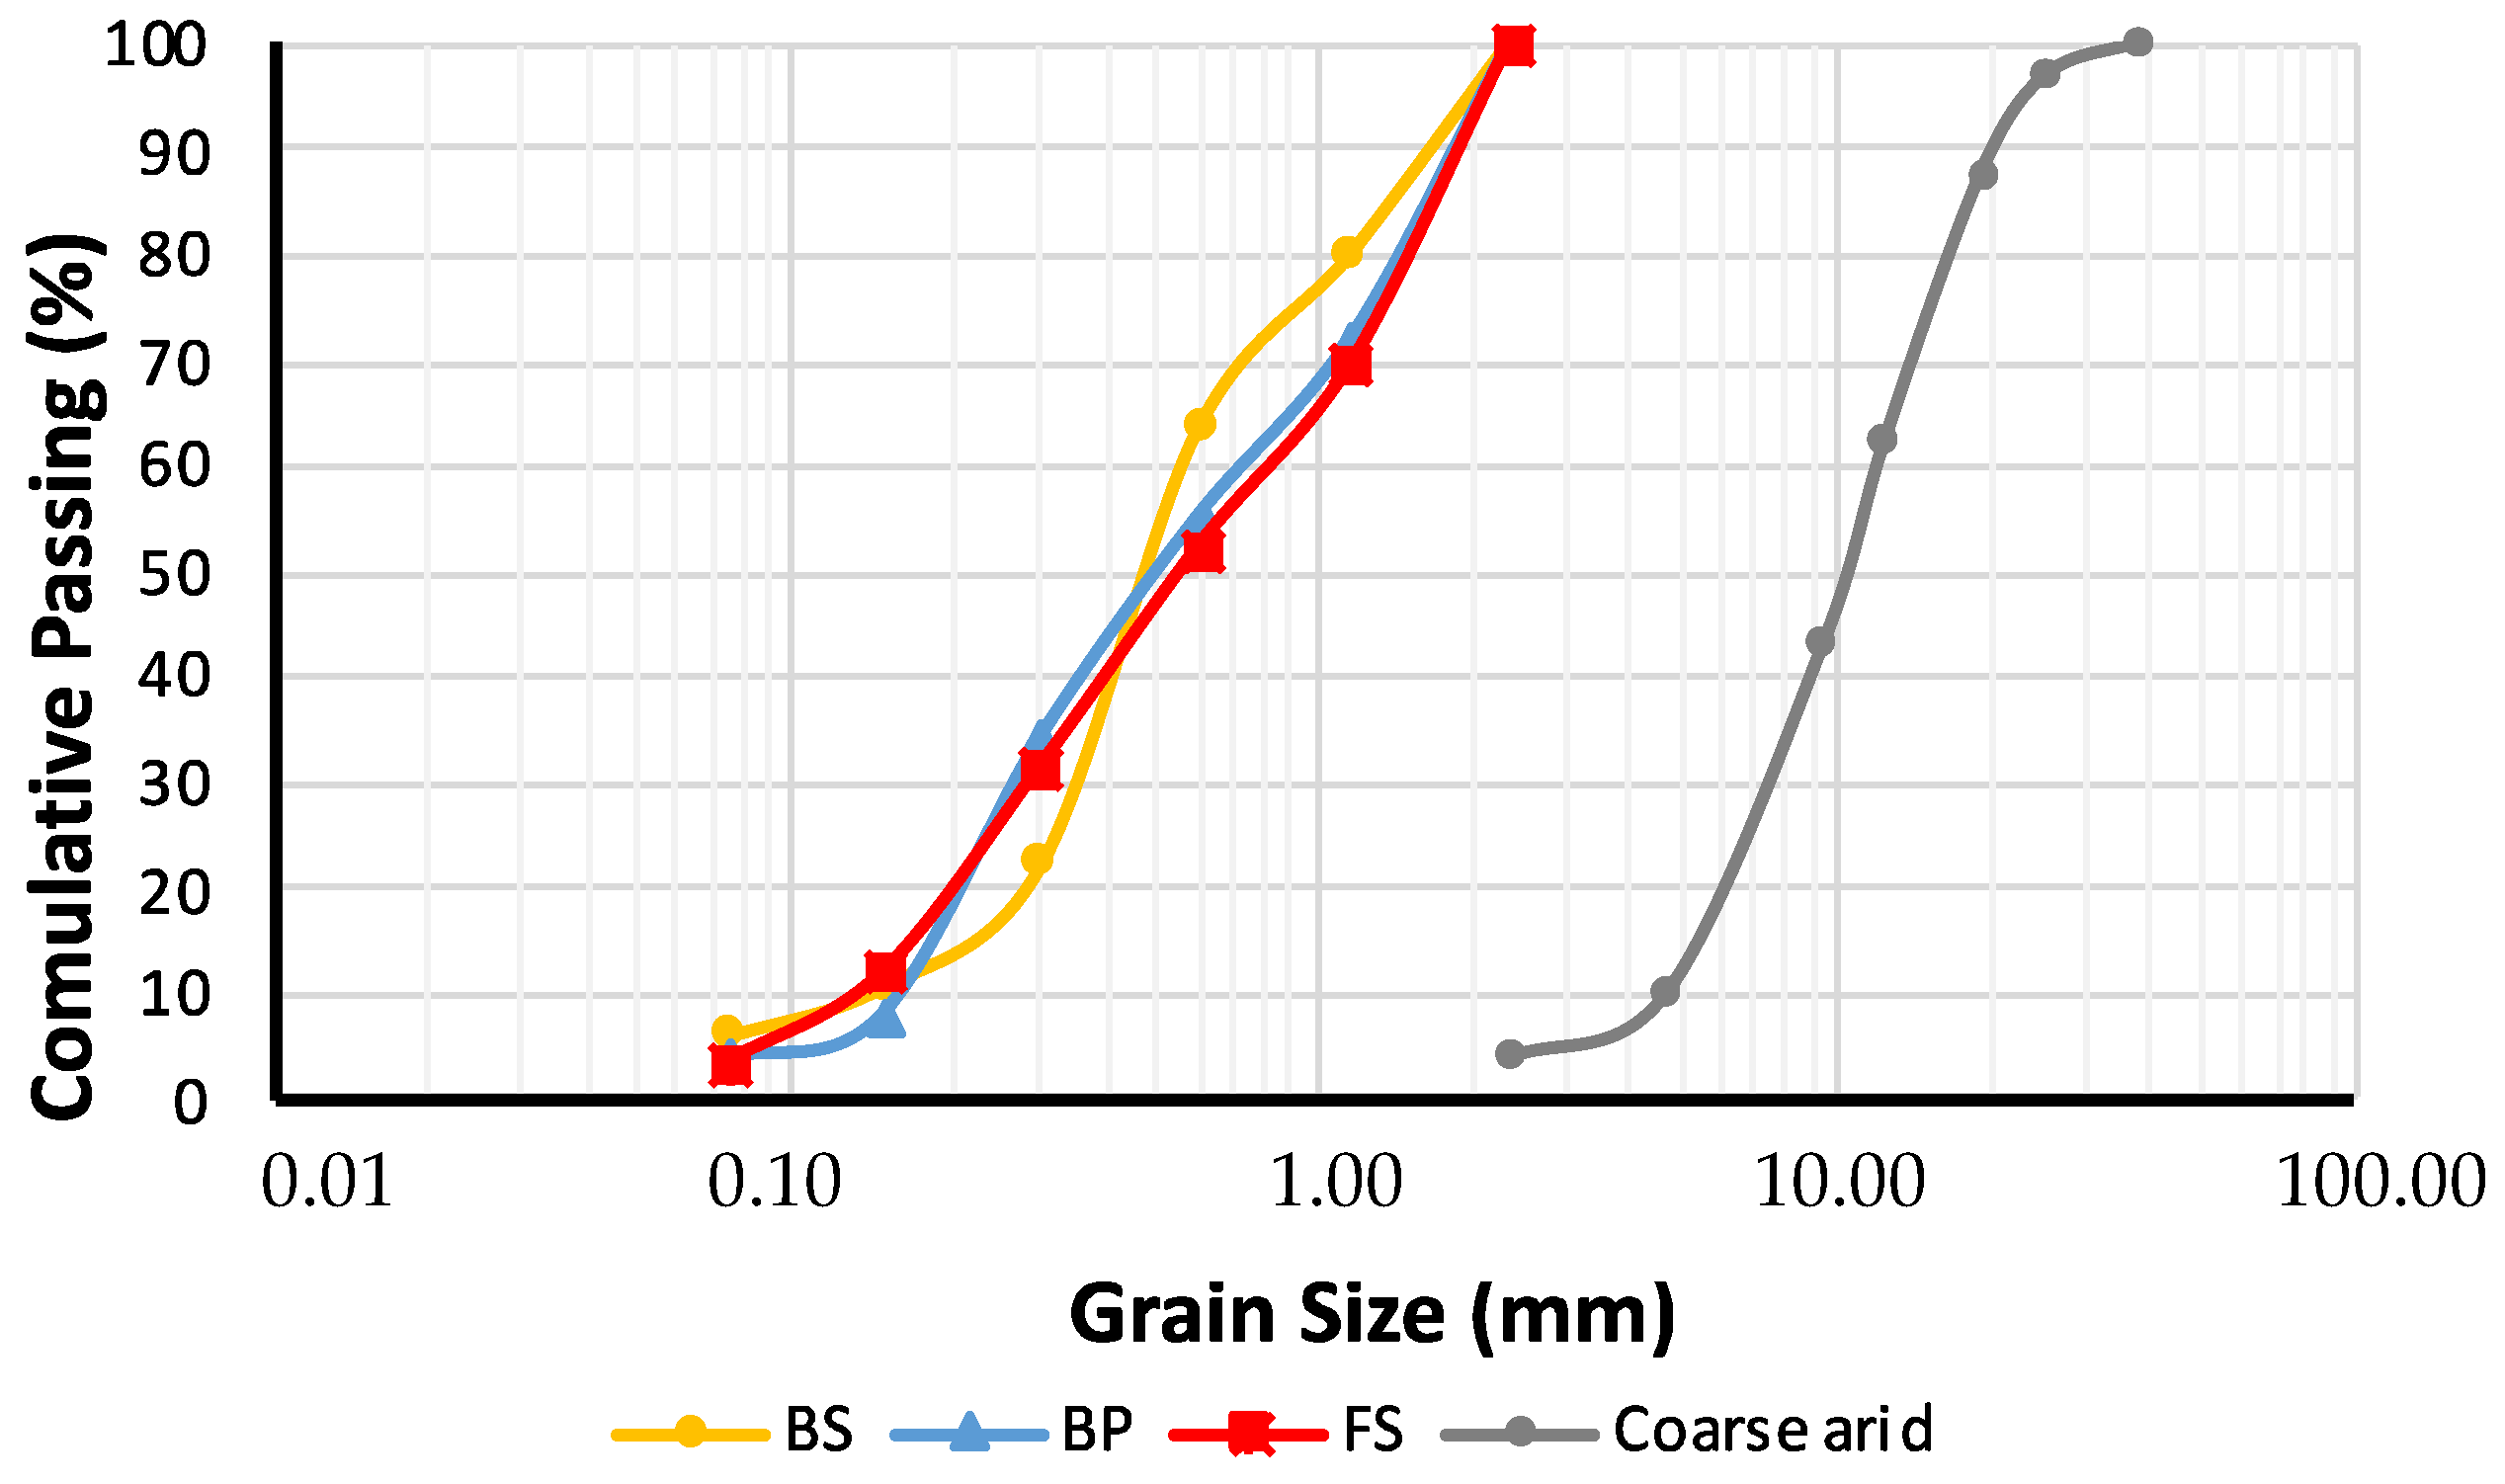
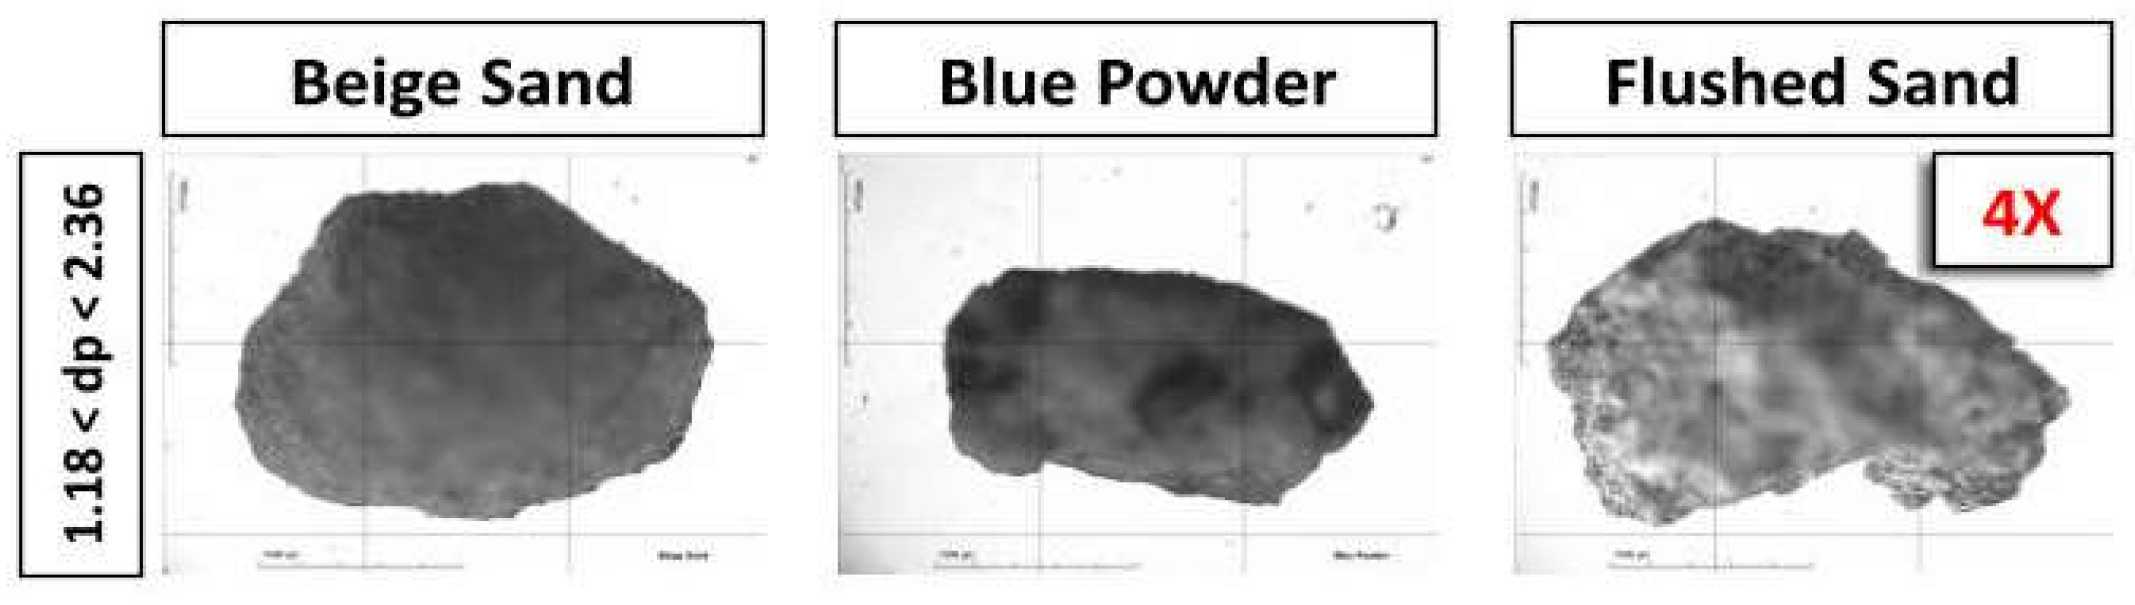
3.1. Materials
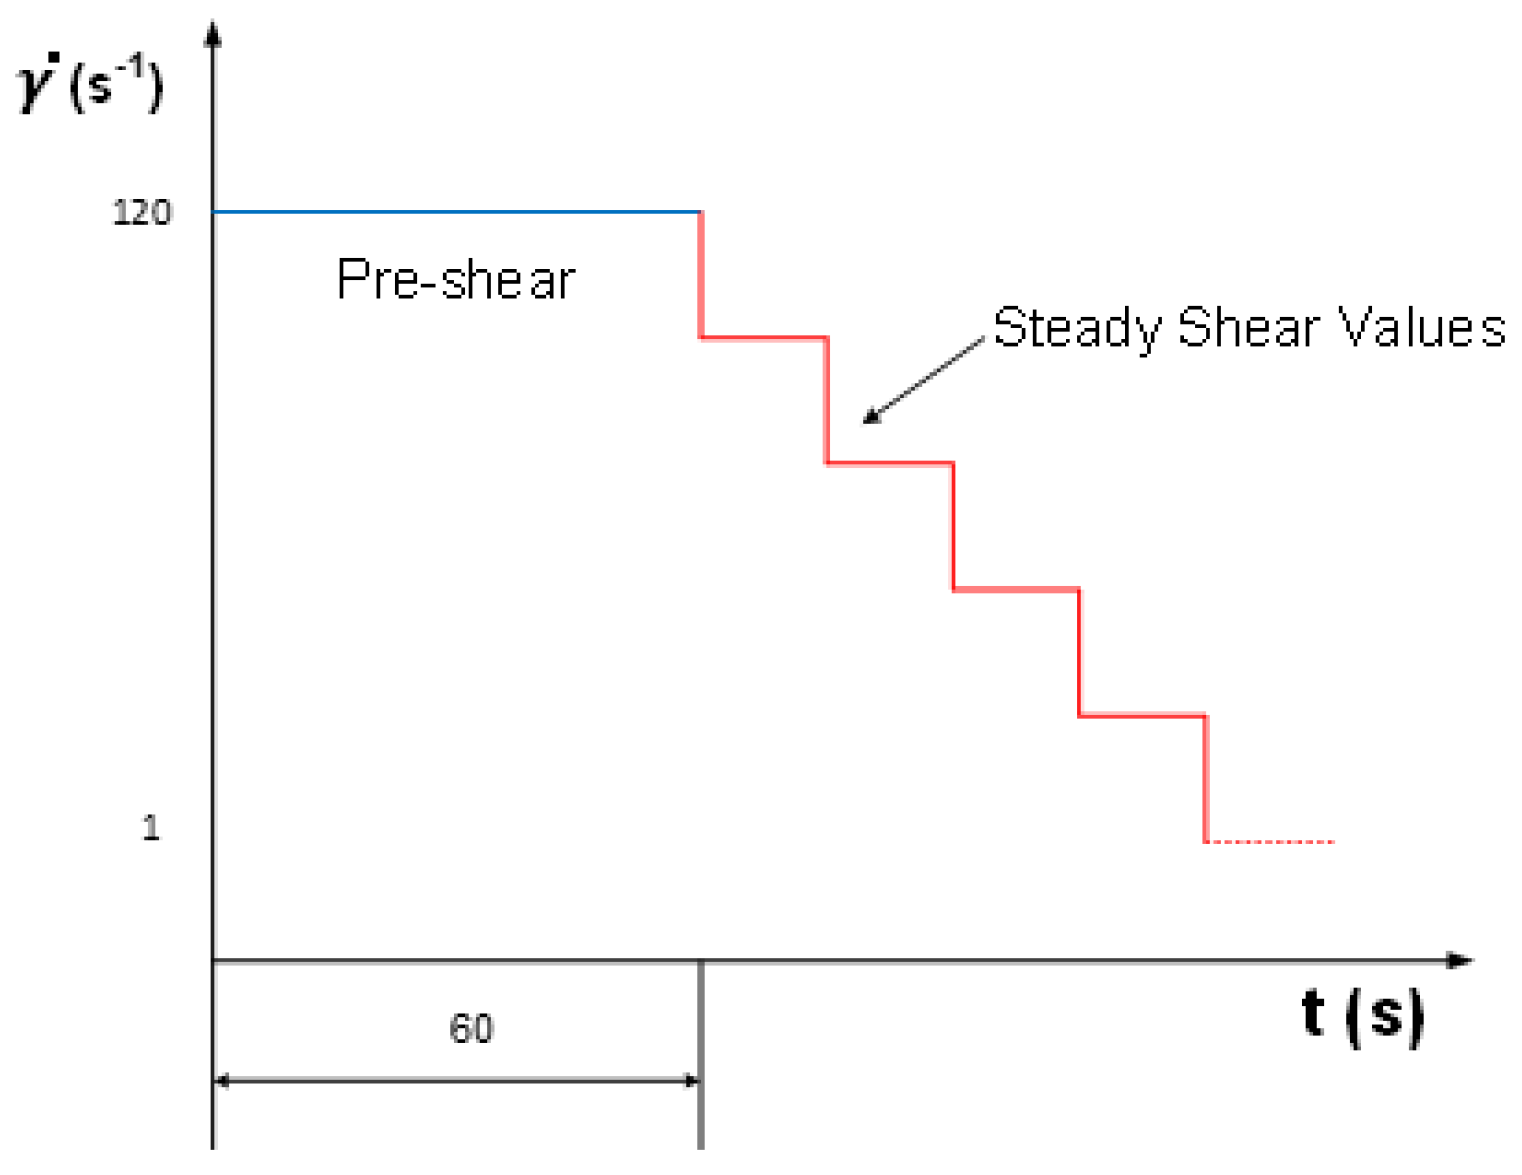
3.2. Protocols
3.3. CEMs Design
3.4. Equipment
4. Results and Discussion
4.1. Selecting the Additive to Be Used in CEMs Formulation
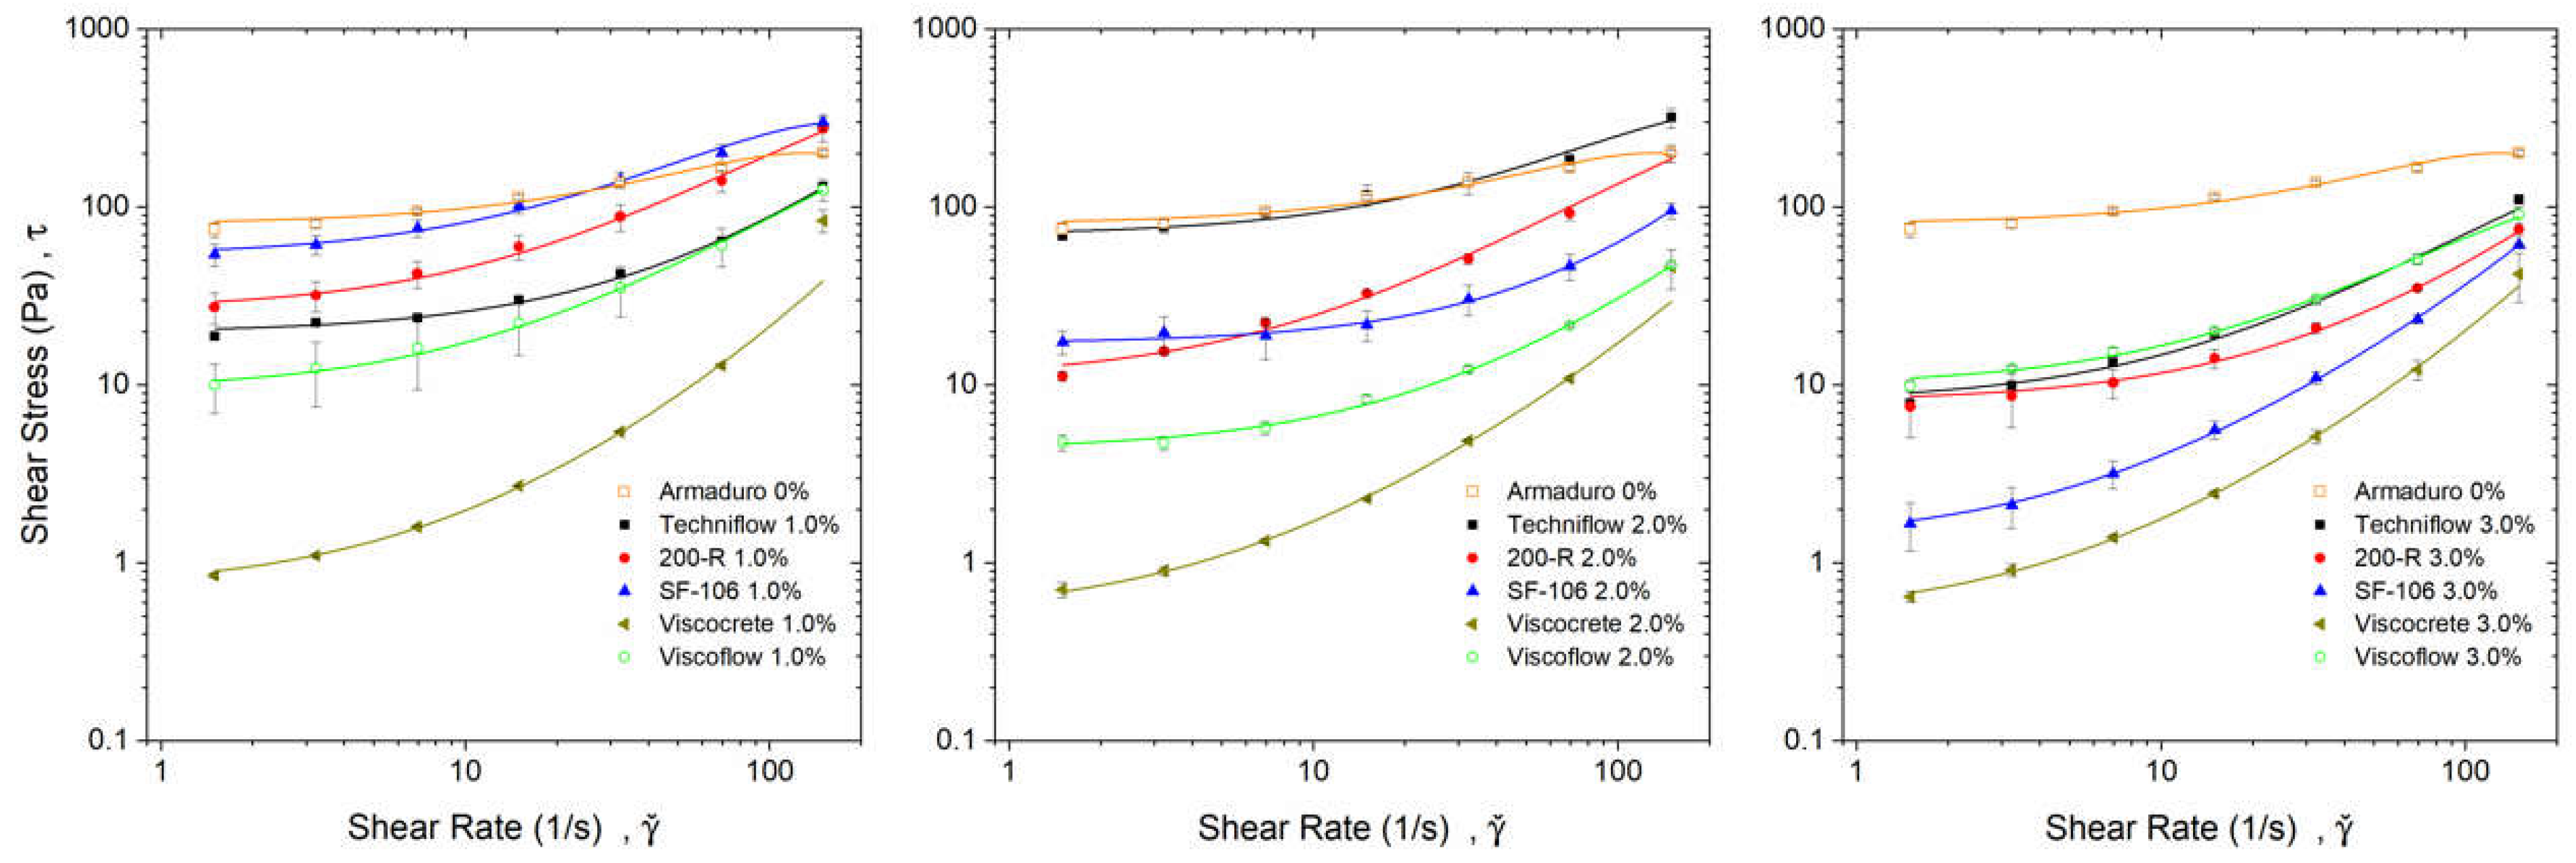
4.2. Rheological Behavior of the F1-CEMs
4.3. Rheology of F2-CEMs and F3-CEMs
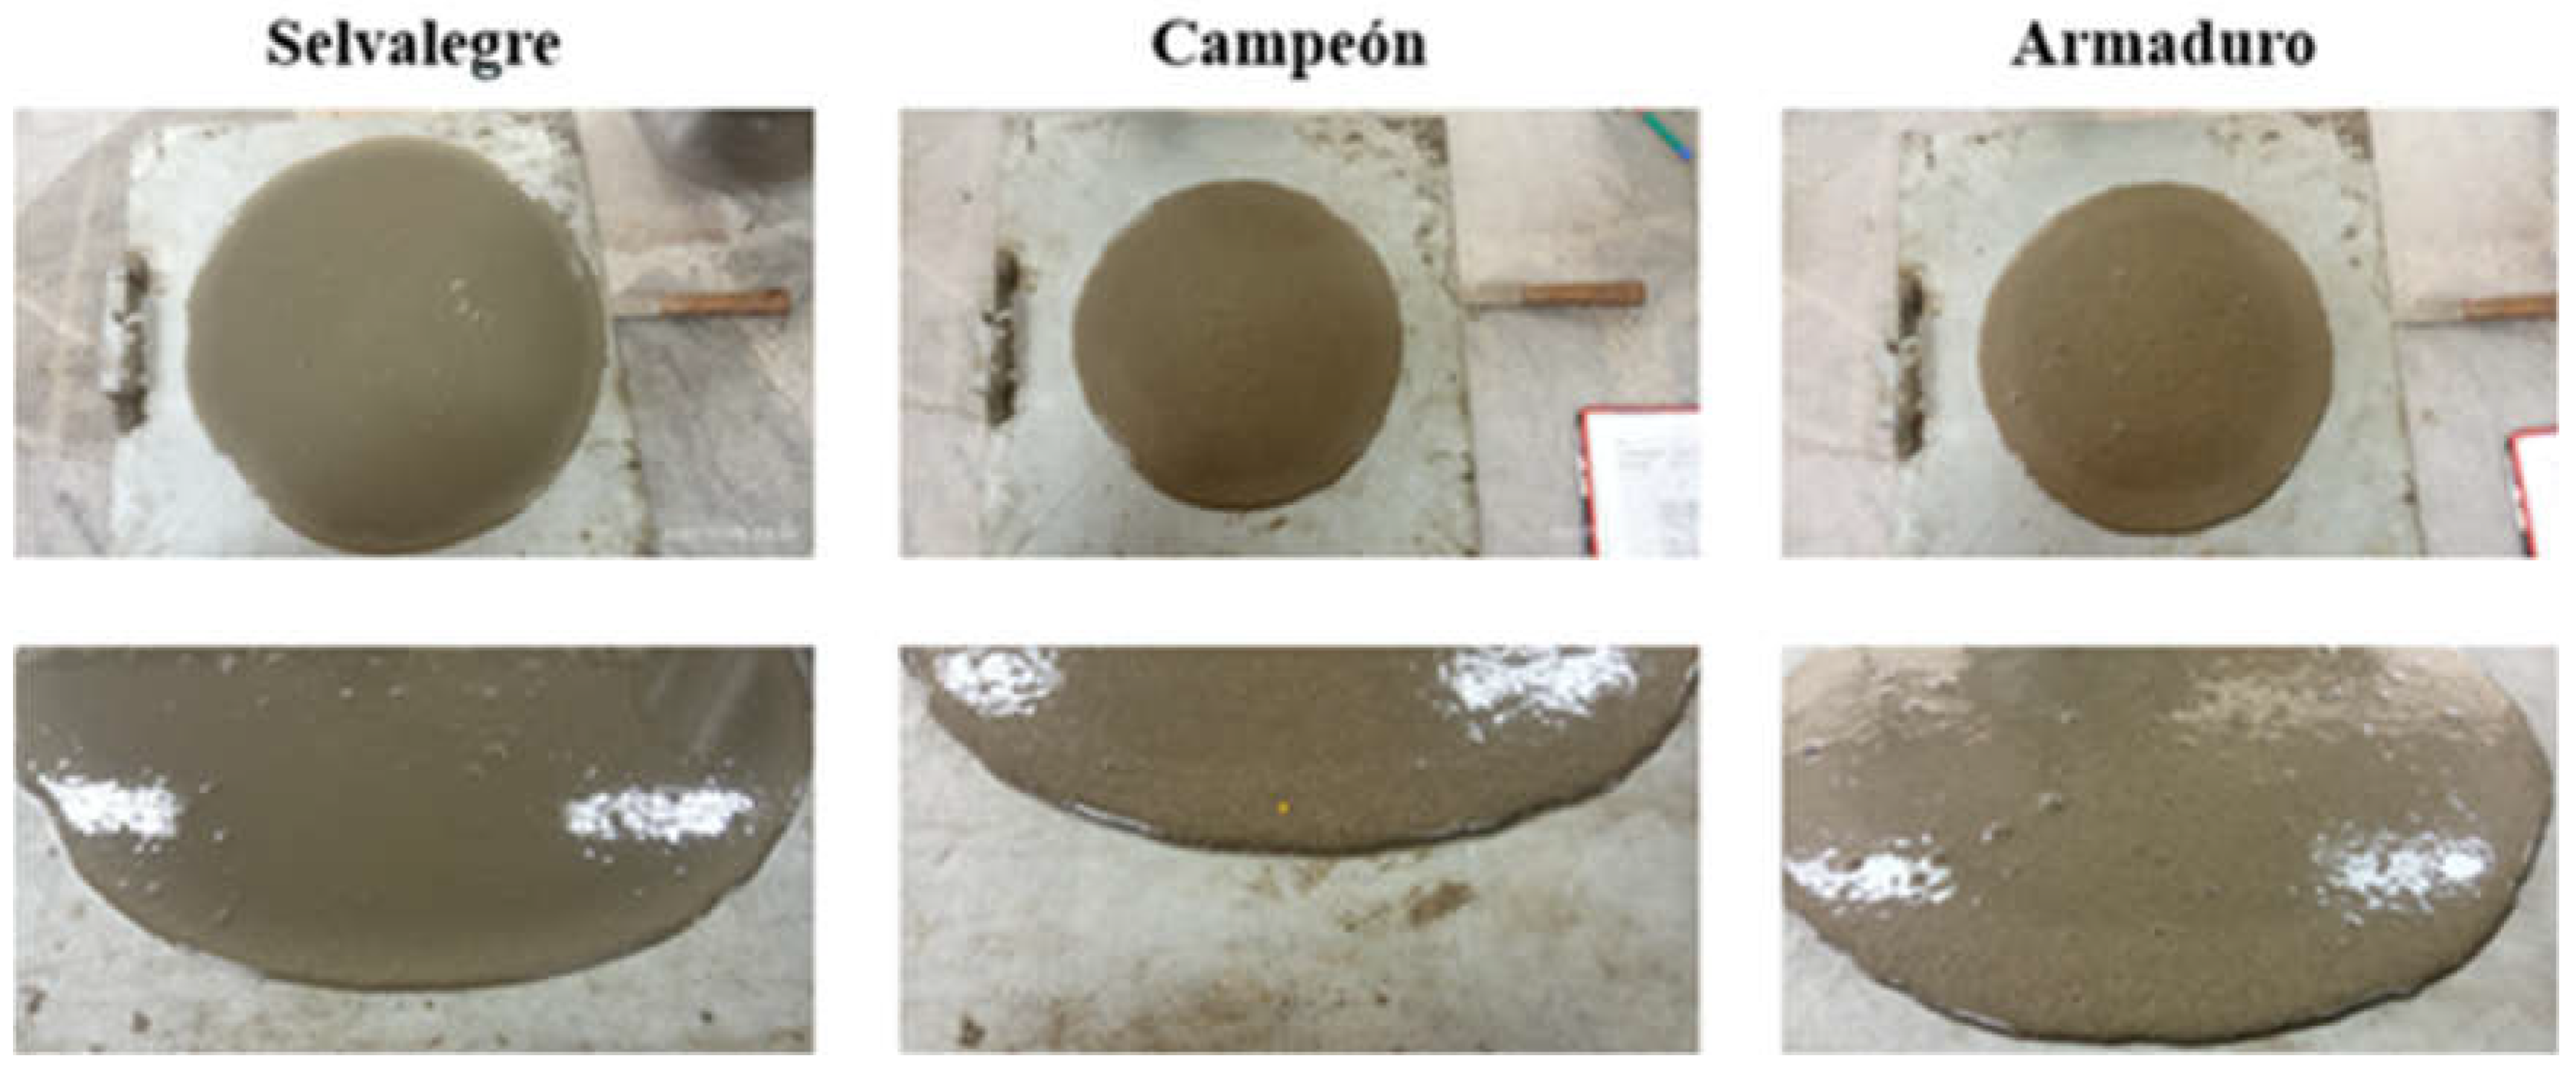
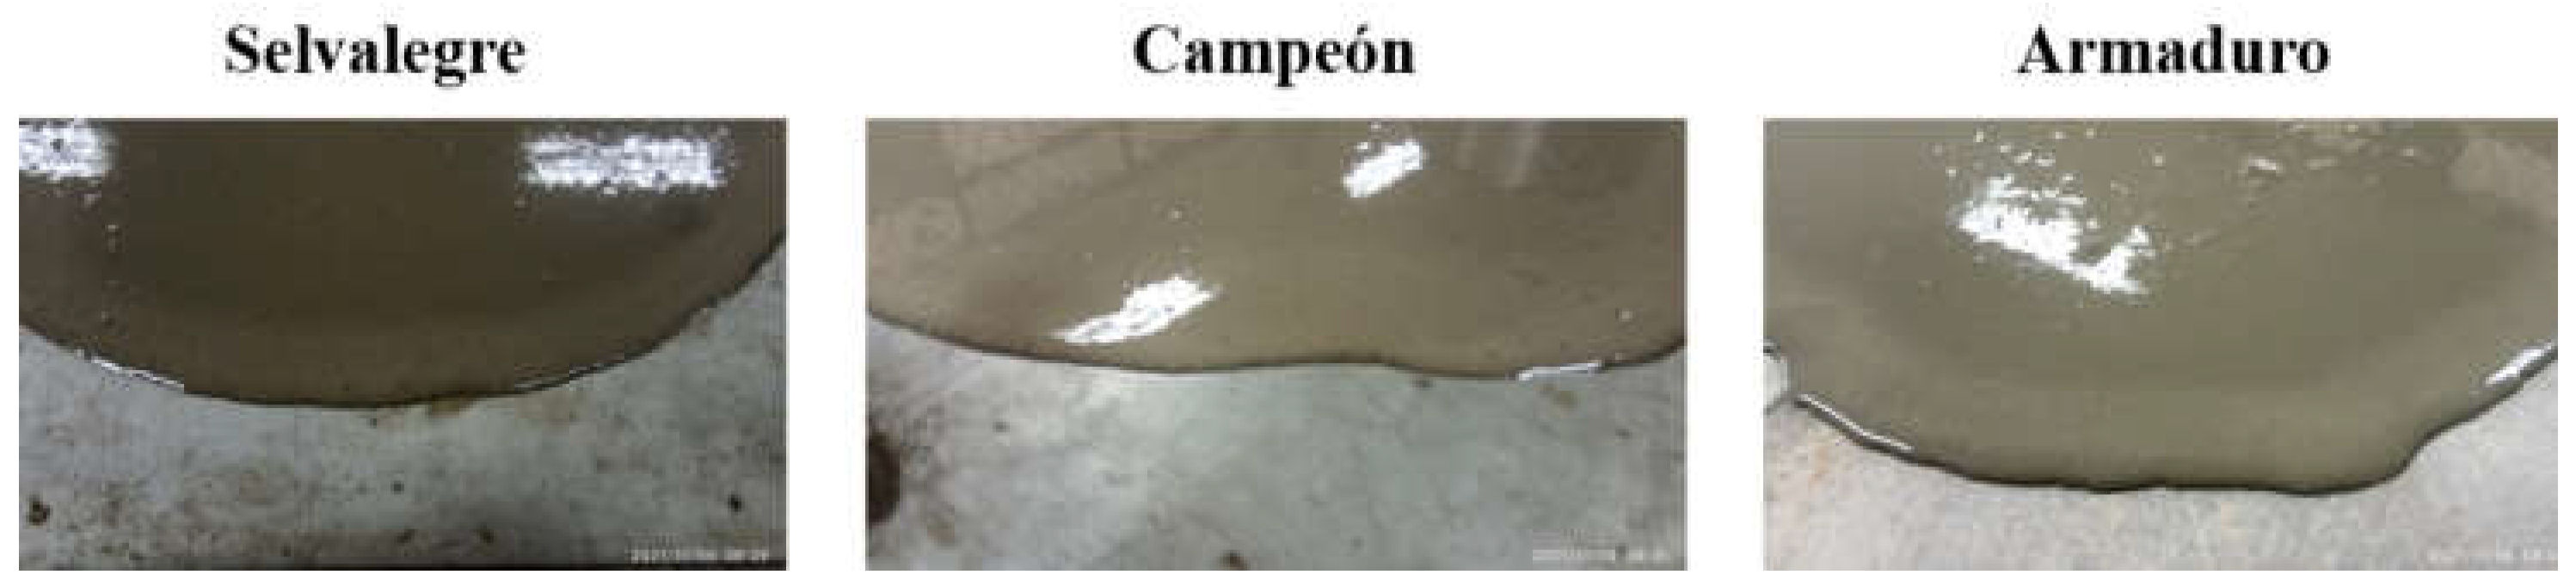
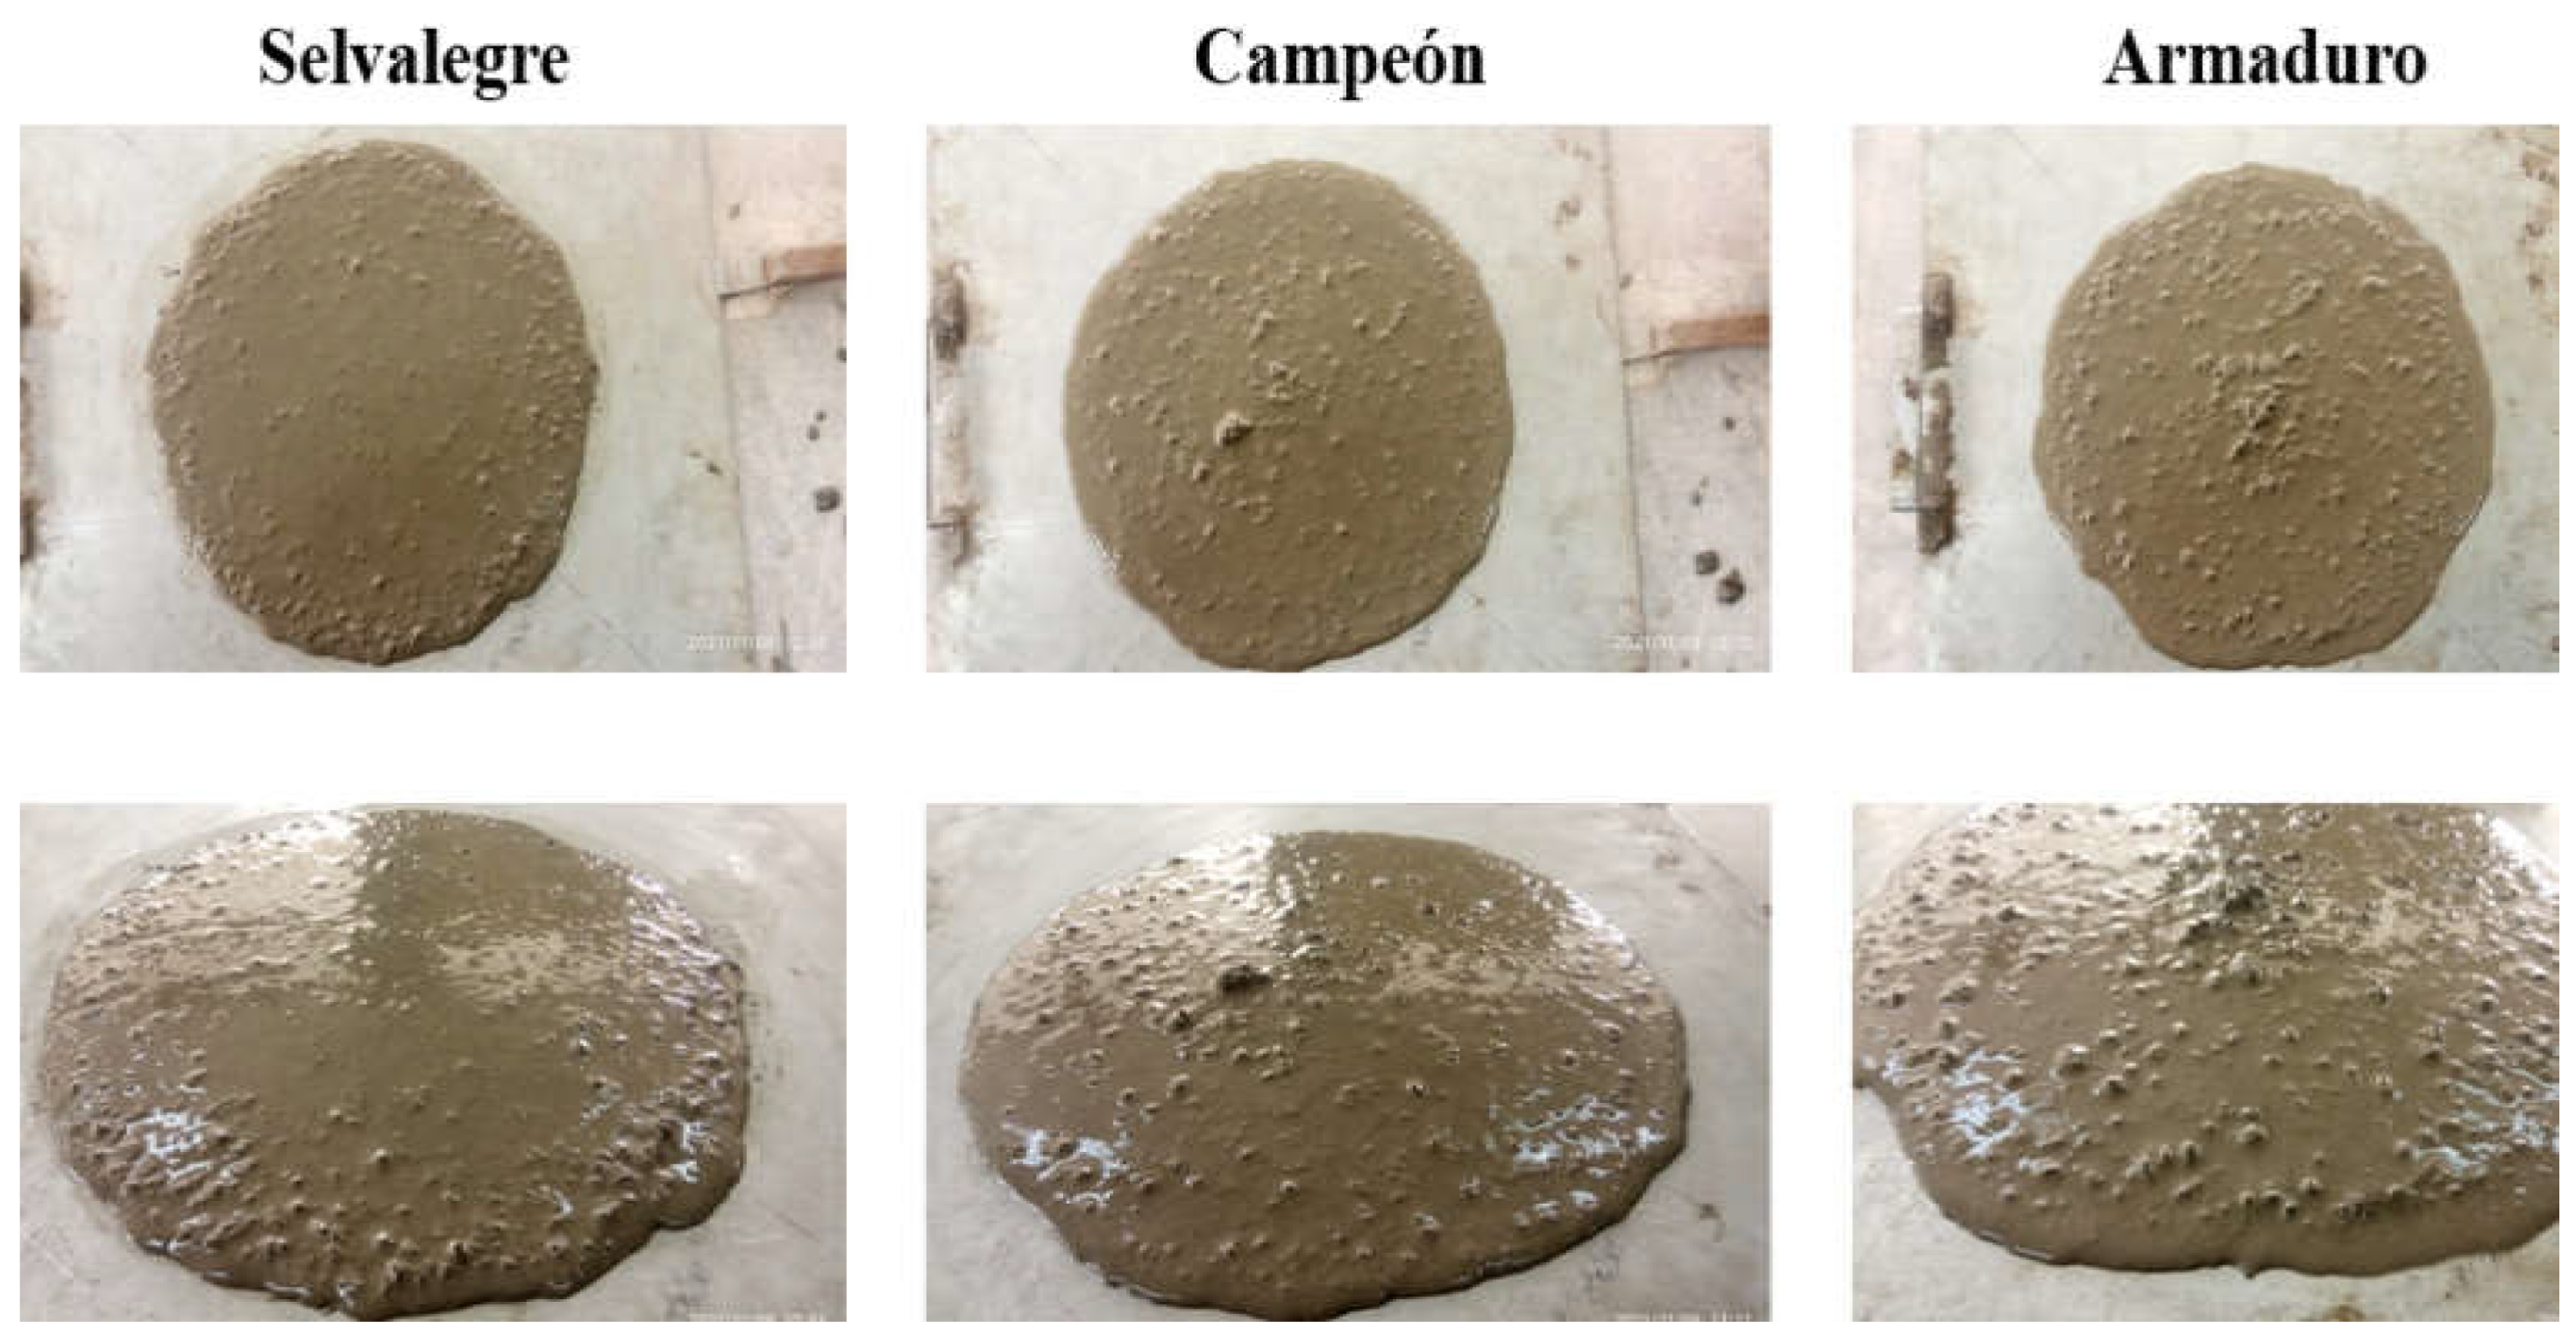
4.4. SCCVPC Formulation
5. Conclusions
Author Contributions
Funding
Data Availability Statement
Acknowledgments
Conflicts of Interest
References
- Feys, D.; Verhoeven, R.; De Schutter, G. Why is fresh self-compacting concrete shear thickening? Cem. Concr. Res. 2009, 39, 510–523. [Google Scholar] [CrossRef]
- Lemarchand, N.; Grasso, J.R. Interactions between earthquakes and volcano activity. Geophys. Res. Lett. 2007, 34, L24303. [Google Scholar] [CrossRef]
- Jiménez, M.J.; García-Fernández, M.; Romero, J. 1989–1995 Earthquake sequences in the Galeras volcano region, SW Colombia, and possible volcano-earthquake interactions. Tectonophysics 2009, 463, 47–59. [Google Scholar] [CrossRef]
- Higgins, M.D. The Cascadia megathrust earthquake of 1700 may have rejuvenated and isolated basalt volcano in western Canada: Age and petrographic evidence. J. Volcanol. Geoth. Res. 2009, 179, 149–156. [Google Scholar] [CrossRef]
- Aoyama, H.; Onizawa, S.; Kobayashi, T.; Tameguri, T.; Hashimoto, T.; Oshima, H.; Mori, H.Y. Inter-eruptive volcanism at Usu volcano: Micro-earthquakes and dome subsidence. J. Volcanol. Geoth. Res. 2009, 187, 203–217. [Google Scholar] [CrossRef]
- De la Cruz-Reyna, S.; Tárraga, M.; Ortiz, R.; Martínez-Bringas, A. Tectonic earthquakes triggering volcanic seismicity and eruptions. Case studies at Tungurahua and Popocatépetl volcanoes. J. Volcanol. Geoth. Res. 2010, 193, 37–48. [Google Scholar] [CrossRef]
- Johnson, J.H.; Prejean, S.; Savage, M.K.; Townend, J. Anisotropy, repeating earthquakes, and seismicity associated with the 2008 eruption of Okmok volcano, Alaska. J. Geophys. Res.-Sol. Earth 2010, 115, B00B04. [Google Scholar]
- Feuillet, N.; Beauducel, F.; Tapponnier, P. Tectonic context of moderate to large historical earthquakes in the Lesser Antilles and mechanical coupling with volcanoes. J. Geophys. Res.-Sol. Earth 2011, 116, B10308. [Google Scholar] [CrossRef]
- Jolly, A.D.; Neuberg, J.; Jeusset, P.; Sherburn, S. A new source process for evolving repetitious earthquakes at Ngauruhoe volcano, New Zealand. J. Volcanol. Geoth. Res. 2012, 215, 26–39. [Google Scholar] [CrossRef]
- Nonali, F.L.; Tibaldi, A.; Corazzato, C.; Tormey, D.R.; Lara, L.E. Quantifying the effect of large earthquakes in promoting eruptions due to stress changes on magma pathway: The Chile case. Tectonophysics 2013, 583, 54–67. [Google Scholar]
- Hossain, K.M.A. Properties of volcanic pumice based cement and lightweight concrete. Cem. Concr. Res. 2004, 34, 283–291. [Google Scholar] [CrossRef]
- Páez-Flor, N.M.; Rubio-Hernández, F.J.; Velázquez-Navarro, J.F. Effect of various plasticisers on viscous flow properties of natural pozzolanic cement pastes. Adv. Cem. Res. 2020, 32, 20–29. [Google Scholar] [CrossRef]
- Schwartzentruber, A.; Catherine, C. Method of the concrete equivalent mortar (CEM)-a new tool to design concrete containing admixture. Mater. Struct. 2000, 33, 475–482. [Google Scholar] [CrossRef]
- Li, J.; Tan, D.; Zhang, X.; Wan, C.; Xue, G. Mixture design method of slef-compacting lightweight aggregate concrete based on rheological property and strength of mortar. J. Build. Engin. 2021, 43, 102660. [Google Scholar] [CrossRef]
- Arnaud, L.; Dierkens, M. Setting and hardening of cement based materials: Which differences between mortars and concretes? In Advances in Construction Materials; Gross, C.U., Ed.; Springer: Berlin/Heidelberg, Germany, 2007. [Google Scholar]
- Rubio-Hernández, F.J.; Velázquez-Navarro, J.F.; Ordóñez-Belloc, L.M. Rheology of concrete: A study case based upon the use of the concrete equivalent mortar. Mater. Struct. 2013, 46, 587–605. [Google Scholar] [CrossRef]
- Ferraris, C.F.; Obla, K.H.; Hill, R. The influence of mineral admixtures on the rheology of cement paste and concrete. Cem. Concr. Res. 2001, 31, 245–255. [Google Scholar] [CrossRef]
- Larrard, F.; Sedran, T. Mixture-proportioning of high performance concrete. Cem. Concr. Res. 2002, 32, 1699–1704. [Google Scholar] [CrossRef]
- Flatt, R.J.; Larosa, D.; Roussel, N. Linking yield stress measurements: Spread test versus Viskomat. Cem. Concr. Res. 2006, 36, 99–109. [Google Scholar] [CrossRef]
- Mahaut, F.; Mokéddem, S.; Chateau, X.; Roussel, N.; Ovarlez, G. Effect of coarse particle volume fraction on the yield stress and thixotropy of cementitious materials. Cem. Concr. Res. 2008, 38, 1276–1285. [Google Scholar] [CrossRef]
- Newman, J. Advanced Concrete Technology Set; Elsevier: Amsterdam, The Netherlands, 2002. [Google Scholar]
- Yammine, J.; Chaouche, M.; Guerinet, M.; Moranville, M.; Roussel, N. From ordinary rheology concrete to self-compacting concrete: A transition between frictional to hydrodynamic interactions. Cem. Concr. Res. 2008, 38, 890–896. [Google Scholar] [CrossRef]
- Lecompte, T.; Perrot, A.; Picandet, V.; Bellegou, H.; Amziane, S. Cement-based mixes: Shearing properties and pore pressure. Cem. Concr. Res. 2012, 42, 139–147. [Google Scholar] [CrossRef]
- Feys, D.; Verhoeven, R.; Schutter, G. Evaluation of time independent rheological models applicable to fresh selfcompacting concrete. Appl. Rheol. 2007, 17, 56244. [Google Scholar]
- Saak, A.W.; Jenning, H.; Shah, S. New methodology for designing self-compacting concrete. ACI Mater. J. 2001, 98, 429–439. [Google Scholar]
- Roussel, N. A theoretical frame to study stability of fresh concrete. Mater. Struct. 2006, 39, 81–91. [Google Scholar] [CrossRef]
- Kovler, K.; Roussel, N. Properties of fresh and hardened concrete. Cem. Concr. Res. 2011, 41, 775–792. [Google Scholar] [CrossRef]
- Shen, L.; Struble, L.; Lange, D. Modeling dynamic segregation of self-consolidating concrete. ACI Mater. J. 2009, 106, 375–380. [Google Scholar]
- Larrard, F.; Ferraris, C.F.; Sedran, T. Fresh concrete: A Herschel-Bulkley material. Mater. Struct. 1998, 31, 494–498. [Google Scholar] [CrossRef]
- Cyr, M.; Legrand, C.; Mouret, M. Study of the shear-thickening effect of superplasticizers on the rheological behavior of cement pastes containing or not mineral additives. Cem. Concr. Res. 2000, 30, 1477–1483. [Google Scholar] [CrossRef]
- Feys, D.; Verhoeven, R.; Schutter, G. Fresh self-compacting concrete, a shear-thickening material. Cement Concrete Res. 2008, 38, 920–929. [Google Scholar] [CrossRef]
- NTE INEN 490:2011; Cementos hidráulicos compuestos. Instituto Ecuatoriano de Normalización: Quito, Ecuador, 2011. (In Spanish)
- NTE INEN 2380:2011; Cementos hidráulicos. Requisitos de desempeño para cementos hidráulicos. Instituto Ecuatoriano de Normalización: Quito, Ecuador, 2011. (In Spanish)
- NTE INEN 196:2009; Determinación de la finura mediante el aparato de permeabilidad al aire. Instituto Ecuatoriano de Normalización: Quito, Ecuador, 2009. (In Spanish)
- NTE INEN 156:2009; Cemento hidráulico. Determinación de la densidad. Instituto Ecuatoriano de Normalización: Quito, Ecuador, 2009. (In Spanish)
- Páez-Flor, N.M.; Rubio-Hernández, F.J.; Velázquez-Navarro, J.F. Steady viscous flow of some commercial Andean volcanic Portland cement pastes. Adv. Cem. Res. 2017, 29, 438–449. [Google Scholar] [CrossRef]
- Hammat, S.; Menadi, B.; Kenai, S.; Thomas, C.; Kirgiz, M.S.; de Sousa Galdino, A.G. The effect of content and fineness of natural pozzolana on the rheological, mechanical, and durability properties of self-compacting mortar. J. Build. Eng. 2021, 44, 103276. [Google Scholar] [CrossRef]
- Westerholm, M.; Lagerblad, B.; Silfwerbrand, J.; Forssberg, E. Influence of fine aggregate characteristics on the rheological properties of mortars. Cem. Concr. Comp. 2008, 30, 274–282. [Google Scholar] [CrossRef]
- De Schutter, G.; Pope, A.M. Quantification of the water demand of sand in mortar. Constr. Build. Mater. 2004, 18, 517–521. [Google Scholar] [CrossRef]
- ASTM C 128:2007; Standard Test Method for Density, Relative Density (Specific Gravity), and Absorption of Fine Aggregate. American Society for Testing and Materials: Philadelphia, PA, USA, 2007.
- Roussel, N.; Ovarlez, G.; Garrault, S.; Brumaud, C. The origins of thixotropy of fresh cement pastes. Cem. Concr. Res. 2012, 42, 148–157. [Google Scholar] [CrossRef]


| VW | Campeón | Selvalegre | Armaduro | |
|---|---|---|---|---|
| Andesine | 84.00 | 37.00 | 36.00 | 23.00 |
| Tchermakite | 8.00 | 6.40 | 5.00 | 4.60 |
| Quartz | 3.48 | 0.80 | 1.35 | 1.46 |
| Cordietite | 4.30 | 1.70 | 0.70 | 1.30 |
| C3S | - | 40.20 | 42.70 | 51.80 |
| C2S | - | 4.90 | 5.50 | 6.40 |
| C4AF | - | 2.50 | 3.10 | 3.30 |
| C3A | - | 3.80 | 4.40 | 5.20 |
| Gypsum | - | 2.20 | 1.70 | 2.70 |
| VW percentage | 100 | 46.4 | 42.6 | 30.6 |
| PC percentage | 0 | 53.6 | 57.4 | 69.4 |
| SiO2 | - | 34.6 | 31.4 | 28.5 |
| Al2O3 | - | 9.5 | 8.5 | 7.8 |
| Fe2O3 | - | 4.0 | 4.1 | 3.7 |
| CaO | - | 42.6 | 47.9 | 52 |
| MgO | - | 2.4 | 2.4 | 2.3 |
| SO3 | - | 2.1 | 2.0 | 2.3 |
| Na2O | - | 2.0 | 1.7 | 1.6 |
| K2O | - | 0.6 | 0.5 | 0.5 |
| TiO2 | - | 0.5 | 0.4 | 0.4 |
| Particle size (μm) | - | 29–32 | 29–32 | 29–32 |
| Density (g/cm3) | - | 2.94 | 2.95 | 3.00 |
| Blaine surface (m2/g) | - | 2.6 | 2.4 | 2.2 |
| ADITEC | ADMIX | SIKA | |||||
|---|---|---|---|---|---|---|---|
| Techniflow605 | SF106 | 200R | Megamix | Viscomix | Vicocrete 4100 | Viscoflow50L | |
| Density (g/cm3) | 1.10 | 1.18 | 1.19 | 1.17 | 1.07 | 1.10 | 1.11 |
| Dosage interval (%) | 0.19–0.9 | 0.93–2 | 0.93–2 | 0.5–2.5 | 0.5–1.5 | 0.19–0.9 | 0.4–2.3 |
| Cement | Sand | Gravel | Water |
|---|---|---|---|
| (kg) | (kg) | (kg) | (kg) |
| 520 | 750 | 750 | 208 |
| BS | BP | FS | |||||||
|---|---|---|---|---|---|---|---|---|---|
| Sieve (mm) | Cumulative Passing (%) | S (m2) | Weighted Surface (m2/kg) | Cumulative Passing (%) | S (m2) | Weighted Surface (m2/kg) | Cumulative Passing (%) | S (m2) | Weighted Surface (m2/kg) |
| <0.075 | 0.00 | 65.17 | 4.039 | 0.00 | 63.19 | 2.337 | 0.00 | 64.86 | 2.209 |
| 0.075 | 6.20 | 21.82 | 1.013 | 3.70 | 21.16 | 0.844 | 3.41 | 21.72 | 1.823 |
| 0.149 | 10.84 | 10.88 | 1.242 | 7.69 | 10.56 | 2.793 | 11.80 | 10.83 | 2.133 |
| 0.3 | 22.25 | 5.43 | 2.234 | 34.15 | 5.27 | 1.101 | 31.49 | 5.40 | 1.121 |
| 0.6 | 63.42 | 2.74 | 0.459 | 55.06 | 2.66 | 0.454 | 52.23 | 2.73 | 0.477 |
| 1.18 | 80.16 | 1.38 | 0.274 | 72.11 | 1.34 | 0.373 | 69.70 | 1.37 | 0.416 |
| 2.36 | 100.00 | 0.77 | 0.000 | 100.00 | 0.75 | 0.000 | 100.00 | 0.76 | 0.000 |
| 9.261 | 7.902 | 8.179 | |||||||
| Sieve (mm) | Cumulative Passing (%) | S (m2) | Weighted Surface (m2/kg) |
|---|---|---|---|
| <2.36 | 0.00 | 2.097 | 0.079 |
| 2.36 | 3.76 | 0.695 | 0.044 |
| 4.76 | 9.93 | 0.347 | 0.115 |
| 9.51 | 43.19 | 0.225 | 0.043 |
| 12.5 | 62.49 | 0.157 | 0.039 |
| 19 | 87.51 | 0.111 | 0.010 |
| 25.4 | 96.92 | 0.079 | 0.002 |
| 38.1 | 100.00 | 0.055 | 0.000 |
| 0.332 |
| Cement | Sand | Sand/Cement (s/c) | Water/Cement (w/c) | Additive (%) | Fi/Cement (Fi/c) |
|---|---|---|---|---|---|
| SA | BS | 1.49 | 0.30 | 2.00 | 1.49 (F1) |
| 0.35 | 1.03 (F2) | ||||
| 0.40 | 0.34 (F3) | ||||
| BP | 1.75 | 0.30 | 1.75 (F1) | ||
| 0.35 | 1.08 (F2) | ||||
| 0.40 | 0.49 (F3) | ||||
| FS | 1.69 | 0.30 | 1.69 (F1) | ||
| 0.35 | 0.99 (F2) | ||||
| 0.40 | 0.41 (F3) | ||||
| CO | BS | 1.49 | 0.30 | 2.00 | 1.49 (F1) |
| 0.35 | 1.03 (F2) | ||||
| 0.40 | 0.34 (F3) | ||||
| BP | 1.75 | 0.30 | 1.75 (F1) | ||
| 0.35 | 1.08 (F2) | ||||
| 0.40 | 0.49 (F3) | ||||
| FS | 1.69 | 0.30 | 1.69 (F1) | ||
| 0.35 | 0.99 (F2) | ||||
| 0.40 | 0.41 (F3) | ||||
| AM | BS | 1.49 | 0.30 | 2.00 | 1.49 (F1) |
| 0.35 | 1.03 (F2) | ||||
| 0.40 | 0.34 (F3) | ||||
| BP | 1.75 | 0.30 | 1.75 (F1) | ||
| 0.35 | 1.08 (F2) | ||||
| 0.40 | 0.49 (F3) | ||||
| FS | 1.69 | 0.30 | 1.69 (F1) | ||
| 0.35 | 0.99 (F2) | ||||
| 0.40 | 0.41 (F3) |
| Additive | %cw | ||||
|---|---|---|---|---|---|
| Techniflow | 1 | 0.9997 | 20 ± 1 | 0.60 ± 0.05 | 0.0008 ± 0.0003 |
| 2 | 0.9998 | 70 ± 4 | 2.3 ± 0.5 | ~0 | |
| 3 | 0.9995 | 8.1 ± 0.9 | 0.68 ± 0.06 | ~0 | |
| 200-R | 1 | 0.9999 | 27 ± 7 | 1.9 ± 0.2 | ~0 |
| 2 | 0.9996 | 9.5 ± 0.8 | 1.5 ± 0.1 | −(0.002 ± 0.001) | |
| 3 | 0.9999 | 8.0 ± 0.6 | 0.35 ± 0.03 | ~0 | |
| SF 106 | 1 | 0.9994 | 53 ± 9 | 3.0 ± 0.3 | −(0.009 ± 0.002) |
| 2 | 0.9999 | 17.2 ± 0.5 | 0.34 ± 0.04 | 0.0010 ± 0.0003 | |
| 3 | 0.9999 | 1.3 ± 0.1 | 0.26 ± 0.01 | 0.0009 ± 0.0001 | |
| Viscocrete | 1 | 0.9997 | 0.7 ± 0.2 | 0.12 ± 0.02 | 0.0009 ± 0.0004 |
| 2 | 0.9999 | 0.52 ± 0.08 | 0.12 ± 0.01 | 0.0005 ± 0.0002 | |
| 3 | 0.9999 | 0.50 ± 0.04 | 0.12 ± 0.01 | 0.0008 ± 0.0001 | |
| Viscoflow | 1 | 0.9999 | 8.8 ± 0.3 | 0.83 ± 0.06 | ~0 |
| 2 | 0.9999 | 4.3 ± 0.2 | 0.23 ± 0.01 | 0.0004 ± 0.0001 | |
| 3 | 0.9999 | 9.9 ± 0.5 | 0.68 ± 0.04 | −(0.0011 ± 0.0005) | |
| - | 0 | 0.9995 | 80 ± 4 | 1.9 ± 0.2 | −(0.007 ± 0.001) |
| Cement | Aggregate | w/c | ||||
|---|---|---|---|---|---|---|
| Selvalegre | ||||||
| Campeón | ||||||
| Armaduro | ||||||
| Cement | Aggregate | w/c | ||||
|---|---|---|---|---|---|---|
| Selvalegre | ||||||
| . | ||||||
| Campeón | ||||||
| Armaduro | ||||||
| Cement | Aggregate | w/c | ||||
|---|---|---|---|---|---|---|
| Selvalegre | ||||||
| Campeón | ||||||
| Armaduro | ||||||
| CEM Phase | Cement (kg) | Sand (kg) | Water/Cement (w/c) | 2% Additive (kg) | Water Absorption (kg) | T20 (s) | d (cm) |
|---|---|---|---|---|---|---|---|
| F1 | SA | BS | |||||
| 520.00 | 751.28 | 0.30 | 10.40 | 31.08 | 15.54 | 27.75 | |
| CO | BS | ||||||
| 520.00 | 751.28 | 0.30 | 10.40 | 31.08 | 13.25 | 28.00 | |
| AM | BS | ||||||
| 520.00 | 751.28 | 0.30 | 10.40 | 31.08 | 8.12 | 28.00 | |
| F2 | SA | BS | |||||
| 520.00 | 516.89 | 0.30 | 10.40 | 25.79 | 7.45 | 30.75 | |
| CO | BS | ||||||
| 520.00 | 516.89 | 0.30 | 10.40 | 25.79 | 5.10 | 33.00 | |
| AM | BS | ||||||
| 520.00 | 516.89 | 0.30 | 10.40 | 25.79 | 4.17 | 32.50 | |
| F3 | SA | BS | |||||
| 520.00 | 246.43 | 0.30 | 10.40 | 12.22 | 3.48 | 38.00 | |
| CO | BS | ||||||
| 520.00 | 246.43 | 0.30 | 10.40 | 12.22 | 3.91 | 36.75 | |
| AM | BS | ||||||
| 520.00 | 246.43 | 0.30 | 10.40 | 12.22 | 3.21 | 33.75 |
| Gravel (kg) | Cement (kg) | Sand (2.36 mm) (kg) | Water/Cement (w/c) | 2% Additive (kg) | T50 (s) | d (cm) |
|---|---|---|---|---|---|---|
| SA | BS | |||||
| 750.00 | 520.00 | 237.9 | 0.30 | 10.40 | 24.10 | 86.30 |
| CO | BS | |||||
| 750.00 | 520.00 | 237.9 | 0.30 | 10.40 | 17.83 | 88.8 |
| AM | BS | |||||
| 750.00 | 520.00 | 237.9 | 0.30 | 10.40 | 12.03 | 93.00 |
Publisher’s Note: MDPI stays neutral with regard to jurisdictional claims in published maps and institutional affiliations. |
© 2022 by the authors. Licensee MDPI, Basel, Switzerland. This article is an open access article distributed under the terms and conditions of the Creative Commons Attribution (CC BY) license (https://creativecommons.org/licenses/by/4.0/).
Share and Cite
Naranjo-Herrera, L.F.; Páez-Flor, N.M.; Rubio-Hernández, F.J. Using Natural Raw Materials and CEM Approach for the Design of Andean Volcanic Self-Compacting Concretes. Processes 2022, 10, 1820. https://doi.org/10.3390/pr10091820
Naranjo-Herrera LF, Páez-Flor NM, Rubio-Hernández FJ. Using Natural Raw Materials and CEM Approach for the Design of Andean Volcanic Self-Compacting Concretes. Processes. 2022; 10(9):1820. https://doi.org/10.3390/pr10091820
Chicago/Turabian StyleNaranjo-Herrera, L. F., N. M. Páez-Flor, and F. J. Rubio-Hernández. 2022. "Using Natural Raw Materials and CEM Approach for the Design of Andean Volcanic Self-Compacting Concretes" Processes 10, no. 9: 1820. https://doi.org/10.3390/pr10091820