Article

A Mechanistic Study on the Anti-Corrosive Performance of Zinc-Rich Polyester/TGIC Powder Coatings

1
Department of Chemical and Biochemical Engineering, Western University, London, ON N6A 5B9, Canada
2
Department of Chemistry, Western University, London, ON N6A 5B7, Canada
3
Key Laboratory of Nuclear Materials and Safety Assessment, Institute of Metal Research, Chinese Academy of Sciences, Shenyang 110016, China
4
Surface Science Western, Western University, London, ON N6G 0J3, Canada
5
Collaborative Innovation Center of Chemical Science and Engineering (Tianjin), School of Chemical Engineering and Technology, Tianjin University, Tianjin 300072, China
*
Authors to whom correspondence should be addressed.
Processes 2022, 10(9), 1853; https://doi.org/10.3390/pr10091853
Submission received: 25 August 2022 / Revised: 7 September 2022 / Accepted: 9 September 2022 / Published: 14 September 2022
(This article belongs to the Section Particle Processes)

Abstract

:
Powder coatings represent an environmentally friendly VOC-free alternative to widely used solvent-borne zinc-rich coatings, with economic and ecological benefits. In particular, powder coatings have several advantageous properties, such as chemical resistance and mechanical strength. However, the performance and characteristics of polyester-based zinc-containing powder coatings remain unknown. In this study, the corrosion performance of polyester powder coatings containing up to 80% zinc is compared. Electrochemical and salt-spray testing results indicate that coatings formulated with 80% zinc demonstrate superior anti-corrosive properties than coatings with lower zinc dosages. Two distinct behavioral phases of the coating with 80% zinc were observed by measurements of open circuit potential (OCP) and polarization resistance (Rp) during immersion tests—a phase indicative of a barrier effect and a phase consistent with galvanic protection. The evolution of the coating was further characterized and interpreted as five stages by electrochemical impedance spectroscopy (EIS), and the mechanistic details were discussed. This UV-resistant single-layer powder coating has the potential to replace the commonly used high-VOC multi-layer liquid coating systems at a significantly lower cost.

Graphical Abstract

1. Introduction

Metals are the most widely used structural materials at present, but corrosion always occurs on metallic substrates’ surfaces. Paints and coatings are widely used to protect metallic substrates against corrosion [1,2]. However, most anti-corrosive coatings are solvent-borne liquid coatings, which contain a high percentage of volatile organic compounds (VOCs), making them harmful to people and the environment [3,4]. Powder coatings avoid the use of solvents and therefore overcome this environmental problem. Moreover, compared to solvent-based coatings, powder coatings can achieve greater film thicknesses with each pass of spray, which is beneficial for heavy-duty anti-corrosive purposes [5,6].
The properties and performance of coatings are determined by their formulation, processing parameters, and application methods [4,7]. Both thermoplastic and thermosetting powder coatings are available; however, most powder coatings used in anti-corrosive applications are thermosetting, since they can offer higher adhesion strength, chemical resistance, and durability [6,8]. Thermosetting coatings consist of a resin and a curing agent (collectively called a “binder”), pigments, fillers, and various other additives [9,10].
Thermosetting powder coatings can be formulated with many types of binders, i.e., the combination of resin and curing agent, such as epoxy/DICY (dicyandiamide), polyester/TGIC (triglycidyl isocyanurate), polyester/HAA (β-hydroxyalkyl amide), epoxy-polyester hybrid, and PU (polyurethane), etc. [9,11] The binder forms a polymer network during the curing process to retain other components in the coating [12,13,14]. Compared to other powder coatings formulations, the polyester/TGIC system has balanced properties and is comparatively cost-effective. Being superior to epoxy powder coatings, polyester coatings can withstand long-term UV exposure for outdoor applications [8].
Additives and functional fillers can be incorporated into the binder to enhance the coating performance effectively and economically [1,6]. Elemental zinc is widely used as functional filler (also referred to as anti-corrosive pigment) to enhance the anti-corrosive properties of powder coatings by serving as a sacrificial anode (i.e., galvanic protection) [15,16,17]. This requires that the zinc particles be in percolation, i.e., be interconnected so that an artificial galvanic coupling can take place between the coating film and the metallic substrate [18]. The substrate can be protected and preserved in the corrosive environment by the preferential dissolution of zinc. The dissolution of zinc inside the coating film is the anodic half-reaction, and oxygen reduction taking place adjacent to the coating–substrate interface is the cathodic half-reaction [15,19]. The two electrochemical half reactions (1) and (2) are as follows.
Zn Zn 2 + + 2 e ( anodic )
O 2 + 2 H 2 O + 4 e 4 OH ( cathodic )
Zinc-rich powder coating with epoxy binders have been extensively studied [15,16,17,18,20,21,22], but studies on formulating polyester-based coatings, which are suitable for outdoor applications, are rare. The most important factor in incorporating zinc as a functional filler into coatings is the dosage (content). In solvent-borne epoxy-based liquid coatings, a minimum of 65% zinc is required to provide galvanic protection, as recommended by the standard SSPC Paint 20 for organic zinc-rich coatings [23]. In polyester/TGIC powder coatings, the effect of zinc content on corrosion protection has not been studied, and the current research aims to explore this thoroughly.
Besides the zinc dosage in the formulae, the geometry of the zinc particles can also affect the performance of the zinc-rich coatings. Lamellar zinc particles were found to have stronger barrier and shielding effects than spherical particles [24,25]. Both types of zinc particles can be combined with other additives and fillers to further enhance the anti-corrosive properties of the coatings [26,27]. A standard spherical zinc powder was adopted in this study due to its wider availability and lower cost.
The corrosion performance of the coatings can be assessed by various means. The neutral salt-spray test, as per ASTM B117–16 [28], is the most widely used industrial test method to evaluate the anti-corrosive properties of coatings. However, this method cannot provide detailed information for coating changes between the inspection intervals. Especially, this method was not adopted for most reported works on zinc-rich coatings. As a supplement, electrochemical techniques can monitor the detailed changes in the coating film over time to facilitate coating formula comparison and optimization [29,30,31]. The open-circuit potential (OCP, also called free corrosion potential, Ecorr) of the coated panels can be measured over the course of prolonged immersion in an electrolyte; a value below −800 mV versus SCE (the saturated calomel electrode) is believed to indicate the galvanic protection of coated steel [17,32]. Another powerful technique, electrochemical impedance spectroscopy (EIS), can quantify coating performance and defects by utilizing equivalent electrical circuit (EEC) modeling [21,33,34,35]. In these models, the coating films are depicted as dense, non-conductive barriers with pores of various sizes. When the coating films are in contact with the corrosive electrolyte, the pores gradually fill with the electrolyte, causing a decrease in the pore resistance and an increase in the coating capacitance. These numeric values can be used to quantitatively evaluate different coating formulae and application methods [36,37,38]. Alternatively, more complex EECs, based on a transmission line model, can be adopted to perform the data fitting and interpretation of the EIS spectra of zinc-rich coatings. The connected, semi-connected, and isolated zinc particles are treated as being in parallel in the model circuits, and the contribution from each type of particle is determined arbitrarily or mathematically [18,39]. The polarization resistance (Rp) is another value used to indicate the shielding and barrier effect of the coating films; a higher value indicates stronger protection [40].
A typical anti-corrosive coating system consists of primer (basecoat, providing adhesion and corrosion resistance), intermediate coat (tie-coat, bonding the primer and topcoat), and topcoat (providing decoration and UV-resistance) at high film thickness [1,30,41,42]. There is a strong demand from the industry to have coatings with higher performance at a lower cost. In this study, the performance of a single-layer powder coating (i.e., a monocoat system) providing the adhesion, corrosion resistance, and UV protection from one coat has been evaluated, and the data obtained using salt spray testing and electrochemical techniques are compared. The distinct behaviors and the underlying mechanisms of the new coatings are investigated in detail by the EEC modeling of the EIS spectra coupled with other analytical techniques.

2. Materials and Methods

2.1. Materials and Formulations

The zinc powder (“zinc dust”) with a median diameter of 3.5 µm (D50, volume) was provided by Jiangsu Shuangsheng Zinc Co., Ltd. (Yangzhou, China) and was sealed airtight before use to prevent oxidation. The zinc particles have high sphericity and are shown in Figure 1a,b. A series of powder coatings with zinc dosages of 20, 40, 60, and 80% (wt%) were prepared according to the formulae listed in Table 1; the formulation of the polyester/TGIC binder is listed in Table 2. The resin and curing agent are the film-forming component, which are cross-linked during the curing process to provide strength and durability to the coatings. The flow and leveling agent and degassing agent improve the melt-flow process to achieve satisfactory surface quality and to prevent defects inside the coating.

2.2. Preparation of Powder-Coated Panels

Preparation of the powder coatings was performed on a laboratory-scale extruder model SLJ-10 (Yantai Donghui Powder Coating Equipment Co., Yantai, China). Due to the high pigment load of zinc particles in the formulae, higher-than-average processing temperatures were used [8]. The infeed, plastification, and homogenizing zones temperatures were set at 100, 110, and 120 °C, respectively, which is 20 °C higher than used with other ordinary formulae without zinc powder. A twin-screw rotation speed of 300 rpm, a screw feeder speed of 10 rpm, and a rolling chiller speed of 10 rpm were maintained for all the formulations. After the extrusion, the hot extrudate was cooled down, crushed into chips, pulverized, and sieved into coating powder with a median diameter (D50, volume) of 35 ± 3 µm.
The powder coatings prepared from the different formulations were sprayed electrostatically at a constant voltage of −35 kV, using a Gema OptiSelect corona-charged gun and an OptiStar manual gun control unit (Gema Switzerland GmbH, Gallen, Switzerland).
The powder coatings were sprayed onto phosphated steel panels (76 mm × 152 mm × 0.81 mm, ASTM D609–17 Type 2, Q-Lab Corporation, Westlake, OH, USA) and cured at 200 °C for 15 min. The film thicknesses were measured by a non-destructive film thickness gauge PosiTector 6000 (DeFelsko Corporation, Ogdensburg, NY, USA), as per ASTM D7091–13. Visually defect-free panels with a mean film thickness of 60 ± 5 µm were used for testing.

2.3. Electrochemical Measurements

All of the electrochemical characterizations, including the OCP, Rp, and EIS measurements, were performed using an integrated Solartron ModuLab XM digital potentiostat and frequency response analyzer (AMETEK Scientific Instruments, Oak Ridge, TN, USA). All electrochemical measurements were made in a Faraday cage to minimize the influence of external sources of noise. A standard 3-electrode configuration was adopted, with the coated panel used as the working electrode, a Pt plate as the counter electrode, and a saturated calomel electrode (SCE) as the reference electrode. The experimental solution was a 5% NaCl solution made with Type I water (18.2 MΩ∙cm). The measurements were performed at one-day intervals to monitor the coating film changes over time.
The Rp measurement was performed at a scan rate of 10 mV/min in the region of OCP ± 10 mV. The EIS scanning was conducted using a sinusoidal perturbation of 10 mV amplitude over a frequency range of 10 mHz to 100 kHz. EIS spectra fitting by the partial least squares method was performed using the software ZView version 4.0c (Scribner Associates, Southern Pines, NC, USA).

2.4. Characterization Techniques

Scanning electron microscope (SEM) imaging of the coating surfaces and cross-sections was performed on a SU3500 (Hitachi High-Technologies Corporation, Tokyo, Japan) scanning electron microscope using the secondary electron mode. A ZEISS confocal microscope for materials LSM 800 (Carl Zeiss Microscopy GmbH, Jena, Germany) was used for surface topography mapping and roughness measurements. The roughness values were calculated in Mountains ConfoMap (Digital Surf, Besançon, France) version 7.4.8341 as per ISO 25178-2:2012. An InVia reflex Raman spectrometer (Renishaw plc, Wotton-under-Edge, UK) was used to collect the Raman spectroscopy at the 633 nm laser wavelength for identifying the corrosion products on the salt-spray tested panels. XRD (X-ray diffraction) with a low grazing incidence angle of 3° was also used for identifying the corrosion products on larger coated areas of approximately 70 × 70 mm2, using a Rigaku SmartLab X-ray diffractometer (Rigaku Corporation, Tokyo, Japan) with Cross Beam Optics (CBO) and a 2D HyPix-3000 high-energy-resolution detector. The X-ray microtomography (microCT) was performed on a ZEISS Xradia Context microCT (Carl Zeiss Microscopy GmbH, Jena, Germany) for non-destructive 3D imaging. The data reconstruction, post-processing, and visualization were performed using the software ZEISS Scout-and-Scan (Carl Zeiss Microscopy GmbH, Jena, Germany) version 16.0 and Dragonfly Pro (Object Research Systems, Montréal, QC, Canada) version 4.0.0.569.

2.5. Coating Performance Evaluations

The applicable ASTM test methods and the instruments for coating property measurements employed in this study are listed in Table 3.

3. Results and Discussion

3.1. Coating Properties

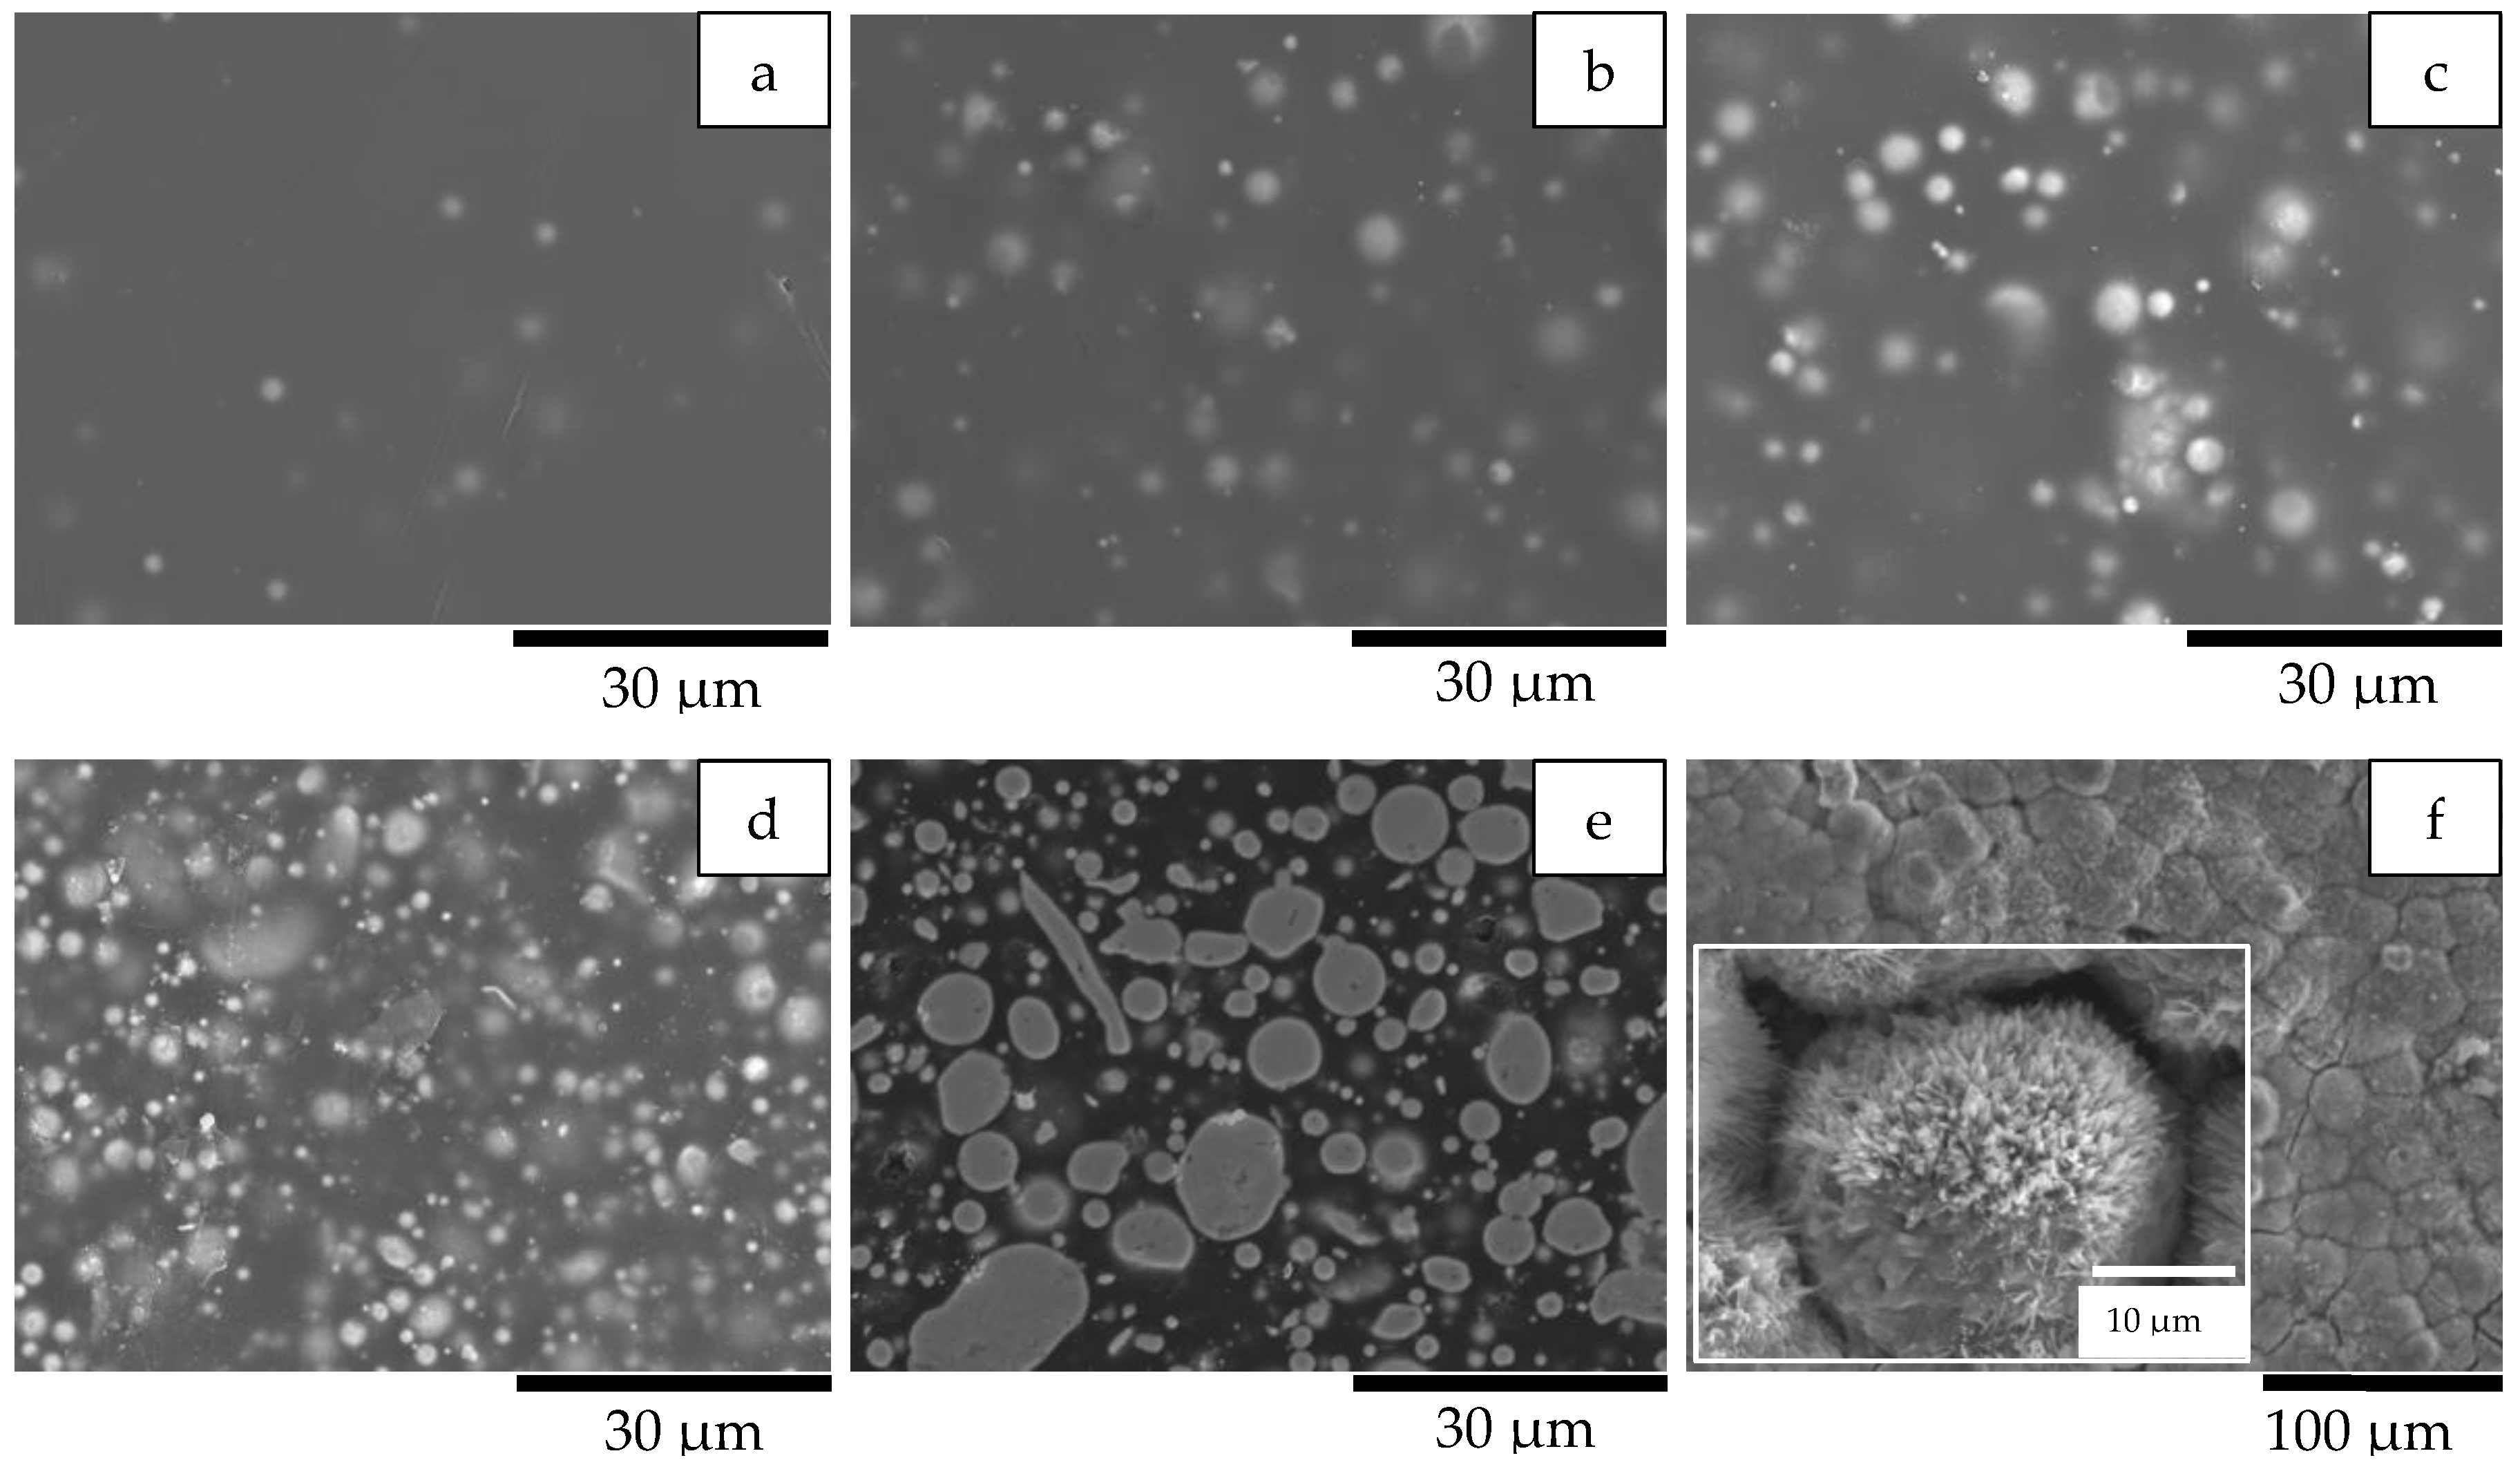
The SEM images of the original zinc particles (i.e., the raw material used for coating production) and the cross-sections of the coatings are presented in Figure 1. The number of zinc particles increased with increasing zinc dosage in the coating. At the highest zinc content of 80%, which corresponded to approximately 35% pigment volume concentration (PVC) [43], many isolated individual zinc particles still existed, and most of the particles were not interconnected (Figure 1f), as confirmed by the micro-CT images in Figure 2a,b. The microCT result in 3D can be found in Supplementary Materials Video S1. Based on visual inspection, a relatively uniform dispersion of the zinc particles was achieved. Notably, the number of defects, i.e., voids and pores, increased with increasing zinc content. The coating surface images of the same coating samples are shown in Figure 3a–d. The number of particles protruding out of the polymer binder also increased with increasing zinc content.
After an immersion test of 48 days, the outer shells of the zinc particles were converted into corrosion products with a porous structure, as shown in the image (Figure 3e) of the cross-section. The polymer binder degraded after exposure to the solution, and the zinc particles on the coating surface corroded, as shown in Figure 3f.
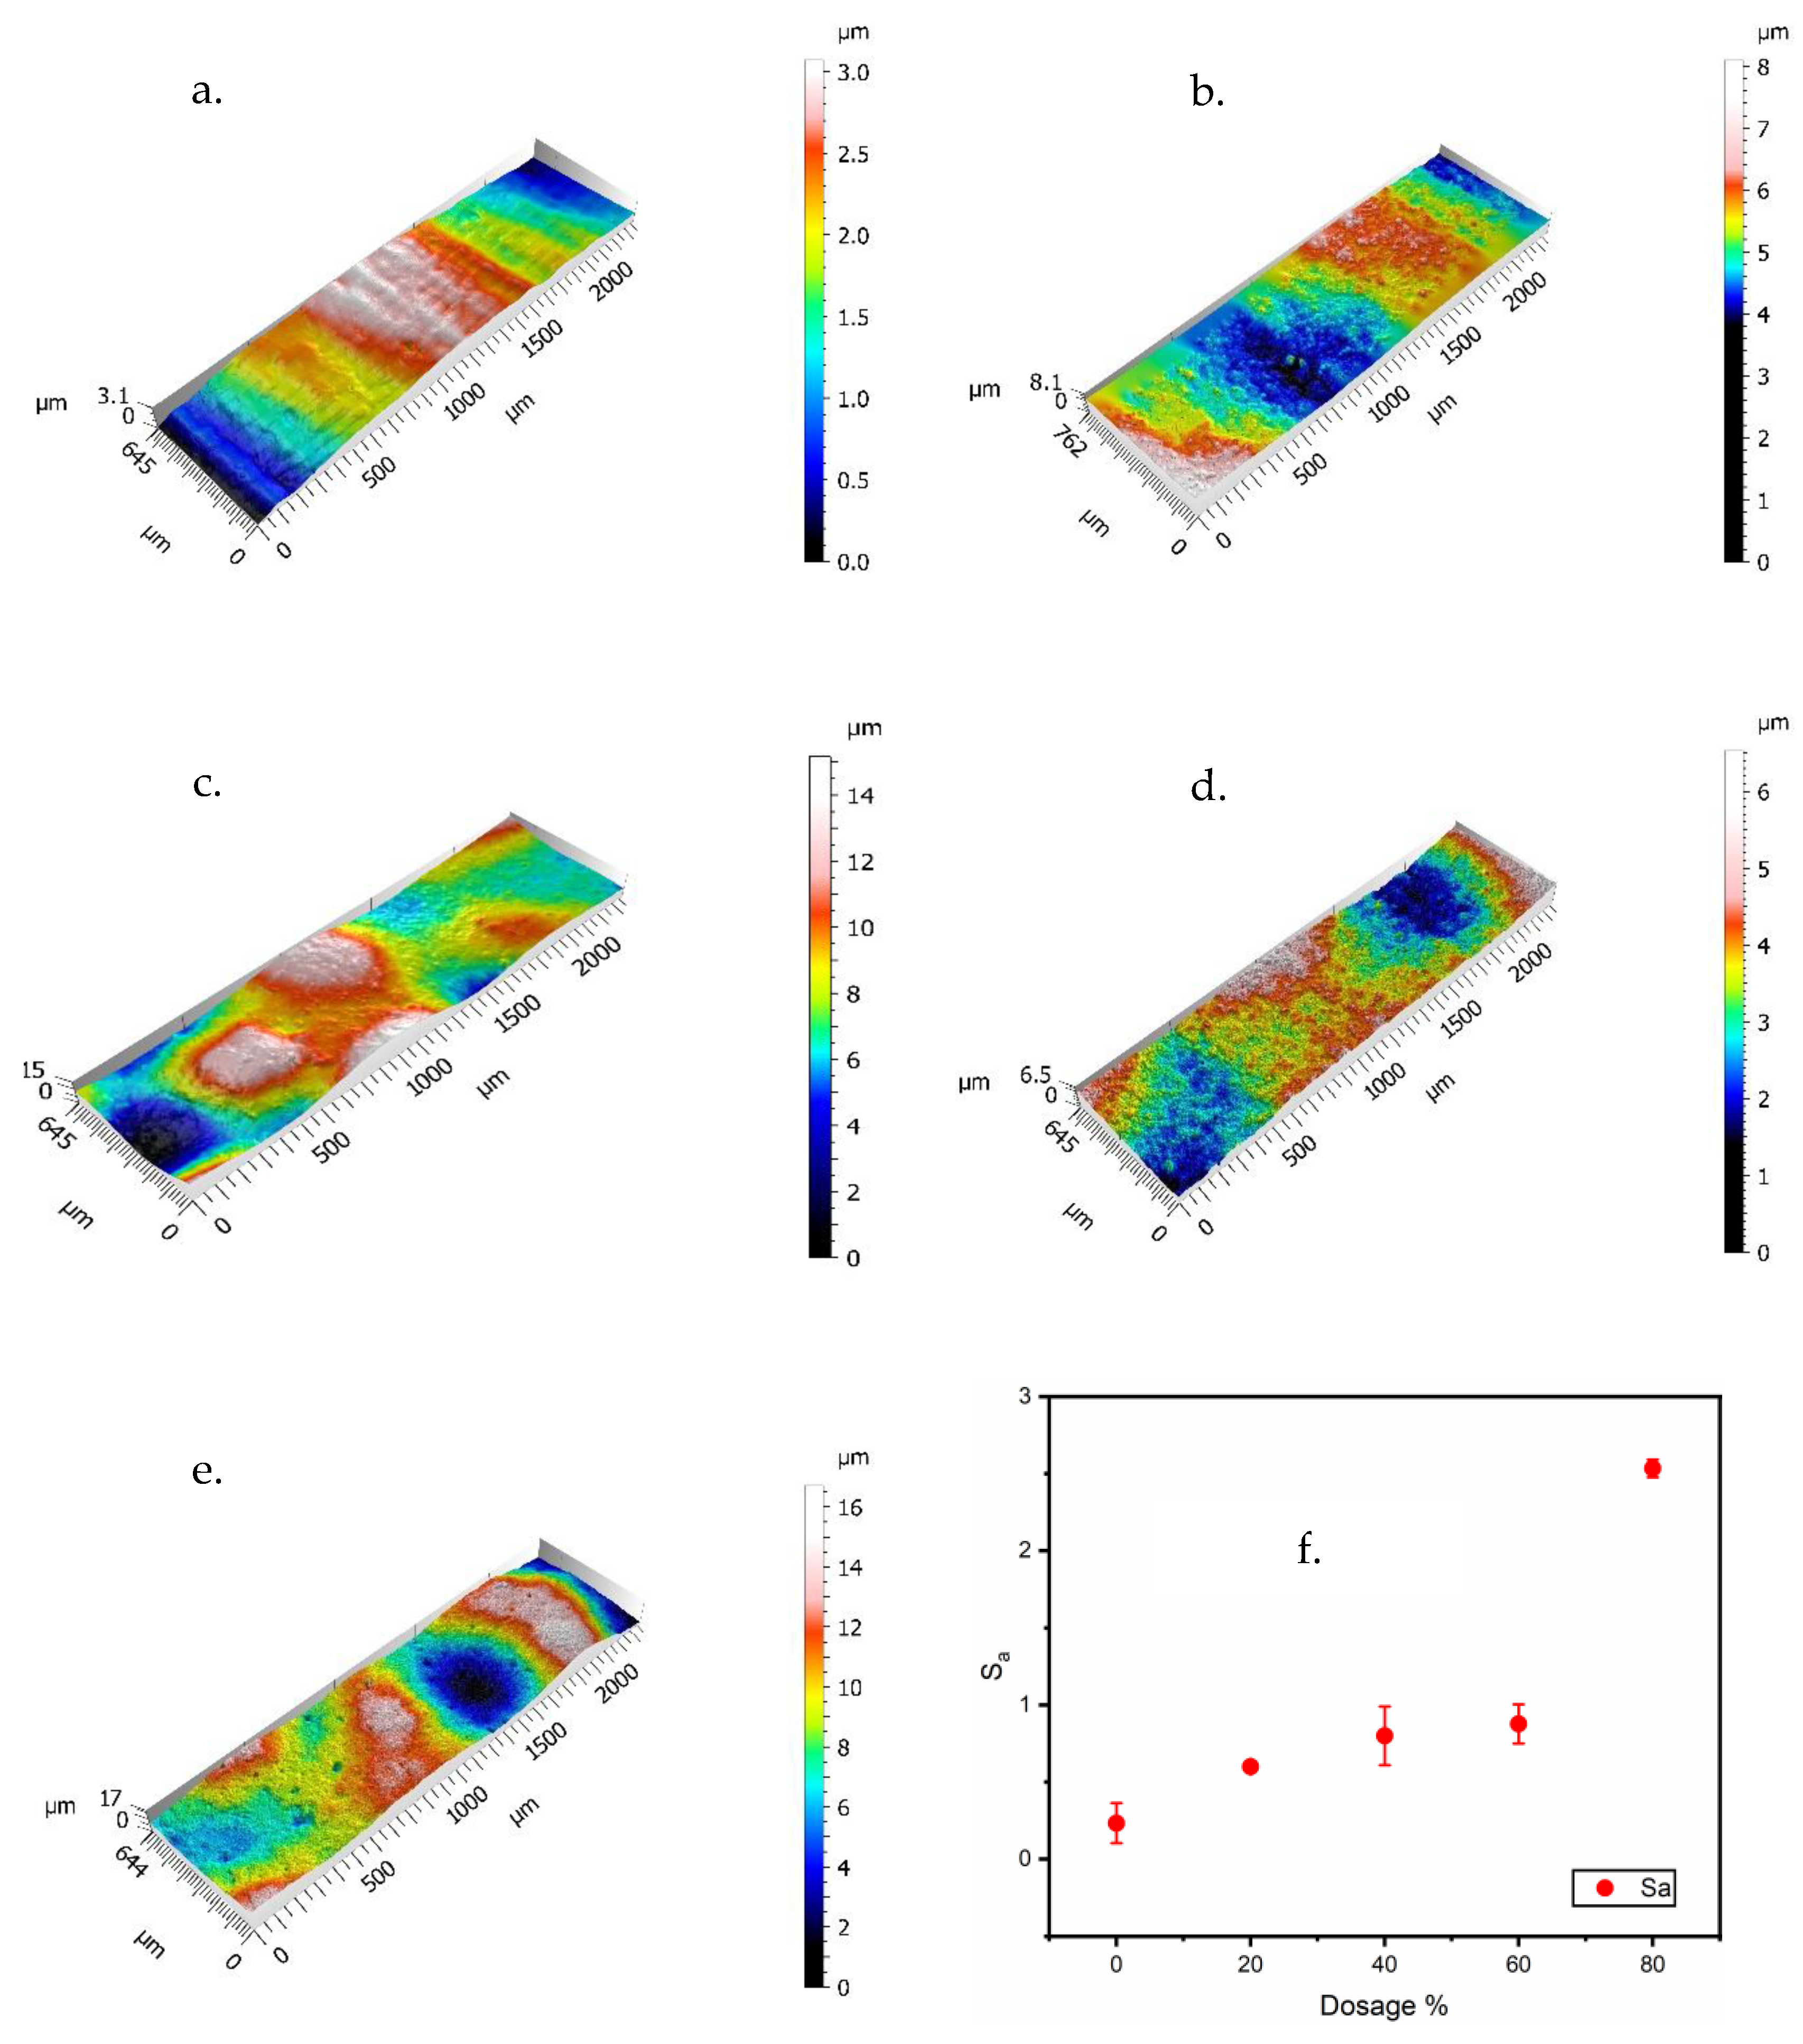
The visual luster of the coating surfaces transitioned from glossy to dull/matte with an increase in zinc content, which is related to changes in surface roughness. Changes in surface roughness were quantified using confocal laser scanning microscopy. The obtained surface height maps of the coatings and the calculated surface roughness Sa (arithmetical mean height of the surface) for the analyzed area are shown in Figure 4a–f.
As the handheld film thickness gauge probe had a sizeable near-flat tip area (diameter ≈ 12 mm), the measured thickness was the distance from the substrate to the multiple asperity peaks on the coating surface. For the same measured film thickness, coating films with a higher zinc content had a higher surface roughness and therefore a lower true film thickness, i.e., less coating material was deposited onto the substrate. The effect of this difference on the protective performance of the coatings was investigated.
The surface quality, as represented by the specular gloss at 60°, DOI (distinctness-of-image), and reflection haze values, is plotted in Figure 5a. The gloss and DOI values decreased with increasing zinc dosage, showing the same trend as the surface roughness value Sa.
The mechanical properties as represented by the impact resistance of the coatings are shown in Figure 5b. The impact resistance decreased as the coating films became more brittle at higher particle load. The impact resistance at the highest zinc content of 80% was still higher than that of the clearcoat and can meet the requirements for anti-corrosive coatings in industrial applications. The sample panels all achieved a strong crosshatch adhesion of 4B (<5% area removed by the procedure; the highest rating, 5B, denotes that none of the test area was removed). The pencil hardness values of the coatings with zinc increased to 2B compared with the value of B for the clearcoat.

3.2. Evolution of OCP and Rp

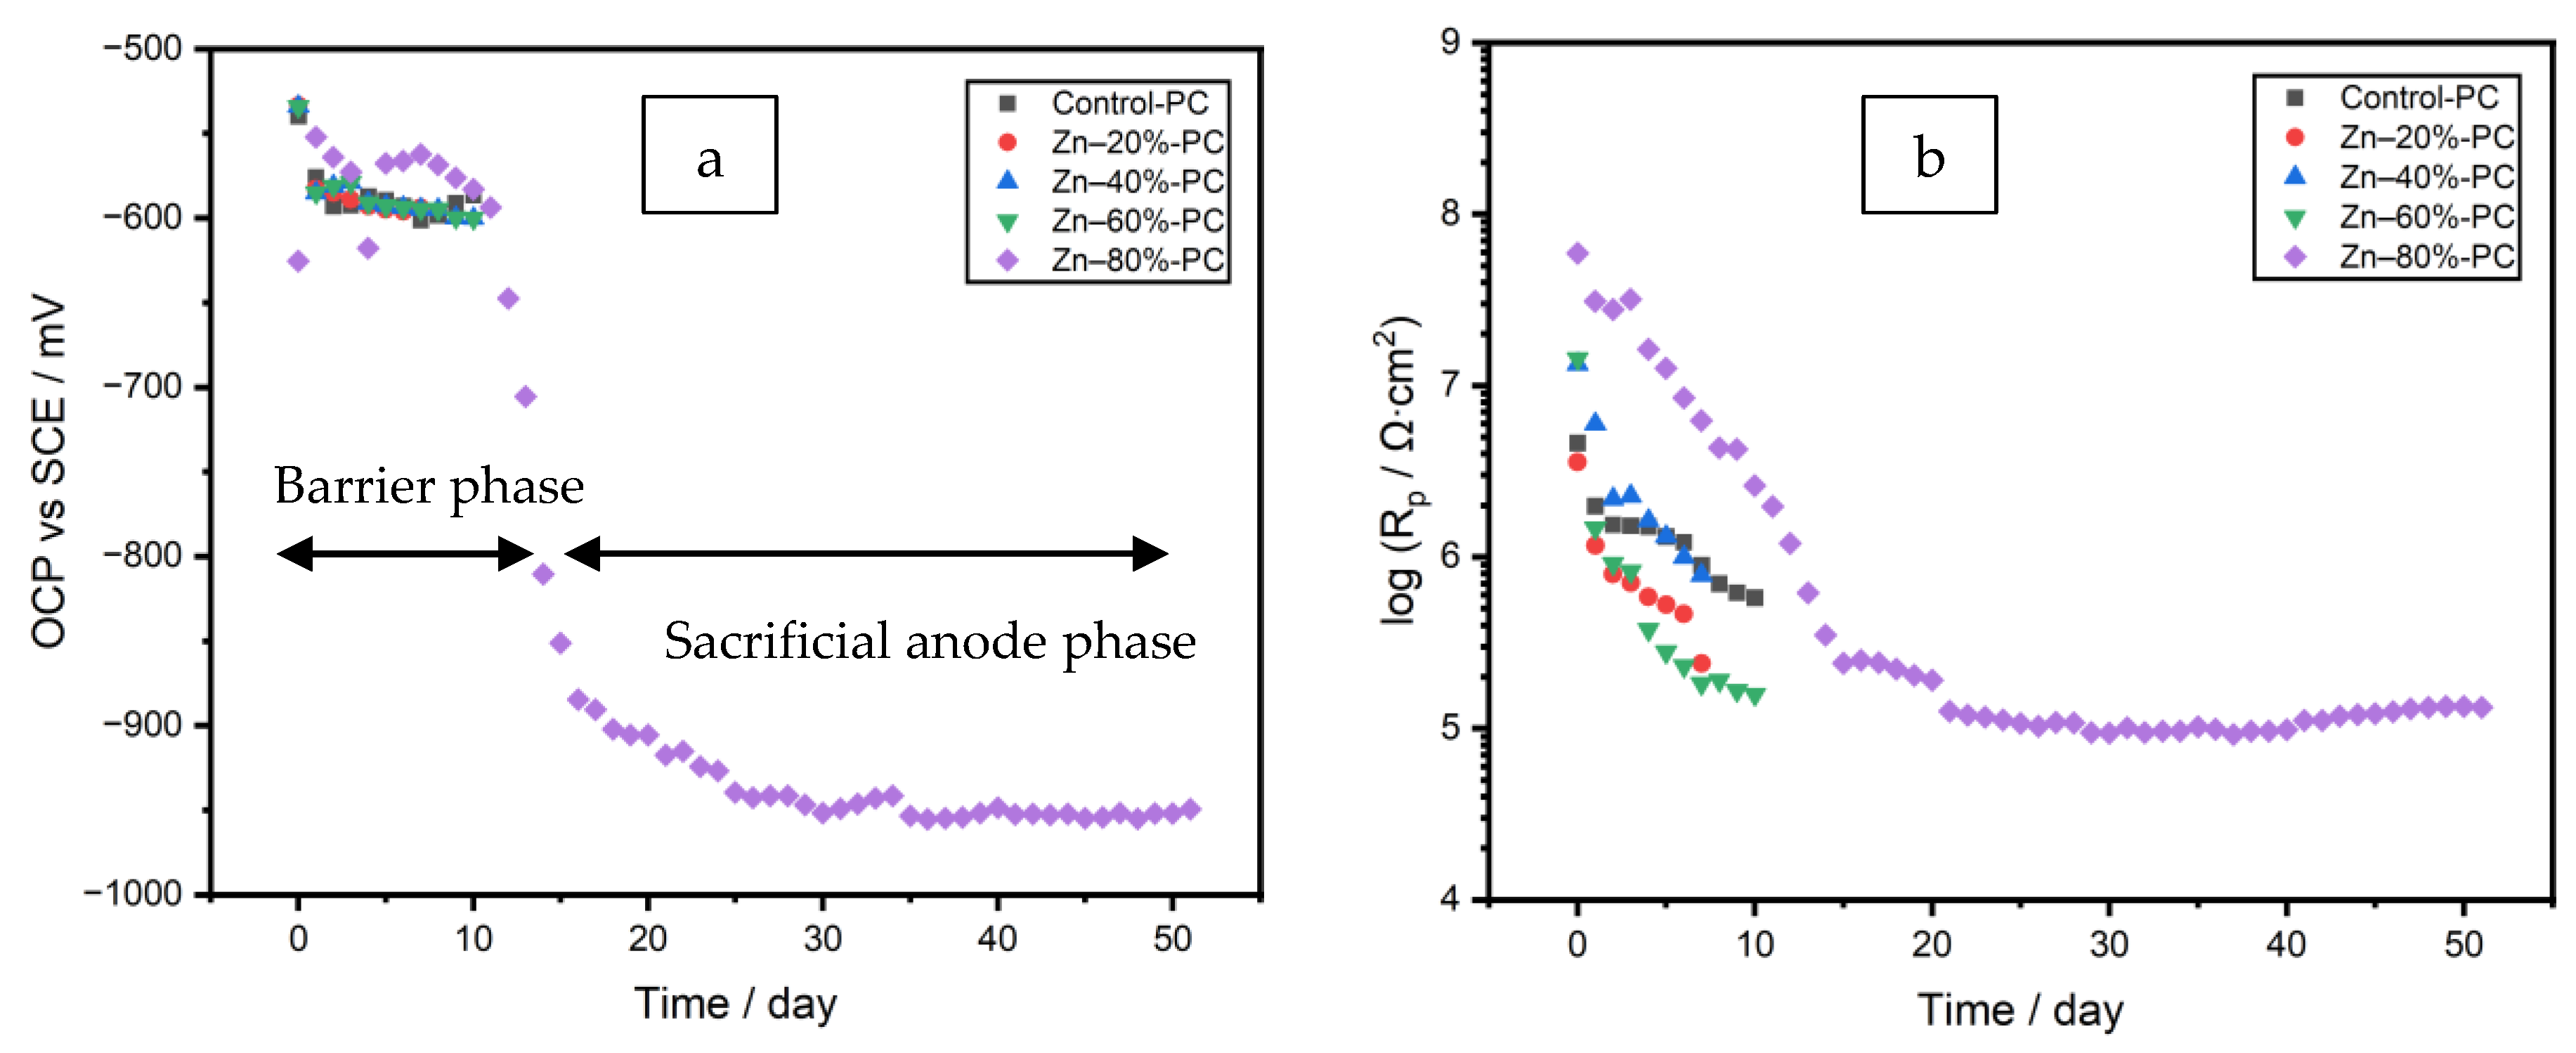
The OCP (open circuit potential) and Rp (polarization resistance) values of all the coating formulations, measured in one-day intervals, are plotted in Figure 6a,b. For the clearcoat (Control-PC) and the coatings with the 20, 40, and 60% zinc, corrosion was observed to occur within the first 8 days of immersion. The test was terminated and the coating was deemed a failure, when a rust grade 7-G (0.3% rusted) in the general rusting category as per ASTM D610–08 was reached. This corrosion failure over short periods of time demonstrated an insufficient connection between the zinc particles and the steel to provide cathodic protection, as indicated by the high OCP values (over −600 mV), and the inadequate barrier effect of the coating films was indicated by the low Rp values caused by the defects (voids and pores) in the coating films. The coating film with 80% zinc exibited only a barrier effect (labeled as “Barrier phase” in Figure 6a) from Days 0–12, imparted by the embedded zinc powder in combination with the surrounding polymer matrix. The zinc particles were able to further inhibit the electrolyte ingress by increasing the tortuosity of the water ingress pathways within the coating film at a lower effective film thickness, as indicated by the significantly higher Rp values at this high zinc dosage and a higher OCP value than that of the uncoated substrate, which had an OCP of approximately −617 mV in the first 30 min of immersion. The coating suppressed the kinetics of the oxidation of the exposed steel substrate, requiring a rise in the OCP of the system to decrease the rate of the coupled reduction reaction until the two achieved the requisite charge balance, thereby decreasing the corrosion rate.
After Day 13, the OCP below −800 mV indicated the initiation of the galvanic effect, as labeled as the “Sacrificial anode phase” in Figure 6a for the coating prepared from the formula Zn–80%-PC. In the sacrificial anode phase, the zinc particles interconnected by the electrolyte in the coating film were activated to function as sacrificial anodes; the slight increase of Rp over the remainder of this immersion test was the result of the partial blockage of pores by the corrosion products of zinc. The coating still exhibited a barrier effect, as indicated by OCP values higher than those of the pure zinc (−1101 mV). The coating quality on Day 48 was evaluated as rust grade 9-G (0.03% rusted), which was superior to the samples prepared from all other formulae, as a result of the high zinc dosage of 80%.
This two-phase pattern of OCP evolution was different from what has been reported in the studies of zinc-rich powder coatings [15,18,21] and in liquid coatings [44], but in line with other liquid zinc-containing coatings which exhibited an activation stage [45].

3.3. Identification of Corrosion Products in the Coatings

The XRD and Raman spectroscopies were performed on the panel prepared from the formula Zn–80%-PC after the immersion test. The peaks identified as zinc, its oxide ZnO, and corrosion product simonkolleite [Zn5 (OH)8 Cl2·H2O, also written as ZnCl2·4 Zn(OH)2·H2O] in the XRD pattern, are individually labeled in Figure 7a.
The corrosion product simonkolleite, as shown in Figure 7b, could be formed from zinc hydroxide and zinc oxide (reactions (3) and (4)) through two chemical reactions (5) and (6) [17,46]. These conversions facilitated the interconnection of the partially passivated zinc particles [47].
Zn 2 + + 2 OH Zn ( OH ) 2
Zn ( OH ) 2 ZnO + H 2 O
4   ZnO + Zn 2 + + 5   H 2 O + 2   Cl Zn 5 ( OH ) 8 Cl 2 · H 2 O  
5   Zn ( OH ) 2 + H 2 O + 2   Cl Zn 5 ( OH ) 8 Cl 2 · H 2 O + 2   OH
As a complementary technique to XRD, the laser beam of Raman spectroscopy was capable of focusing on a spot approximately 1 µm in diameter. The measurements were performed on multiple locations on the coating surface and cross-section after the immersion test. Simonkolleite was identified both on the coating surface and outer shell of zinc particles in the cross-section near the coating surface. As shown in the coating cross-section in Figure 7c, smithsonite (ZnCO3) was formed in the outer shell of the zinc particle due to the reaction of zinc with dissolved CO2 from the air.
At the corrosion spot on the coating surface, the corrosion product of the steel substrate was identified to be lepidocrocite (γ-FeO(OH)), as labeled in Figure 7d. Lepidocrocite was formed by the oxidation of Fe(OH)2 [48].
In the barrier phase, the isolated Zn particles could not participate in galvanic coupling, but instead corroded in contact with the electrolyte and oxygen. This conversion not only consumed oxygen and chloride and prevented them from reaching the underlying steel substrate until the Zn was fully consumed but also raised the pH of the moisture inside the coating through the consumption of H+; the increased pH was able to passivate the steel and slow its corrosion [49,50]. Zn particles exhibited the multi-functional properties of both scavenger and sacrificial anode in the two phases.

3.4. EIS Equivalent Electrical Circuit Analysis

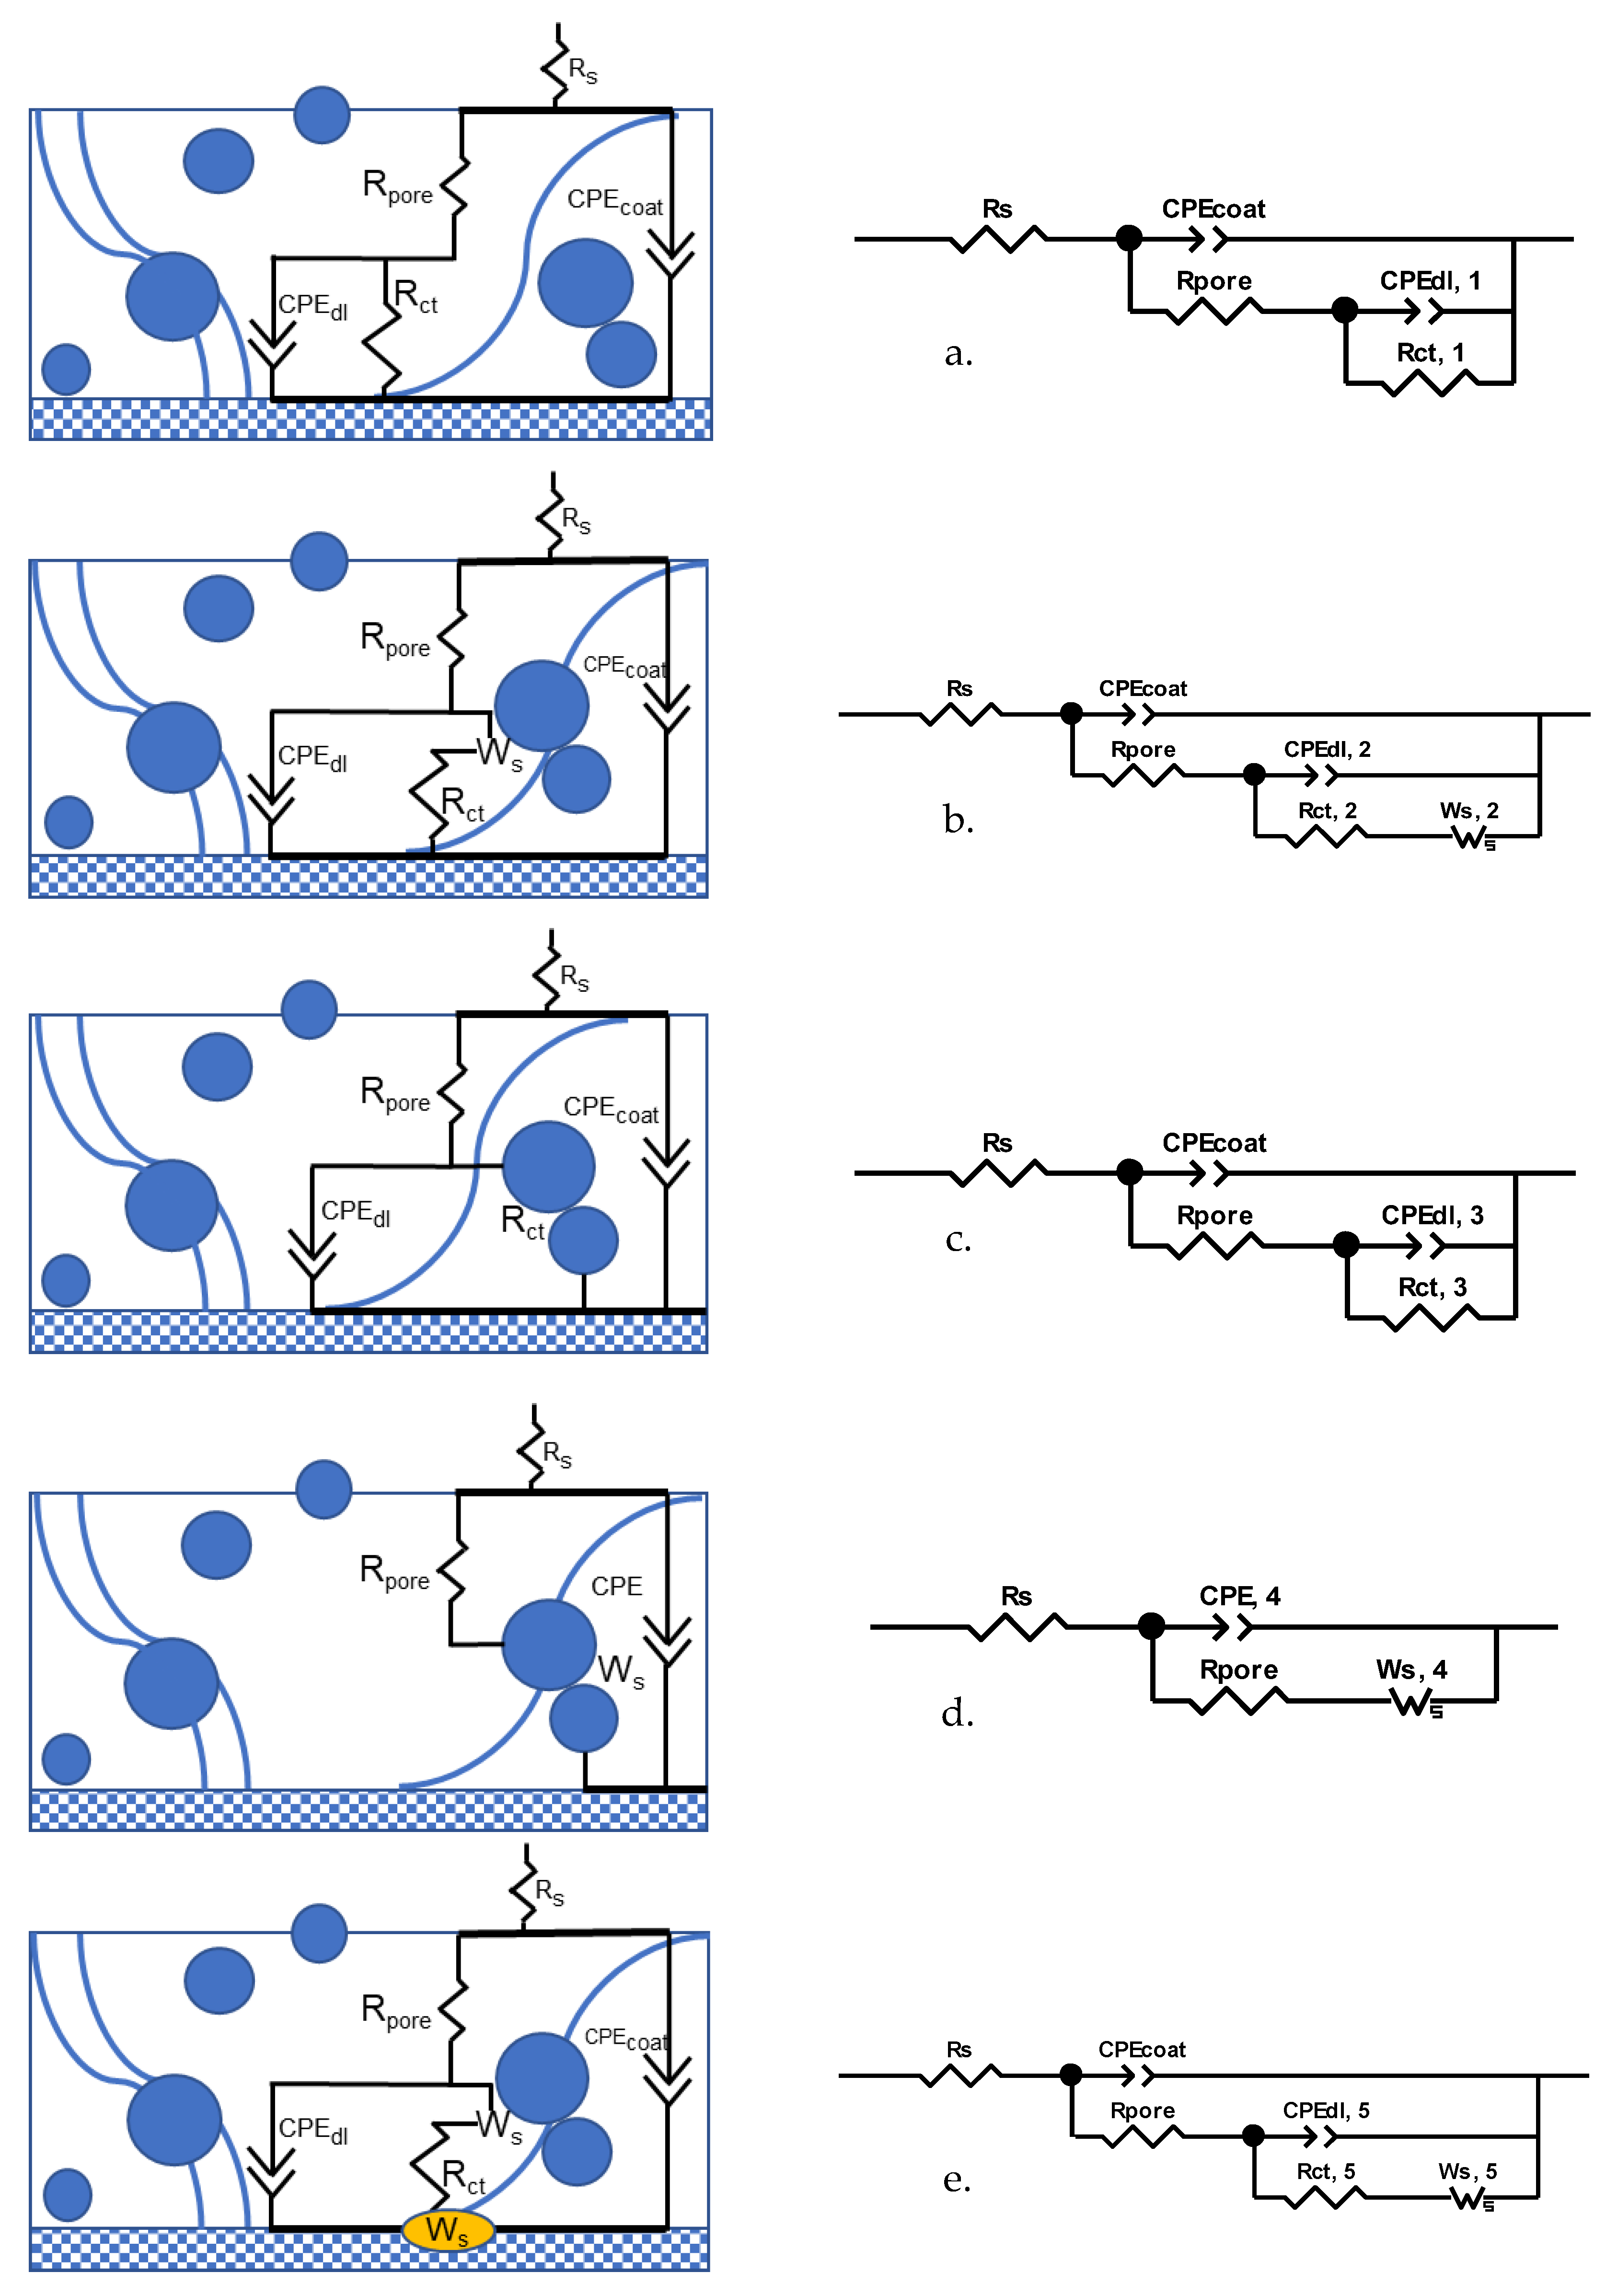
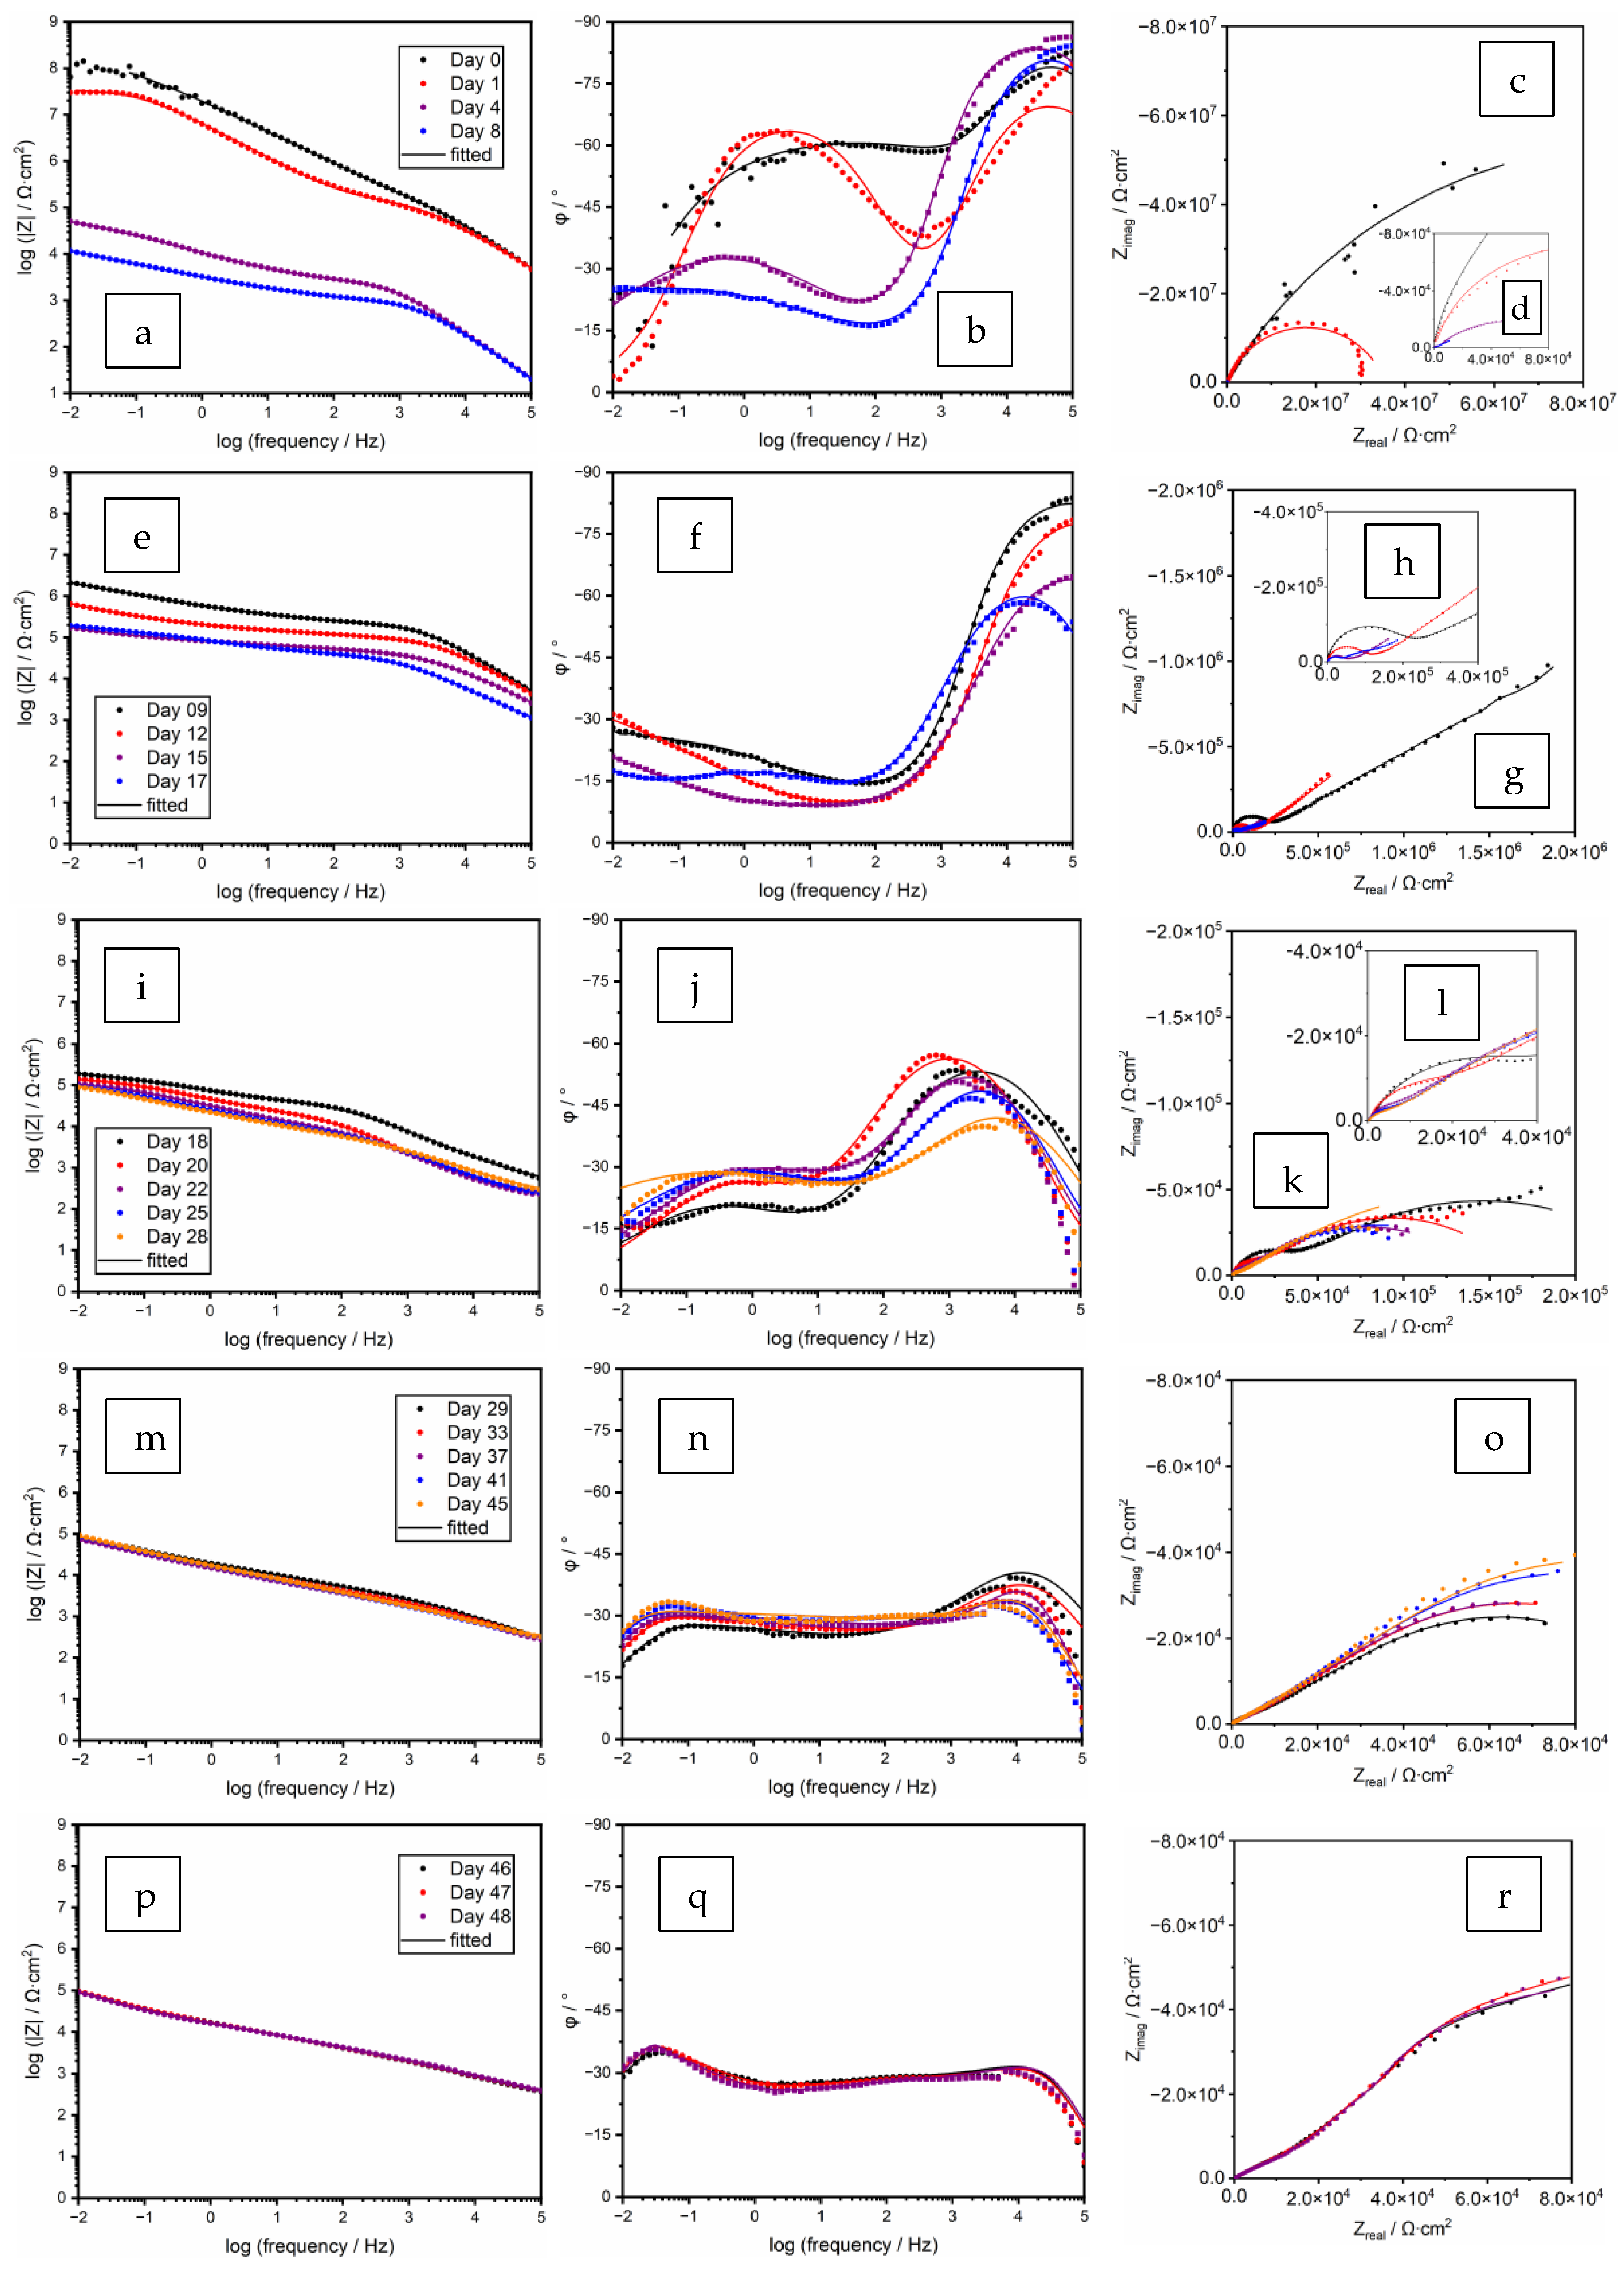
As the coating prepared using the formula with 80% zinc exhibited superior barrier and sacrificial anode effects, the EIS (electrochemical impedance spectroscopy) analyses are only presented for a sample panel prepared using this formula with a mean film thickness of 64.4 µm. The EIS measurements were conducted at one-day intervals for 48 days, and five stages of spectral evolution were determined over this period through visual inspection and data fitting procedures. One equivalent electrical circuit (EEC) was utilized for each stage, as shown in Figure 8. In order to relate the components of the EEC to physical processes, the schematized coating structures are included in the same figure. The Rs and Rpore are the solution (electrolyte) resistance and the coating pore resistance, respectively. The Rct is the interfacial resistance at the electrolyte-substrate interface [22]. Constant phase elements (CPEs) for the coating film and the double layer were employed instead of pure capacitors to obtain good fits of the EECs, as a result of the intrinsic inhomogeneity of the coating film and interfaces [51,52]. Proper fittings were obtained, as indicated by the χ2 values and the overlapping between the measured and modeled spectra. The evolution of EIS spectra is interpreted as follows.

3.4.1. Stage 1. Initiation of Electrolyte Ingress, Days 0–8

The spectra of this first stage are combined in Figure 9a–d. As indicated by the OCP evolution over time, the coating film showed a pure barrier effect within this stage. The most used EEC for modeling a good protective coating with minor defects (Figure 8a) was used for the data fitting, As the zinc particles were physically separated by the polymer binder, the charge transfer resistance at the electrolyte–substrate interface was the main contributing factor to the component Rct, 1. Its value decreased over time as a result of the electrolyte ingress. The slight increase of Rpore on Day 4 corresponded to the blockage of the pores by the corrosion products of zinc.

3.4.2. Stage 2. Corrosion of Zinc Particles and Initiation of Galvanic Protection, Days 9–17

Figure 9e–h shows the spectra of Stage 2, and the EEC as shown in Figure 8b was used to perform the data fitting. The existence of the straight line in the Nyquist plot indicated the diffusion of oxygen or zinc corrosion products generated in reactions (3) and (4), and this phenomenon was represented by the Warburg element with short circuit terminus Ws, 2. The interfacial resistance Rct, 2, decreased due to the enhanced ionic connectivity between the zinc particles via the electrolyte [53,54]. In line with the OCP decreasing to a value below −800 mV, the EIS fitting also indicated the initiation of galvanic protection.

3.4.3. Stage 3. Passivation of Zinc Particles, Days 18–28

As shown in the Bode phase angle plots of Figure 9j, the curve pattern had an abrupt change from Days 17–18. With the progression of electrolyte uptake indicated by the continuous decrease of the Rpore value, a significantly larger number of zinc particles were interconnected by the ionic channels, as shown by the continuously decreasing OCP value. However, due to the passivation of zinc by the formation of zinc hydroxide and oxide (reactions (3) and (4)) and the consumption of the oxygen diffused convectively into the pores by the electrolyte, the diffusion of zinc cation was inhibited, leading to a stable Rct, 3 value and the absence of Warburg diffusional behavior.

3.4.4. Stage 4. Re-Activation of Zinc and Diffusion of Zinc Cation, Days 29–45

During this period, more zinc particles were re-activated, as the diffusion of chloride ions impaired the passivation layer of the zinc particles (reactions (5) and (6)) [47,55], facilitating the ionic connection of zinc particles by the electrolyte. The outward migration of the zinc cation was again captured by the EIS measurement and data fitting, as shown in Figure 9m–o. In the Nyquist diagram shown as Figure 9o, the spectra showed close to 45° straight lines in the low-frequency region. An additional component, Warburg element Ws, 4, was added to represent this diffusional behavior. The system can be represented by a Randles circuit [51], as shown in Figure 8d, in which the CPE, 4 was the combined contribution of the CPEcoat and the previous CPEdl, 3, which were not distinguishable by the fitting process. The Rpore values continued to decrease following the trend of the previous three stages. Possibly due to the strong re-activation and corrosion of zinc particles, the charge transfer resistance Rct was not distinguishable from the Warburg element by the fitting process.

3.4.5. Stage 5. Localized Corrosion of the Substrate, Days 46–48

Between Days 46 and 48, the spectra almost overlapped, as shown in Figure 9p–r, indicating a stable status of the coating film. At this stage, delamination took place between the coating and the substrate, as indicated by the decreased Rct value, and localized corrosion spots were observed at the end of the test. The most used EEC model for a highly defective coating film, as shown in Figure 8e, was used for the fitting. The Warburg element Ws, 5 represented the combined effect of both zinc and steel corrosion. During this period, the system was still under strong galvanic protection, as indicated by the low OCP values.
The fitted values for all the stages are listed in Table 4, Table 5, Table 6, Table 7 and Table 8. This complex transition of the zinc-rich coating is different from what was reported in the literature [17,56]. The differences were mainly with the first barrier stage and the following passivation and then re-activation of the zinc particles. EIS data analysis enabled the identification of the effects of the dynamic and competing chemical reactions. The dense powder coating film was beneficial for achieving better protection and longer service life.

3.5. Neutral Salt-Spray Test Results

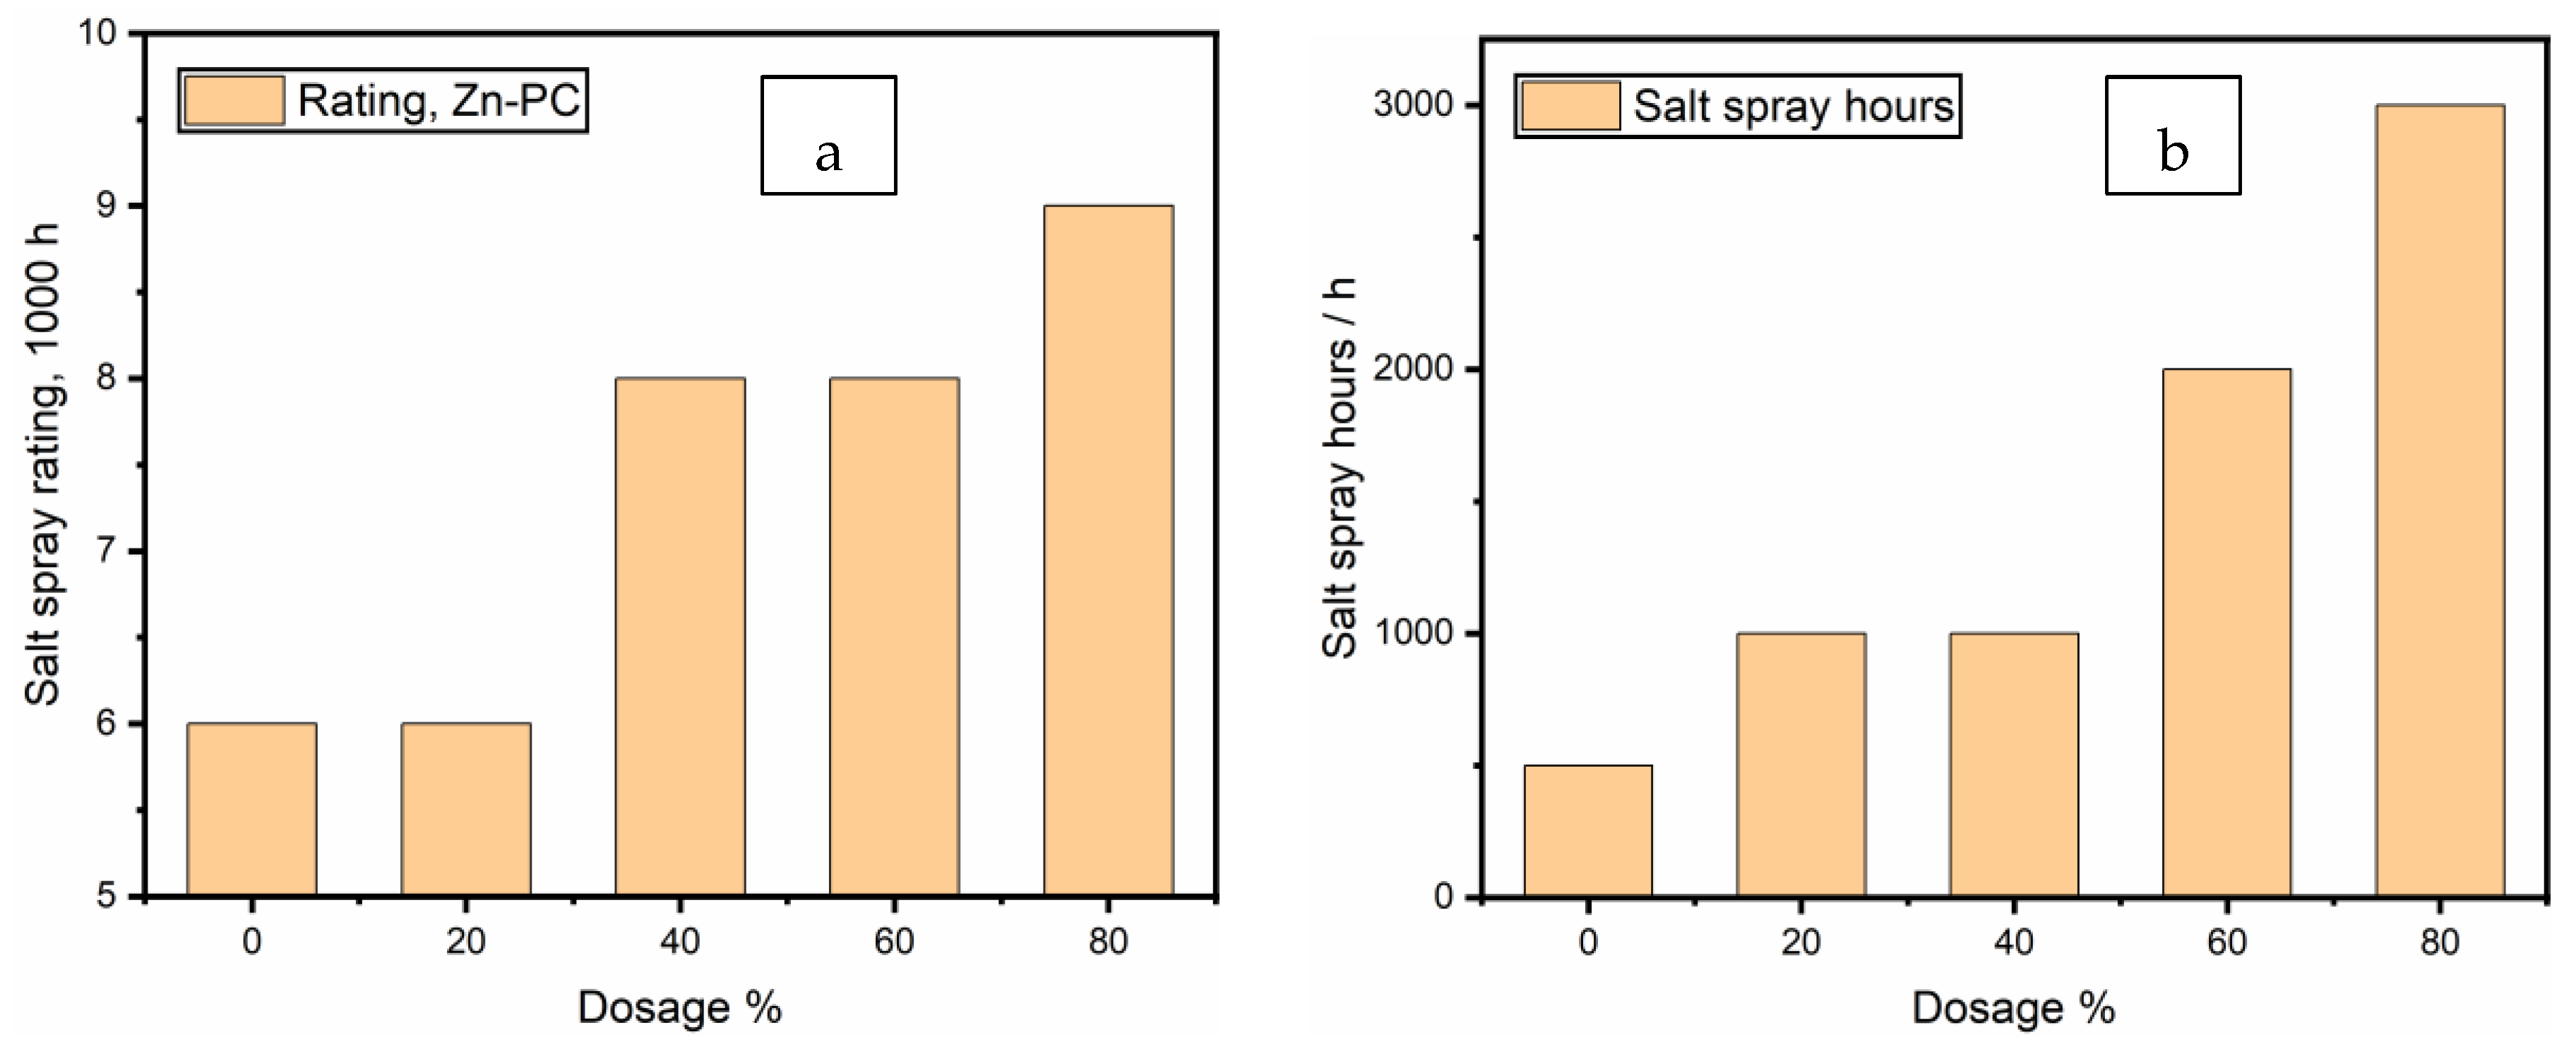
A neutral salt-spray test was conducted for all coating formulations for 1000 h to compare the anti-corrosive properties of the series of formulae. Three panels with scribes of 0.5 mm width were tested in parallel for each formula, and the mean creepage values were calculated as the results. The creepage values were converted into ratings according to ASTM D1654–08, as plotted in Figure 10a. The test continued for the sample panels prepared from all other formulations until the mean creepage reached 2.0 mm, and the elapsed times are plotted in Figure 10b.
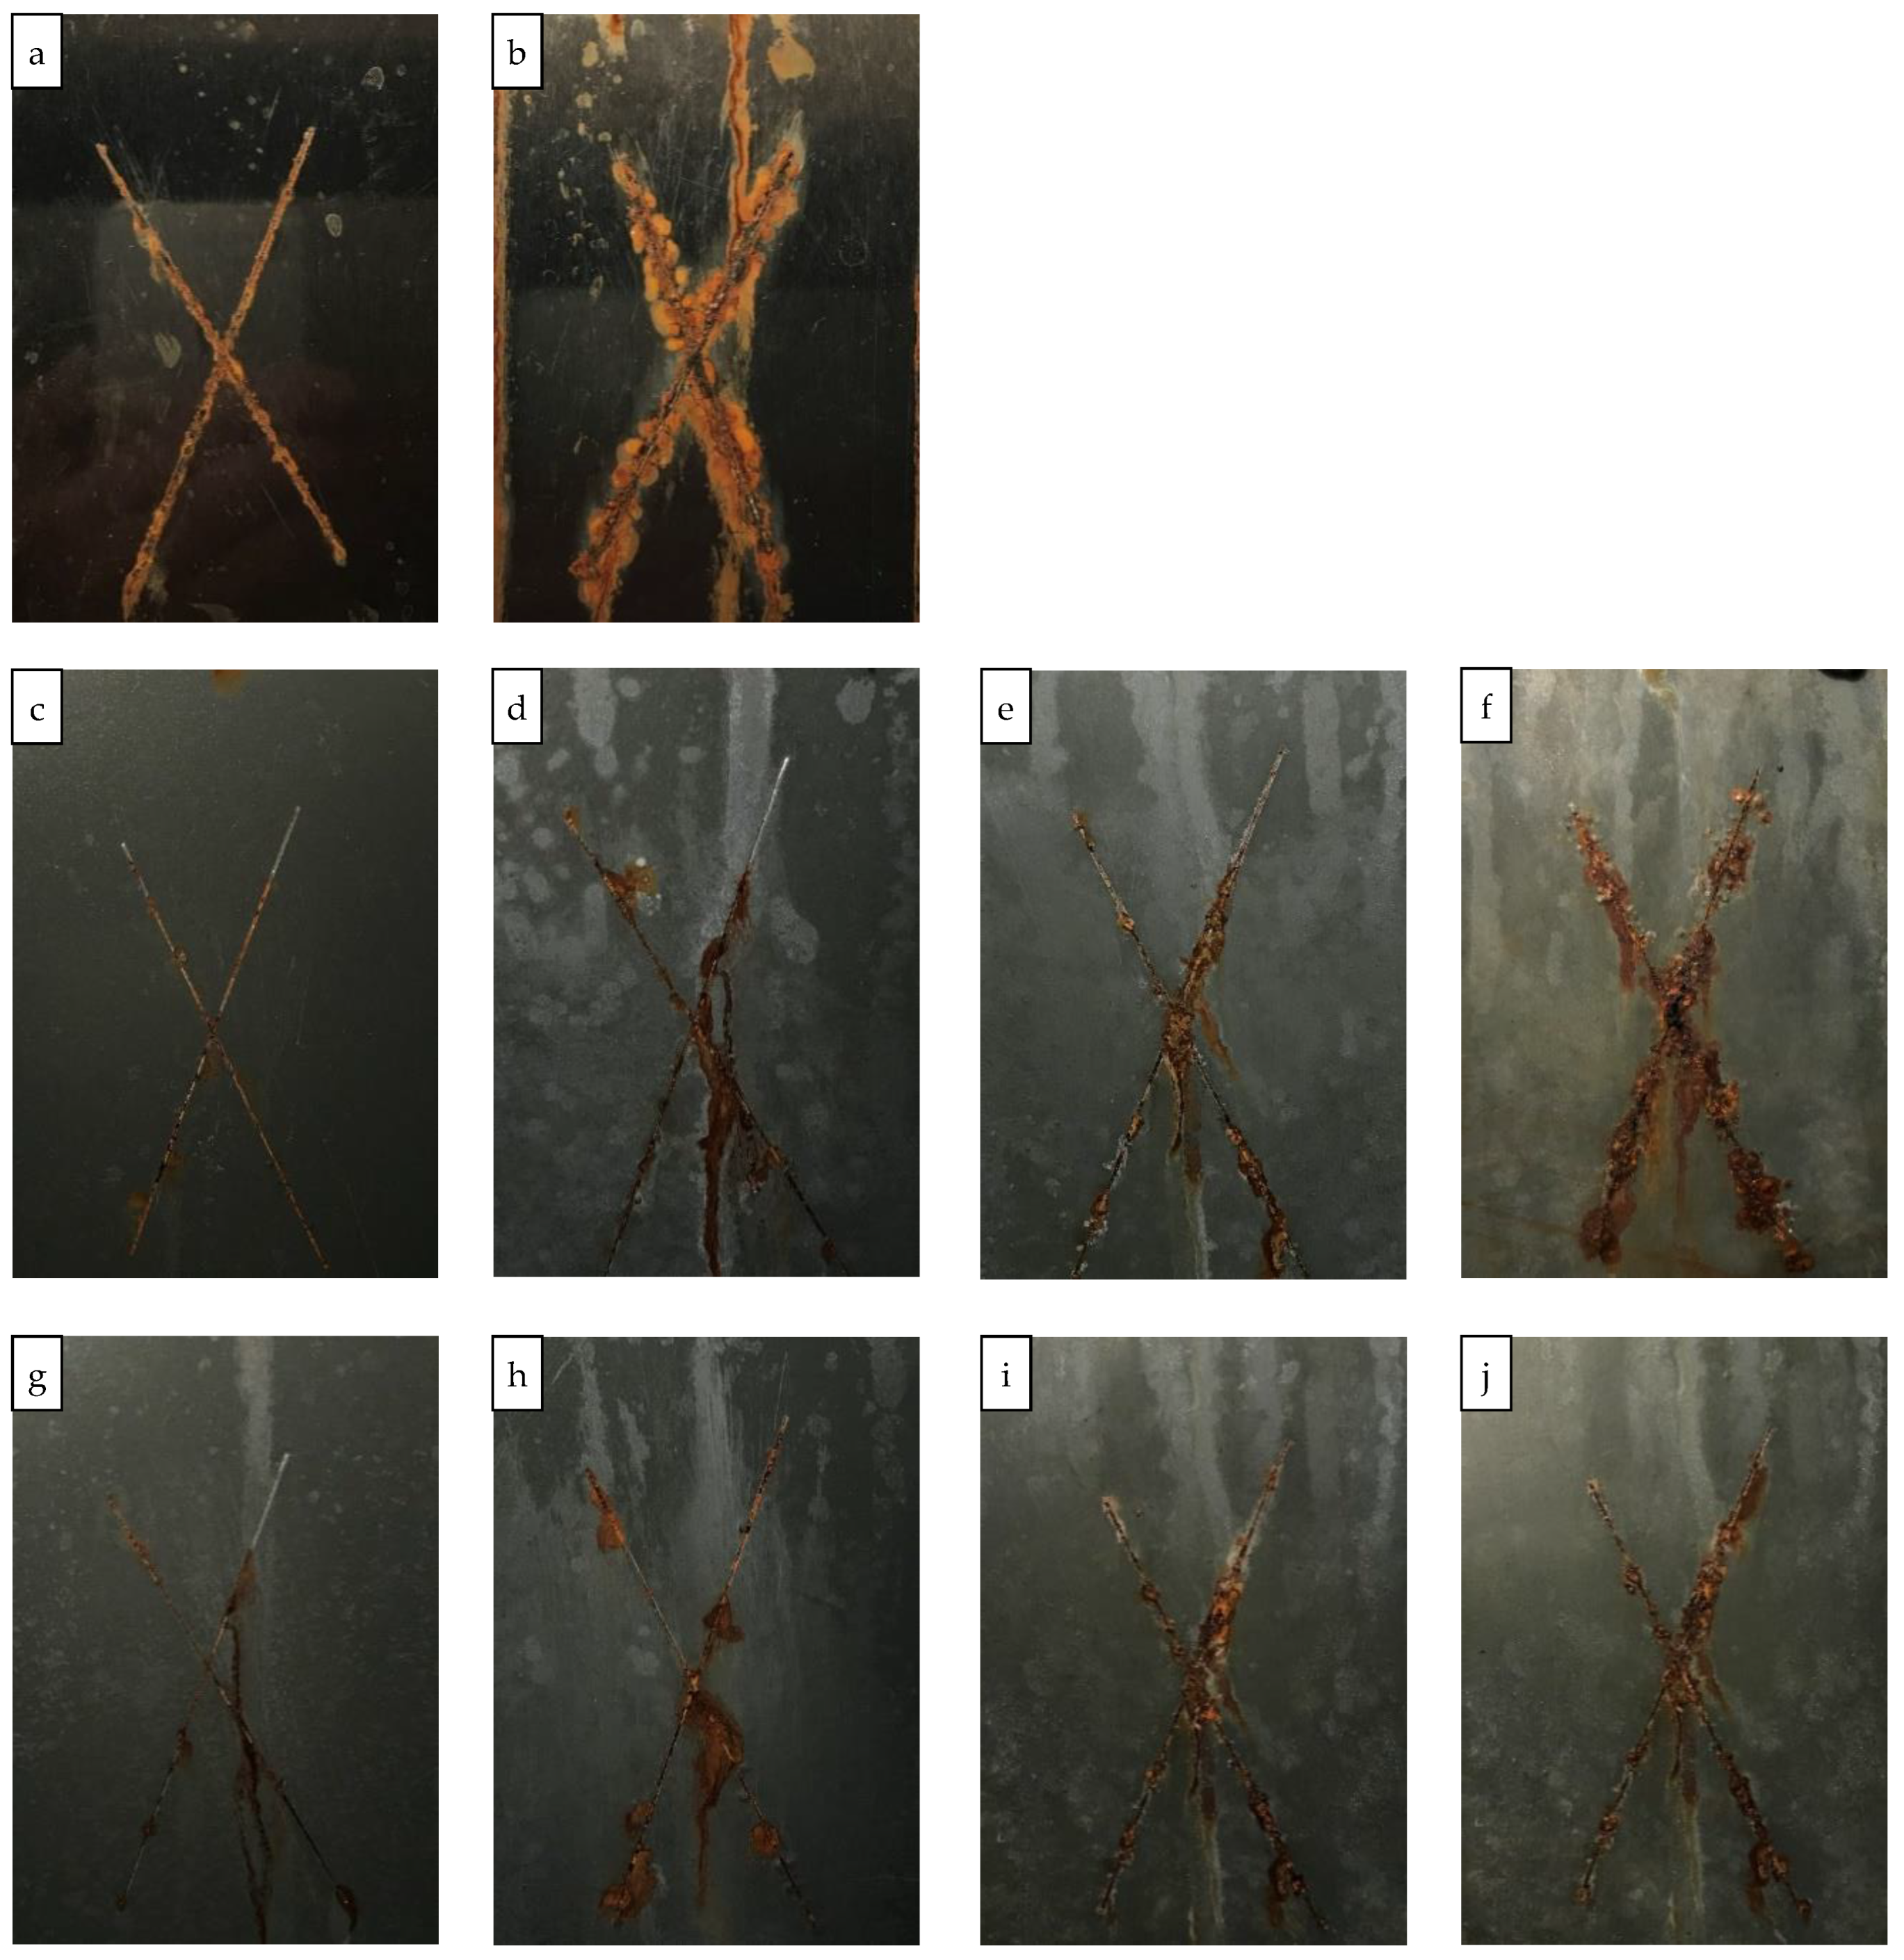
The coatings with 60% and 80% zinc exhibited significantly improved anti-corrosive performance of 2000 and 3000 h in the neutral salt-spray test, and the panel images are shown in Figure 11. The barrier effect of the zinc particles and their corrosion products at lower zinc dosages were also able to inhibit the corrosion propagation across the scribes without the galvanic capability.

4. Conclusions

In this study, zinc-rich powder coatings were prepared as a VOC-free alternative to the high-VOC liquid zinc-rich coatings. A UV-resistant polyester/TGIC binder was utilized to substitute the commonly used epoxy binder for anti-corrosive purposes, and the new single-layer coating has the potential to replace the multi-layer coating system consisting of an epoxy primer and a polyester topcoat.
The polyester/TGIC powder coatings formulated with a series of zinc dosages were evaluated by both neutral salt-spray tests and electrochemical techniques. The zinc-rich coating with 80% zinc content showed significantly enhanced anti-corrosive performance than coatings with lower zinc dosages. The coating exhibited a sacrificial anode effect of zinc, the blocking effect of zinc corrosion products, the increased tortuosity of the coating film, and the scavenging of oxygen, chloride, etc., in addition to the pH increase that developed inside the coating.
The coating with 80% zinc showed two phases of a pure barrier effect and then galvanic protection. A five-stage transition scenario was employed to depict the detailed evolution of the coating using electrochemical impedance spectroscopy (EIS). After a prolonged immersion test, the system was still under strong galvanic protection, with only minor localized corrosion spots.
The zinc-rich powder coatings exhibited good adhesion and mechanical properties. This relatively thin zinc-rich coating is suitable for heavy-duty outdoor use thanks to the excellent UV and salt-spray resistance of the polyester/TGIC system. The single-layer coating (monocoat) system is more environmentally friendly and is in many ways superior to multi-layer liquid coating systems.

Supplementary Materials

The following supporting information can be downloaded at: https://www.mdpi.com/article/10.3390/pr10091853/s1, Video S1: A video of the microCT result in 3D.

Author Contributions

Conceptualization, M.S.Y. and H.Z. (Hui Zhang); data curation, M.S.Y., J.H. and J.C.; formal analysis, M.S.Y., J.H., J.C., J.D.H. and J.J.N.; funding acquisition, H.Z. (Hui Zhang); investigation, M.S.Y., J.H., J.C. and I.B.; methodology, M.S.Y., J.H., J.C., H.Z. (Hui Zhang) and J.J.N.; project administration, H.Z. (Hui Zhang), J.Z., H.Z. (Haiping Zhang) and J.J.N.; resources, J.C., J.J.N., I.B. and H.Z. (Hui Zhang); supervision, H.Z. (Hui Zhang), J.Z. and J.J.N.; validation, M.S.Y., J.H., J.C., H.Z. (Haiping Zhang), J.D.H. and J.J.N.; visualization, M.S.Y. and I.B.; writing—original draft, M.S.Y.; writing—review and editing, J.H., J.C., J.J.N., J.D.H., H.Z. (Hui Zhang), H.Z. (Haiping Zhang) and I.B. All authors have read and agreed to the published version of the manuscript.

Funding

This research was funded in part by The Natural Sciences and Engineering Research Council of Canada (NSERC) Discovery Grant, grant number RGPIN-2018-06256. The authors appreciate the partial funding for this work from NSERC Discovery Grant RGPIN-2018-06672.

Data Availability Statement

Not applicable.

Acknowledgments

The authors appreciate the training and technical support by Mark Biesinger, Thalia Elizabeth Standish, Vahid Dehnavi, Heng-Yong Nie, Sridhar Ramamurthy, Charlie MacDonald, Baian Almusned, Heather Bloomfield, Bradley Kobe, Rebecca Sarazen, Mary Jane Walzak, Vesna Jarvis and Susan Brown at Surface Science Western (www.surfacesciencewestern.com) and David Shoesmith, Dmitrij Zagidulin, Fraser Filice, Xuejie Li, Ziyan Zhu, Claire Tully, Sina Matin and Anna Dobkowska at the Department of Chemistry, Western University (The University of Western Ontario). The first author would like to express gratitude to The Association for Materials Protection and Performance (AMPP), a combination of the former SSPC (Society for Protective Coatings) and the former NACE (National Association of Corrosion Engineers), for granting a free student membership to obtain access to pertinent standards.

Conflicts of Interest

The authors declare no conflict of interest.

References

  1. ReferencesSørensen, P.A.; Kiil, S.; Dam-Johansen, K.; Weinell, C.E. Anticorrosive Coatings: A Review. J. Coat. Technol. Res. 2009, 6, 135–176. [Google Scholar] [CrossRef]
  2. Gao, Y.; Wang, C.; Lin, Q.; Liu, H.; Yao, M. Broad-Beam Laser Cladding of Al-Si Alloy Coating on AZ91HP Magnesium Alloy. Surf. Coat. Technol. 2006, 201, 2701–2706. [Google Scholar] [CrossRef]
  3. Funke, W. Organic Coatings in Corrosion Protection. In Surface Coatings—2; Springer: Berlin/Heidelberg, Germany, 1988; pp. 107–135. [Google Scholar] [CrossRef]
  4. Li, W.; Franco, D.C.; Yang, M.S.; Zhu, X.; Zhang, H.; Shao, Y.; Zhang, H.; Zhu, J. Comparative Study of the Performances of Al(OH)3 and BaSO4 in Ultrafine Powder Coatings. Processes 2019, 7, 316. [Google Scholar] [CrossRef]
  5. Zhu, J.; Zhang, H. Ultrafine Powder Coatings: An Innovation. Powder Coat. 2005, 16, 39–47. [Google Scholar]
  6. Turner, S.; Baskir, J.; Nunez, C. Powder Coatings: A Technology Review. In Pollution Prevention Review; Spring: Berlin/Heidelberg, Germany, 1999; pp. 7–21. [Google Scholar]
  7. Li, W.; Franco, D.C.; Yang, M.S.; Zhu, X.; Zhang, H.; Shao, Y.; Zhang, H.; Zhu, J. Investigation of the Performance of ATH Powders in Organic Powder Coatings. Coatings 2019, 9, 110. [Google Scholar] [CrossRef]
  8. Crapper, G. Powder Coatings. In Polymer Science: A Comprehensive Reference; Elsevier: Amsterdam, The Netherlands, 2012; Volume 10, pp. 541–566. ISBN 9780080878621. [Google Scholar]
  9. Farshchi, N.; Gedan-Smolka, M. Polyurethane Powder Coatings: A Review of Composition and Characterization. Ind. Eng. Chem. Res. 2020, 59, 15121–15132. [Google Scholar] [CrossRef]
  10. Upadhyay, V.; Harkal, U.D.; Webster, D.C.; Bierwagen, G.P. Preliminary Investigation of the Impact of Polymer Composition on Electrochemical Properties of Coatings as Determined by Electrochemical Impedance Spectroscopy. J. Coat. Technol. Res. 2013, 10, 865–878. [Google Scholar] [CrossRef]
  11. Spyrou, E. Powder Coatings: Chemistry and Technology, 3rd edition; Vincentz Network GmbH & Co KG: Hannover, Germany, 2012; ISBN 978-3-86630-824-4. [Google Scholar]
  12. Farrell, R. Powder Coatings. Met. Finish. 2010, 108, 100–107. [Google Scholar] [CrossRef]
  13. De Lange, P. A History of Powder Coatings. Ind. Paint Powder 2004, 80, 23–27. [Google Scholar]
  14. Streitberger, H.-J.; Goldschmidt, A. Processing of Powder Coatings. In Basics of Coating Technology; Vincentz Network GmbH & Co KG: Hannover, Germany, 2018. [Google Scholar]
  15. Marchebois, H.; Savall, C.; Bernard, J.; Touzain, S. Electrochemical Behavior of Zinc-Rich Powder Coatings in Artificial Sea Water. Electrochim. Acta 2004, 49, 2945–2954. [Google Scholar] [CrossRef]
  16. Touzain, S. Accelerated Aging of Zinc-Rich Powder Coatings Containing Different Conductive Pigments; CSC Publishing: St. Paul, MN, USA, 2009; pp. 1–6. [Google Scholar]
  17. Marchebois, H.; Joiret, S.; Savall, C.; Bernard, J.; Touzain, S. Characterization of Zinc-Rich Powder Coatings by EIS and Raman Spectroscopy. Surf. Coat. Technol. 2002, 157, 151–161. [Google Scholar] [CrossRef]
  18. Meroufel, A.; Touzain, S. EIS Characterisation of New Zinc-Rich Powder Coatings. Prog. Org. Coat. 2007, 59, 197–205. [Google Scholar] [CrossRef]
  19. Schaefer, K.; Miszczyk, A. Improvement of Electrochemical Action of Zinc-Rich Paints by Addition of Nanoparticulate Zinc. Corros. Sci. 2013, 66, 380–391. [Google Scholar] [CrossRef]
  20. Giúdice, C.; Benftez, J.C.; Linares, M.M. Zinc-Rich Epoxy Primers Based on Lamellar Zinc Dust. JOCCA Surf. Coat. Int. 1997, 80, 279–284. [Google Scholar] [CrossRef]
  21. Meroufel, A.; Deslouis, C.; Touzain, S. Electrochemical and Anticorrosion Performances of Zinc-Rich and Polyaniline Powder Coatings. Electrochim. Acta 2008, 53, 2331–2338. [Google Scholar] [CrossRef]
  22. Abreu, C.M.; Izquierdo, M.; Keddam, M.; Nóvoa, X.R.; Takenouti, H. Electrochemical Behaviour of Zinc-Rich Epoxy Paints in 3% NaCl Solution. Electrochim. Acta 1996, 41, 2405–2415. [Google Scholar] [CrossRef]
  23. SSPC. Coating Standard No. 20 Zinc-Rich Coating (Type I-Inorganic, and Type II-Organic); The Society for Protective Coatings: Pittsburgh, PA, USA, 2019. [Google Scholar]
  24. Jagtap, R.N.; Patil, P.P.; Hassan, S.Z. Effect of Zinc Oxide in Combating Corrosion in Zinc-Rich Primer. Prog. Org. Coat. 2008, 63, 389–394. [Google Scholar] [CrossRef]
  25. Pereyra, A.M.; Giudice, C.A. Shaped for Performance. Eur. Coat. J. 2007, 9, 40. [Google Scholar]
  26. Wang, H.; Huang, S.L.; Zuo, Y.J.; Zhou, T.; Zhang, L.R. Corrosion Resistance of Lamellar Aluminium Pigments Coated by SiO2 by Sol-Gel Method. Corros. Sci. 2011, 53, 161–167. [Google Scholar] [CrossRef]
  27. Kalendová, A. Effects of Particle Sizes and Shapes of Zinc Metal on the Properties of Anticorrosive Coatings. Prog. Org. Coat. 2003, 46, 324–332. [Google Scholar] [CrossRef]
  28. ASTM B117-16 Standard Practice for Operating Salt Spray (Fog) Apparatus; ASTM International: West Conshohocken, PA, USA, 2016.
  29. Tsai, C.H.; Mansfeld, F. Determination of Coating Deterioration with EIS: Part II. Development of a Method for Field Testing of Protective Coatings. Corrosion 1993, 49, 726–737. [Google Scholar] [CrossRef]
  30. Oliveira, C.G.; Ferreira, M.G.S. Ranking High-Quality Paint Systems Using EIS. Part II: Defective Coatings. Corros. Sci. 2003, 45, 123–138. [Google Scholar] [CrossRef]
  31. Margarit-Mattos, I.C.P. EIS and Organic Coatings Performance: Revisiting Some Key Points. Electrochim. Acta 2020, 354, 136725. [Google Scholar] [CrossRef]
  32. Marchebois, H.; Touzain, S.; Joiret, S.; Bernard, J.; Savall, C. Zinc-Rich Powder Coatings Corrosion in Sea Water: Influence of Conductive Pigments. Prog. Org. Coat. 2002, 45, 415–421. [Google Scholar] [CrossRef]
  33. Asemani, H.R.; Ahmadi, P.; Sarabi, A.A.; Eivaz Mohammadloo, H. Effect of Zirconium Conversion Coating: Adhesion and Anti-Corrosion Properties of Epoxy Organic Coating Containing Zinc Aluminum Polyphosphate (ZAPP) Pigment on Carbon Mild Steel. Prog. Org. Coat. 2016, 94, 18–27. [Google Scholar] [CrossRef]
  34. Park, J.H.; Yun, T.H.; Kim, K.Y.; Song, Y.K.; Park, J.M. The Improvement of Anticorrosion Properties of Zinc-Rich Organic Coating by Incorporating Surface-Modified Zinc Particle. Prog. Org. Coat. 2012, 74, 25–35. [Google Scholar] [CrossRef]
  35. Huang, S.; Kong, G.; Yang, B.; Zhang, S.; Che, C. Effects of Graphene on the Corrosion Evolution of Zinc Particles in Waterborne Epoxy Zinc-Containing Coatings. Prog. Org. Coat. 2020, 140, 105531. [Google Scholar] [CrossRef]
  36. Scully, J.R. Electrochemical Impedance of Organic-Coated Steel: Correlation of Impedance Parameters with Long-Term Coating Deterioration. J. Electrochem. Soc. 1989, 136, 979–990. [Google Scholar] [CrossRef]
  37. Hack, H.P.; Scully, J.R. Defect Area Determination of Organic Coated Steels in Seawater Using the Breakpoint Frequency Method. J. Electrochem. Soc. 1991, 138, 233–238. [Google Scholar] [CrossRef]
  38. Scully, J.R.; Hensley, S.T. Lifetime Prediction for Organic Coatings on Steel and a Magnesium Alloy Using Electrochemical Impedance Methods. Corrosion 1994, 50, 705–716. [Google Scholar] [CrossRef]
  39. Tröltzsch, U.; Kanoun, O. Generalization of Transmission Line Models for Deriving the Impedance of Diffusion and Porous Media. Electrochim. Acta 2012, 75, 347–356. [Google Scholar] [CrossRef]
  40. Walter, G.W. A Critical Review of d.c. Electrochemical Tests for Painted Metals. Corros. Sci. 1986, 26, 39–47. [Google Scholar] [CrossRef]
  41. Bierwagen, G. Next Generation of Aircraft Coatings Systems. J. Coat. Technol. 2001, 73, 45–52. [Google Scholar] [CrossRef]
  42. Oliveira, C.G.; Ferreira, M.G.S. Ranking High-Quality Paint Systems Using EIS. Part I: Intact Coatings. Corros. Sci. 2003, 45, 123–138. [Google Scholar] [CrossRef]
  43. Gowri, S.; Balakrishnan, K. The Effect of the PVC/CPVC Ratio on the Corrosion Resistance Properties of Organic Coatings. Prog. Org. Coat. 1994, 23, 363–377. [Google Scholar] [CrossRef]
  44. Ding, R.; Zheng, Y.; Yu, H.; Li, W.; Wang, X.; Gui, T. Study of Water Permeation Dynamics and Anti-Corrosion Mechanism of Graphene/Zinc Coatings. J. Alloys Compd. 2018, 748, 481–495. [Google Scholar] [CrossRef]
  45. Hussain, A.K.; Seetharamaiah, N.; Pichumani, M.; Chakra, C.S. Research Progress in Organic Zinc Rich Primer Coatings for Cathodic Protection of Metals—A Comprehensive Review. Prog. Org. Coat 2021, 153, 106040. [Google Scholar] [CrossRef]
  46. Jiang, Q.; Miao, Q.; Liang, W.P.; Ying, F.; Tong, F.; Xu, Y.; Ren, B.L.; Yao, Z.J.; Zhang, P.Z. Corrosion Behavior of Arc Sprayed Al-Zn-Si-RE Coatings on Mild Steel in 3.5 Wt% NaCl Solution. Electrochim. Acta 2014, 115, 644–656. [Google Scholar] [CrossRef]
  47. Rosalbino, F.; Scavino, G.; Macciò, D.; Saccone, A. Influence of the Alloying Component on the Corrosion Behaviour of Zinc in Neutral Aerated Sodium Chloride Solution. Corros. Sci. 2014, 89, 286–294. [Google Scholar] [CrossRef]
  48. Misawa, T.; Hashimoto, K.; Shimodaira, S. The Mechanism of Formation of Iron Oxide and Oxyhydroxides in Aqueous Solutions at Room Temperature. Corros. Sci. 1974, 14, 131–149. [Google Scholar] [CrossRef]
  49. Poursaee, A.; Hansson, C.M. Reinforcing Steel Passivation in Mortar and Pore Solution. Cem. Concr. Res. 2007, 37, 1127–1133. [Google Scholar] [CrossRef]
  50. Li, W.; Brown, B.; Young, D.; Nešić, S. Investigation of Pseudo-Passivation of Mild Steel in CO2 Corrosion. Corrosion 2014, 70, 294–302. [Google Scholar] [CrossRef] [Green Version]
  51. Nguyen, A.S.; Causse, N.; Musiani, M.; Orazem, M.E.; Pébère, N.; Tribollet, B.; Vivier, V. Determination of Water Uptake in Organic Coatings Deposited on 2024 Aluminium Alloy: Comparison between Impedance Measurements and Gravimetry. Prog. Org. Coat. 2017, 112, 93–100. [Google Scholar] [CrossRef]
  52. Bouvet, G.; Nguyen, D.D.; Mallarino, S.; Touzain, S. Analysis of the Non-Ideal Capacitive Behaviour for High Impedance Organic Coatings. Prog. Org. Coat. 2014, 77, 2045–2053. [Google Scholar] [CrossRef]
  53. Thomas, S.; Birbilis, N.; Venkatraman, M.S.; Cole, I.S. Self-Repairing Oxides to Protect Zinc: Review, Discussion and Prospects. Corros. Sci. 2013, 69, 11–22. [Google Scholar] [CrossRef]
  54. Mouanga, M.; Berçot, P.; Rauch, J.Y. Comparison of Corrosion Behaviour of Zinc in NaCl and in NaOH Solutions. Part I: Corrosion Layer Characterization. Corros. Sci. 2010, 52, 3984–3992. [Google Scholar] [CrossRef]
  55. Shi, H.; Liu, F.; Han, E.H. The Corrosion Behavior of Zinc-Rich Paints on Steel: Influence of Simulated Salts Deposition in an Offshore Atmosphere at the Steel/Paint Interface. Surf. Coat. Technol. 2011, 205, 4532–4539. [Google Scholar] [CrossRef]
  56. Shirehjini, F.T.; Danaee, I.; Eskandari, H.; Zarei, D. Effect of Nano Clay on Corrosion Protection of Zinc-Rich Epoxy Coatings on Steel 37. J. Mater. Sci. Technol. 2016, 32, 1152–1160. [Google Scholar] [CrossRef]
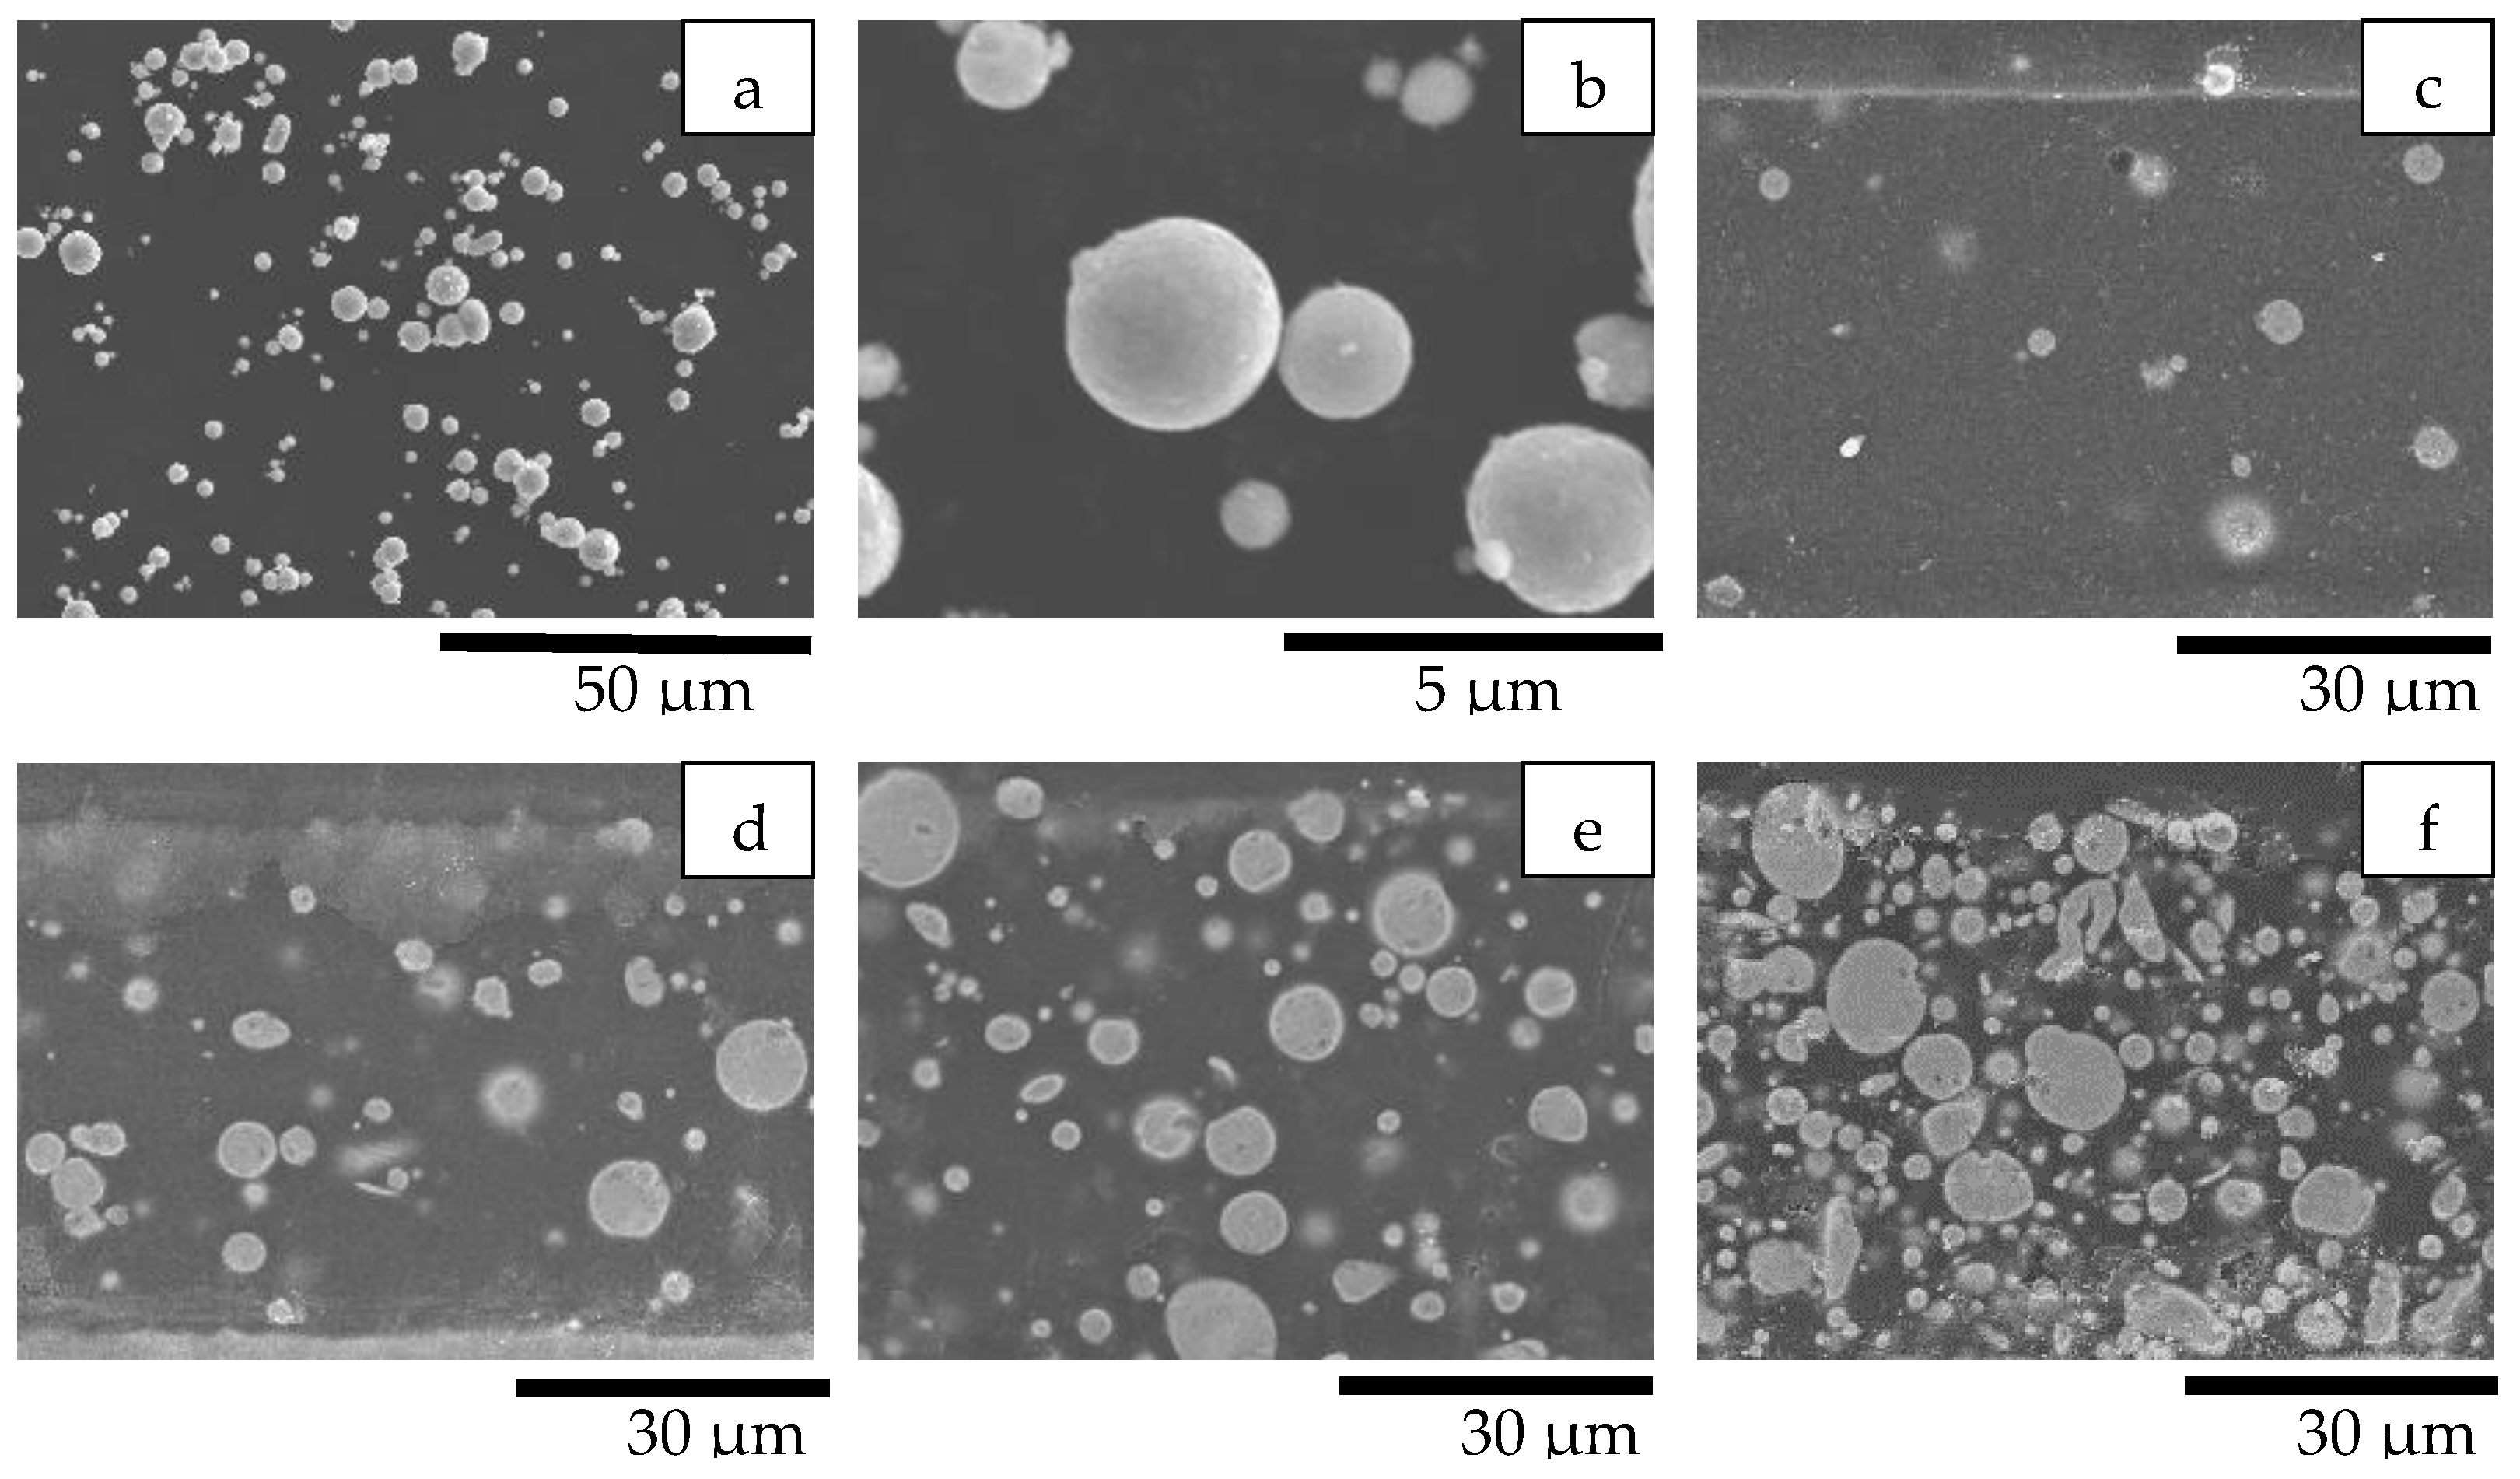
Figure 1. SEM images. (a,b) Zinc particles; (cf) cross-sections of coatings with 20, 40, 60, and 80% zinc in PC. (a) Zn; (b) Zn; (c) Zn–20%-PC; (b) Zn–40%-PC; (e) Zn–60%-PC; (f) Zn–80%-PC.
Processes 10 01853 g001
Figure 2. Micro-CT images (a,b), at two angles of view, of coatings prepared from the formula Zn–80%-PC. The images represent projections of 3D tomographs of a specimen having a square upper surface with sides of 750 µm.
Processes 10 01853 g002
Figure 3. SEM images. (ad) Coating surfaces with 4 zinc dosages; (e) cross-section and (f) surface after immersion test for a coating prepared from the formula Zn–80%-PC. (a) Zn–20%-PC; (b) Zn–40%-PC; (c) Zn–60%-PC; (d) Zn–80%-PC; (e) Zn–80%-PC, after test; (f) Zn–80%-PC, after test.
Processes 10 01853 g003
Figure 4. (a–e) Confocal maps and (f) surface roughness (Sa) values of the coating surfaces. (a) Control-PC; (b) Zn–20%-PC; (c) Zn–40%-PC; (d) Zn–60%-PC; (e) Zn–80%-PC; (f) Sa values.
Processes 10 01853 g004
Figure 5. Surface quality (a) specular gloss, DOI and haze values; and (b) impact resistance of the coatings with 0–80% zinc.
Processes 10 01853 g005
Figure 6. (a) OCP and (b) Rp values of the coatings with zinc (PC).
Processes 10 01853 g006
Figure 7. Spectra of a coating prepared from the formula Zn–80%-PC after immersion test. (a) XRD pattern; (b) Raman spectrum of zinc corrosion products on coating surface; (c) spot with zinc corrosion product simonkolleite under an optical microscope; (d) Raman spectrum of zinc corrosion products near the coating surface in the cross-section; (e) spot with the zinc corrosion product smithsonite under optical microscope; (f) Raman spectrum of the iron corrosion product; (g) spot with the iron corrosion product lepidocrocite under an optical microscope.
Processes 10 01853 g007
Figure 8. (ae) Schematics and EECs for EIS data fitting for a coating with 80% zinc in PC. (a) Stage 1; (b) Stage 2; (c) Stage 3; (d) Stage 4; (e) Stage 5.
Processes 10 01853 g008
Figure 9. Original and fitted EIS spectra of a coating prepared from the formula Zn–80%-PC. (ad) Days 0–8; (eh) Days 9–17; (il) Days 18–28; (mo) Days 29–45; (pr) Days 46–48.
Processes 10 01853 g009
Figure 10. Neutral salt-spray results. (a) ratings after 1000 h, (b) neutral salt-spray hours to reach a mean creepage of 2 mm.
Processes 10 01853 g010
Figure 11. Test panels prepared from the coatings with 0, 60 and 80% zinc after the neutral salt spray test. (a,b) PC-Control, 500–1000 h; (cf) zinc 60%, 500–2500 h; (gj) zinc 80%, 500–3000 h. (a) Control-PC 500 h; (b) Control-PC 1000 h; (c) Zn–60%-PC 500 h; (d) Zn–60%-PC 1000 h; (e)Zn–60%-PC 1500 h; (f) Zn–60%-PC 2500 h; (g) Zn–80%-PC 500 h; (h) Zn–80%-PC 1000 h; (i) Zn–80%-PC 2000 h; (j) Zn–80%-PC 3000 h.
Processes 10 01853 g011
Table 1. Formulae of zinc-rich powder coatings in a polyester/TGIC binder.
Formula CodeZinc Powder/wt%Binder Content/wt%
Control-PC0.0100.0
Zn–20%-PC20.080.0
Zn–40%-PC40.060.0
Zn–60%-PC60.040.0
Zn–80%-PC80.020.0
Table 2. Binder formula of polyester/TGIC powder clearcoat (PC).
ComponentCompositionContent/wt%
Resincarboxylated polyester90.8
Curing agentTGIC6.8
Flow and leveling agentpolyacrylate1.6
Degassing agentbenzoin0.8
Table 3. Standard test methods and instruments for coating performance evaluations.
MeasurementsInstrumentsASTM standards
AdhesionElcometer 107 cross hatch cutter (Elcometer Limited, Manchester, UK)D3359–09
Impact resistanceElcometer 1615 variable impact tester (Elcometer Limited, Manchester, UK)D2794–93 (Reapproved 2010)
Pencil hardnessBYK 5800 pencil hardness tester (BYK Gardner USA, Wallingford, CT, USA)D3363–05 (Reapproved 2011)
Surface qualityRhopoint IQ 20/60 gloss meter/goniophotometer
(Rhopoint Instruments Ltd., St Leonards, UK)
Specular gloss, D523–14
distinctness-of-image (DOI), D5767–18
Reflection haze, D4039–09 (Reapproved 2015)
Neutral salt sprayMX-9204
(Associated Environmental Systems, Acton, MA, USA)
B117–16
D1654–08
Degree of rustingVisual inspectionD610–08 (Reapproved 2019)
Table 4. Fitted values of EEC components for a coating prepared from the formula Zn–80%-PC, Stage 1.
TimeCPEcoatRporeCPEdl, 1Rct, 1χ2
DaysQcoat/
Ω−1∙cm−2∙sα
αcoatΩ∙cm2Qdl/
Ω−1∙cm−2∙sα
αdlΩ∙cm2
05.73 × 10−100.9581.39 × 1051.39 × 10−80.6491.89 × 1083.66 × 10−3
12.49 × 10−90.8471.54 × 1053.24 × 10−80.7673.55 × 1073.53 × 10−3
45.35 × 10−80.9705.45 × 1051.71 × 10−70.4762.31 × 1074.15 × 10−4
84.87 × 10−100.9661.86 × 1057.97 × 10−70.3441.61 × 1072.31 × 10−4
Table 5. Fitted values of EEC components for a coating prepared from the formula Zn–80%-PC, Stage 2.
TimeCPEcoatRporeCPEdl, 2Rct, 2Ws, 2, RDWs, 2, TDWs, 2, Pχ2
DaysQcoat/
Ω−1∙cm−2∙sα
αcoatΩ∙cm2Qdl/
Ω−1∙cm−2∙sα
αdlΩ∙cm2Ω∙cm2∙sPs
95.97 × 10−100.9541.12 × 1051.23× 10−60.3201.39 × 1073.93 × 1096.28 × 1030.9771.45 × 10−4
121.16 × 10−90.9417.48 × 1021.01 × 10−60.3689.24 × 1042.24 × 1063.43 × 1040.4121.21 × 10−4
159.87 × 10−90.8808.87 × 1028.52 × 10−60.2601.10 × 1052.07 × 1061.79 × 1050.4681.14 × 10−4
172.85 × 10−80.8511.23 × 1035.81 × 10−60.4391.52 × 1054.18 × 1056.13 × 1040.4821.43 × 10−4
Table 6. Fitted values of EEC components for a coating prepared from the formula Zn–80%-PC, Stage 3.
TimeCPEcoatRporeCPEdl, 3Rct, 3χ2
DaysQcoat/
Ω−1∙cm−2∙sα
αcoatΩ∙cm2Qdl/
Ω−1∙cm−2∙sα
αdlΩ∙cm2
182.86 × 10−70.6924.24 × 1049.25 × 10−60.4802.13 × 1051.07 × 10−3
206.59 × 10−70.7352.34 × 1041.07 × 10−50.5311.44 × 1051.84 × 10−3
227.27 × 10−70.7288.92 × 1031.38 × 10−50.4731.41 × 1052.13 × 10−3
258.58 × 10−50.7156.58 × 1031.89 × 10−50.4431.59 × 1051.83 × 10−3
281.15 × 10−60.6375.14 × 1032.44 × 10−50.3863.30 × 1051.24 × 10−3
Table 7. Fitted values of EEC components for a coating prepared from the formula Zn–80%-PC, Stage 4.
TimeRporeCPE, 4Ws, 4, RDWs, 4, TDWs, 4, Pχ2
DaysΩ∙cm2Qdl/
Ω−1∙cm−2∙sα
αdlΩ∙cm2∙sPs
292.53 × 1031.82 × 10−80.6561.50 × 1054.88 × 1030.3247.90 × 10−4
331.63 × 1036.29 × 10−70.6791.12 × 1056.54 × 1030.3408.18 × 10−4
372.01 × 1021.82 × 10−81.0001.15 × 1058.49 × 1030.3377.96 × 10−4
418.58 × 1011.85 × 10−81.0001.38 × 1059.90 × 1030.3457.29 × 10−4
452.71 × 1025.19 × 10−80.9081.50 × 1051.08 × 1040.3478.29 × 10−4
Table 8. Fitted values of EEC components for a coating prepared from the formula Zn–80%-PC, Stage 5.
TimeCPEcoatRporeCPEdl, 5Rct, 5Ws, 5, RDWs, 5, TDWs, 5, Pχ2
DaysQcoat/
Ω−1∙cm−2∙sα
αcoatΩ∙cm2Qdl/
Ω−1∙cm−2∙sα
αdlΩ∙cm2Ω∙cm2∙sPs
462.46 × 10−50.3577.86 × 1017.61 × 10−91.0005.72 × 1044.69 × 1052.11 × 1030.644.24 × 10−4
472.45 × 10−50.3557.39 × 1017.37 × 10−91.0005.44 × 1045.28 × 1052.57 × 1030.643.71 × 10−4
482.38 × 10−50.3547.98 × 1016.77 × 10−91.0004.35 × 1043.65 × 1052.66 × 1030.623.52 × 10−4
Publisher’s Note: MDPI stays neutral with regard to jurisdictional claims in published maps and institutional affiliations.