3.1. Rice Husk Char Carbonization
The carbonization of the rice husk char was carried out to remove volatile impurities and increase the degree of carbonization and the regularity of the carbon structure. A comparison of the functional groups of the rice husk char before and after carbonation at various temperatures is shown in
Figure 1 and
Table 1.
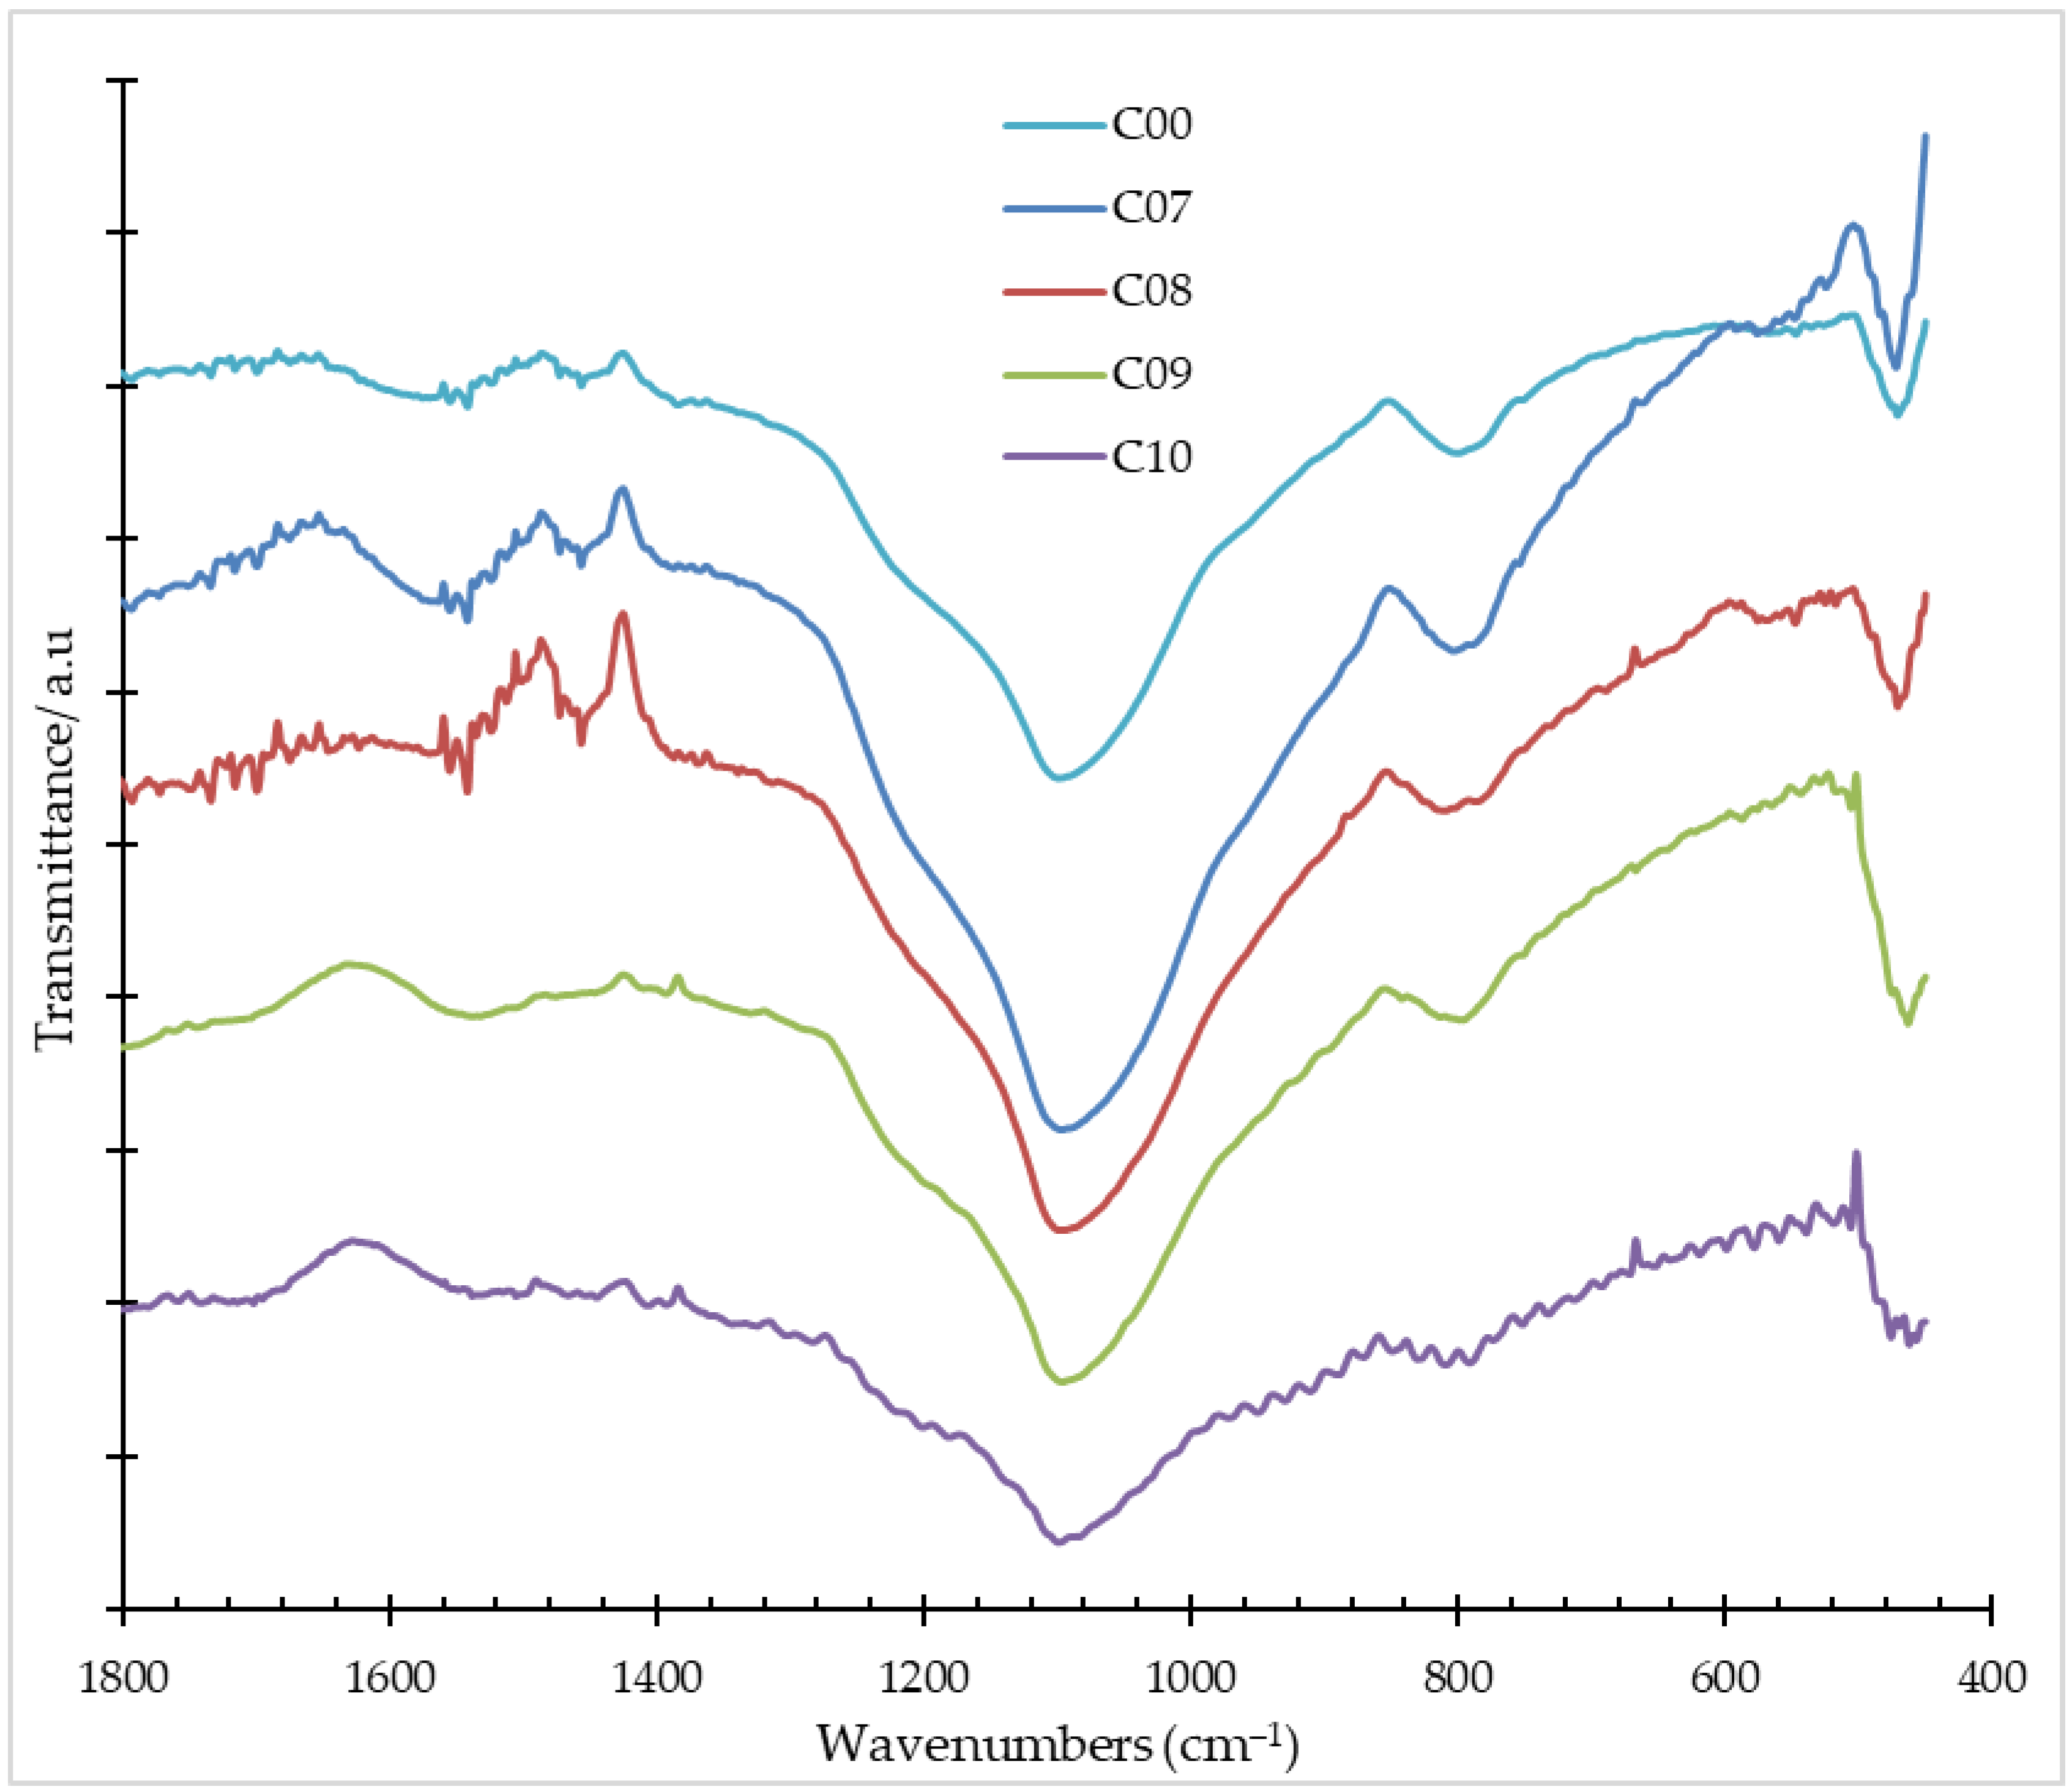
Figure 1 shows a change in the IR absorption of the rice husk char before (C00) and after carbonization (C07–C10). The band around 1600 cm
−1 is usually caused by the stretching vibration of C=O in ketones, aldehydes, lactones and carboxyl groups; the band around 1400–1500 cm
−1 is attributed to an aromatic ring or C=C stretching vibration. This indicates the formation of carbonyl groups and the carbonization of the precursor. This shows that the degree of carbonization in C00 is smaller than that of rice husk char after carbonization. The relative intensity of the band around 1600 cm
−1 displayed decreases with the change in the calcination temperature. For temperatures above 800 °C, the relative intensity of the band at 1600 cm
−1 began to disappear with the increase in the activation temperature. The strong bands located around 1088 cm
−1 and 803 cm
−1 are attributed to the asymmetric and symmetric stretching of the Si–O band. The IR absorptions identified from all samples, as shown in
Table 1, included the bending vibration of Si-O at Si-O-Si≡, symmetric stretching vibration of =Si-O at =Si-O-Si=, and asymmetric stretching vibration of =Si-O at (=Si-O-Si=). These absorption bands indicate the presence of silica in rice husk char.
3.2. SiC Synthesis and Purification with 1 M HCl Solution
SiC synthesis using the magnesiothermic reduction (MR) method was carried out by adding Mg as a reducing agent. Mg was used in a slightly higher amount than the stoichiometric requirement, namely the ratio of moles of SiO
2 to Mg of 1:2.5. The determination of the mole ratio refers to Equation (1) as proposed by Shi et al. [
6]:
Su et al. (2016) confirmed that the reaction for the formation of SiC (Equation (1)) follows this mechanism: (a) SiO
2 reacts with Mg resulting in Mg
2Si, and (b) Mg
2Si and the remaining SiO
2 subsequently react with C, forming SiC and MgO complying with the Equations (2) and (3) [
9]. The reaction between SiO
2 and Mg, according to Equation (2), is thermodynamically favorable due to a lower ΔG compared to the other possible reactions of the precursors, as can be seen from Equation (4) [
6,
15] and Equation (5) [
7].
In this work, the MR method for the formation of SiC was accomplished at 700 °C. The ΔG of the reaction at a nonstandard condition can be calculated using Equation (6). According to the thermodynamics data table [
16], the calculated ΔG from the chemical reactions in Equations (2), (4), and (5) at 700 °C (973.18 K) are −471.76, −327.88, and +77.86 kJ/mol, respectively. Meanwhile, the ΔG of reaction from Equation (3) is −401.44 kJ/mol; thus, the ΔG of the reaction in Equation (1) is −873.20 kJ/mol.
The characterization of the functional groups by FT-IR for the reduction products of rice husk char variations (C07R–C10R) is shown in
Figure 2 and
Table 2. All samples of the reduction products had absorption at a wave number of about 830 cm
−1, which indicates the stretching vibration of Si-C. Additionally, all samples showed stretching vibrations of Mg-O at a wave number of 430 cm
−1. Among all the samples, C07R had a weak absorption at 430 cm
−1. Furthermore, it had an absorption of the asymmetric stretching vibration =Si-O on (=Si-O-Si=) at a wave number of 1093 cm
−1, indicating the presence of silica that has not reacted with magnesium which then forms SiC. This is because the C07 sample still contains several organic compounds that can react with Mg.
The XRD characterization results of each sample from the reduction stage are shown in
Figure 3. The XRD pattern in
Figure 3 shows that the four samples of the reduction products formed compounds with different types and compositions. Tracing the diffractogram with the Highscrore Plus Ver program 2012.3.0.5 based on standard Inorganic Crystal Structure Database (ICSD) data,
Figure 3 shows the formation of SiC at the peak at an angle of 2θ around 35.6°, 59.9°, and 71.7° (ICSD 98-016-4973). The by-products of the reduction step were MgO, Mg
2SiO
4, and Si. The formation of MgO was indicated by a high-intensity peak at 2θ around 43.0°, 62.5°, and 78.9° (ICSD 98-010-4845), and it was formed in all types of reduction product samples. Other by-products were in very small quantities as demonstrated by a very low diffraction intensity. The by-product was estimated as Mg
2SiO
4, as indicated by the presence of a diffraction peak at 2θ around 22.6°, 32.0°, 36.1°, and 51.7° (ICSD 98-003-4232). Meanwhile, silicon by-products were shown to peak at 2θ around 28.4°, 47.2°, and 56.1° (ICSD 96-901-3104). Sadique (2010) stated that the synthesis time and temperature played an important role in the formation of Mg
2SiO
4 [
18]. Equation (7) is presumably the pathway for the formation of Mg
2SiO
4 [
19]. The side reaction of Mg
2SiO
4 formation (Equation (7)) at 700 °C denotes a ΔG value of −62.65 kJ/mol. The value of ΔG from this side reaction is relatively much larger than the ΔG from the reaction for the formation of SiC, so that in thermodynamic theory it will be formed in relatively small amounts. This fact is confirmed by the data from ref. [
16].
The presence of MgO as a by-product in each type of reduction product was reduced by washing with a 1 M HCl solution. MgO reacts with HCl to form MgCl
2, which is soluble in water. The FT-IR characterization of the reduction products after the washing step is shown in
Figure 4 and
Table 3. Based on the results, MgO was successfully washed from all samples, as indicated by the absence of the Mg-O vibrational absorption band at 430 cm
−1. It was also clarified by the absence of a diffraction peak at 2θ around 43.0°, 62.5°, and 78.9° on the C07H and C10H diffractograms.
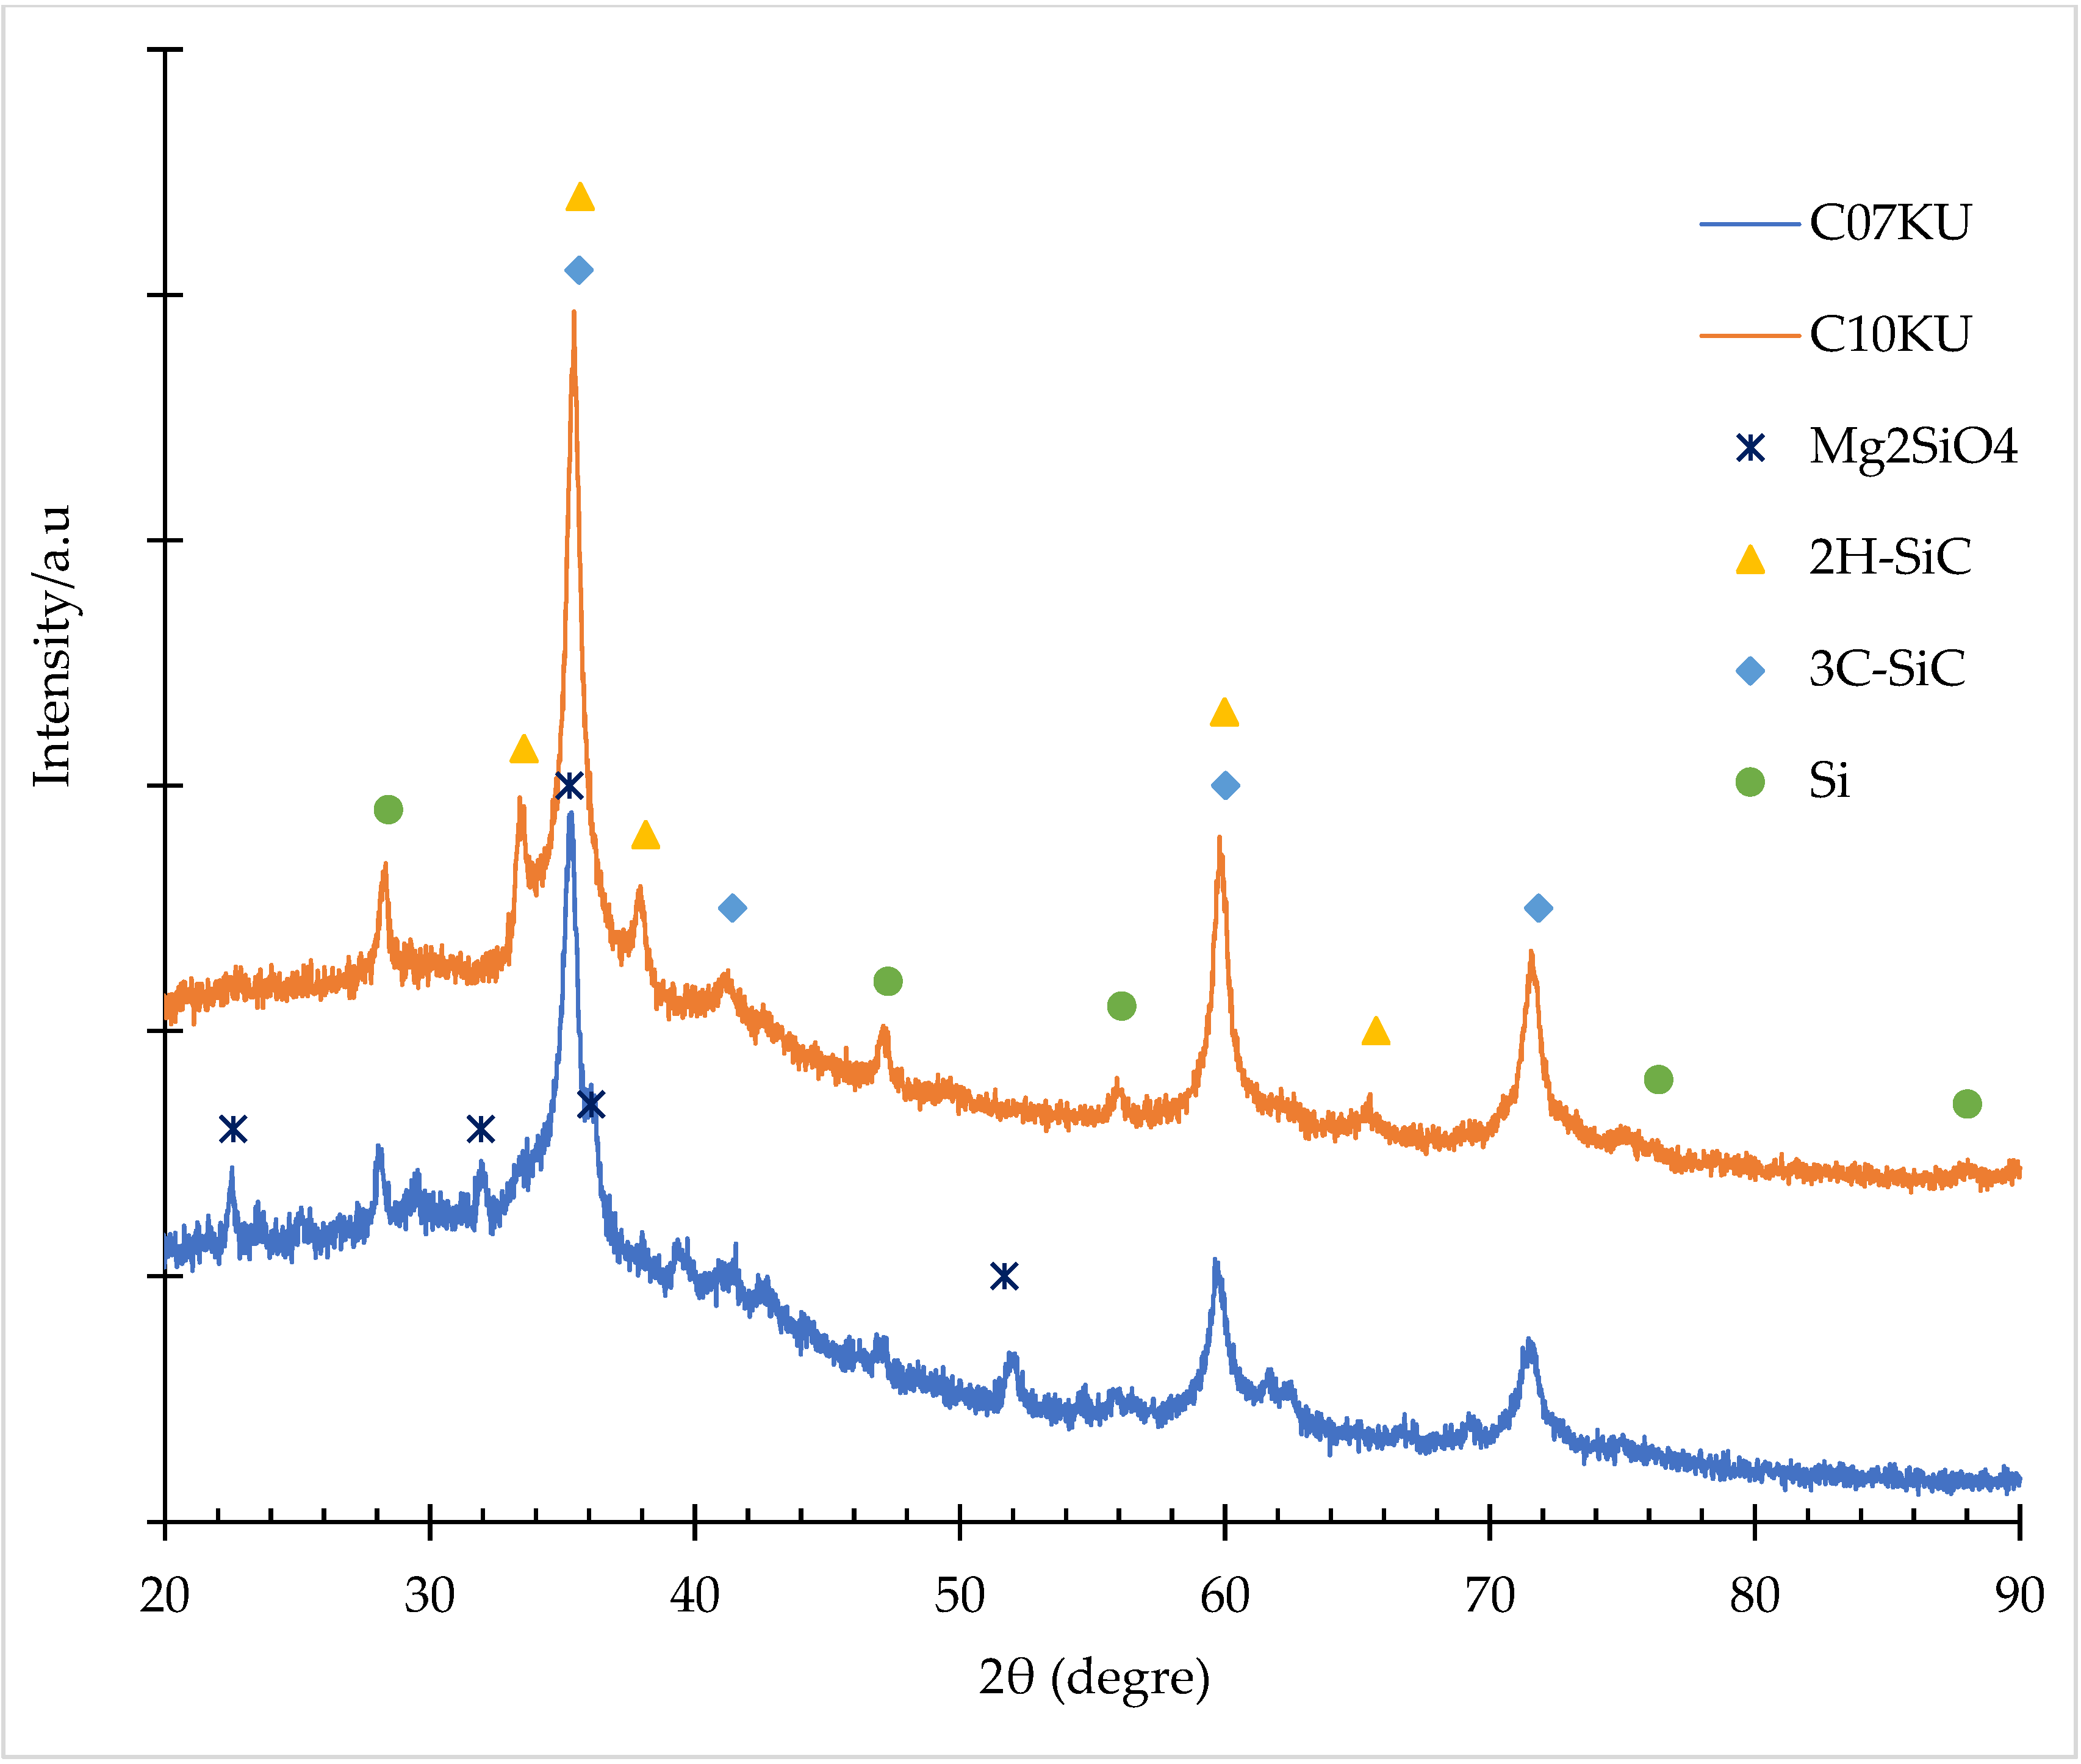
In the diffractogram of the washed product with HCl (
Figure 5), the samples C07H and C10H had a difference in the 2θ peaks representing SiC. The diffractogram of sample C07H showed peaks for the 3C-SiC polytype while C10H showed peaks for the 3C-SiC and 2H-SiC polytypes. Gao et al. (2011) reported the formation of the 2H-SiC polytype prepared with the MR method [
12]. The formation of 2H-SiC is influenced by the porosity of the carbon base material. In solids chemistry, carbonization can change the porosity and crystallinity of carbon. Furthermore, Solihudin et al. (2015) stated that the carbonization of rice husk char at 900 °C caused graphitization [
13]. This also applies to rice husk char carbonized at 1000 °C. The regularity of the structure in graphite is presumably one of the factors for the formation of 2H-SiC. Aside from graphitization, the base material also affects the formation of the 2H-SiC polytype. The gasified rice husk char has a carbon morphology shielded by SiO
2; hence, the template for the MR process is carbon. This causes a pseudomorphic transformation with template C, and the SiC crystal structure is estimated to follow the C crystal structure.
In addition, the diffractogram result from the washing with HCl also indicated the presence of diffraction peaks probably from Mg2SiO4 and Silicon. Sadique (2010) stated that Mg2SiO4 could not be washed with HCl except at the washing stage with a mixture of 5% HF: 4.38 M CH3COOH (1:9).
3.3. Calcination of Reduction and Purification Products with Mixed Acid Solutions
The reduction product after washing with a 1 M HCl solution was further calcined in the next stage. Calcination was carried out in atmospheric air at a temperature of 700 °C to remove residual carbon. The calcined product showed a color change from black to gray, which indicated that the remaining carbon had been burned. FTIR results of the calcined products in the air atmosphere indicated the presence of SiO
2 (
Figure 6 and
Table 4).
According to the characterization results of the calcined product with XRD (
Figure 7), the shape of the diffractogram was relatively the same as that of the washing product with HCl. This indicates that the calcination process at 700 °C did not change the crystal structure and the crystalline components contained in the sample are the same. Furthermore, the composition analysis results on the diffractogram in
Table 5 show that the SiC products after calcination decreased compared to after washing with HCl. This indicates that some of the SiC turned into SiO
2 during the calcination process in the presence of air. This is in line with the results of characterization by FTIR, which shows the presence of SiO
2.
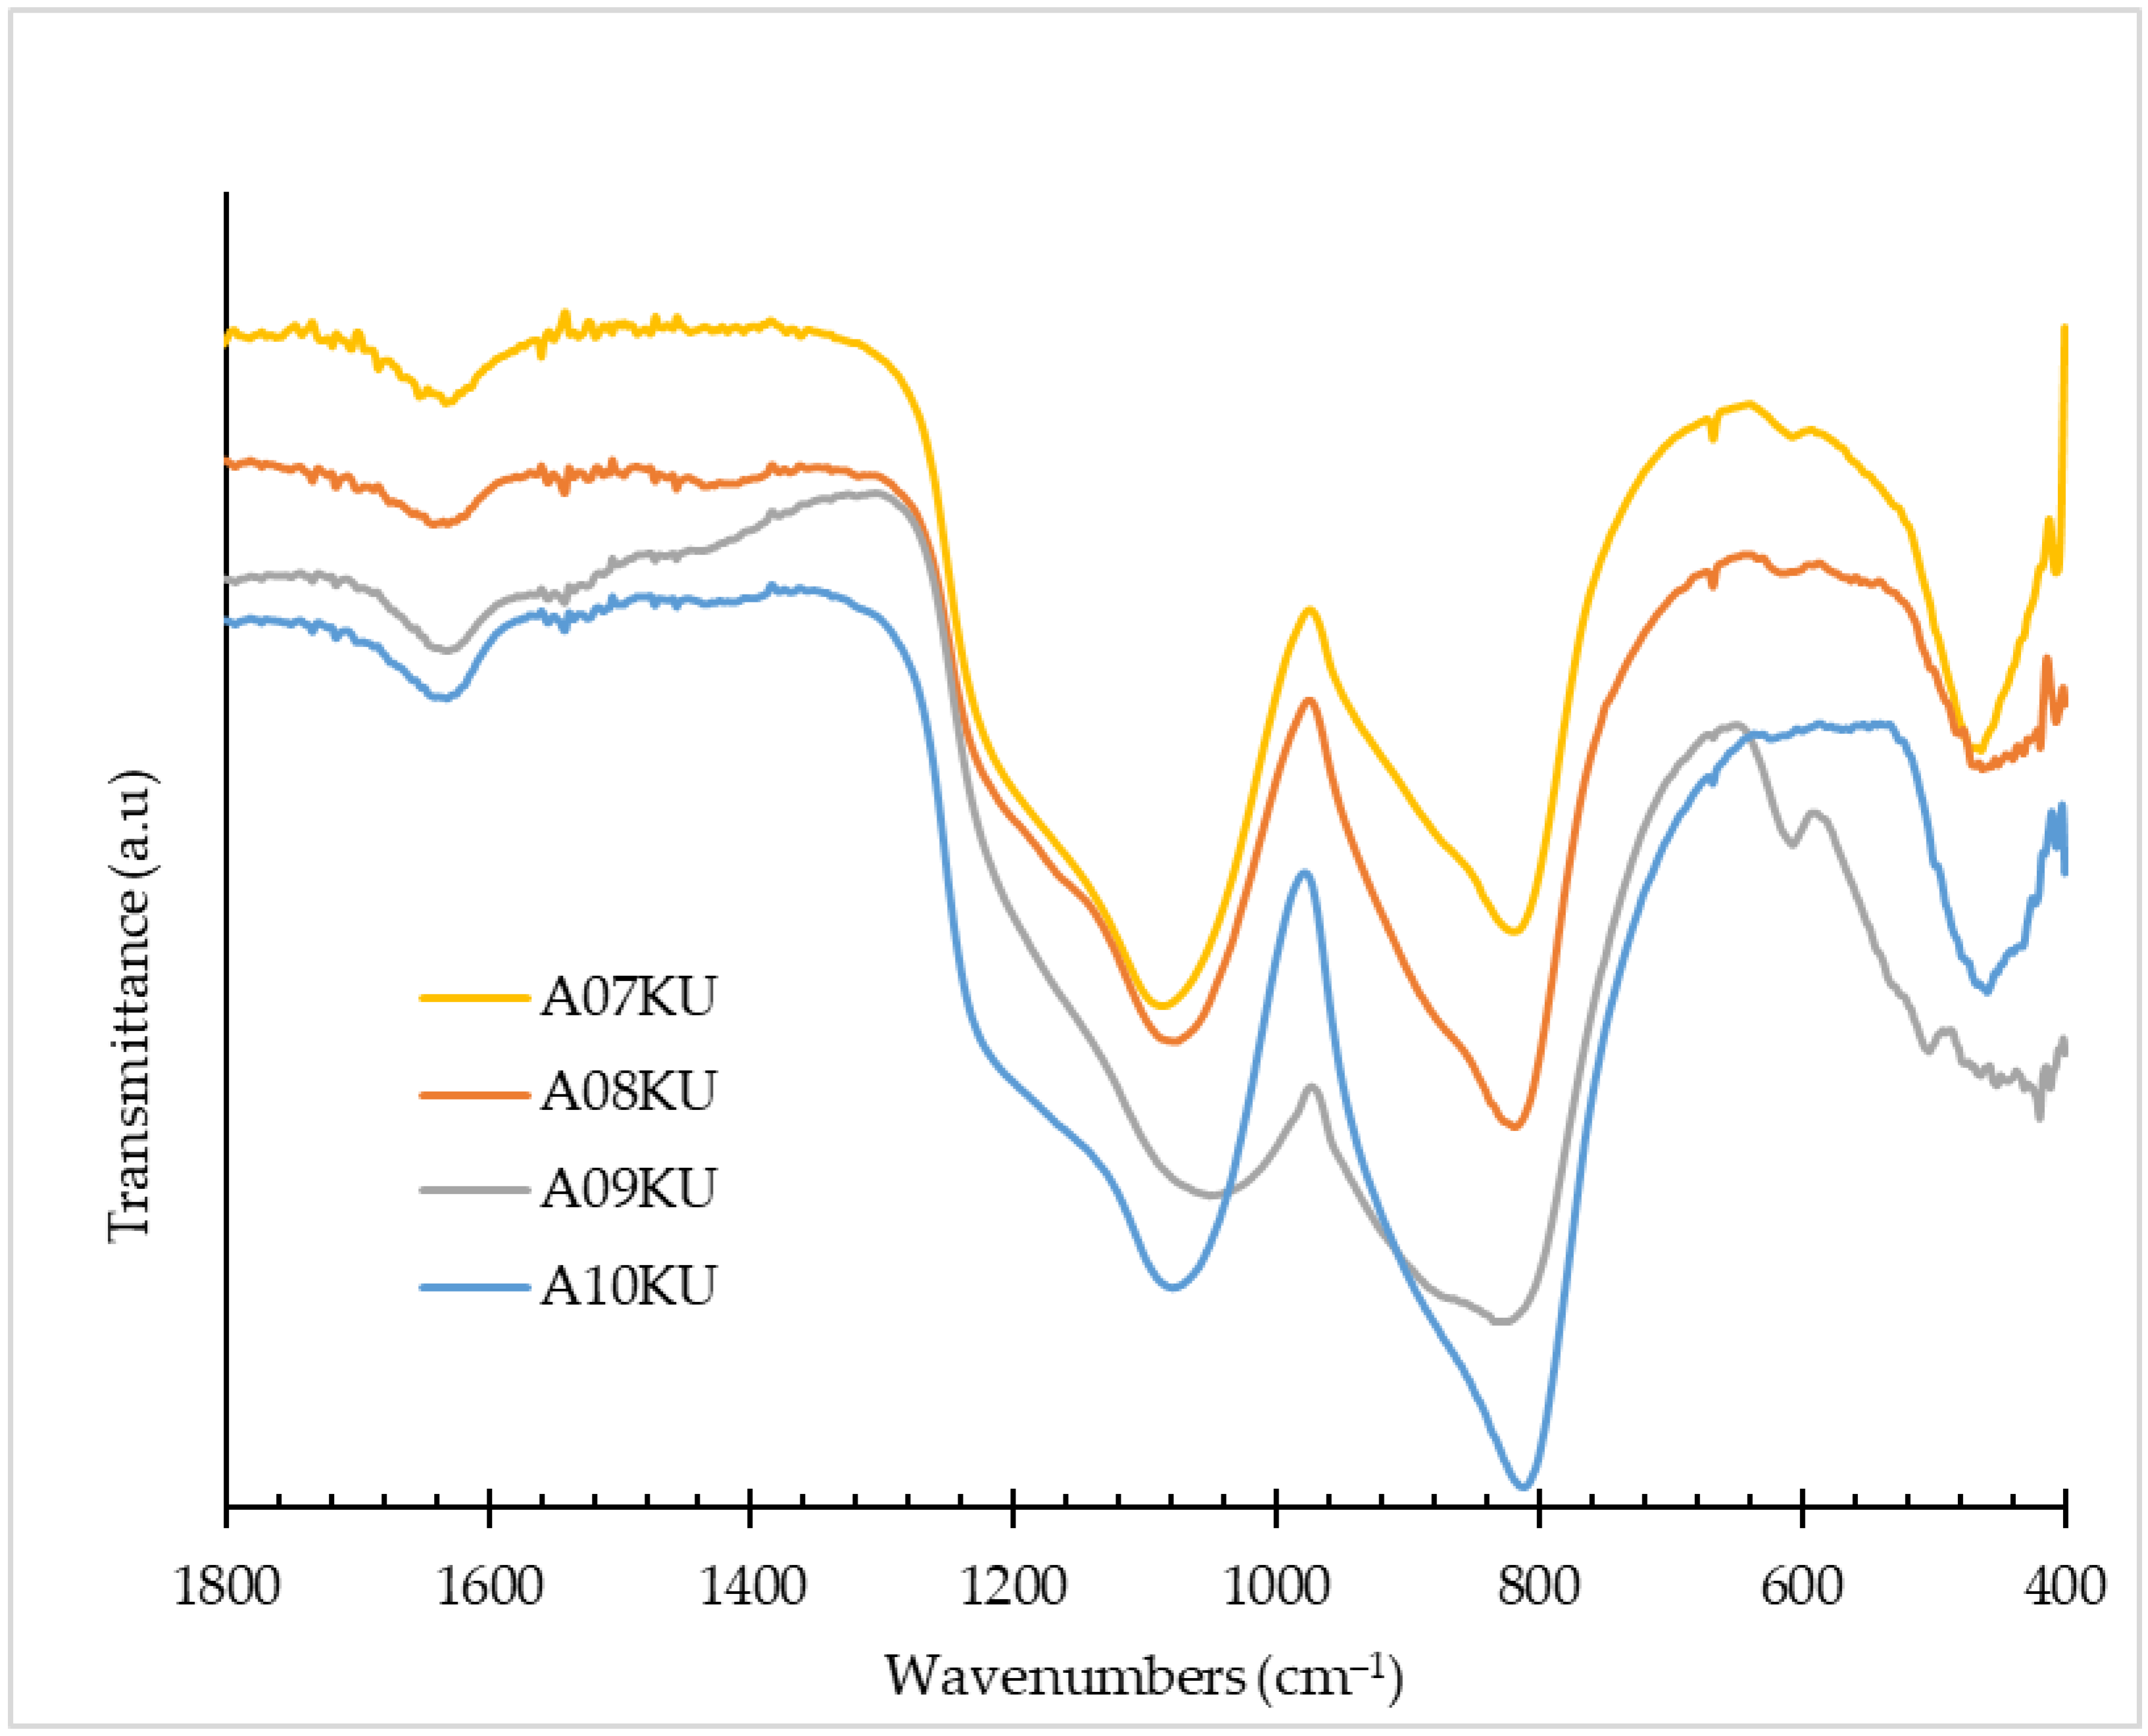
Washing with a mixture of 5% HF: CH
3COOH 4.38 M (1:9) served to remove silica compounds; hence, the SiC obtained was free from impurities.
Figure 8 and
Table 6 show that in all the IR spectra, an absorption band was observed at a wave number of 830 cm
−1, which is a Si-C stretching vibration, and there was no absorption band from the silica compounds. This shows that SiO
2 and Mg
2SiO
4 in the calcined product can be washed with a mixture of 5% HF: CH
3COOH 4.38 M. The absence of Mg
2SiO
4 was further demonstrated in the XRD characterization results as indicated by the loss of the diffraction peak at 2θ around 22.6°, 32.0°, 36.1°, and 51.7° in all diffractograms (
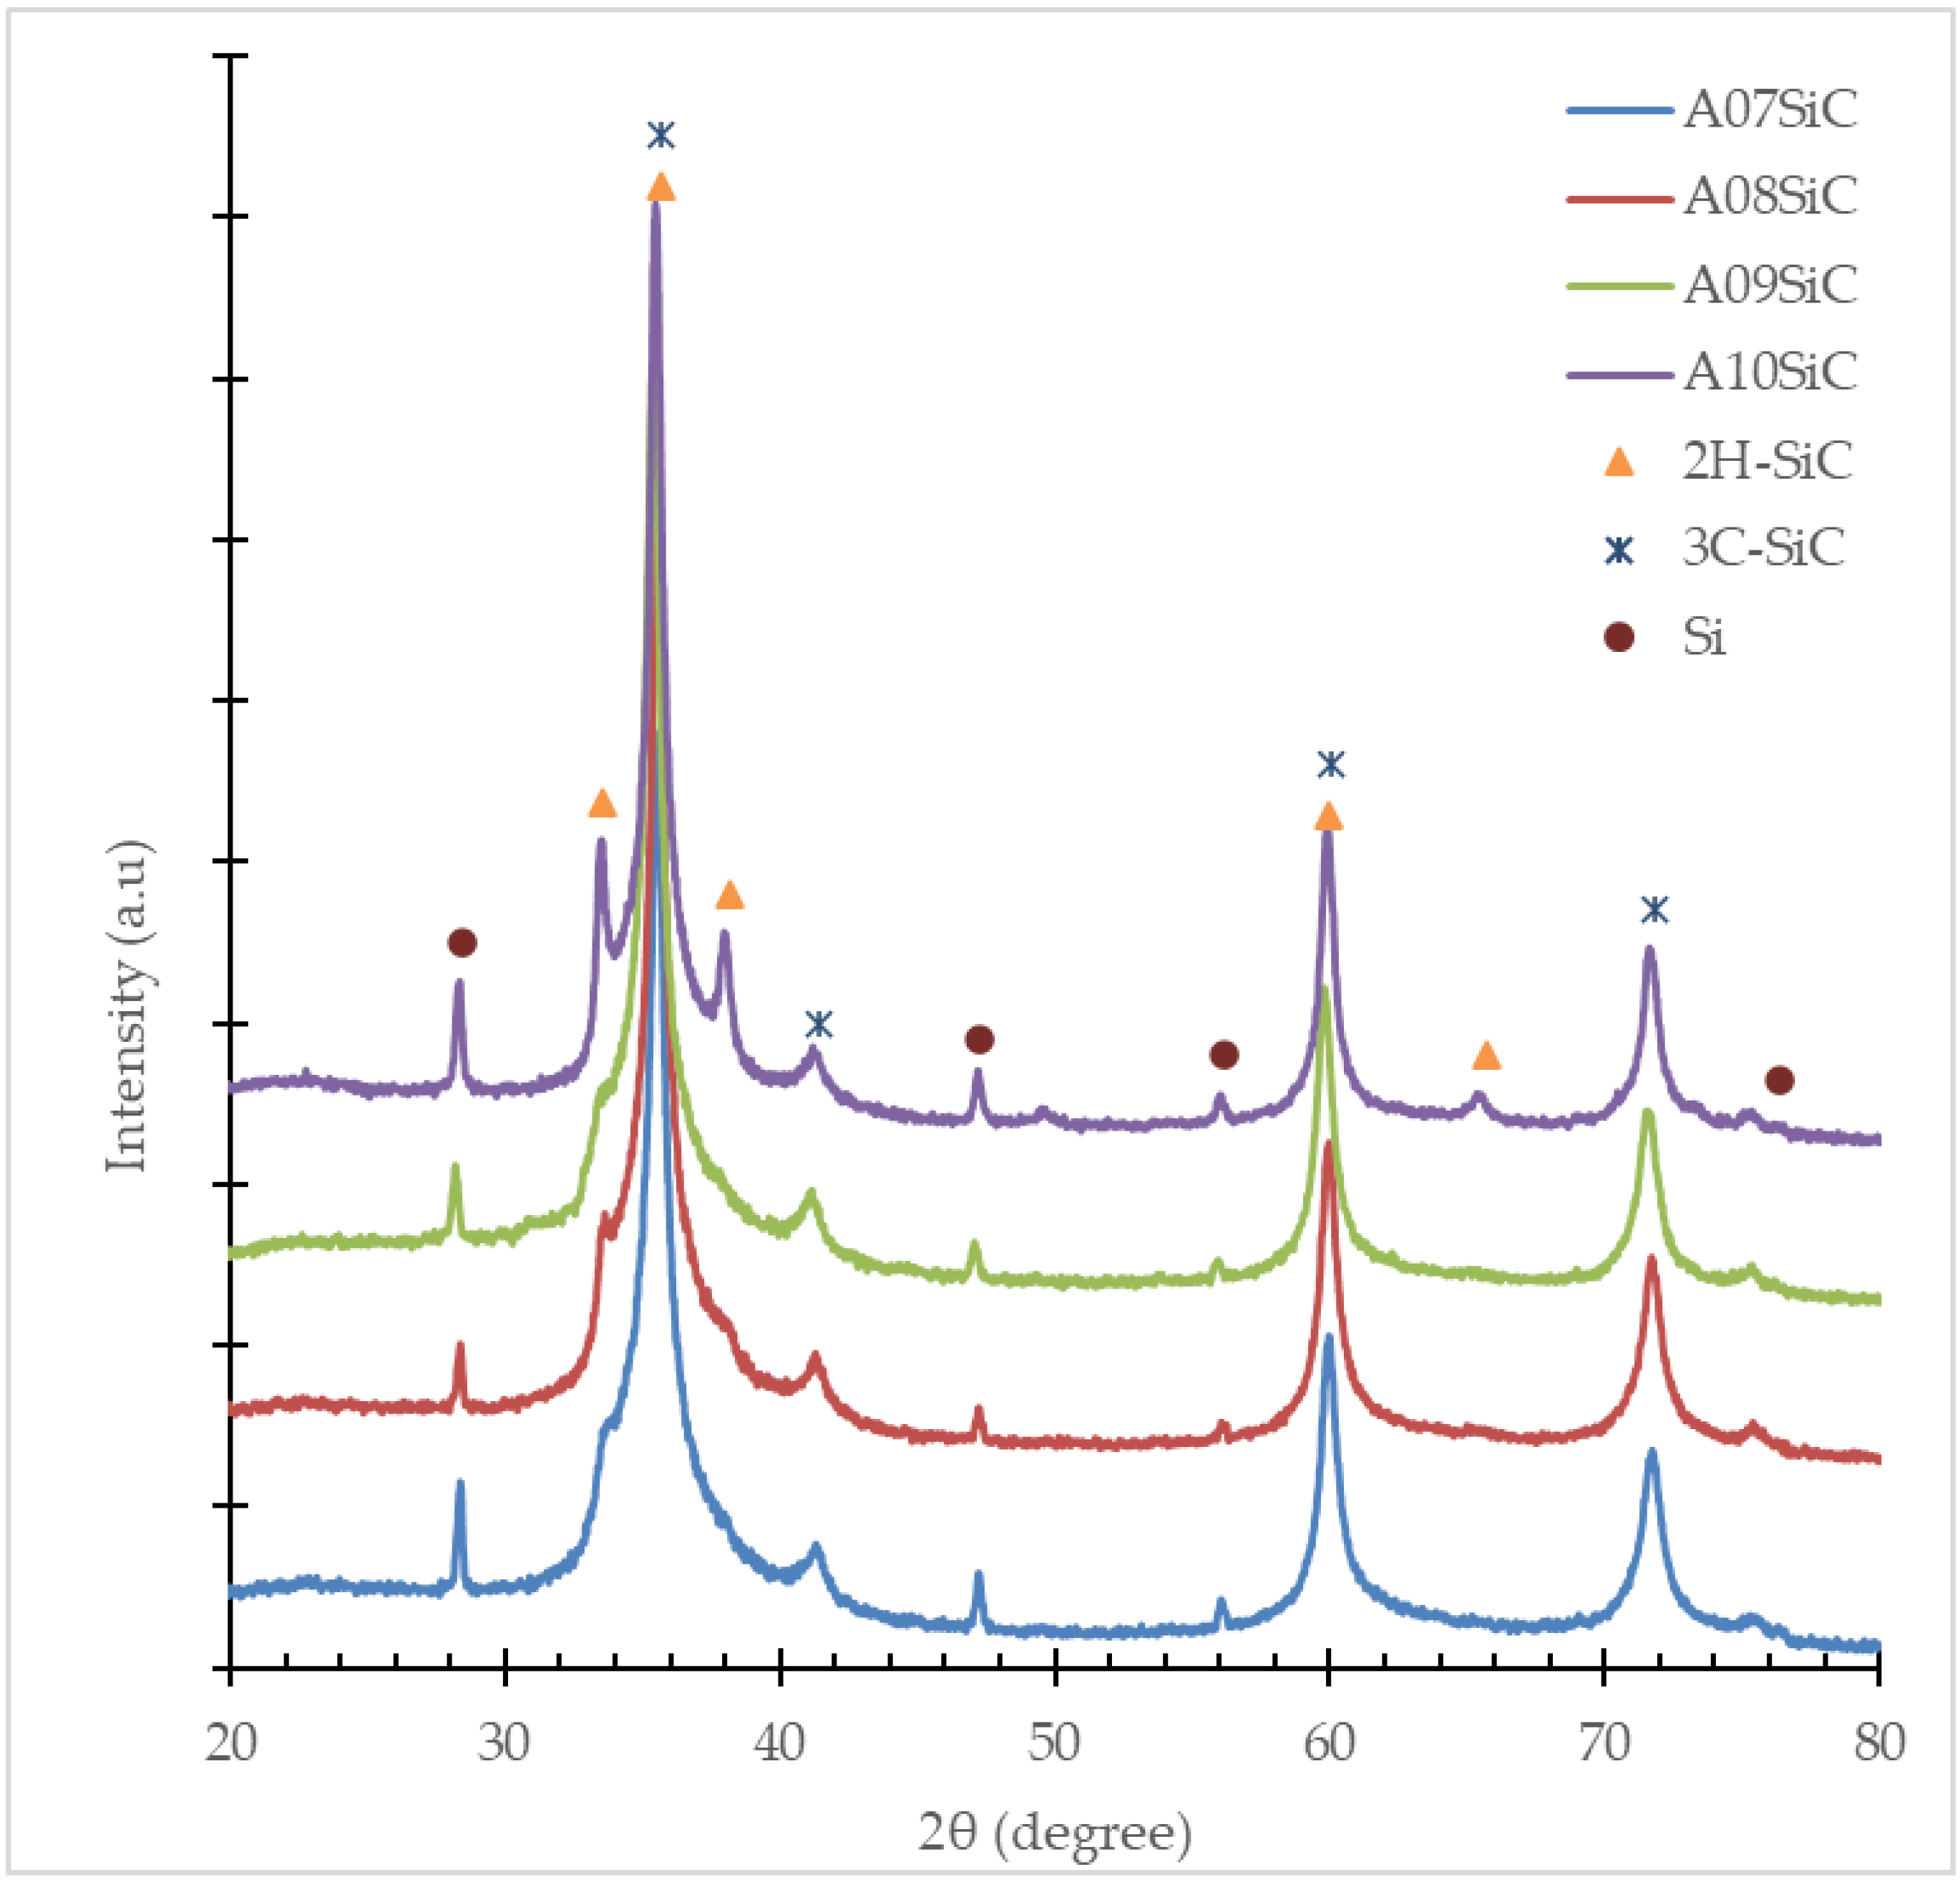
Figure 9). Although silicon could not be removed at this stage, there was still a diffraction peak at 2θ around 28.4°, 47.2°, and 56.1° in all samples.
The search results using the “High Score Plus” software on the diffractograms as presented in
Figure 9 show that the SiC formed is a mixture of 3C-SiC and 2H-SiC polytypes with a dominant composition of 3C-SiC. The composition of the 2H-SiC polytype formed from carbonized rice husk charcoal at 700 °C, 800 °C, and 900 °C was almost the same. Meanwhile, SiC from the rice husk char carbonized at 1000 °C was a mixture of 3C-SiC and 2H-SiC with the highest composition of 2H-SiC compared to the other synthesis products. The composition of each component is listed in detail in
Table 7.
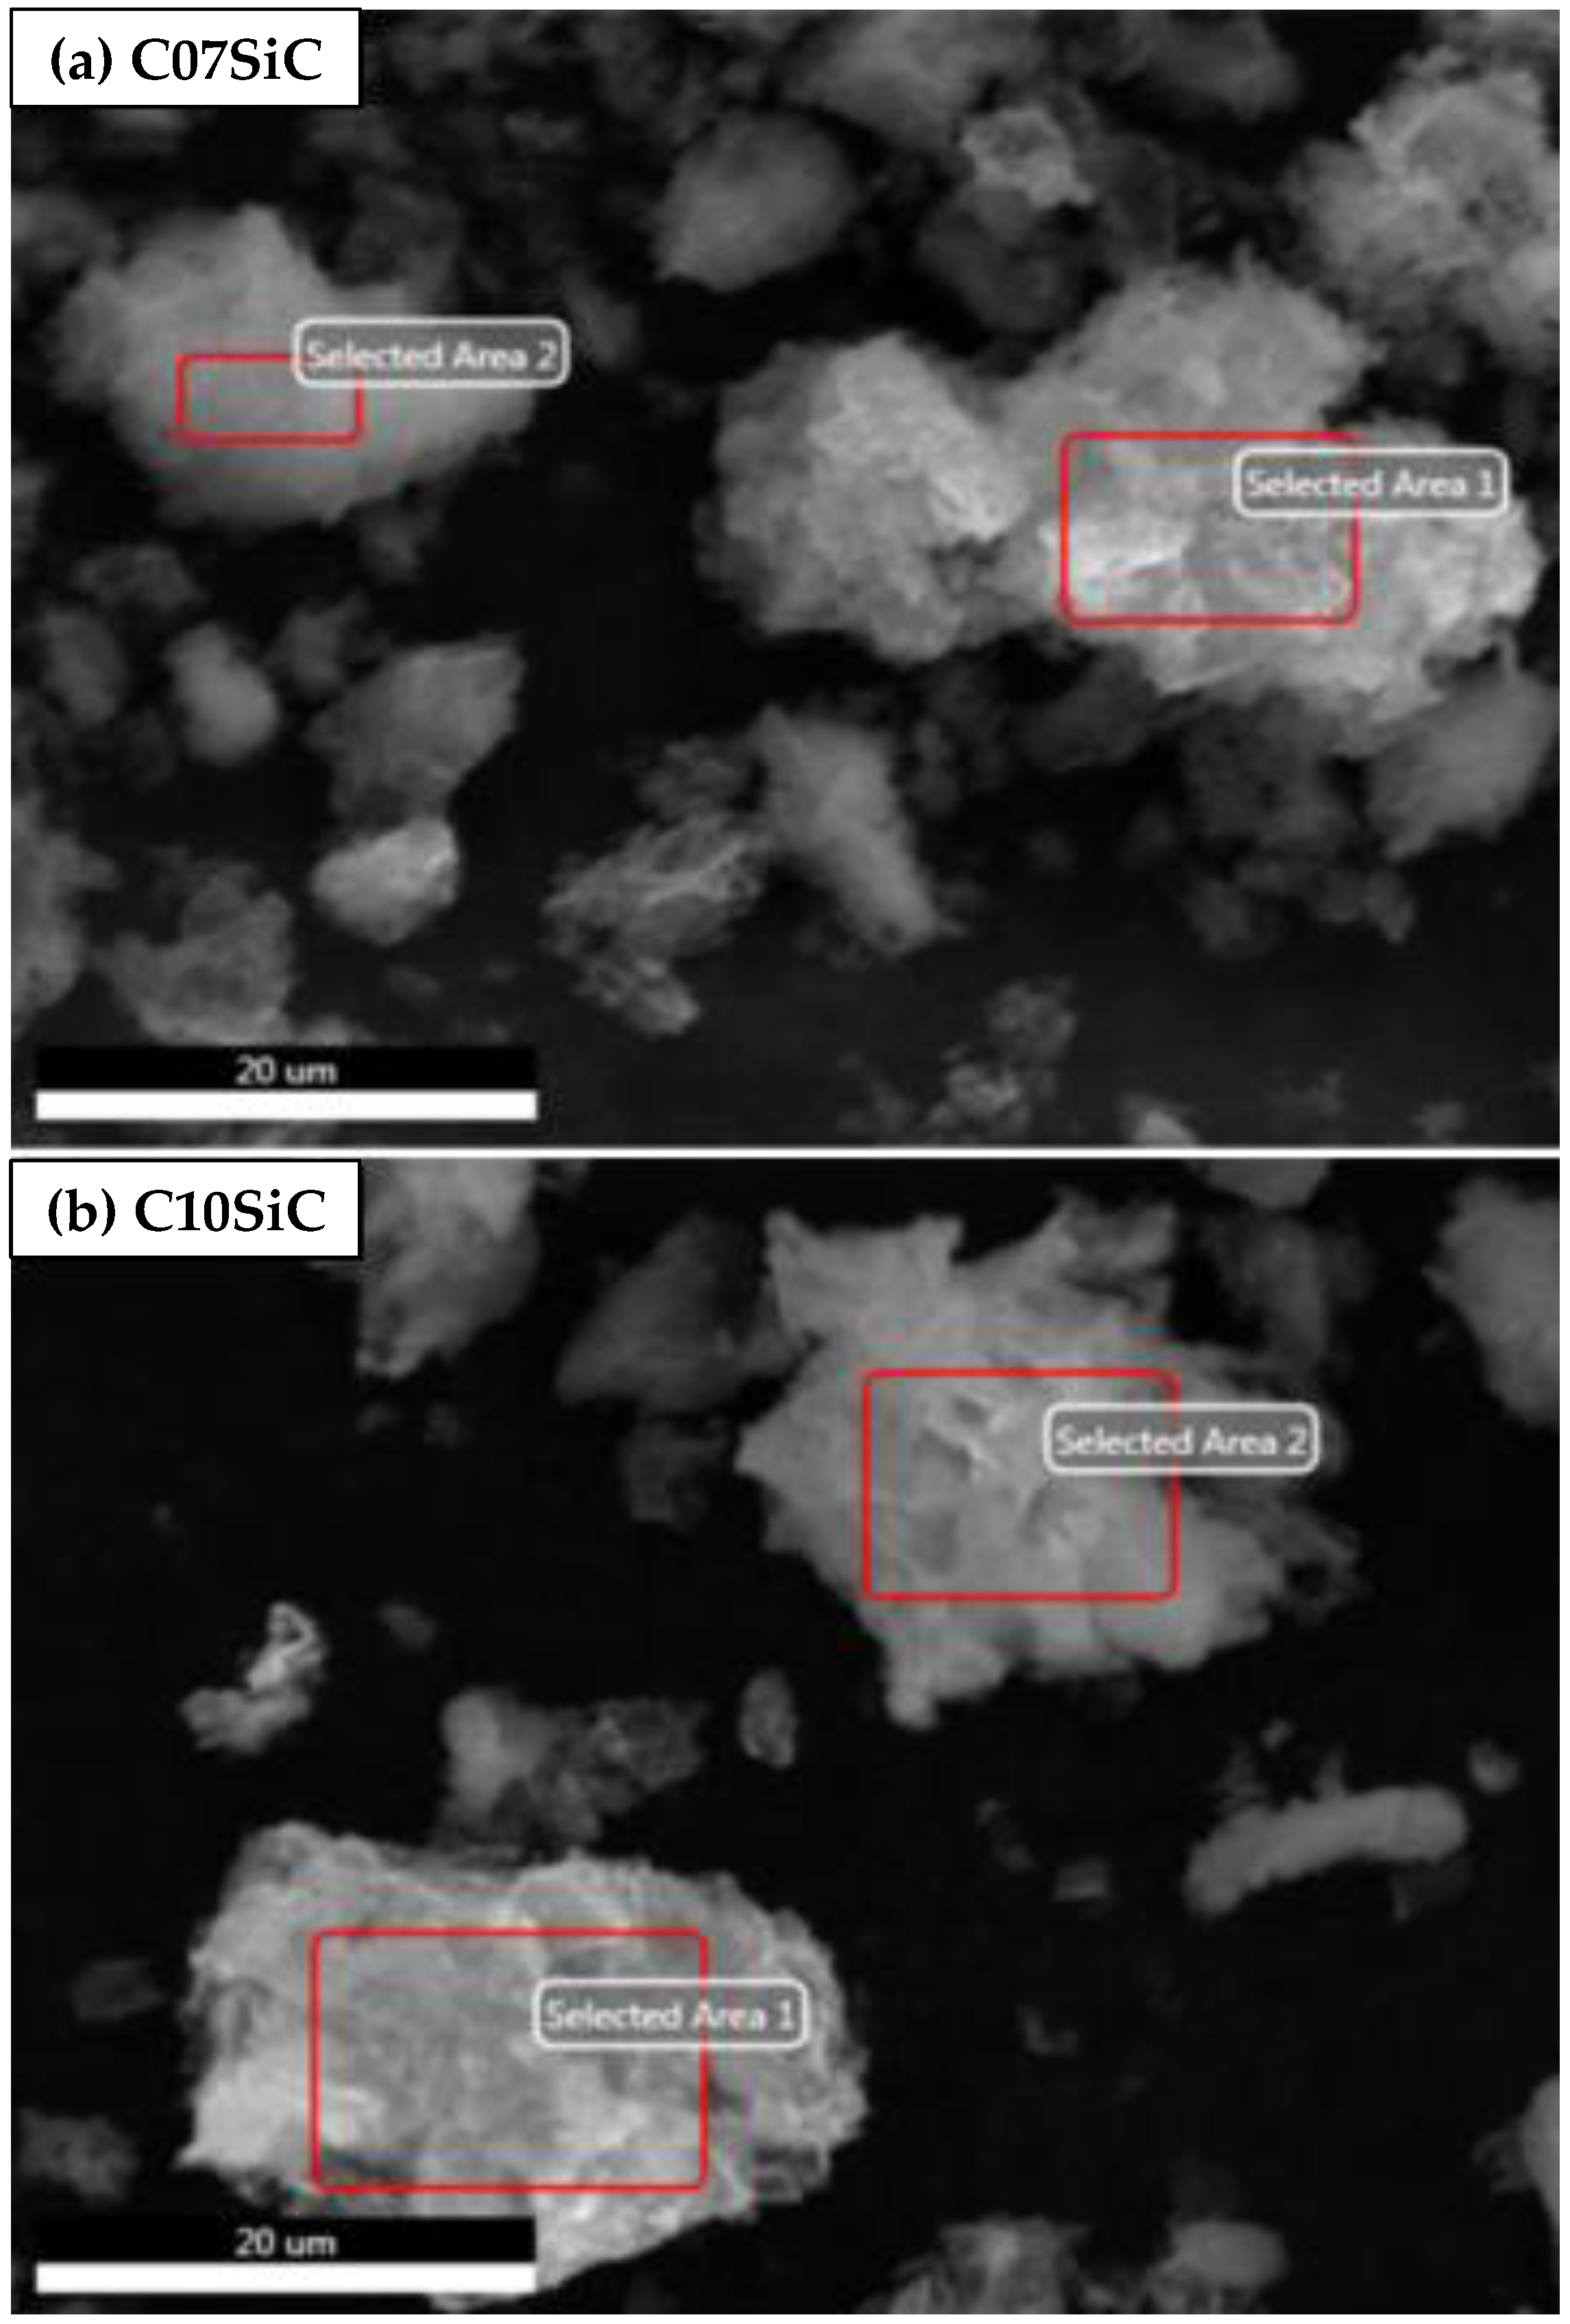
Figure 10 is a photogram of the SEM characterization of the calcined product after washing from C07SiC and C10SiC samples. Based on the SEM photogram, the calcined products showed various particle sizes. The size of the SiC particles formed appeared to depend on the particle size of the rice husk charcoal used. The photogram also shows that the particle structure resembles the structure of rice husk char. The elemental composition in the selected area according to the results of EDS (
Figure 11 and
Table 8) confirmed that apart from the presence of Si and C elements, Mg and O were also present as impurities.


