

Prediction of the Residual Creep Life of SA335-P22 Steel Main Steam Pipelines
Abstract
:1. Introduction
2. Physical and Chemical Tests and Result Analysis
2.1. Chemical Composition Analysis
2.2. Mechanical Properties
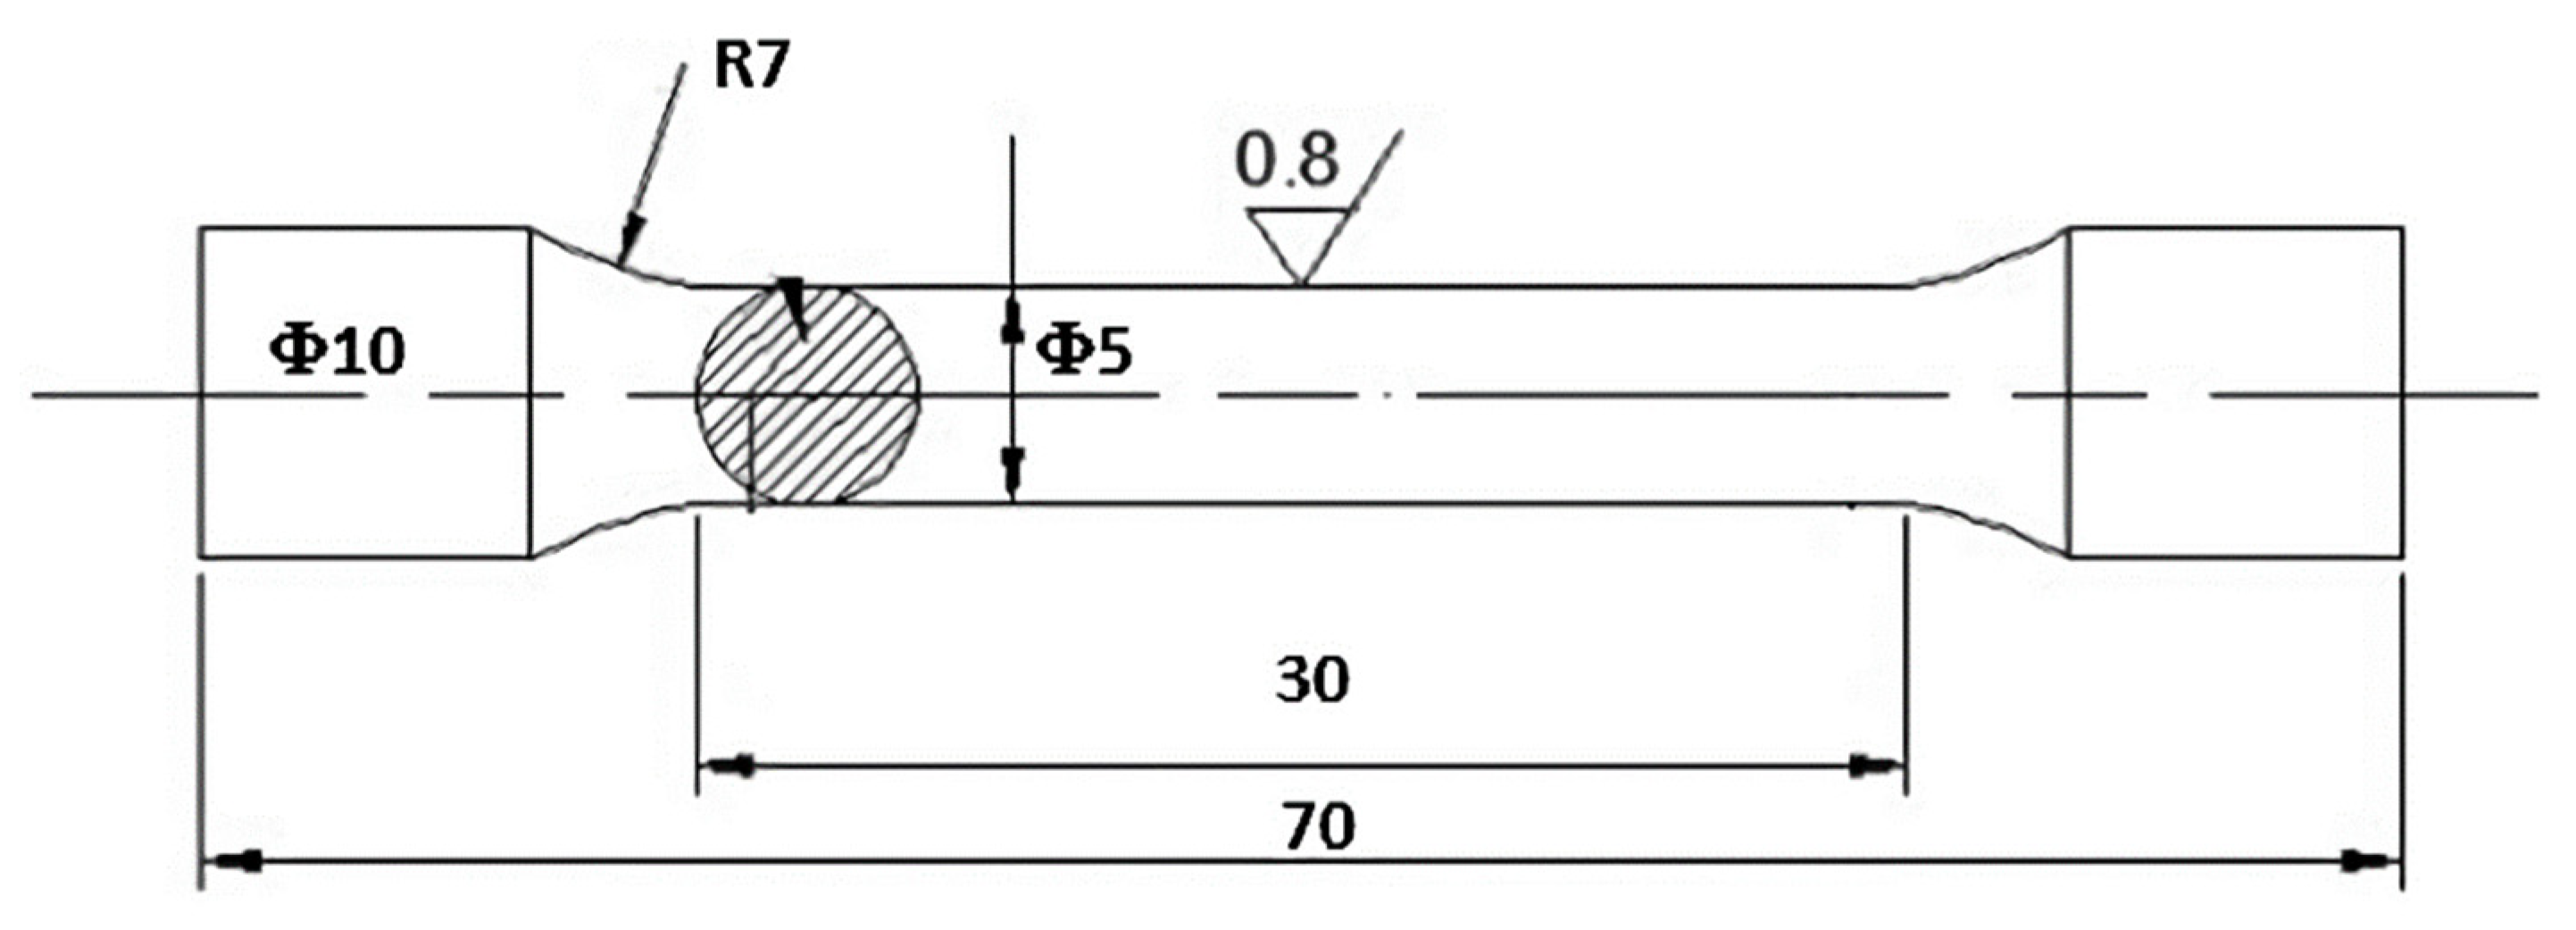
2.2.1. Tension Test at Room Temperature
2.2.2. Tensile Test at High Temperatures
2.3. Metallographic Test and Result Analysis
2.3.1. Metallographic Tests
2.3.2. Analysis of the Results
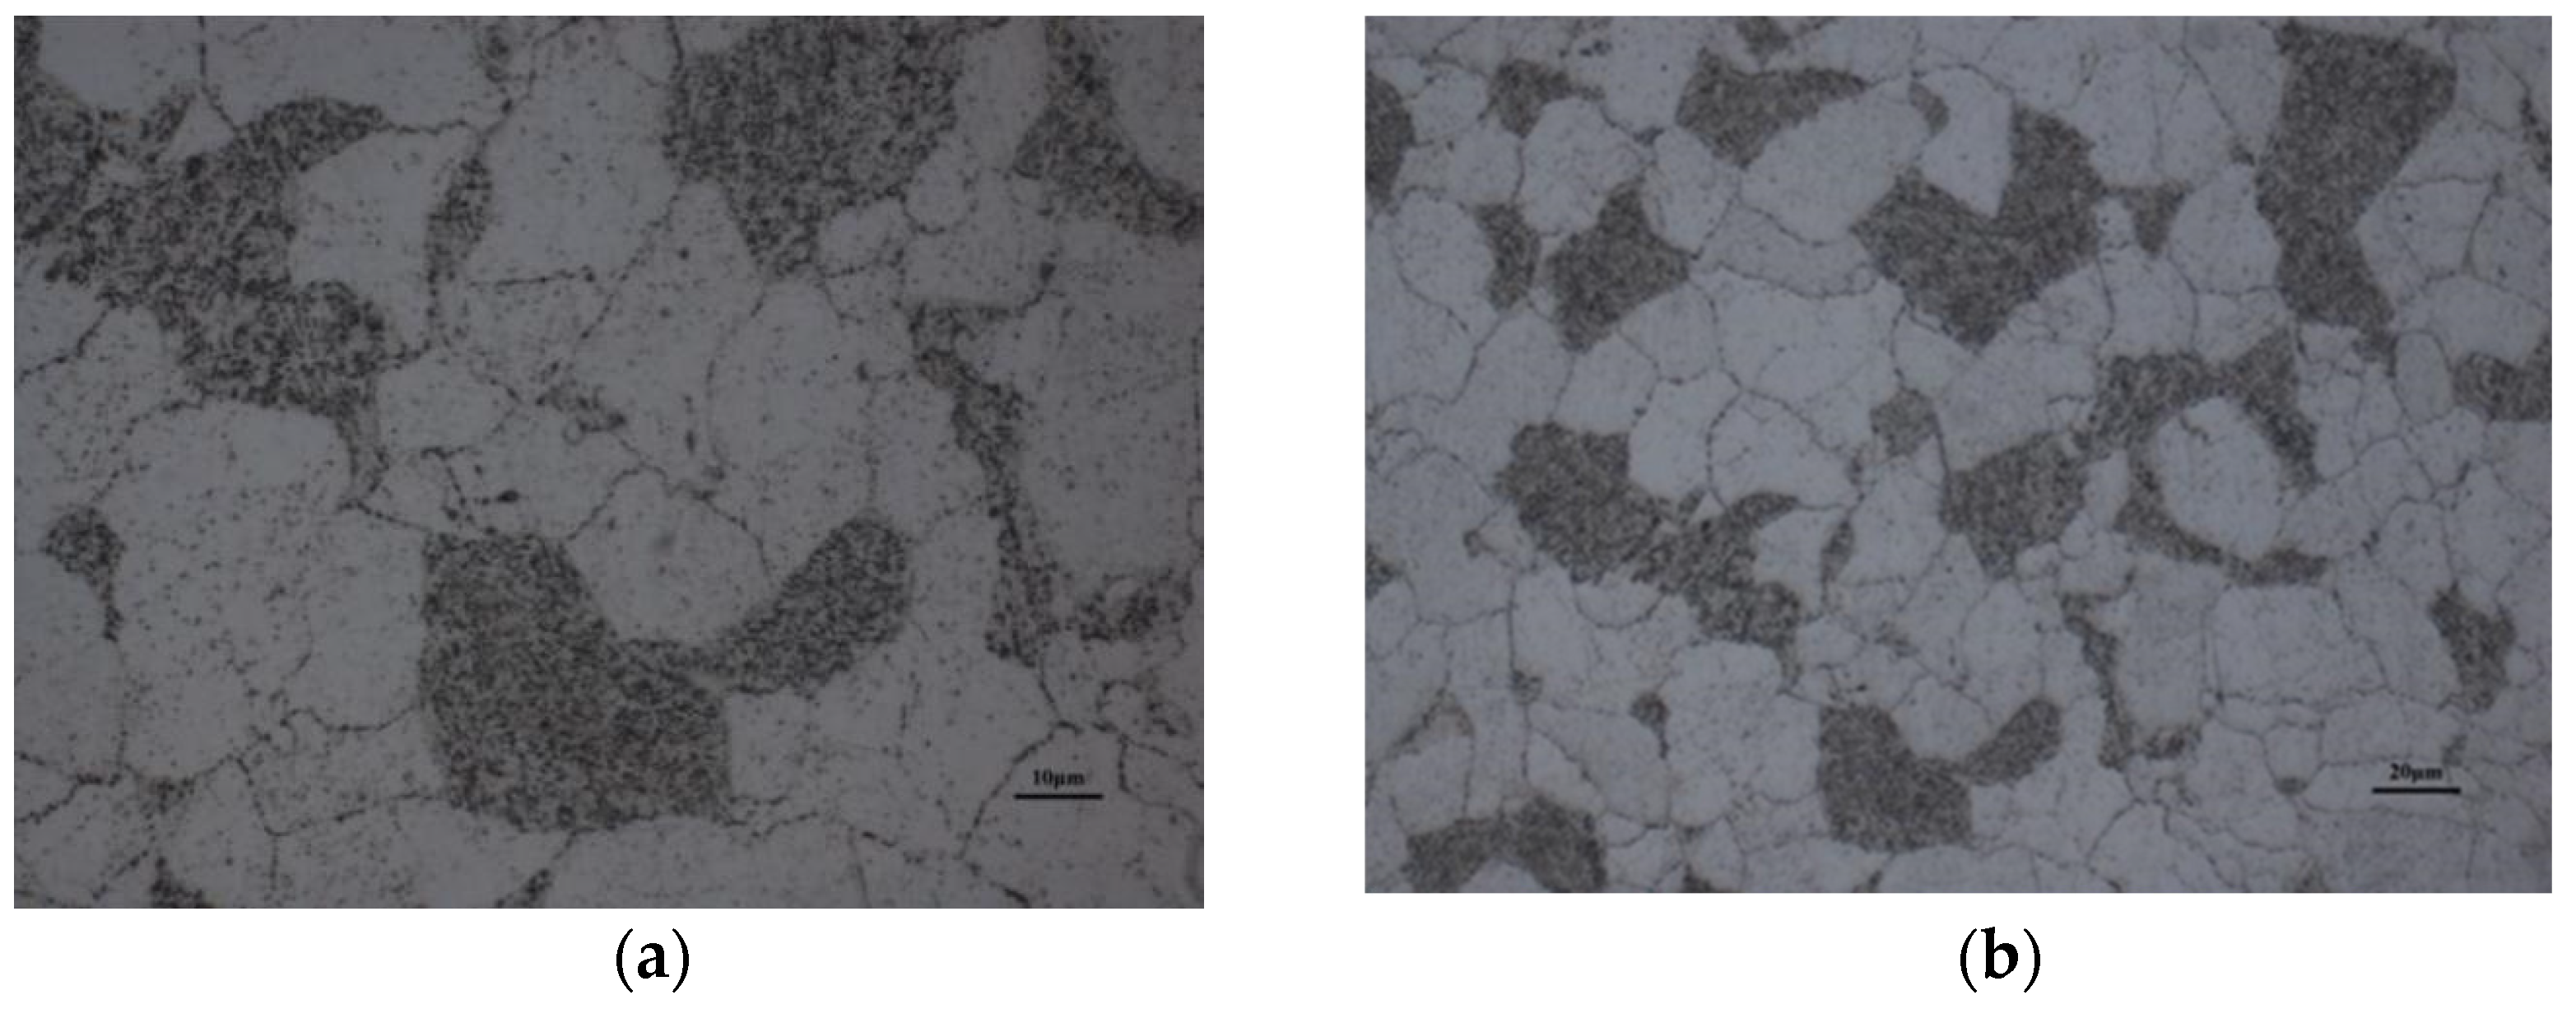
- (1)
- Metallographic analysis of the external surface
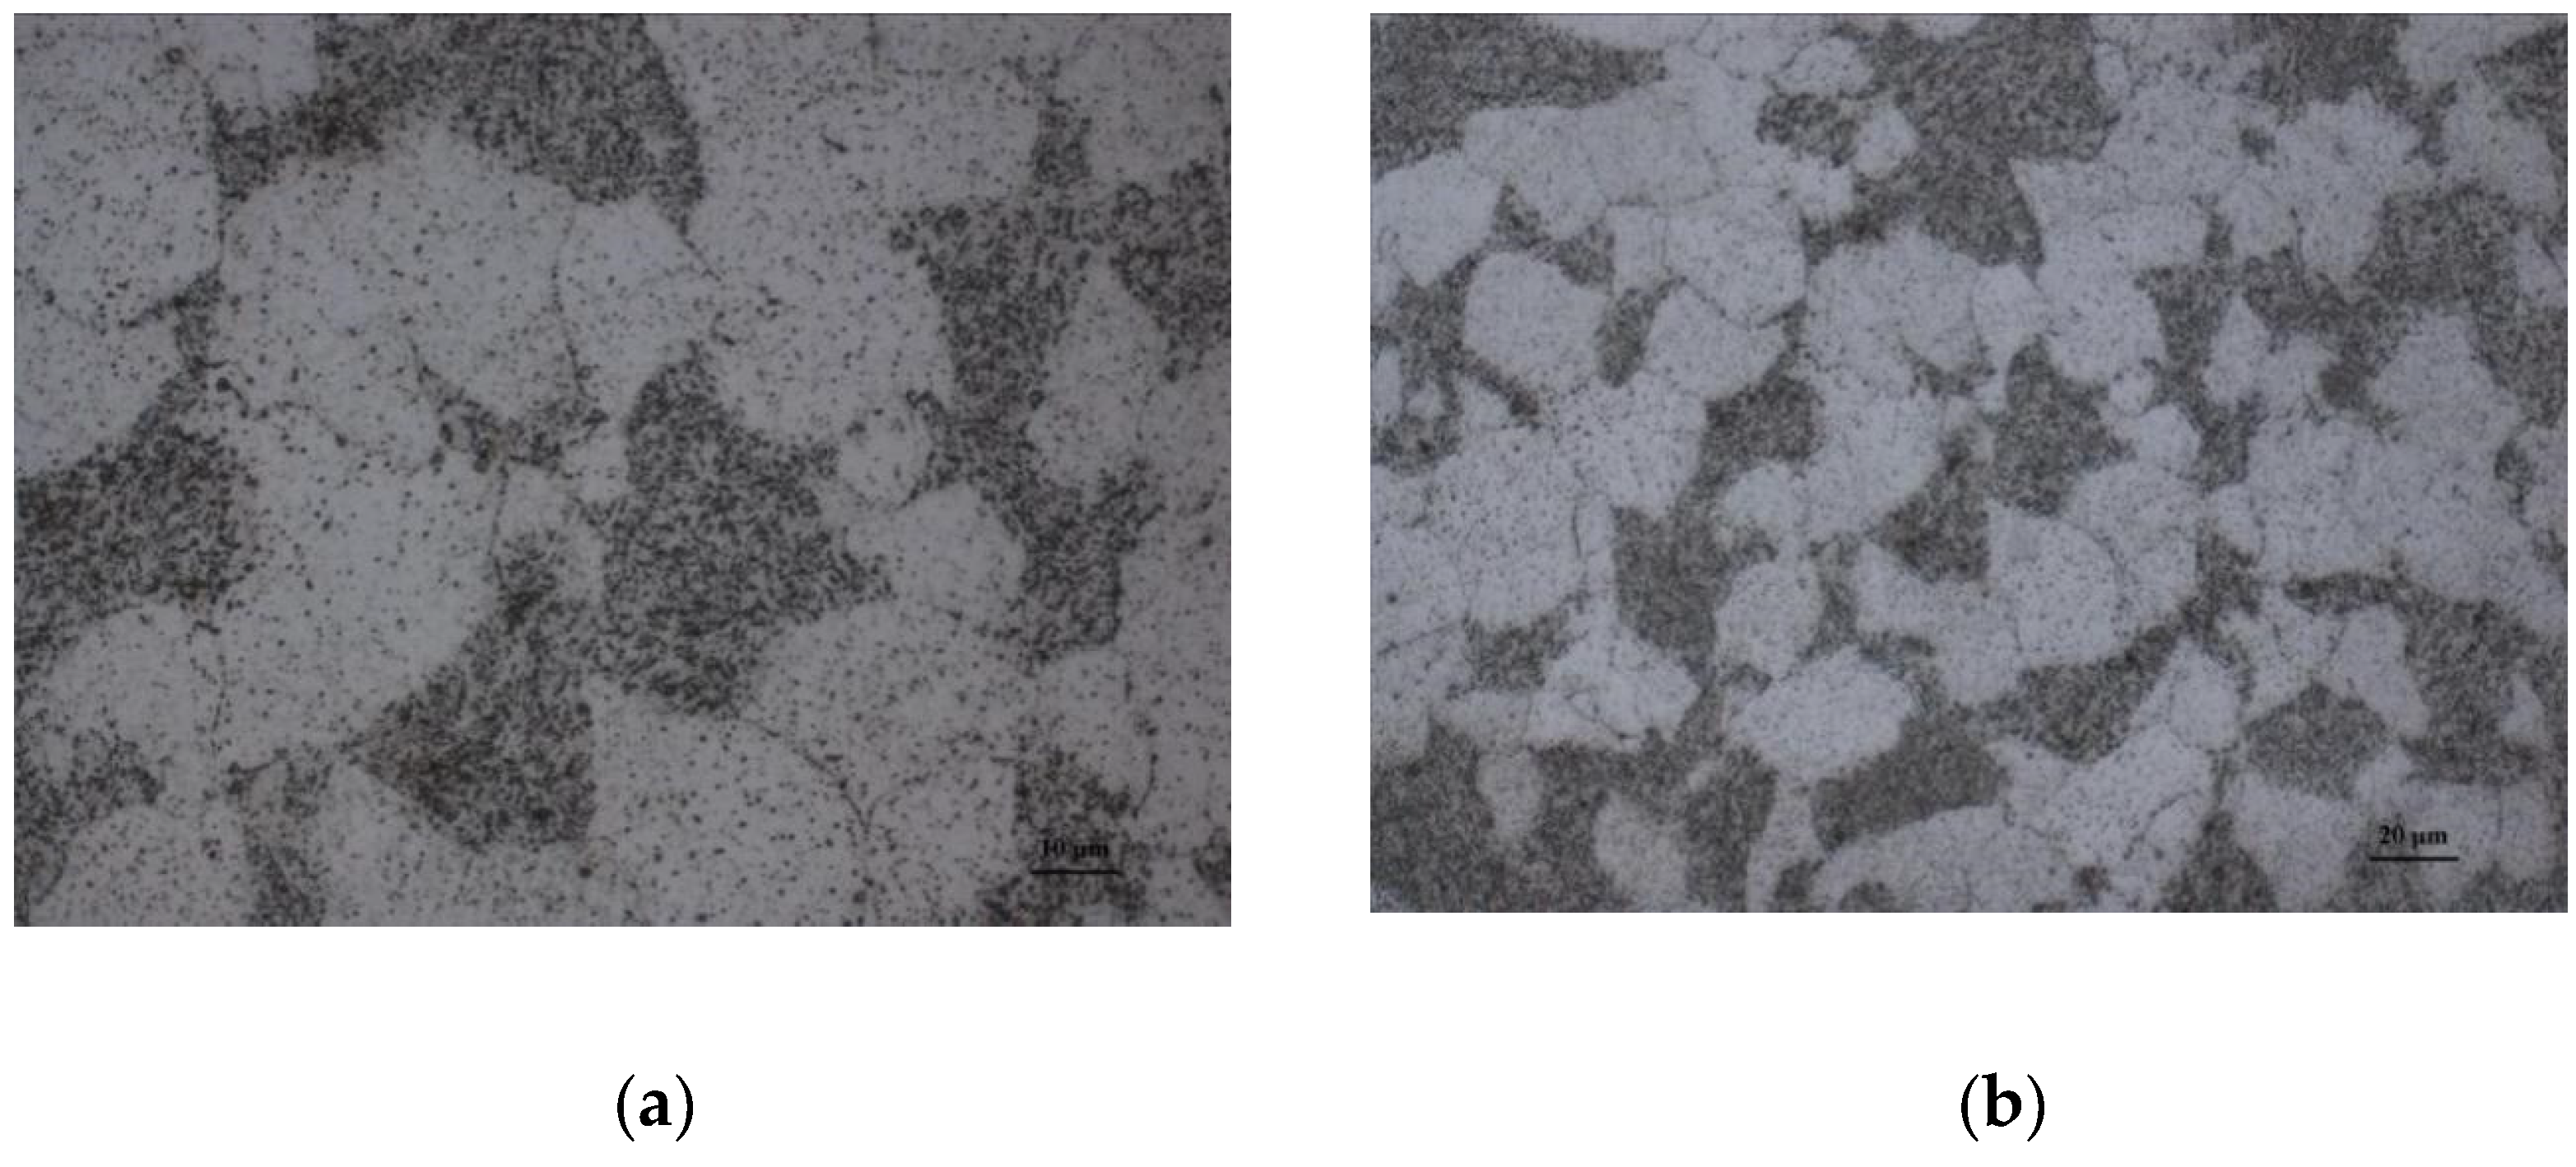
- (2)
- Metallographic analysis of the inner surface
3. Life Assessment
3.1. Creep Test
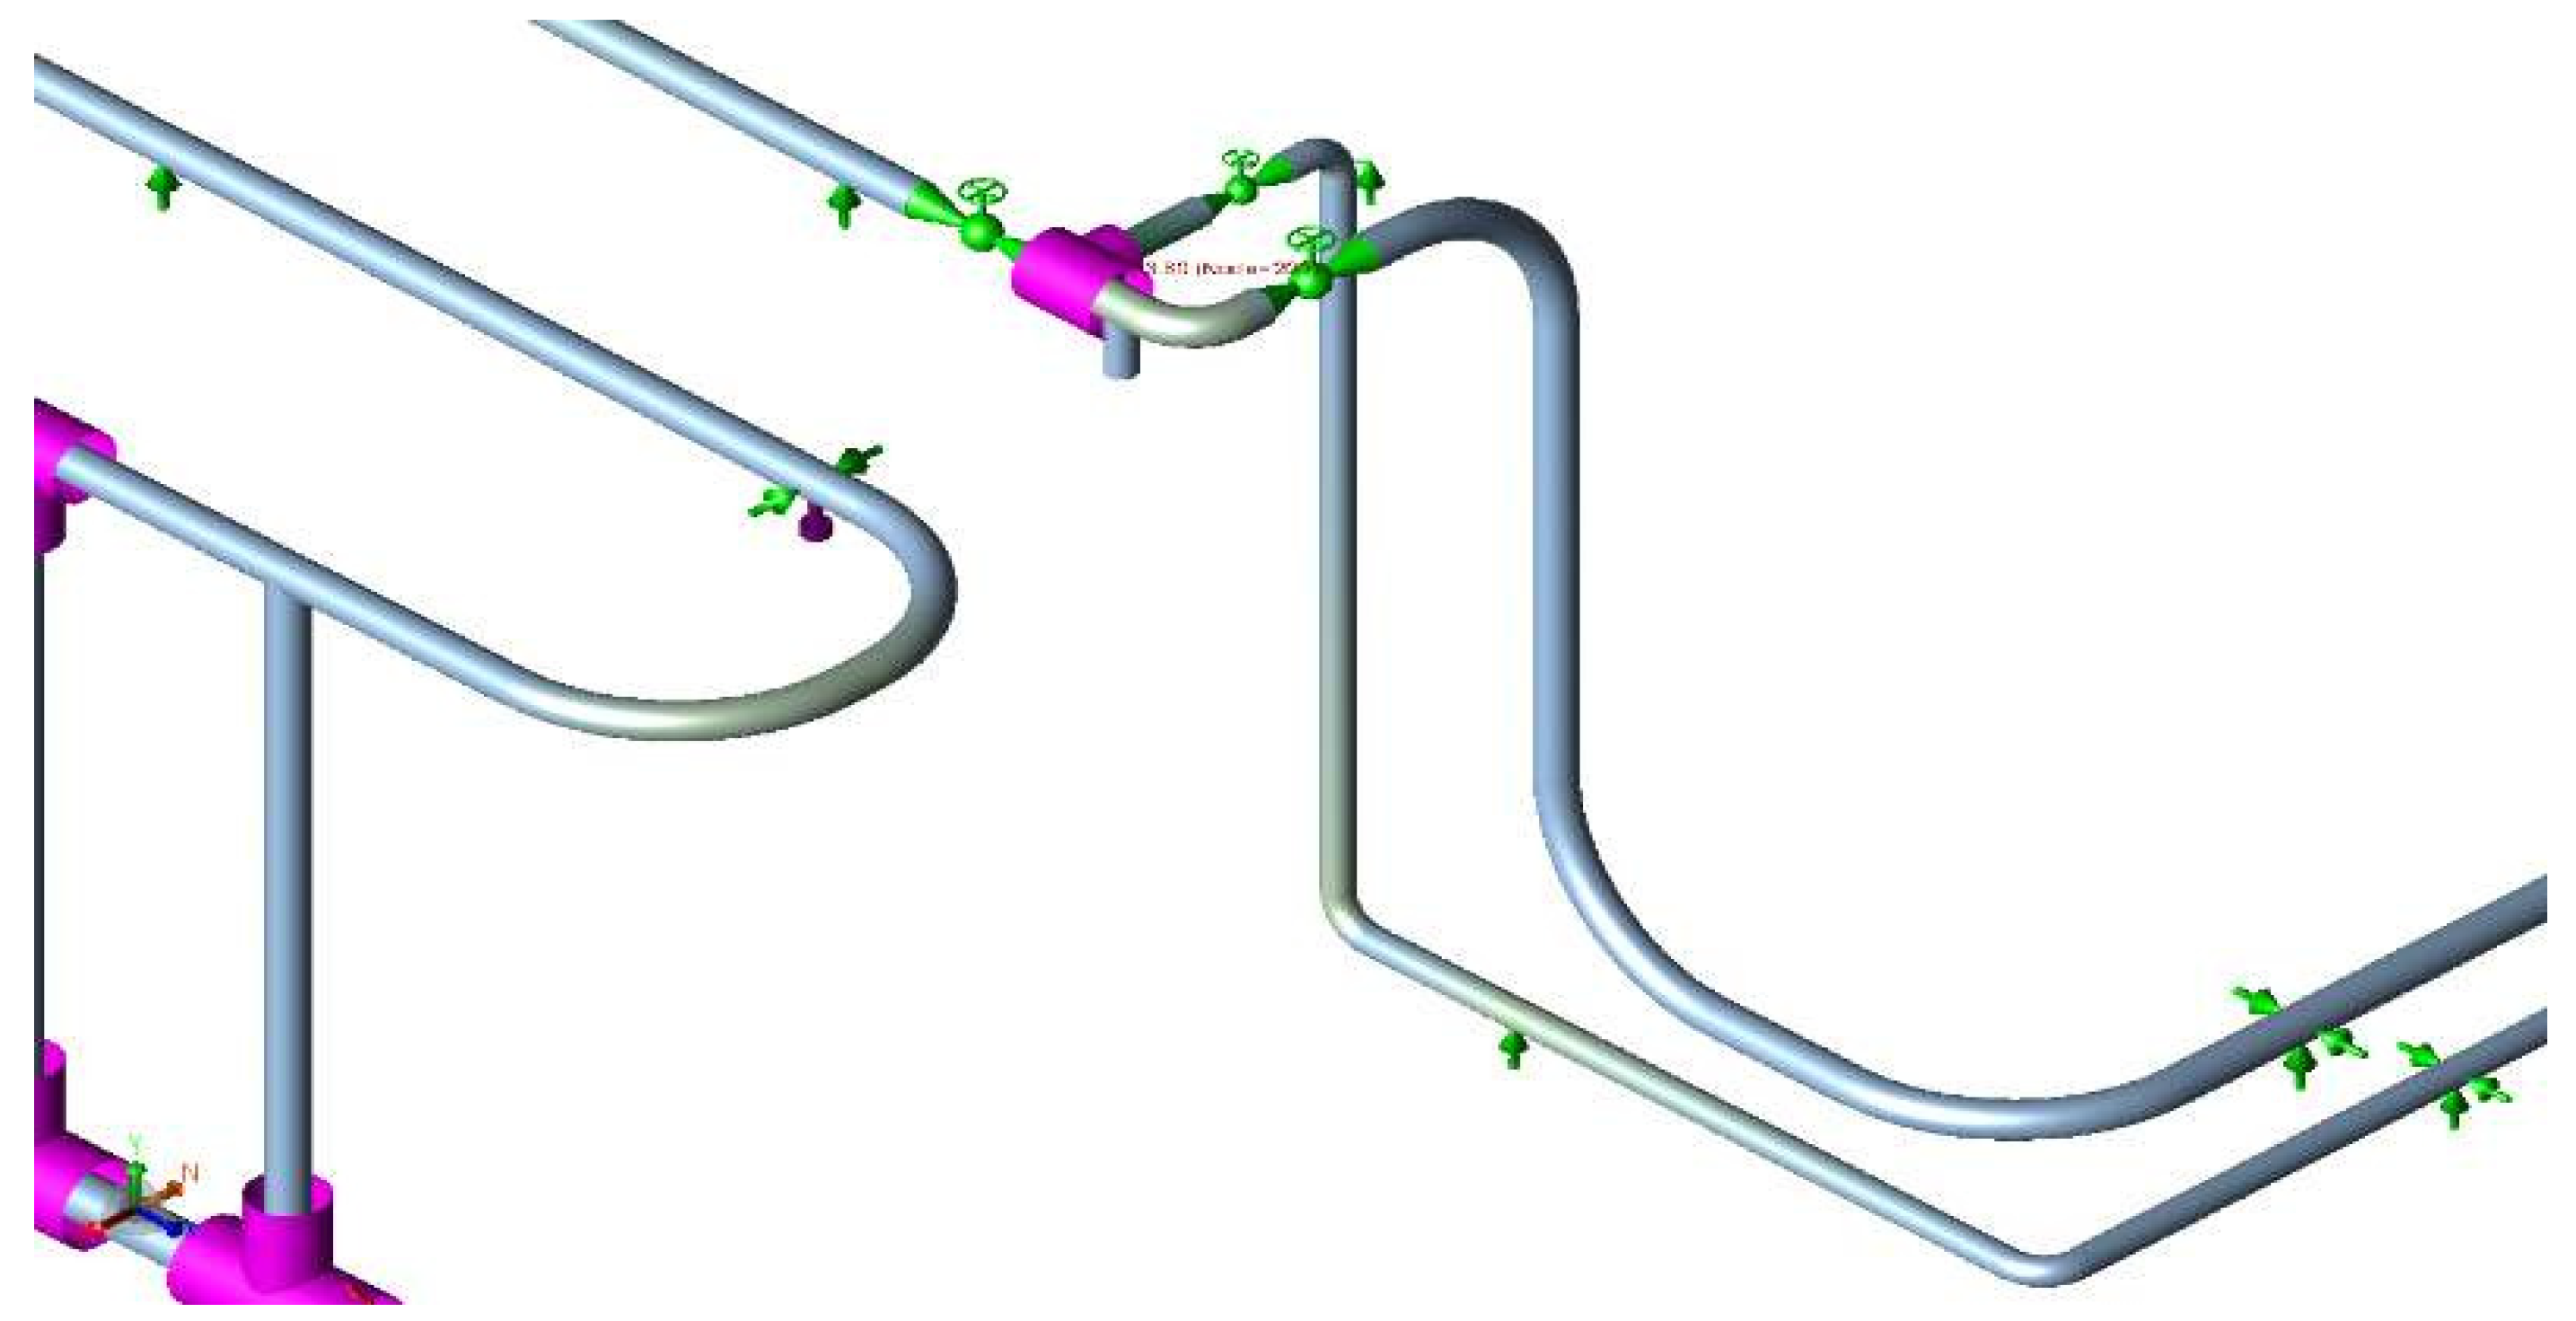
3.2. Calculation of the Working Stress
3.3. Assessment of Residual Life
3.3.1. Basic Principles of the θ Parameter Method
- (1)
- A group of samples was tested at different temperatures and stress levels, and the creep fracture curves of each sample at a certain temperature and stress were obtained.
- (2)
- We used Equation (1) to fit the creep fracture curve of each sample under different temperatures and stresses, and solved (i = 1, 2, 3) in the creep equation of each sample:
- (1)
- We used from Equation (1), the temperature of the test (T), and the stress (σ) to obtain , , , and in Equation (2). On this foundation, the relationship between , T, and σ was established.
- (2)
- We used , , , and achieved in Equation (2) to allocate under the condition of specified temperature and pressure. Then, was substituted into Equation (1) to obtain the material creep curve.
- (3)
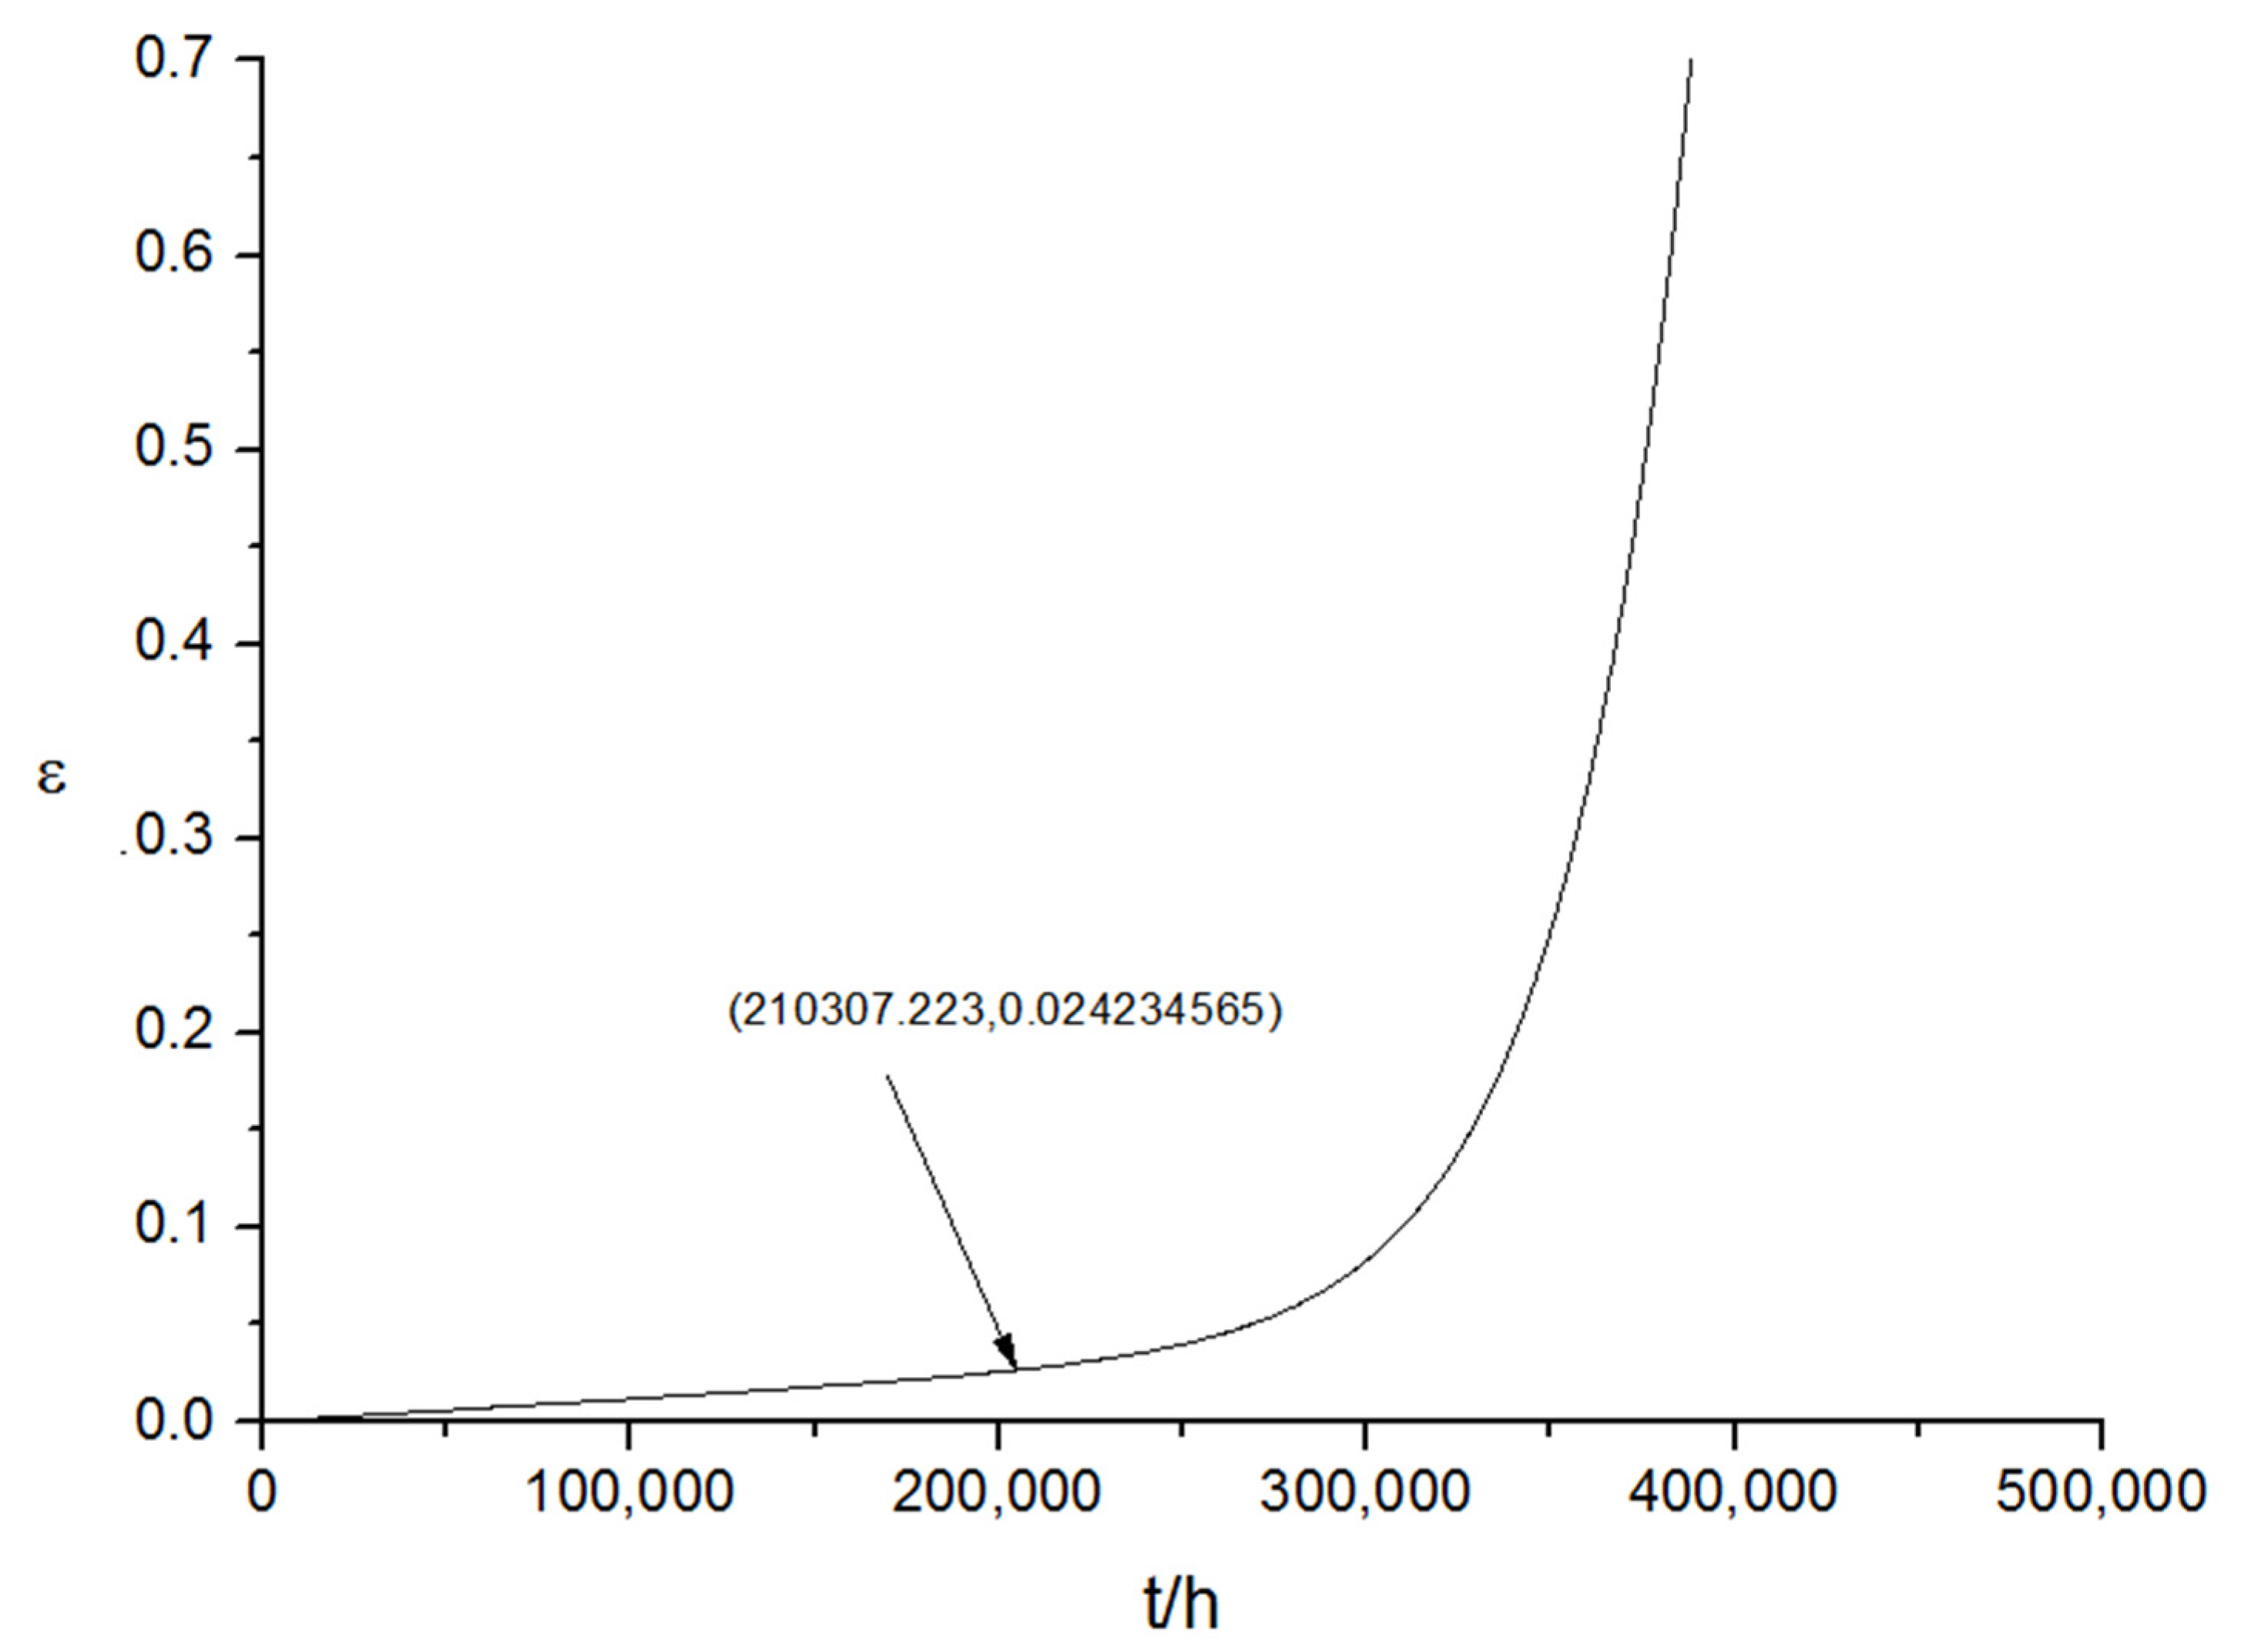
- As stipulated in DL/T 940-2005 (technical guidelines for life assessment of steam pipes in thermal power plants) [24], the creep life can be determined by determining the creep strain at the transition tangent point from the second stage (approximate straight line) to the third stage as the failure point on the creep deformation curve of materials under the service conditions of steam pipes.
3.3.2. Extrapolation Analysis
4. Conclusions
- (a)
- During actual operation, the operating parameters of the P22 steam pipeline should be strictly monitored to allow it to operate under allowable operating conditions, to avoid safety events.
- (b)
- In the next periodic inspection and shutdown maintenance, the P22 steam pipeline should be the main inspection object to receive attention. If necessary, the service cycle of the P22 steam pipeline could be shortened.
Author Contributions
Funding
Institutional Review Board Statement
Informed Consent Statement
Data Availability Statement
Acknowledgments
Conflicts of Interest
References
- Zhao, X.; Ma, X.; Chen, B.; Shang, Y.; Song, M. Challenges toward carbon neutrality in China: Strategies and countermeasures. Resources. Conserv. Recycl. 2022, 176, 105959. [Google Scholar] [CrossRef]
- Tozer, L.; Klenk, N. Discourses of carbon neutrality and imaginaries of urban futures. Energy Res. Soc. Sci. 2018, 35, 174–181. [Google Scholar] [CrossRef]
- Subramanian, C. Dissimilar metal weld failure of steam piping in a hydrogen unit of petroleum refinery. Eng. Fail. Anal. 2021, 134, 105983. [Google Scholar] [CrossRef]
- Kim, D.J.; Kim, S.W.; Lee, J.Y.; Kim, K.M.; Oh, S.B.; Lee, G.G.; Kim, J.; Hwang, S.-S.; Choi, M.J.; Lim, Y.S.; et al. Flow-accelerated corrosion assessment for SA106 and SA335 pipes with elbows and welds. Nucl. Eng. Technol. 2021, 53, 3003–3011. [Google Scholar] [CrossRef]
- Hayakawa, H.; Nakashima, S.; Kusumoto, J.; Kanaya, A.; Nakashima, H. Creep deformation characterization of heat resistant steel by stress change test. Int. J. Press. Vessel. Pip. 2009, 86, 556–562. [Google Scholar] [CrossRef]
- Frank, A.; Pinter, G.; Lang, R.W. Prediction of the remaining lifetime of polyethylene pipes after up to 30 years in use. Polym. Test. 2009, 28, 737–745. [Google Scholar] [CrossRef]
- Frank, A.; Arbeiter, F.J.; Berger, I.J.; Hutař, P.; Náhlík, L.; Pinter, G. Fracture mechanics lifetime prediction of polyethylene pipes. J. Pipeline Syst. Eng. Pract. 2019, 10, 04018030. [Google Scholar] [CrossRef]
- Maleki, S.; Zhang, Y.; Nikbin, K. Prediction of creep crack growth properties of P91 parent and welded steel using remaining failure strain criteria. Eng. Fract. Mech. 2010, 77, 3035–3042. [Google Scholar] [CrossRef]
- Holmström, S.; Pohja, R.; Nurmela, A.; Moilanen, P.; Auerkari, P. Creep and creep-fatigue behaviour of 316 stainless steel. Procedia Eng. 2013, 55, 160–164. [Google Scholar] [CrossRef] [Green Version]
- Viswanathan, R. Life management of high-temperature piping and tubing in fossil power plants. J. Press. Vessel Technol. 2000, 122, 305–316. [Google Scholar] [CrossRef]
- Kumar, M.; Singh, I.V.; Mishra, B.K.; Ahmad, S.; Rao, A.V.; Kumar, V. A modified theta projection model for creep behavior of metals and alloys. J. Mater. Eng. Perform. 2016, 25, 3985–3992. [Google Scholar] [CrossRef]
- Holmström, S. Engineering Tools for Robust Creep Modelling. Ph.D. Thesis, VTT, Espoo, Finland, 2010. [Google Scholar]
- Hamata, N.L.M.; Shibli, I.A. Creep crack growth of seam-welded P22 and P91 pipes with artificial defects. Part II. Data analysis. Int. J. Press. Vessel. Pip. 2001, 78, 827–835. [Google Scholar] [CrossRef]
- Demofonti, G.; Mannucci, G.; Hillenbrand, H.G.; Harris, D. Evaluation of the suitability of X100 steel pipes for high pressure gas transportation pipelines by full scale tests. In Proceedings of the International Pipeline Conference, Calgary, AL, Canada, 4–8 October 2004; Volume 41766, pp. 1685–1692. [Google Scholar]
- Rathod, D.W.; Pandey, S.; Singh, P.K.; Prasad, R. Mechanical properties variations and comparative analysis of dissimilar metal pipe welds in pressure vessel system of nuclear plants. J. Press. Vessel. Technol. 2016, 138, 011403. [Google Scholar] [CrossRef]
- Vilkys, T.; Rudzinskas, V.; Prentkovskis, O.; Tretjakovas, J.; Višniakov, N.; Maruschak, P. Evaluation of failure pressure for gas pipelines with combined defects. Metals 2018, 8, 346. [Google Scholar] [CrossRef] [Green Version]
- Liu, S.; Yang, C.; Peng, Z. An approach to 570 °C/105 h creep rupture strength prediction and safety assessment of Grade 91 components with reduced hardness after service exposures at 530–610 °C. Int. J. Press. Vessel. Pip. 2020, 182, 104073. [Google Scholar] [CrossRef]
- Yin, Z.; Cai, H.; Liu, H.G. Performance of heat-resistant steel P 92 used in 1000 MW ultra supercritical unit after long-term service at high temperature. Trans. Mater. Heat Treat. 2012, 33, 105–110. [Google Scholar]
- GB/T 228.1-2010; Metallic Materials-Tensile Testing-Part 1: Method of Test at Room Temperature. Standardization Administration of the People’s Republic of China (SAC): Beijing, China, 2010.
- Mehari, Z.A.; Han, J. Effects of the partial heating roll forming method on springback of high strength steel. Int. J. Adv. Manuf. Technol. 2022, 119, 5195–5210. [Google Scholar] [CrossRef]
- Yang, C.; Li, X.; Wang, Y.; Sun, M. Failure Analysis and Protection of Oxygen Corrosion of Reheater Tube in a Power plant. In E3S Web of Conferences; EDP Sciences: Les Ulis, France, 2021; p. 261. [Google Scholar]
- Yu, H.; Peng, X.; Lian, Z.; Zhang, Q.; Shi, T.; Wang, J.; Zhao, Z. Experimental and numerical simulation of fatigue corrosion behavior of V150 high-strength drill pipe in air and H2S-dilling mud environment. J. Nat. Gas Sci. Eng. 2022, 98, 104392. [Google Scholar] [CrossRef]
- Zhang, B.; Zhang, S.; Du, H.; Yao, Z.; Kong, X.S.; Tao, X. Dependence of Creep Properties on Aging Treatment in Al-Cu-Mg Alloy. Adv. Eng. Mater. 2022, 24, 2101293. [Google Scholar] [CrossRef]
- Zhu, B.; Xia, X.; Xiao, J.; Tang, M.; Ma, Q.; Shi, J.; Xue, F.; Zhang, G. Research on the residual life of the superheating system steam header for an extended service 220 MW ultra-high voltage thermal power unit. Int. J. Press. Vessel. Pip. 2021, 194, 104513. [Google Scholar] [CrossRef]


| Material | Medium | Dimension/Thickness (mm) | Design Temperature (°C) | Design Pressure (MPa) | Working Temperature (°C) | Working Pressure (MPa) | Spheroidization Degree |
|---|---|---|---|---|---|---|---|
| P22 | Steam | 219/20.6 | 524 | 8.5 | 510 | 7.0 | Moderate |
| Material | C | Mn | p | S | Si | Cr | Mo | Other |
|---|---|---|---|---|---|---|---|---|
| ASME SA335-P22 | 0.05–0.15 | 0.30–0.60 | ≤0.025 | ≤0.025 | ≤0.50 | 1.90–2.60 | 0.87–1.13 | - |
| Result | 0.10 | 0.43 | 0.014 | 0.005 | 0.24 | 2.09 | 0.94 | |
| Conclusion | Meets ASME SA335 requirements for new P22 pipes | |||||||
| Sampling Position | Sample | Rp0.2/MPa | Rm/MPa | A/% |
|---|---|---|---|---|
| SA335/SA335M | - | ≥205 | ≥415 | ≥22 (portrait) |
| Near the outer wall | 1 | 322 | 538 | 31.5 |
| 2 | 326 | 542 | 28.5 | |
| 3 | 316 | 532 | 26.5 | |
| Near the middle wall | 1 | 344 | 553 | 35.0 |
| 2 | 350 | 559 | 30.5 | |
| 3 | 330 | 534 | 29.5 | |
| Near the inner wall | 1 | 334 | 536 | 25.0 |
| 2 | 349 | 557 | 26.5 | |
| 3 | 351 | 557 | 29.5 | |
| Conclusion | Room temperature longitudinal tension meets the requirements of ASME SA335/SA335M for the P22 new pipe | |||
| Sampling Position | Sample | Rp0.2/MPa | Rm/MPa | A/% |
|---|---|---|---|---|
| SA335/SA335M | - | ≥205 | ≥415 | ≥14 (portrait) |
| Near the middle wall | 1 | 343 | 553 | 25.5 |
| 2 | 346 | 554 | 28.0 | |
| 3 | 346 | 556 | 28.0 | |
| Near the inner wall | 1 | 345 | 544 | 26.0 |
| 2 | 348 | 546 | 26.0 | |
| 3 | 331 | 541 | 29.0 | |
| Conclusion | Room temperature longitudinal tension meets the requirements of ASME SA335/SA335M for P22 new pipe | |||
| Sampling Position | Sample | Rp0.2/MPa | Rm/MPa | A/% |
|---|---|---|---|---|
| 12Cr2MoG (500 °C) | - | ≥173 | - | - |
| 12Cr2MoG (550 °C) | - | ≥159 | - | - |
| 10CrMo910 (500 °C) | - | ≥180 | - | - |
| Near the outer wall | 1 | 286 | 442 | 21.5 |
| 2 | 268 | 427 | 22.5 | |
| 3 | 276 | 432 | 24.0 | |
| Near the middle wall | 1 | 301 | 451 | 23.0 |
| 2 | 278 | 437 | 21.5 | |
| 3 | 286 | 443 | 23.0 | |
| Near the inner wall | 1 | 281 | 440 | - |
| 2 | 301 | 452 | 23.0 | |
| 3 | 305 | 457 | 22.0 | |
| Conclusion | The yield strength at 540 °C was higher than 12Cr2MOG at 500 °C in GB/T5310-2017 and 10CrMo910 at 500°C in DL/T999-2006. | |||
| Sampling Position | Sample | Rp0.2/MPa | Rm/MPa | A/% |
|---|---|---|---|---|
| 12Cr2MoG (500 °C) | - | ≥173 | - | - |
| 12Cr2MoG (550 °C) | - | ≥159 | - | - |
| 10CrMo910 (500 °C) | - | ≥180 | - | - |
| Near the outer wall | 1 | 276 | 431 | 24.0 |
| 2 | 278 | 424 | 22.5 | |
| Near the middle wall | 1 | 281 | 441 | 22.0 |
| 2 | 275 | 433 | 24.5 | |
| 3 | 279 | 421 | 24.0 | |
| Near the inner wall | 1 | 272 | 435 | 23.0 |
| 2 | 264 | 413 | 25.5 | |
| 3 | 290 | 447 | 20.5 | |
| Conclusion | The yield strength at 580 °C was higher than 12Cr2MOG at 500 °C in GB/T5310-2017 and 10CrMo910 at 500°C in DL/T999-2006. | |||
| Temperature (°C) | Stress (MPa) | θ1 | θ2 | θ3 |
|---|---|---|---|---|
| 540 | 218 | 1.3458 × 10⁻³ | 9.9846 × 10⁻⁶ | 0.0733 |
| 208 | 3.1977 × 10⁻⁴ | 2.3522 × 10⁻⁶ | 0.02743 | |
| 198 | 2.3577 × 10⁻⁴ | 1.3341 × 10⁻⁶ | 0.0201 | |
| 178 | 3.4904 × 10⁻⁵ | 9.5889 × 10⁻⁶ | 0.0035 | |
| 168 | 4.7631 × 10⁻⁵ | 2.5901 × 10⁻⁶ | 0.0041 | |
| 580 | 170 | 7.6631 × 10⁻⁴ | 3.4986 × 10⁻⁶ | 0.0596 |
| 160 | 2.8969 × 10⁻⁴ | 2.0798 × 10⁻⁶ | 0.0294 | |
| 150 | 1.6092 × 10⁻⁴ | 4.2577 × 10⁻⁷ | 0.0186 | |
| 140 | 1.0447 × 10⁻⁴ | 2.1470 × 10⁻⁶ | 0.0103 |
| θi | a | b | c | d |
|---|---|---|---|---|
| θ1 | −74.6496 | 0.2222 | 0.07810 | −0.0002 |
| θ2 | 55.1724 | −0.3212 | −0.0739 | 0.0004 |
| θ3 | −61.4492 | 0.1739 | 0.0656 | −0.0002 |
Disclaimer/Publisher’s Note: The statements, opinions and data contained in all publications are solely those of the individual author(s) and contributor(s) and not of MDPI and/or the editor(s). MDPI and/or the editor(s) disclaim responsibility for any injury to people or property resulting from any ideas, methods, instructions or products referred to in the content. |
© 2023 by the authors. Licensee MDPI, Basel, Switzerland. This article is an open access article distributed under the terms and conditions of the Creative Commons Attribution (CC BY) license (https://creativecommons.org/licenses/by/4.0/).
Share and Cite
Wang, Z.; Ye, Y.; Dong, L.; Wang, B. Prediction of the Residual Creep Life of SA335-P22 Steel Main Steam Pipelines. Processes 2023, 11, 162. https://doi.org/10.3390/pr11010162
Wang Z, Ye Y, Dong L, Wang B. Prediction of the Residual Creep Life of SA335-P22 Steel Main Steam Pipelines. Processes. 2023; 11(1):162. https://doi.org/10.3390/pr11010162
Chicago/Turabian StyleWang, Zhicheng, Youjun Ye, Lingjian Dong, and Bumei Wang. 2023. "Prediction of the Residual Creep Life of SA335-P22 Steel Main Steam Pipelines" Processes 11, no. 1: 162. https://doi.org/10.3390/pr11010162