Article

Performance Analysis of a Hybrid of Solar Photovoltaic, Genset, and Hydro of a Rural-Based Power Mini-Grid: Case Study of Kisiizi Hydro Power Mini-Grid, Uganda

by
Richard Cartland
1,*,
Al-Mas Sendegeya
2 and
Jean de Dieu Khan Hakizimana
1
1
African Center of Excellence in Energy for Sustainable Development, College of Science and Technology, University of Rwanda, Kigali 0101, Rwanda
2
Department of Electrical and Electronics Engineering, Faculty of Engineering and Technology, Kyambogo University, Kampala 10308, Uganda
*
Author to whom correspondence should be addressed.
Processes 2023, 11(1), 175; https://doi.org/10.3390/pr11010175
Submission received: 3 November 2022 / Revised: 30 November 2022 / Accepted: 4 December 2022 / Published: 5 January 2023

Abstract

:
The power sector in Uganda has increased steadily, focusing majorly on rural electrification to increase the proportion of the rural population accessing electricity using grid extension and isolated mini-grid approaches. Hydropower mini-grids implemented in rural communities have issues regarding system failures leading to shutdowns and load shedding. A study on an existing isolated hydropower mini-grid was made to find the possible causes. A review of published articles and reports, and an analysis of enrollment patterns, energy sales, and load demand was carried out. A field survey with a guided questionnaire to collect information about real energy demand data was carried out. The performance of the system was accomplished through simulation using HOMER pro × 64 software. The findings from the study show a reduction in customer enrollment, a reduction in energy sales, and a reasonable number of system shutdowns. Hybridization of the existing hydropower was modeled with different options. The hybrid system proposed indicates that, when implemented, it would reduce fuel consumption from 222 to 23.2 L/day and emissions from 82.5 to 8.3 kg/year on average and increases system reliability. Simulated values of NPC, LCOE, and operating costs are appreciable. Despite mini-grid shortfalls, there is notably improved livelihood due to improved social and economic services.

1. Introduction

The Power sector development in Uganda has been on a steady increase since the year 2000, with major emphasis put on rural electrification to increase the percentage of the population accessing electricity using various approaches, including grid extension and isolated mini-grids [1]. Energy use is very critical to the welfare of households and economic development [2]. It is obvious that in all developing countries like Uganda, access to modern energy services contributes positively to household welfare and has a relationship with population growth [3,4].
In terms of hydro resources, Uganda covers an area of 241,038 km2; a third of this is freshwater bodies and wetlands, which are sufficient enough to act as sources of energy in the form of Hydropower [1].
Regarding challenges faced with urbanization, such as inadequate housing, poor air pollution, and limited access to basic services and infrastructure, paves the way for a shift to rural communities to minimize rural-urban migration (RUB) by extending similar services of the urban setting to rural communities [5,6,7].
Rural community (RC) is defined based on social and economic aspects the world over. In Canada, RC is defined as sparsely populated lands outside urban areas [8]. In Japan, RC is defined based on population density [8]. In Uganda, a rural community is defined as an area with an open swath of land with few homes located very far from their businesses. It can also be an area with small population density figures whose major activity is Agriculture. The population shows homogeneity of language, culture, and customs; people live in close contact with nature, have slower means of communication, population less qualified with a few technical skills, homesteads characterized by poor planning and maintenance practices, and are largely dependent on vegetation cover for house construction and source of energy [9,10,11,12].
The use of hybrid systems increases the reliability of the optimal utilization of resources. Hybrid installation centered on the use of gensets and Renewable Energy generations common in various countries such as Pakistan, Fiji, Morocco, Oman, Malaysia, and Nigeria [13,14,15,16,17,18,19] have proved to be efficient, reliable, and sustainable [20]. There are various isolated mini-grids in Uganda, namely Kisiizi hydropower station, Kanyegaramire, and Kyamugarura solar PV stations, Kasese Cobalt, WENRECO, Kitobo Island, Buggala Island, to mention but a few. Most of them use renewable resources like solar PV and hydropower [19,20]. These systems have performance challenges such as system breakdown, load shedding, and insufficient power supply. Records have scanty information about their performance in terms of economic and technical issues and hence need to be investigated. This research explores the cause of mini-grid system failures, mini-grid performance challenges alongside customer energy demands, cause of continuous load shedding, cause of discomfort among mini-grid power users, and the possibility of hybridizing a mini-grid for better performance options [21].
Using a hybrid system (HS) and conventional Diesel Generator minimizes fuel consumption, reduces gas emissions, and later alone improves the standard of living of the rural communities served by the mini-grid [22]. Joseph et al. suggested that it is very hard to satisfy human power demands throughout the year using hydropower sources alone. It needs a backup of additional renewable sources to form an HS to remedy rural electrification problems [19].

1.1. Literature Review

Many scholars have attempted to look at Hydropower development in rural areas of African countries and beyond. The study made by researchers in Uganda [23] found that hydropower is dominant and the rate of development is low. They used a systematic review approach and concluded that Uganda lacks the human ability that possesses satisfactory skills to handle hydropower projects. However, they never went into detail to relate human needs with hydropower development. Moreover, Ref. [24] indicates that Uganda is endowed with scattered energy-generating sources that make the generation of power expensive and looks at the possibility of reducing cost by increasing substations and never considered the possibility of hybridization.
A study made by Kimera et al. on Wanale village in Eastern Uganda [25] shows that villages need mini-grid electricity to get out of poverty. They used a combination of Renewable energy technologies and conventional energy Generators to achieve synergies in operation hence providing reliable services in remote areas. They considered component sizing but did not carry out the real energy demand of the village. The study made on Kalangala Island on Lake Victoria in Uganda analyzed energy cost and cost comparison of a thermal generator and proposed a hybrid system of solar and wind. They used daily load profile data given by a power analyzer and did not look at the growing energy demand of the island [26]. The study made by Shaffic et al. proposed a design of a hybrid of solar and wind systems to irrigate an acre of a banana plantation in Kalangala District and minded much on wind and solar parameters for irrigation only [27]. The study made by [28] in Uganda examines the variability of peak electricity demand before and after the application of power factor improvement schemes. They found that there is a visible decrease in electricity at the times of use and progress in consumption of electricity during the non-peak time. They did not look at the effect of the incentive regulation on electricity peak demand and the extent of policy implications as a result of implementing power factor correction schemes.
A study made in Ntoroko village, Uganda, emphasizes that the use of a hybrid storage system is economical in remote areas where electrical demand is low and uses a method of varying PV sizes, batteries, inverters, and batteries to come up with different designs of hybrid systems [29].
In Uganda, electricity suffers from long-standing supply-side constraints that result in suppressed demand and outages. The researchers compared peak demand with the recent trends in hydropower development. They used descriptive data analysis and polynomial functions to come up with the conclusion that peak demand does not stagnate but only shifts to the nonpeak time-of-use zone. The study did not use rural-based methods to analyze the peak demand of a rural community [30].
A study on mini-grids in India shows that despite the allocation of substantial funds to rural electrification, rural electrification still lags behind other services in India [31]. Moreover, energy demand is on the increase in an effort to accelerate industrial activities to boost economies [32].
The study made by [33] puts more emphasis on having related energy models to enhance rural electrification in developing countries and mind much on the benefits brought about by having renewable energies as a means of lowering carbon emissions and having low-carbon societies. At the same time, a study made by [34] proposes a shift to hydrogen technologies that contribute to the economy’s significant energy needs and also reduce urban pollution emissions.
The study [35] also shows that mini-grid development is a better way to increase rural electrification. They compare Load following and cycle charging strategies with predictive strategies based on Linear programming to come up with mini-grid operating strategies.
A study made on Indonesia’s rural electrification strategies shows that isolated grids powered by independent renewable sources are considered paramount and sustainable solutions for rural electrification. The other non-renewable are characterized by high costs and high percentages of carbon gas emissions [36].
The study made on need assessment found that inputs and assumptions are required in business modeling and mini-grid design. The study goes ahead to realize that for energy need assessment of a rural community is by obtaining reliable input data for the mini-grid development [37] and that energy access and security are crucial factors for any country’s economic growth [38]. Relatedly, the study suggests that electricity usage plays a vital role in raising overall growth in the economy coupled with industrial sector attention initiatives [39]
The study made by [40] suggests that there are difficulties in the attempt to provide sustainable cellular mobile services in rural areas where there is no power supply.
Antonanzas et al., in their study, found out that solar PV mini-grids have lower carbon emissions than national grids in Sub-Saharan Africa and diesel Generators [41] and, therefore, needed to be given attention. However, the study made by Niwagira et al. stresses that small modular reactors are better than other competing energy sources because of their higher percentage contribution to Uganda’s future energy mix and, therefore, a remedy for environmental degradation [42].
There is also a relationship between livestock production and emissions. The study made by Macleod et al. found that a reduction in Green House Gas emissions increases livestock production [43]. Therefore, Uganda should adopt Renewable energy mini-grids because of sustainability, climate change mitigation, and a quick means of achieving Sustainable Development Goals by 2030 and realizing vision 2040 [25,44].
Uganda’s generation capacity has grown from 60 MW in 1954 to 400 MW in 2000 then to approximately 1237.49 MW as of October 2020 and rose to 1837.49 MW by mid-2021 [23].
A study which was conducted on hydropower development in Uganda from November 2009 to March 2011 agreed that;
  • There was a power shortage in Uganda;
  • There was a lack of power generation infrastructure of installed capacity;
  • There was a need to raise the hydropower supply capacity;
  • There was a need to export power as a result of implemented hydropower projects.
At the end of the study, the Government of Uganda realized an urgent need to develop more power plants and expansion of power grids as a prerequisite for continued economic growth and development [45], of which one of them is our case study.

1.2. Kisiizi Hydropower Mini-Grid (KHPMG) as a Case Study

KHPMG is located along River Rushoma on Kisiizi waterfalls in Kisiizi trading center, Nyarushaje Sub County, Rubabo County, Rukungiri District in the western province of Uganda. Its location coordinates are 00°59′44″ S 29°57′45″ E. Its generation capacity is 0.3 MW. KHPMG is owned and managed by a private missionary Hospital administered by the church of Uganda and majorly supported by a Non-Governmental Organization (NGO) in the United Kingdom called Friends of Kisiizi.
The 300 kW power plant was commissioned in 2008 to replace an old power plant that had a maximum capacity of 60 kW. It has a normal elevation of 1640 m, and its construction cost amounted to $700,000. It started as a hospital property to help in hospital operations, mainly lighting and in the theater. Later alone, after upgrading to 300 kW, they started serving the communities outside the hospital. Currently, it serves more than 600 external customers. It is mandated and licensed by the Government of Uganda to carry out Generation, Transmission, and Distribution activities. The power from the station is used for Domestic and Commercial activities of the Kisiizi hospital, and the surplus is sold to customers of the 33 villages of the Kisiizi sub-county, as shown in Table 1.
In these villages in Table 1, there are two categories of customers, namely;
  • Domestic customers. These are customers that use electricity for lighting, charging, ironing, playing music, and watching television;
  • Commercial customers. These are customers who use electricity for business purposes, and these include Institutions such as schools, churches, and health centers. Small businesses, which include welding, Bakery, Wood workshop, Grain millers, Coffee hullers, Fuel stations, and Saloons.
These categories of customers outside Kisiizi Hospital are generally termed “Outside customers”.
KHPMG has a turbine, a generator, a load tank, and a powerhouse. The turbine changes the kinetic energy of falling water pushing against turbine blades into Mechanical Energy. The Generator connected to the turbine by shafts and gears converts Mechanical Energy produced by the turbine into Electrical Energy. The load tank contains immersion elements. As the generator produces more than what is being used at the time, the excess goes to the load tank. When a sudden load is added on line, the excess power in the load tank immediately compensates for the sudden load as the generator prepares to open the gate valve to allow in more water hence maintaining the frequency. If the sudden load is put in the absence of a load tank, the generator over speeds and causes a change in frequency that results in a possible shutdown of the facility.

2. Materials and Methods

The research methodology of this manuscript is divided into sections as discussed below:

2.1. Introduction and Literature Review

The study involved desk study methods which included a review of written literature and authentic published articles.

2.2. Case Study Area

The study involved community member interaction methods and a prepared questionnaire to guide the flow of interviews in determining the number and rating of appliances used by customers to help in the sizing process. The site data was obtained from station officers, operators, and concerned record attendants.
The study concerns of the case study area and their corresponding methodologies are shown in Table 2 below.
The researchers explored the possibility of hybridizing the existing system and proposed a solar Photo Voltaic (PV) system with storage to supplement the existing diesel generator and hydropower and named it option 1 (solar PV +Genset + hydropower). Solar PV storage includes solar batteries, solar panels, inverters, and controllers. Using the data collected, the sizing process was made. Moreover, the research carried out by Mateusz Andrychowicz about optimization of distribution systems by using Renewable Energy Sources (RES), which included Wind, Photovoltaic, and Biomass, found that the combination of allocation and sizing RES, energy storage, and grid development using mixed integer linear programming, reduce power losses in a distribution system was analyzed to help in further methodology of this research [46].

2.3. Design of a Hybrid of Solar PV, Diesel Generator, and Hydropower

A global horizontal solar irradiance of the area (Figure 1) was obtained from HOMER pro × 64, and the average daily energy demand was obtained from sized data and fed into HOMER pro × 64 software.

2.4. Software Used: The Software Used Is HOMER pro × 64

The HOMER pro × 64 Micropower Optimization Model is a computer model created by the U.S. National Renewable Energy Laboratory (NREL) to make it easier to compare power generation technologies for a wide range of applications and design micropower systems [47]. HOMER pro × 64 helps the modeler comprehend and quantify the effects of uncertainty or changes in the inputs and allows them to compare various design options based on their technical and economic advantages [48].
HOMER Technical modeling
PV array: HOMER pro × 64 calculates the output of the array and Renewable fraction as follows [49,50]:
P pv   =   F p v × Y p v I t I s
RF pv   =   E p v E a n . t  
Hydro: HOMER pro × 64 calculates the output of a hydro turbine and net head as follows:
P hd   =   η t × ρ w × h n e t × φ t 1 1000
h net   =   h 1 f h
Generator: HOMER pro × 64 calculates the fuel consumption as follows:
Fc =   F o × Y g + P g × F 1
Battery Bank: HOMER pro × 64 calculates the life of a battery bank as follows:
L b   =   M i n ( N b × ϕ l t × L b f φ t h r )  

2.5. Homer Economic Modeling

HOMER pro × 64 assumes that all prices escalate at the same rate over the project lifetime and tries in its simulations to minimize the Net Present Cost (NPC) to represent the life cycle cost of a project [30,43,44]. In economic analysis, HOMER pro × 64 calculates NPC, Salvage value, Capital Recovery Factor (CRF), and Levelized Cost of Energy (LCOE) using the following formulae [51]:
NPC =   C a n . t C R F i , R p r o j  
CRF =   i 1 + i N 1 + i N 1  
Sv =   C r e p   R r e m R c o m p
LCOE =   C a n . t E p r i m

3. Results

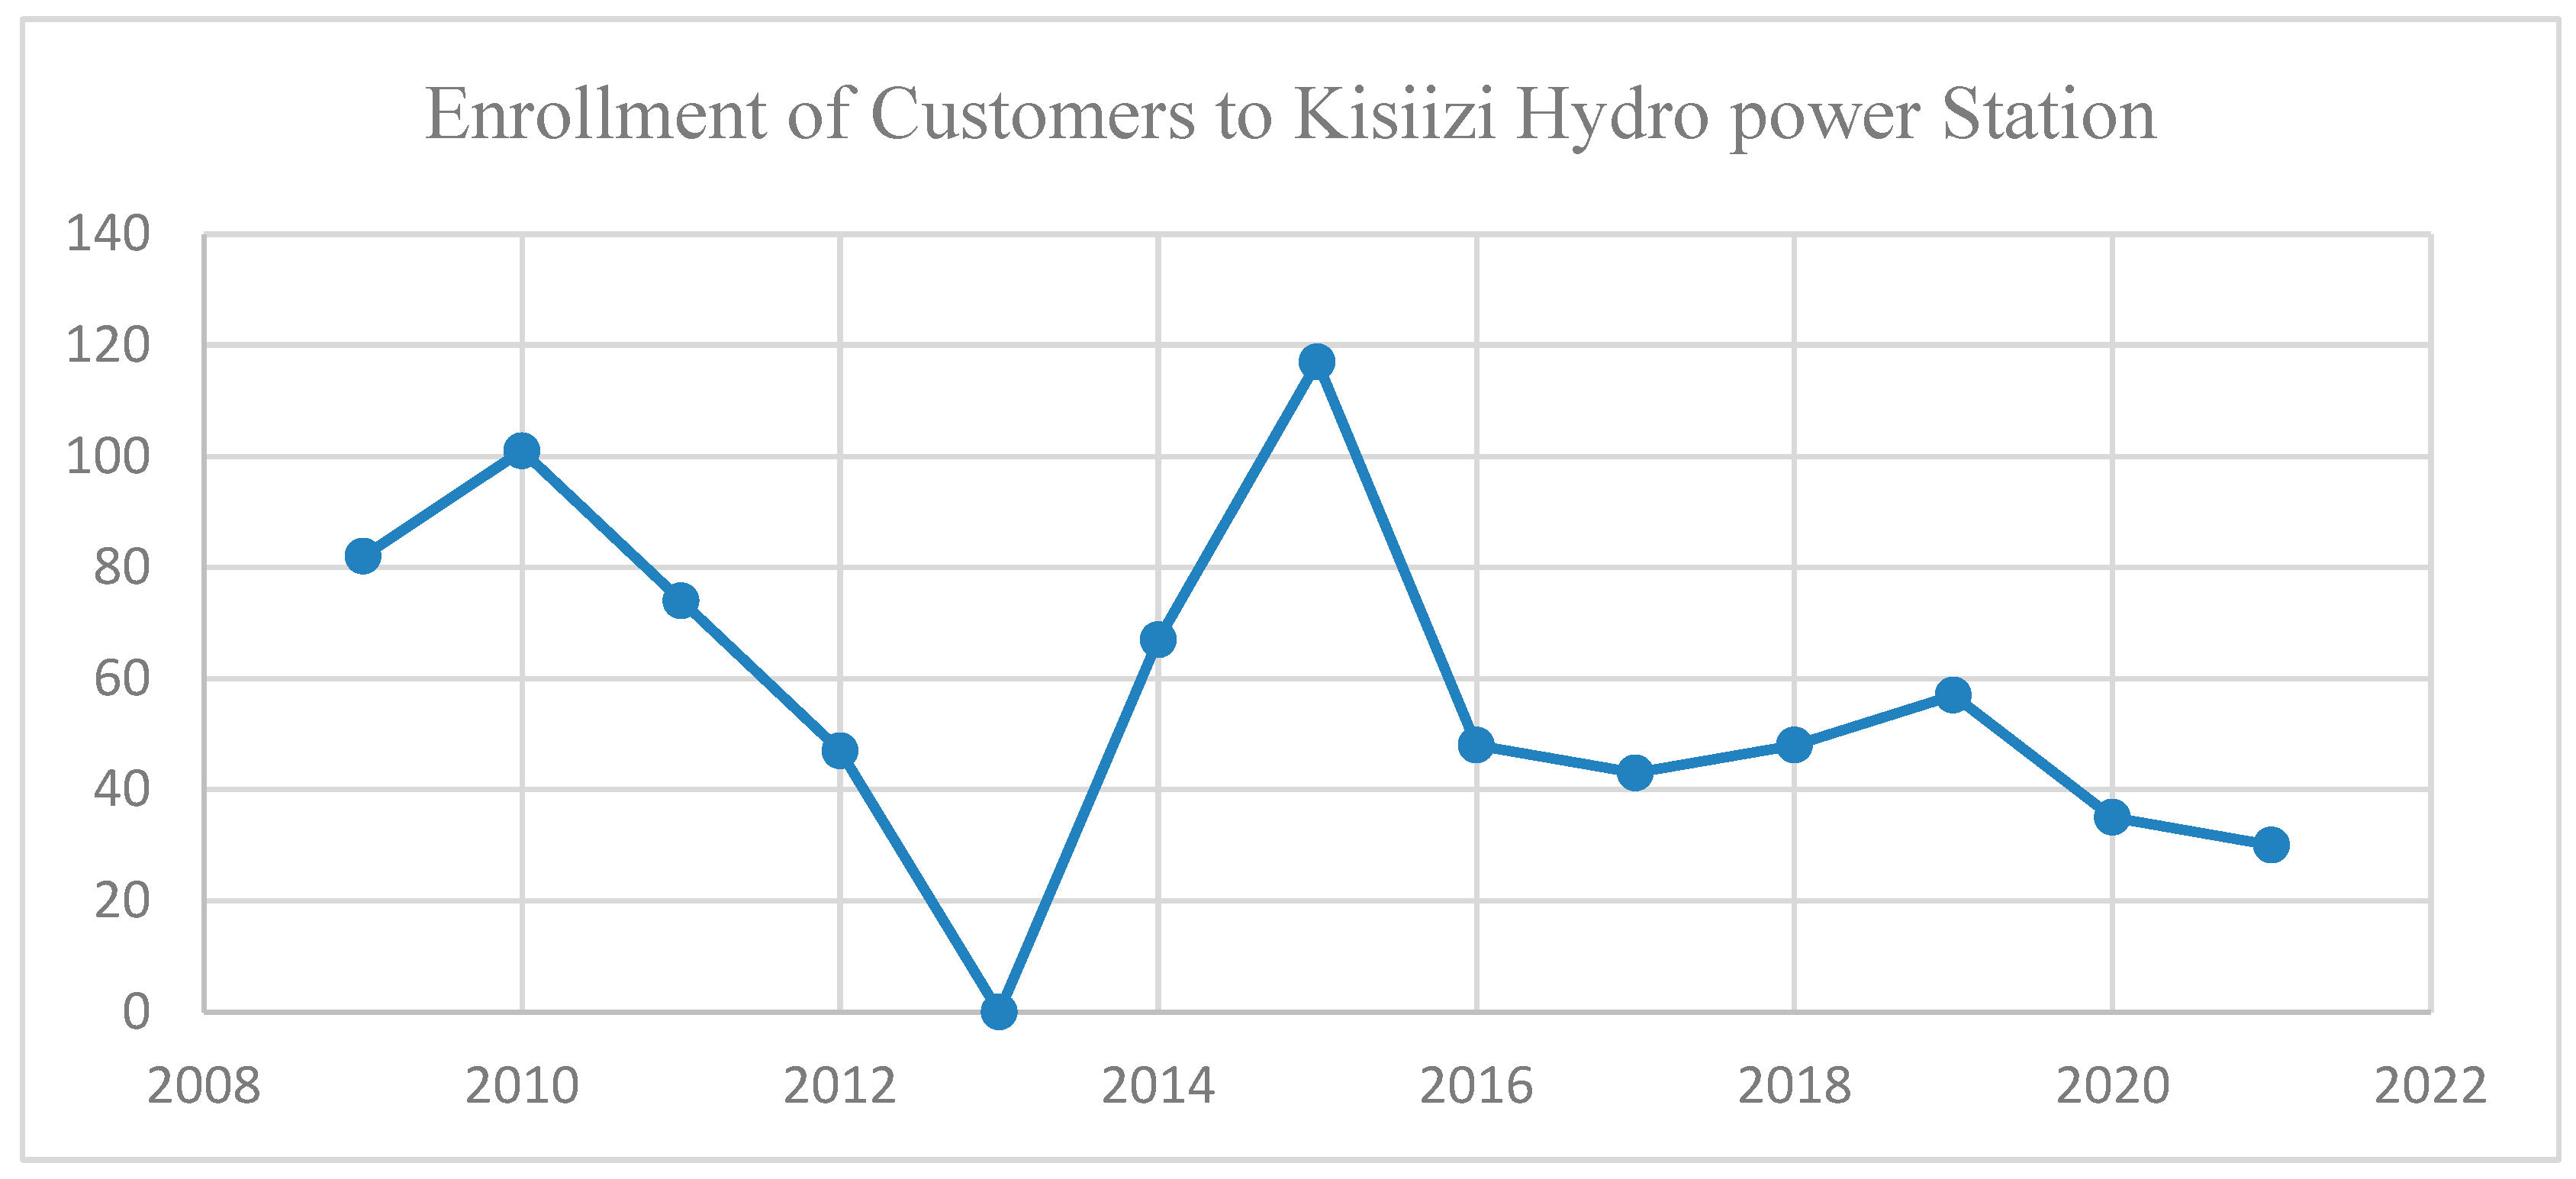
3.1. Customer Enrollment

Figure 2 below shows customer enrollment from the time of commissioning to December 2021.
In 2009, 82 customers were enrolled; in 2010, people were excited, and 101 customers were recruited. In 2011, enrollment declined to 74 and to 47 customers due to system failures. In 2013, the plant was out of function for a whole year due to a complex technical problem that was costly to rectify, hence no enrollment. The power station was invaded by floods and destroyed the civil works, short-circuiting alternators and turbine, which needed an assessment of the destruction situation and made a requisition to a German company for a replacement. This took time to replace civil works and equipment. A big basement wall has been built to prevent further invasion of floods. In 2015, the company registered the highest number of 117 customers due to the steady supply that was registered due to system repairs and maintenance. Declined again in 2016 due to technical faults. Enrollment has persistently reduced since 2019, and overall, as of December 2021, 749 customers were already enrolled and using the services of KHPS.

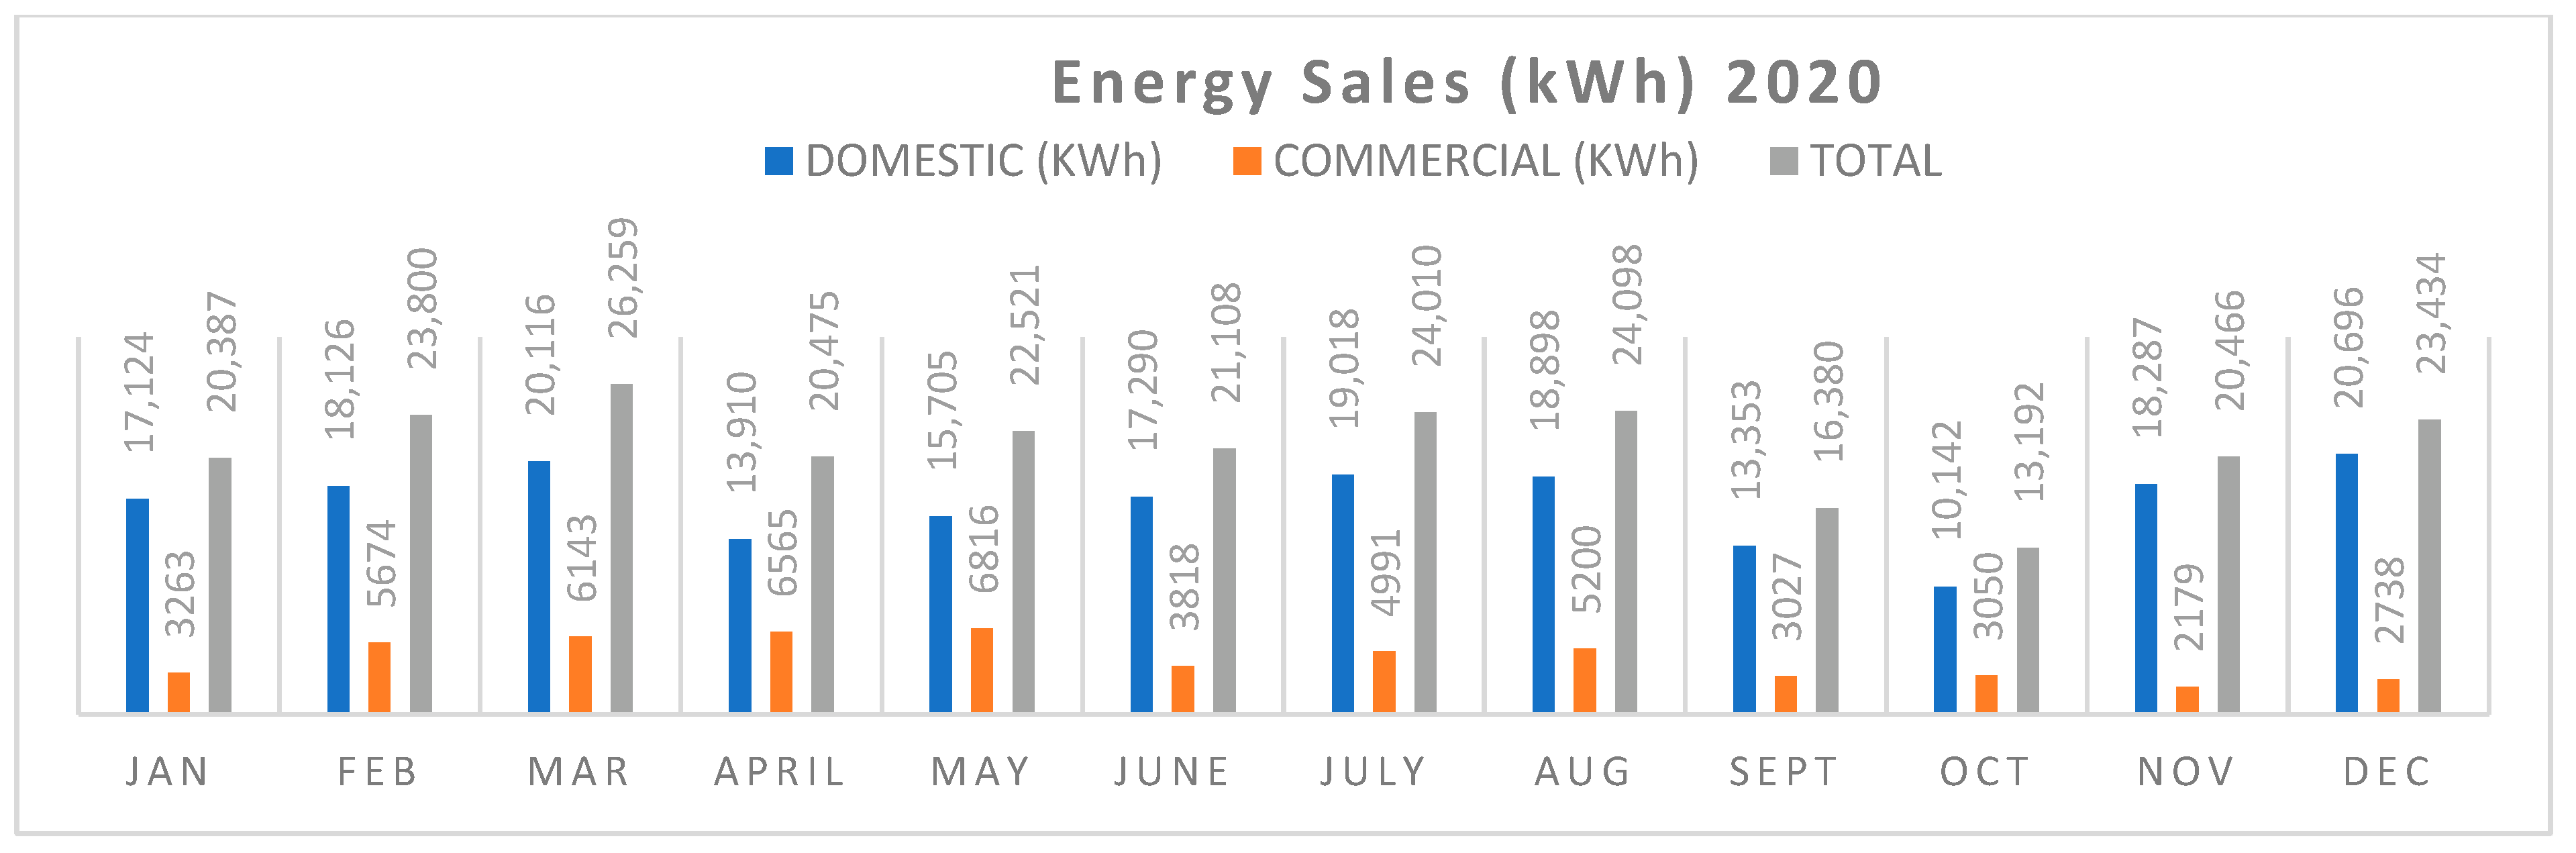
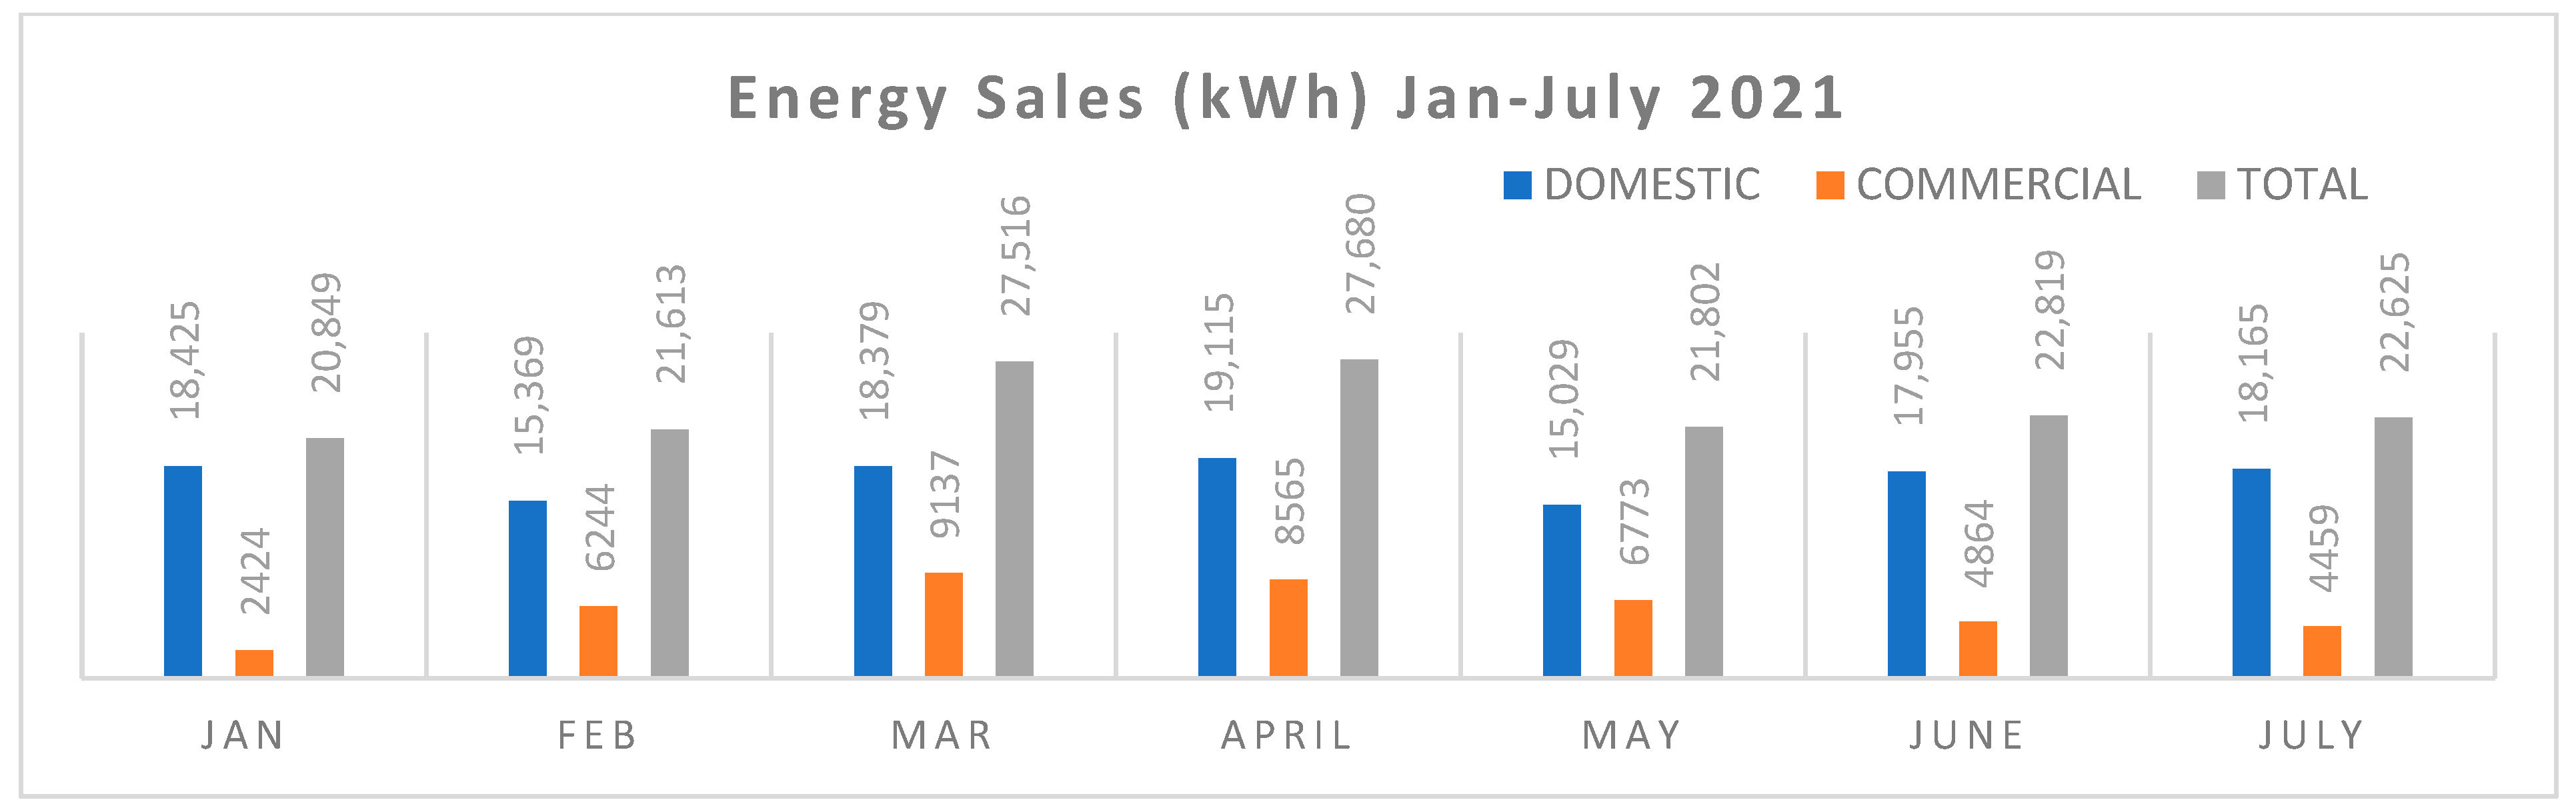
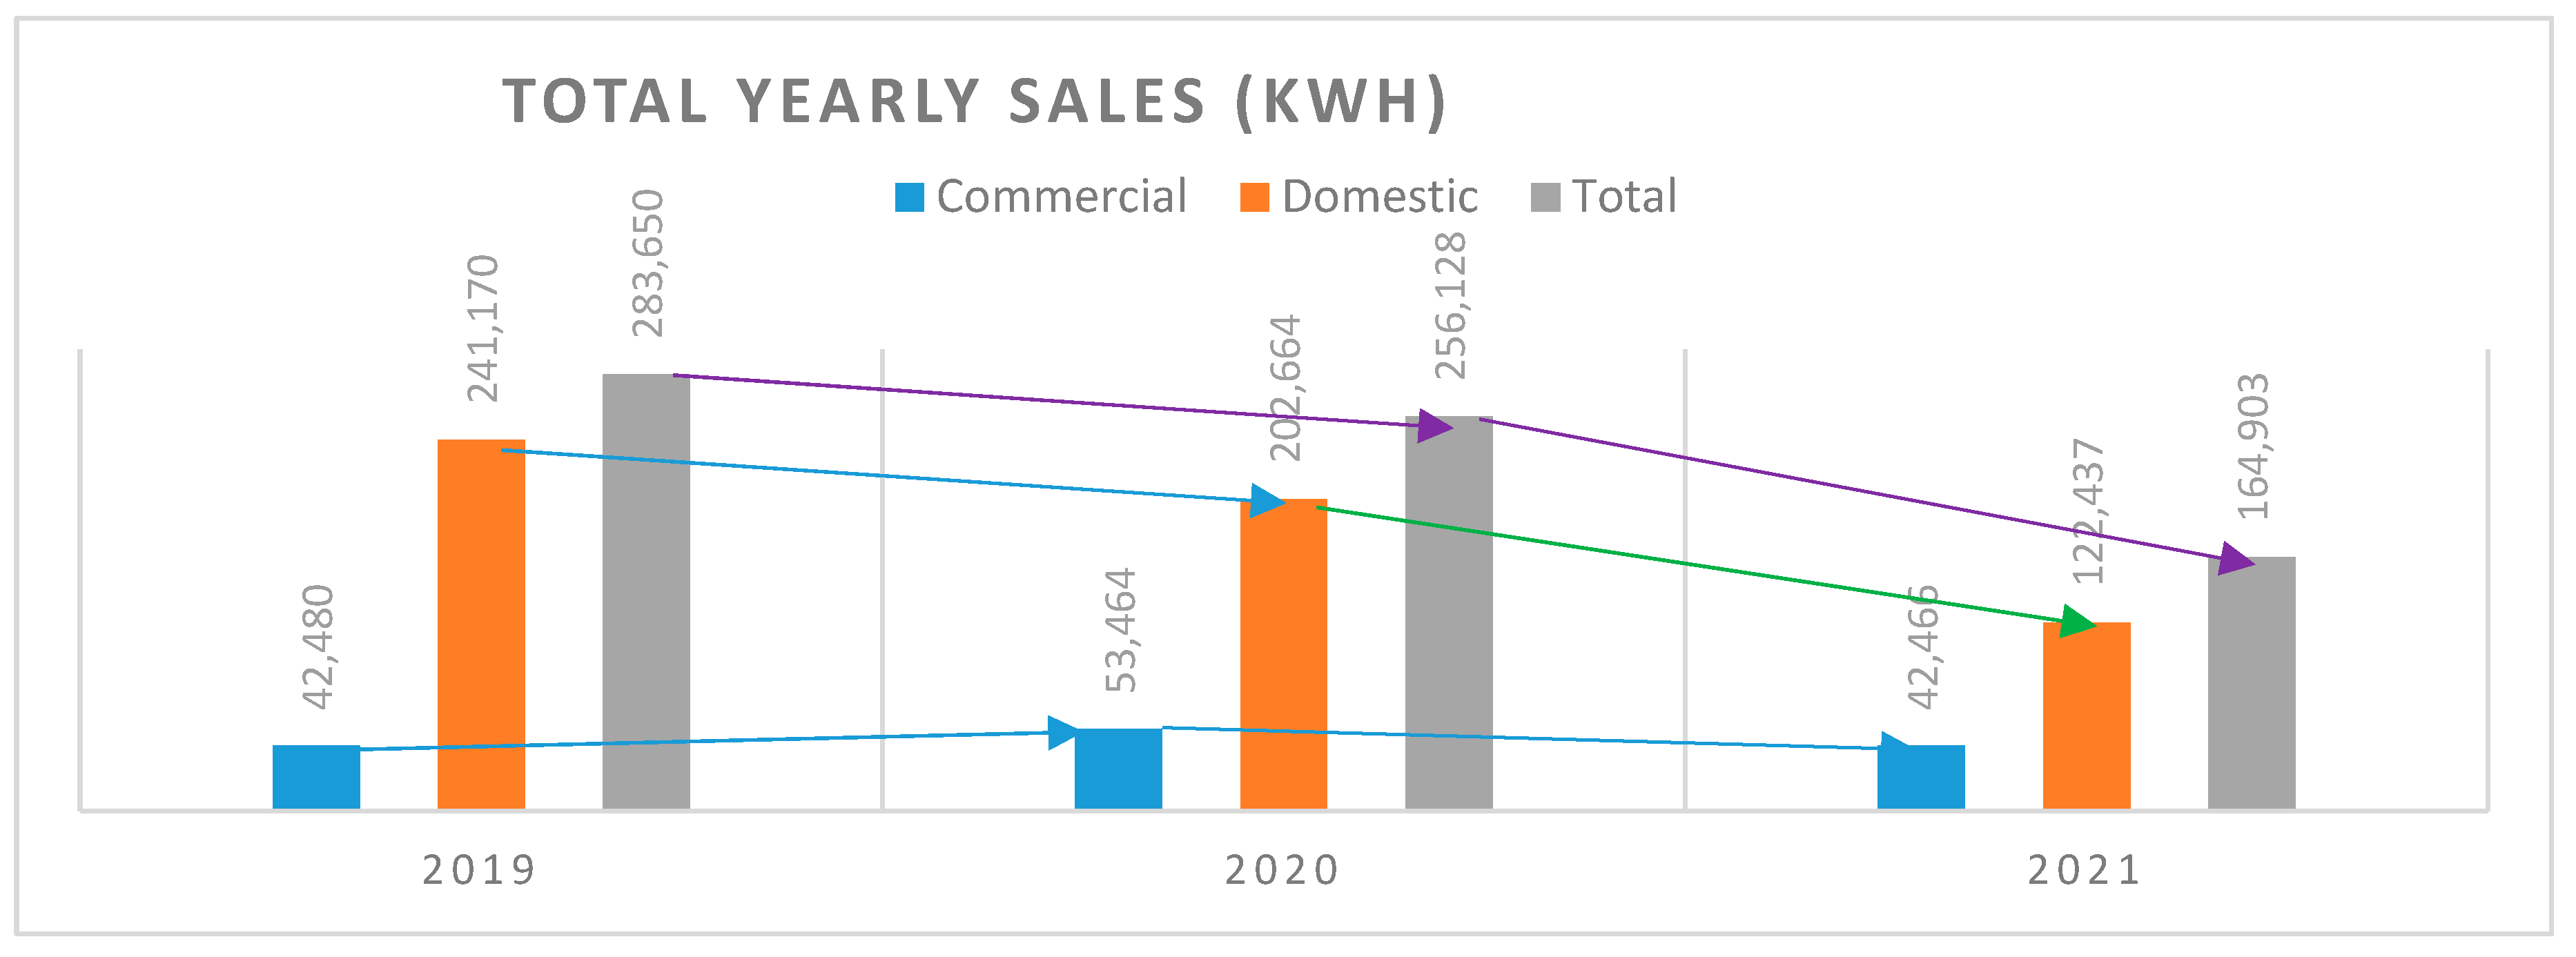
3.2. Energy Sale Analysis

A three-year energy sale analysis was performed in Figure 3, Figure 4 and Figure 5.
Figure 3 shows the sales made by KHMG to customers outside Kisiizi hospital, making a total of 241,170 kWh of domestic sales and 42,480 kWh of Commercial sales. The highest sales were in March, April, May, July, November, and December. This is due to school holidays when children are at home and spend time on television watching, charging, and making revisions. The Commercial sales were high in March, July, August, and December. This was due to the increased market brought by the students in school holidays.
In Figure 4, the domestic sales reduced by 38,506 kWh and Commercial sales increased by 10,984 kWh in 2020. This was due to the COVID-19 total lockdown in March 2020, where only small businesses were allowed to operate in Uganda. The sales dropped from 20,116 in March to 13,910 kWh in April of the same year. In Figure 5, the Domestic Sales further decreased by 80,227 kWh, and commercial sales also reduced by 10,998 kWh from 2019 to 2020. This was due to persistent infections of COVID-19. People had lost hope, some had to lose jobs, and some industries closed operations. Generally, there were overall reductions in total sales, as indicated in Figure 6.

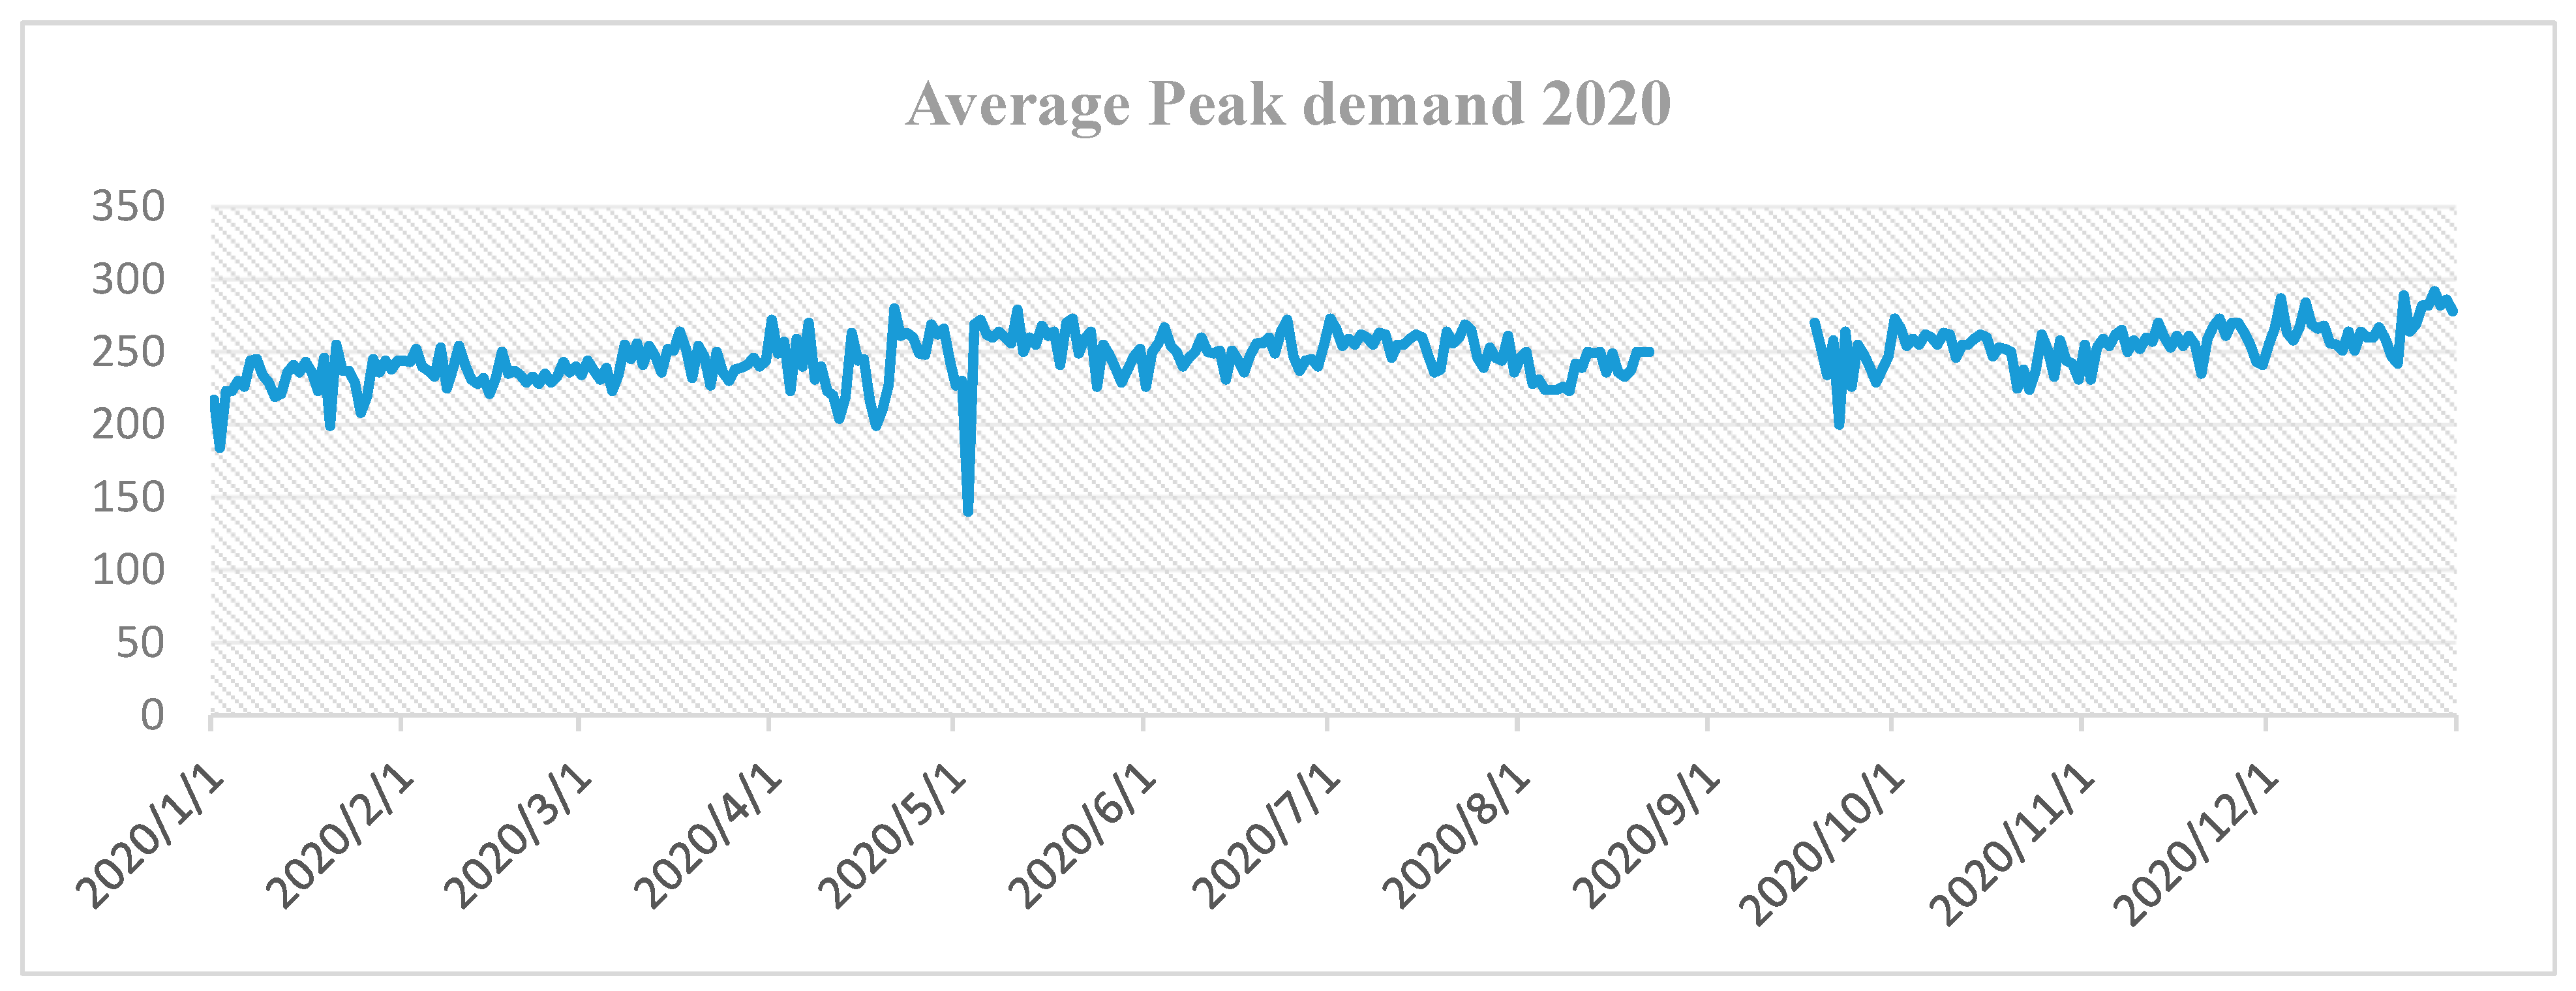
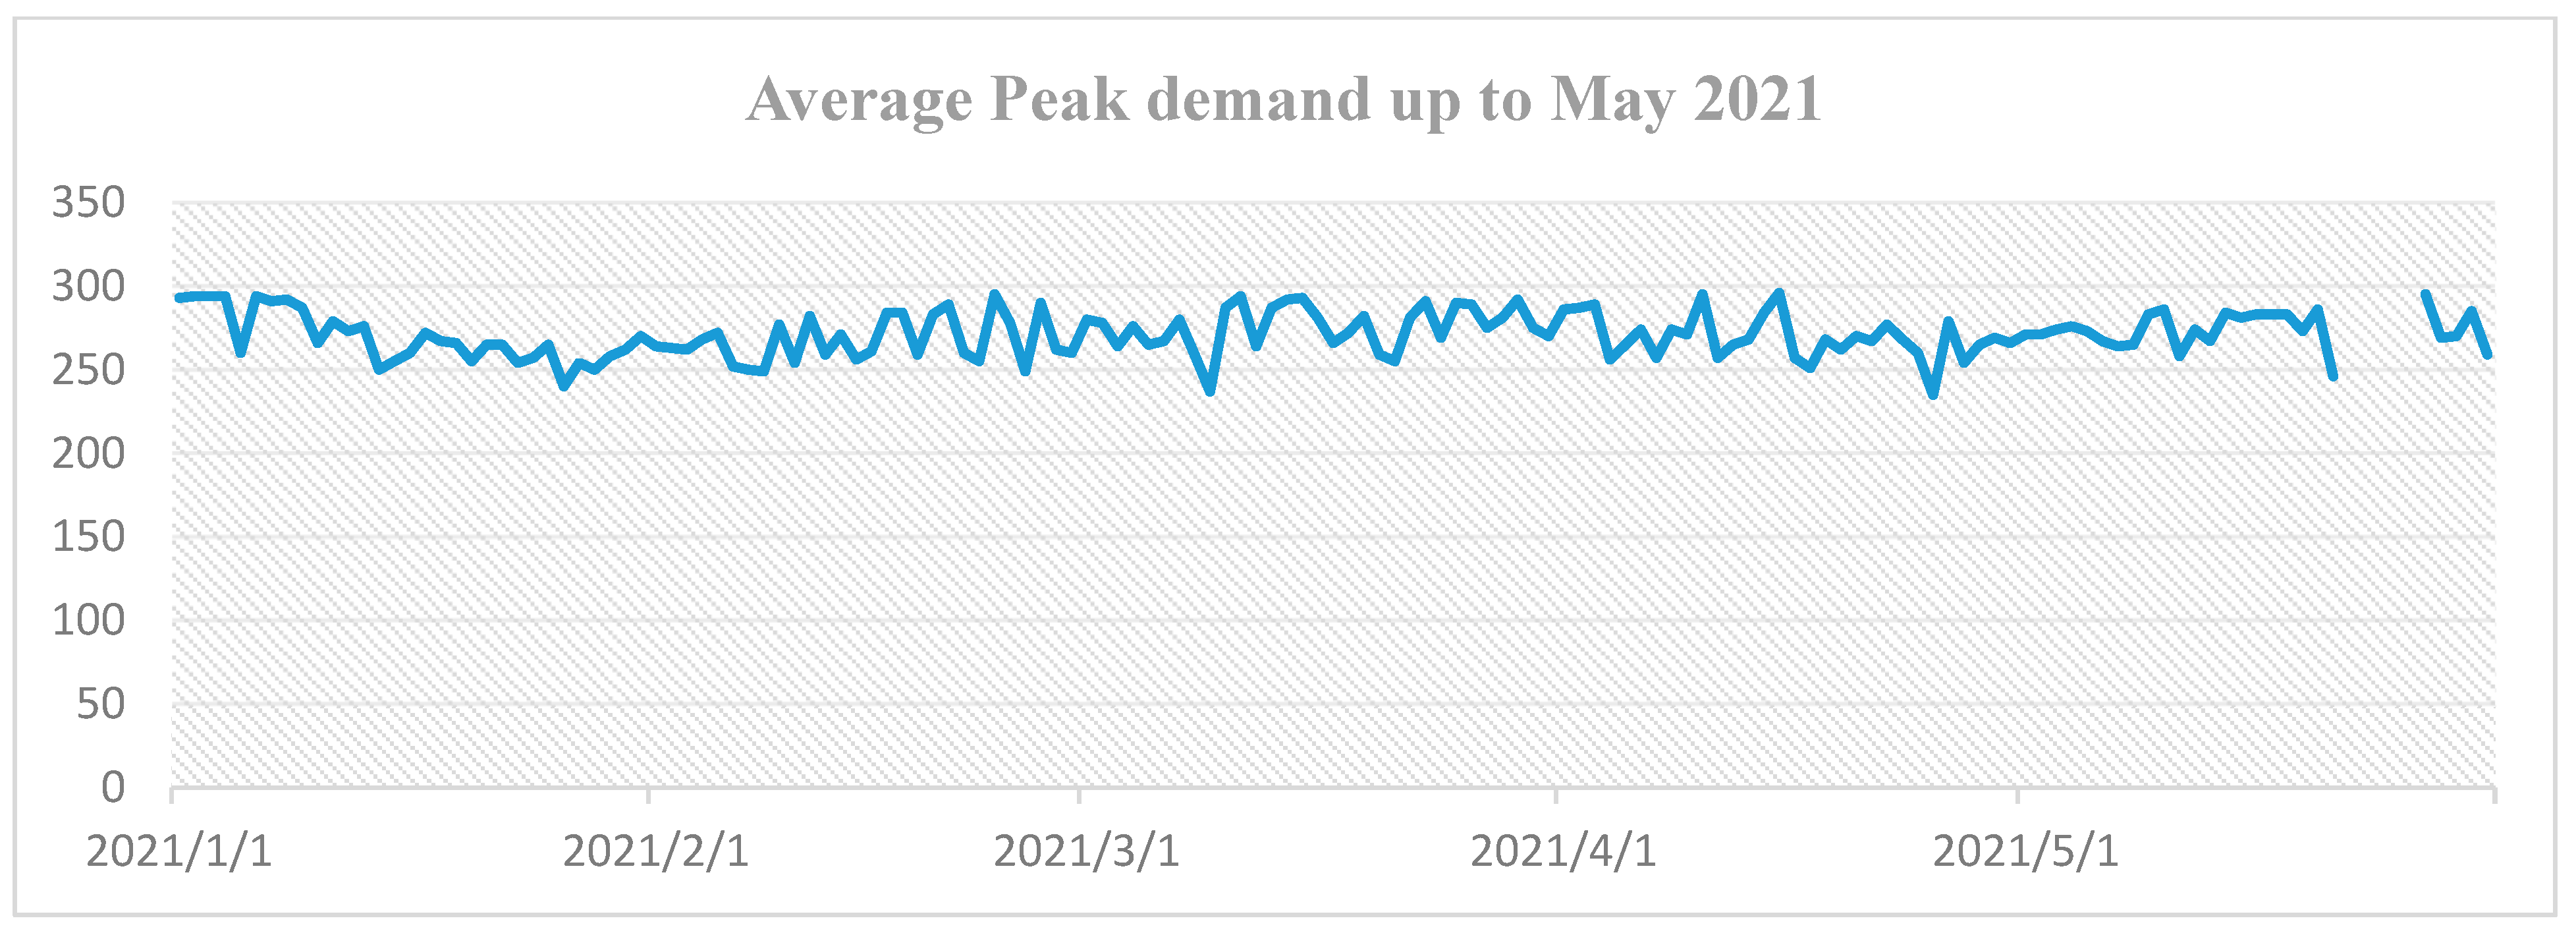
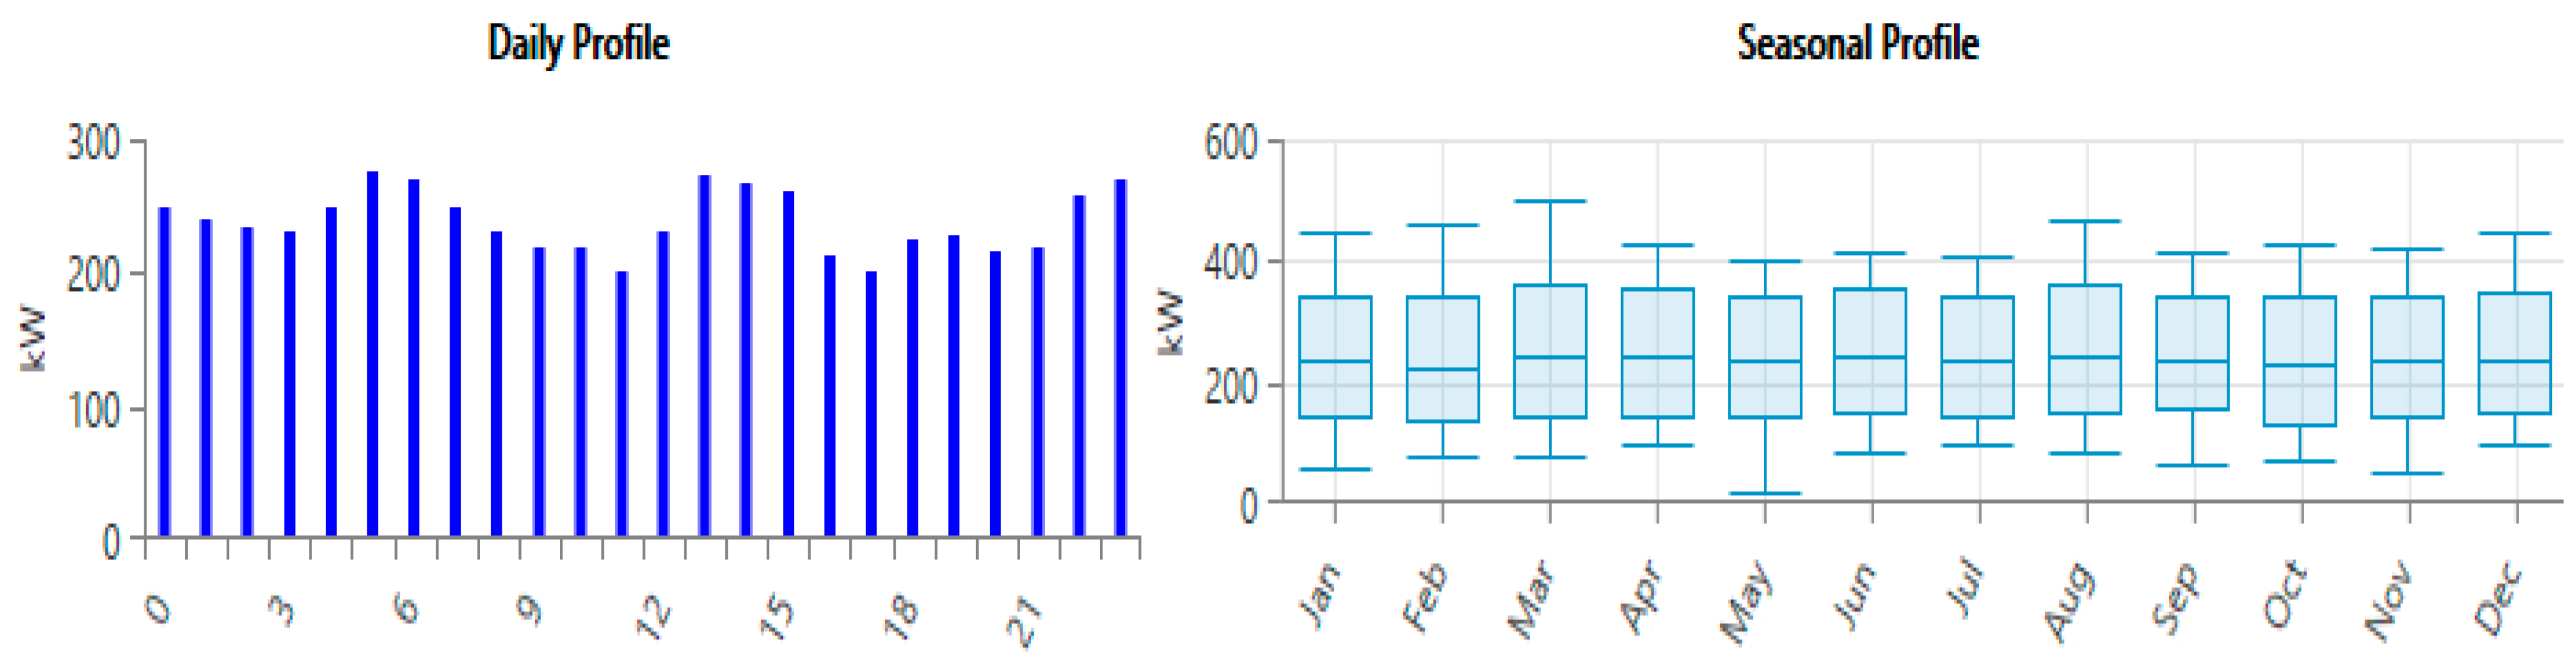
3.3. Peak Demand Analysis

This is the highest electrical power demand that occurs over a specified period, and it is characterized as annual, daily, or seasonal and has a unit of power. A three-and-a-half-year peak demand analysis was performed in Figure 7, Figure 8, Figure 9 and Figure 10.
The highest average peak demand was registered in the months of May, October, November, and December, and the lowest was in February, April, July, and August. From 9–30 June 2018, there was no generation due to the burnt alternator that needed replacement as shown in Figure 7.
In 2019, the highest average peak demand was recorded in January, June, October, and December, and the lowest in February, August, and September as indicated in Figure 8.
In 2020, the highest average peak demand was recorded in May, October, and December, and the lowest in January and May. However, there was no generation from 23 September to 18 October 2020 due to floods that eroded the power station and destroyed some plant components as shown in Figure 9.
In 2021, only five months were considered. The results of the other months were still sketchy at the time of compiling this manuscript. There was no power generation from 22 to 26 May 2021 because of general repairs that involved fixing gearbox bearings. May recorded the highest average peak demand, and April registered the least as indicated in Figure 10.
It was found that there were several shutdowns in 2019, as shown in Figure 11.
April, May, and August registered the highest number of shutdowns.
Notable gaps: The reduction in enrollment, reduction in energy sales, and the high number of system shutdowns due to system failure brought about by repairs and maintenance, component replacement, and seasonal variations like floods and drought.
When the number of customers enrolling in the grid declines, this increases the excess electricity, reduces mini-grid revenue, and impacts employees’ payments negatively. When energy sales reduce, it means that the demand for electricity is low. This could be because of unreliability or the high cost of units of electricity. In due course, the mini-grid cannot meet its investment, operation, and maintenance costs and is, therefore, liable to fail.
When there are uncontrollable numbers of system shutdowns due to system faults and system maintenance, customers lose confidence and begin opting for other sources, hindering mini-grid growth and revenue collection.
When a Generator or hydropower turbine fails, the system shuts down for some time. When there is routine maintenance on the system, the whole system is switched off. The authors, therefore, proposed a design of a hybrid system of Solar PV with storage, diesel generator (Genset), and hydropower turbine, earlier termed “Design option 1”.
When the hydropower turbine has a mechanical problem or during months of low flow rate Figure 12, then a design of a hybrid system of Solar PV storage and a diesel generator is proposed, termed “Design option 2”.
When the generator is faulty, then a hybrid of Solar PV storage and hydropower turbine is proposed, termed “Design option 3”.
Using the data obtained from the field, the procedure of determining energy use per day, as described in Table 3 below, was followed.
HOMER pro × 64 software input data
Considered inflation rate at 3.2% as of 28 February 2022, according to the Uganda Bureau of Statistics.
Discount rate at 6.5% as of 12 April 2020 Bank of Uganda.
Project lifetime 25 years.
Table 4 below shows hydro and Generator parameters together with daily peak demand values and monthly average flow data of Rushoma river where the kisiizi hydropower station is located. These values were fed into HOMER pro × 64 for analysis.
Figure 12 below shows a graphical representation of the stream flow rate of the river at the study site. The flow rates are lowest in the months of April (0.56), June (0.71), July (0.67), August (0.67), and September (0.71). Therefore, Hydropower production is lower to meet the growing peak demand
The graphical representation of the solar energy load profiles for the site study area is shown in Figure 13 below.
Figure 14 shows HOMER system architecture with energy sources, loads, storage and conversion components
Figure 15 shows HOMER result table with base system (BS) and design options 1, 2 and 3 indicating technical and economic parameters of the simulated data.

4. Discussion

4.1. Technical Analysis

This looks at the system design, the components’ operation, power production, emissions, and maintenance. The discussion is made based on a comparison of the existing base system that includes a Generator and hydropower turbine and the proposed hybrid system.
Table 5a: the generator operates at 10% and a high renewable fraction of 86.2% from 100% operation with the existing system. Excess electricity is low with Genset systems due to controllable measures of switching on and off during peak and off-peak periods.
Table 5b: the battery bank is expected to work for 16 h a day and last for 15 years. The efficiency of the batteries considering Energy output and Energy input is 92%.
Table 5c: the generator with the existing system has a high time of operation, a very low lifetime, and a very high fuel consumption of 90.2%. This results in high operating costs.
High fuel consumption leads to high fuel costs and carbon emissions, which is a reason why it should be avoided.
Table 5d: the figure shows the rated capacity of PV and mean output is low and with very low LCOE at 0.103$/kWh. Hours of operation indicate the hours of half a year. Therefore the operation is for 12 h a day.
Table 5e: the inversion value is higher than the rectification value because solar PV generates DC, which has to be changed to AC. The efficiency of the inverter and rectifier stands at 95%, considering the energy it receives and what it gives out. The losses are also minimal.
Table 5f, Emissions are very high with the existing base system at 90.2% and very low with the proposed hybrid system at 9.8%.

4.2. Economic Analysis

This deals with the calculation of NPC, COE, IRR, Payback period, and discounted payback period using the formulae described under methodology Section 2.5.
Table 6 is a summary of economic parameters for the hybrid system components. It shows individual’s component capital cost, replacement cost, operation and maintenance cost, salvage value and total cost.
Table 7 shows the comparison between technical parameters of the base system and proposed hybrid of the design option 2.
When the flow rate of the river is low or when the power house is affected by floods and other seasonal variations, as found out in Figure 13, the hydropower turbine can be neglected and operate a hybrid of Solar PV storage system and diesel generator system termed as option 2 (no hydro) in this text. The following HOMER pro × 64 results were obtained.
Table 8 shows individual component cost i.e capital, replacement, operation and maitainance, fuel, salvage and total of the proposed hybrid system of design option 2.
When the generator or generator parts develop a mechanical problem and goes off, as found out in Figure 7, Figure 8, Figure 10, and Figure 11, then the system can run as a hybrid of Solar PV storage and hydropower, termed Scenario 3 (no Genset), and this avoids system shutdown.
Table 9 shows the comparison of technical parameters of the base system and proposed hybrid system of the design option 3.
The economic cost results of the system components i.e., capital, replacement, operation and maintenance, fuel, salvage and total of the proposed hybrid system of design option 3 are summarized in Table 10 below.
Table 11 shows cost comparisons of the base system and proposed hybrid systems of design options 1, 2 and 3.
The proposed system Design option 1 has moderate NPC, LCOE, and operating costs because Genset operations are controllable during on-peak and off-peak periods.
Since a hydro turbine cannot operate without a generator, the system without hydro indicates less NPC and low COE but a very high operating cost due to high fuel consumption. option 3 has high NPC and LCOE, and low OC (no cost of fuel required)
The economic parameters of Table 12 show that Design option 1 is more feasible with a simple payback period of 5.26 years. Option 2 would lead to the overuse of Genset, which results in high carbon emissions and high fuel prices, making it expensive to operate. Option 3 appears cheap due to the elimination of fuel costs and O&M costs, but it will result in an increase in PV capacity, the number of storage batteries, and inverters, as in Table 7.
Figure 16 shows the overall cost comparison of the base system, design Options 1, 2, and 3 for capital, replacement, operation and maintenance, fuel, salvage and totals.
Figure 16 shows the summary of all costs involved in the four systems. The totals also indicate the total NPC of the base and proposed systems.
Figure 17 shows comparisions of systems average fuel consumption per hour and per day.
The base system consumes more fuel, about 90.2%, and increases emissions and operation and maintenance costs. Considering carbon dioxide and carbon-monoxide emissions and neglecting other small emissions, the graphical representation is shown in Figure 18 below;
Indeed several studies have also found that there is a need to reduce carbon emissions by reducing and minimizing non-renewable sources; for example, a study made by Yimen et al. agrees that using hybrid systems reduces carbon emission and stresses that solar PV-based mini-grids provide sustainable electricity in rural areas [52]. Moreover, the research made on one village, Ntoroko in Uganda, shows that using solar PV/Diesel mini-grids reduce fuel consumption and minimize carbon emissions [29].
Although the study made by Murphy et al. stressed that Diesel is the most economical energy source in rural areas where the grid is not reliable, the research further agrees that solar PV/Diesel mini-grids are better in cost reductions and carbon emissions [51]. Moreover, in agreement with the study made in refugee camps in Uganda about pumped water provision using electricity, it was found that solar PV systems are better options to replace non-renewables such as Diesel that emits carbon [53].
For a long time, Uganda has depended on Hydropower for electricity provision and has Diesel as the second option, which is associated with increasing fuel prices and, ultimately, high energy payments and high impacts on the environment in return. So the study made by Twaha et al. also confirms that using solar PV systems is a better option to supplement the existing power sources [54].

5. Conclusions

It has been noted that the power sector in Uganda has been on steady growth since early 2000. The use of various approaches to rural electrification and increase in electricity access has been focusing on grid extension, standalone solar PV systems, and isolated mini-grids. In this research, a rural-based Kisiizi hydropower mini-grid has been used as a case study to assess the techno-economic viability of the isolated mini-grids in Uganda. The findings indicate that the fluctuations in enrollment to KHPMG are due to unpredictable system failures that make customers uncomfortable while using the mini-grid power. The stagnant and declining energy sales were a result of system shutdowns, less power supply, and partly COVID-19 effects, especially during the years 2020 and 2021. The variations in peak demand were due to the increasing economic status of connected customers, weather conditions, seasonal variations, and planned routine maintenance. During the months of the low flow rate of the river, Figure 12 (April, July, August, and September), causes low power production, and this matches with the peak demand analysis of Figure 7, Figure 8, Figure 9 and Figure 10. During the low flow rate months, the generator is overused, which in turn increases the cost of fuel, maintenance, and environmental pollution. When the generator encounters a mechanical problem, the system stops operations leading to customer discomfort. The suggested hybrid system of solar PV with storage (Design option 1) to supplement the existing system of hydropower and generator would offer solutions to the existing gaps. The results show moderate values of NPC, LCOE, operating costs, fuel consumption, and emissions for option 1. When a hydropower turbine encounters a mechanical problem, Option 2 is proposed. When the generator encounters a mechanical problem or fault or needs general or part repairs, Option 3 is proposed. The proposed systems give battery operation efficiency of 92% and 95% for converters. The capacity factor, operation hours per year, and losses are minimal with option 1. The proposed systems reduce emissions from 83% to approximately 8% due to a reduction in fossil fuel use. The generator produces electricity at close to 10% of the maximum use of the base system, with a high percentage generated by solar PV at 90%. This makes a renewable fraction contribution of 87.3%. The proposed mini-grids are supposed to be beneficial as follows: increase savings, increase the lifespan of a system component, reduce load shedding, and attract more connections to utilize excess load
The findings show that there has been a notable increase in livelihoods as a result of the extension of energy services in the area. This research is beneficial to other rural communities using power from hydropower mini-grid by adopting hybrid options suggested in this research.
Rural electrification in Uganda has enabled the rural population seeking urban relocation to reduce. This is because affordable clean energy supports other intentions of development as a means to achieve SDGs by 2030.

Author Contributions

Conceptualization, R.C. and A.-M.S.; methodology, R.C., A.-M.S. and J.d.D.K.H.; Software: R.C. and J.d.D.K.H.; validation, R.C., A.-M.S. and J.d.D.K.H.; formal analysis, R.C.; investigation, R.C. and A.-M.S.: resources, R.C. and J.d.D.K.H.; data curation, R.C.; writing—original draft. preparation, R.C.; writing—review, and editing, R.C., A.-M.S. and J.d.D.K.H.; supervision, A.-M.S. and J.d.D.K.H. All authors have read and agreed to the published version of the manuscript.

Funding

This research received no external funding.

Institutional Review Board Statement

Not applicable.

Informed Consent Statement

Informed consent was obtained from electricity users, local leaders and mini-grid management staff.

Data Availability Statement

Not applicable.

Acknowledgments

We are very grateful for the support given to us by the African center of excellence in Energy for Sustainable Development College of Science and Technology University of Rwanda. We are also grateful to Kisiizi Hospital Power Station management for the good reception and for the organized record-keeping that has enabled us to come up with this manuscript. We also thank policymakers, politicians, and community residents for the good and hospitable interaction we had during data collection.

Conflicts of Interest

The authors declare no conflict of interest.

Abbreviations

PpvOutput of PV arrayYgRated capacity of GeneratorCrepReplacement cost
FpvPv derating factorNbNumber of batteries in a bankPgGenerator electrical output
YpvRated capacity of PV arrayiAnnual interest rateF1Fuel curve slope
ItGlobal solar radiationhnetNet head of hydroLbfMaximum life of a battery
Is1 kW/m2 standardρwDensity of waterφltLifetime of a single battery
RFpvRenewable fraction hAvailable headφthrAnnual throughput Energy of battery
EpvEnergy output of PVφtTurbine flow rateCan.tTotal annualized cost
Ean.tTotal annual energyfhPipe head lossRcompLifetime of the component
ᾐtTurbine efficiencyRprojThe project lifetimeRremRemaining life of a component
FoFuel curve intercept coefficientNNumber of years taken

References

  1. Authority, N.P. Uganda Vision 2040. Annu. Meet. Midwest Polit. Sci. 2007, 12, 1–7. [Google Scholar]
  2. Aburas, R.; Fromme, J.W. Household energy demand in Jordan. Energy Policy 1991, 19, 589–595. [Google Scholar] [CrossRef]
  3. Mawejje, J.; Mawejje, D.N. Electricity consumption and sectoral output in Uganda: An empirical investigation. J. Econ. Struct. 2016, 5, 1–16. [Google Scholar] [CrossRef] [Green Version]
  4. Norton Rose Fulbright. Renewable Energy in Latin America. Renew. Energy World 2016, 10, 1–5. [Google Scholar]
  5. Lipscomb, M.; Mobarak, A.M.; Barham, T. Development Effects of Electrification: Evidence from the Topographic Placement of Hydropower Plants in Brazil. Am. Econ. J. Appl. Econ. 2013, 5, 200–231. [Google Scholar] [CrossRef] [Green Version]
  6. Africa Union. The African Union Agenda 2063: The Africa We Want. Afr. Union 2014, 92, 2014. [Google Scholar]
  7. United Nations. The Sustainable Development Goals Report 2016; United Nations: New York, NY, USA, 2016; pp. 1–64. [Google Scholar]
  8. du Plessis, V.; Beshiri, R.M.; Bollman, R.; Clemenson, H. Definitions of ‘“Rural”: Agricultural and Rural Working Paper Series; No. 61; Statistics Canada: Ottawa, ON, Canada, 2002. [Google Scholar]
  9. IFAD. Enabling Poor Rural People to Overcome Poverty in Burundi; IFAD: Rome, Italy, 2012. [Google Scholar]
  10. Nalumansi, H. To Examine the Problems That Hinder Community Development: Case Study Osukuru Sub County, Tororo District. Bachelor’s Thesis, Kampala International University, Kampala, Uganda, 2007. Available online: https://www.ptonline.com/articles/how-to-get-better-mfi-results (accessed on 11 October 2022).
  11. Mukwaya, P.; Bamutaze, Y.; Mugarura, S.; Benson, T. Rural-Urban Transformation in Uganda. J. Afr. Dev. 2012, 14, 169–194. [Google Scholar] [CrossRef]
  12. National Cassava Policy 2007–2012; NORPLAN (Uganda) Ltd: Kampala, Uganda, 2007.
  13. Isa, N.M.; Das, H.S.; Tan, C.W.; Yatim, A.H.M.; Lau, K.Y. A techno-economic assessment of a combined heat and power photovoltaic/fuel cell/battery energy system in Malaysia hospital. Energy 2016, 112, 75–90. [Google Scholar] [CrossRef]
  14. Bekelea, G.; Boneya, G. Design of a photovoltaic-wind hybrid power generation system for Ethiopian remote area. Energy Procedia 2012, 14, 1760–1765. [Google Scholar] [CrossRef] [Green Version]
  15. Ashour, A.; Mohamad, T.I.; Sopian, K.; Ludin, N.A.; Alzahrani, K.; Ibrahim, A. Performance optimization of a photovoltaic-diesel hybrid power system for Yanbu, Saudi Arabia. AIMS Energy 2021, 9, 1260–1273. [Google Scholar] [CrossRef]
  16. Benchraa, H.; Redouane, A.; El Harraki, I.; El Hasnaoui, A. Techno-economic feasibility study of a hybrid biomass/PV/diesel/battery system for powering the village of Imlil in High Atlas of Morocco. In Proceedings of the 2018 9th International Renewable Energy Congress, IREC 2018, Hammamet, Tunisia, 20–22 March 2018; pp. 1–6. [Google Scholar]
  17. Kaviani, A.K.; Riahy, G.H.; Kouhsari, S.M. Optimal design of a reliable hydrogen-based stand-alone wind/PV generating system, considering component outages. Renew. Energy 2009, 34, 2380–2390. [Google Scholar] [CrossRef]
  18. Shahzad, M.K.; Zahid, A.; Rashid, T.; Rehan, M.A.; Ali, M.; Ahmad, M. Techno-economic feasibility analysis of a solar-biomass off grid system for the electrification of remote rural areas in Pakistan using HOMER software. Renew. Energy 2017, 106, 264–273. [Google Scholar] [CrossRef]
  19. Kenfack, J.; Pascal, F.; Tamo, T.; Mayer, D. Microhydro-PV-hybrid system: Sizing a small hydro-PV-hybrid system for rural electrification in developing countries. Renew. Energy 2009, 34, 2259–2263. [Google Scholar] [CrossRef]
  20. Sayar, F. State of the Global Mini-grids Market Report 2020: Section 11 Case study–Uganda. J. Chem. Inf. Model. 2020, 53, 134–139. [Google Scholar]
  21. Ma, W.; Xue, X.; Liu, G. Techno-economic evaluation for hybrid renewable energy system: Application and merits. Energy 2018, 159, 385–409. [Google Scholar] [CrossRef]
  22. Olatomiwa, L.; Mekhilef, S.; Huda, A.S.N.; Sanusi, K. Techno-economic analysis of hybrid PV–diesel–battery and PV–wind–diesel–battery power systems for mobile BTS: The way forward for rural development. Energy Sci. Eng. 2015, 3, 271–285. [Google Scholar] [CrossRef]
  23. Katutsi, V.; Kaddu, M.; Migisha, A.G.; Rubanda, M.E.; Adaramola, M.S. Overview of hydropower resources and development in Uganda. AIMS Energy 2021, 9, 1299–1320. [Google Scholar] [CrossRef]
  24. Kavuma, C.; Sandoval, D.; de Dieu, H.K.J. Analysis of power generating plants and substations for increased Uganda’s electricity grid access. AIMS Energy 2021, 9, 178–192. [Google Scholar] [CrossRef]
  25. Kimera, R.; Okou, R.; Sebitosi, A.B.; Awodele, K.O. Considerations for a sustainable hybrid mini-grid system: A case for Wanale village, Uganda. J. Energy S. Afr. 2014, 25, 33–43. [Google Scholar] [CrossRef]
  26. Okou, R.; Niwagaba, E.; Kyahingwa, O.; Edimu, M.; Sebitosi, A.B. Considerations For Renewable Energy Mini-Grid Systems for Isolated Areas in Uganda. In Proceedings of the SIDA Regional Collaboration Conference, Bagamoyo, Tanzania, 18–20 February 2004. [Google Scholar]
  27. Ssenyimba, S.; Kiggundu, N.; Banadda, N. Designing a solar and wind hybrid system for small-scale irrigation: A case study for Kalangala district in Uganda. Energy Sustain. Soc. 2020, 10, 6. [Google Scholar] [CrossRef]
  28. Okoboi, G.; Mawejje, J. The impact of adoption of power factor correction technology on electricity peak demand in Uganda. J. Econ. Struct. 2016, 5, 1–14. [Google Scholar] [CrossRef] [Green Version]
  29. Puglia, G.; Moroni, M.; Fagnani, R.; Comodi, G. A design approach of off-grid hybrid electric microgrids in isolated villages: A case study in Uganda. Energy Procedia 2017, 105, 3089–3094. [Google Scholar] [CrossRef]
  30. Okoboi, G.; Mawejje, J. Electricity peak demand in Uganda: Insights and foresight. Energy Sustain. Soc. 2016, 6, 29. [Google Scholar] [CrossRef] [Green Version]
  31. Comello, S.D.; Reichelstein, S.J.; Sahoo, A.; Schmidt, T.S. Enabling Mini-Grid Development in Rural India. World Dev. 2017, 93, 94–107. [Google Scholar] [CrossRef]
  32. Doso, O.; Gao, S. An overview of small hydro power development in India. AIMS Energy 2020, 8, 896–917. [Google Scholar] [CrossRef]
  33. Nakata, T.; Silva, D.; Rodionov, M. Application of energy system models for designing a low-carbon society. Prog. Energy Combust. Sci. 2011, 37, 462–502. [Google Scholar] [CrossRef]
  34. Elmanakhly, F.; DaCosta, A.; Berry, B.; Stasko, R.; Fowler, M.; Wu, X.Y. Hydrogen economy transition plan: A case study on Ontario. AIMS Energy 2021, 9, 775–811. [Google Scholar] [CrossRef]
  35. Micangeli, A.; Fioriti, D.; Cherubini, P.; Duenas-Martinez, P. Optimal design of isolated mini-grids with deterministic methods: Matching predictive operating strategies with low computational requirements. Energies 2020, 13, 4214. [Google Scholar] [CrossRef]
  36. Blum, N.U.; Wakeling, R.S.; Schmidt, T.S. Rural electrification through village grids-Assessing the cost competitiveness of isolated renewable energy technologies in Indonesia. Renew. Sustain. Energy Rev. 2013, 22, 482–496. [Google Scholar] [CrossRef]
  37. Gambino, V.; del Citto, R.; Cherubini, P.; Tacconelli, C.; Micangeli, A.; Giglioli, R. Methodology for the energy need assessment to effectively design and deploy mini-grids for rural electrification. Energies 2019, 12, 574. [Google Scholar] [CrossRef] [Green Version]
  38. Hailu, A.D.; Kumsa, D.K. Ethiopia renewable energy potentials and current state. AIMS Energy 2020, 9, 1–14. [Google Scholar] [CrossRef]
  39. Abbasi, K.R.; Hussain, K.; Abbas, J.; Adedoyin, F.F.; Shaikh, P.A.; Yousaf, H.; Muhammad, F. Analyzing the role of industrial sector’s electricity consumption, prices, and GDP: A modified empirical evidence from Pakistan. AIMS Energy 2020, 9, 29–49. [Google Scholar] [CrossRef]
  40. Yeshalem, M.T.; Khan, B. Design of an off-grid hybrid PV/wind power system for remote mobile base station: A case study. AIMS Energy 2017, 5, 96–112. [Google Scholar] [CrossRef]
  41. Antonanzas-Torres, F.; Antonanzas, J.; Blanco-Fernandez, J. Environmental impact of solar home systems in sub-saharan Africa. Sustainability 2021, 13, 9708. [Google Scholar] [CrossRef]
  42. Daniel, N.; Kim, J. A Study on Integrating SMRs into Uganda’s Future Energy System. Sustainability 2022, 14, 33. [Google Scholar] [CrossRef]
  43. MacLeod, M.; Eory, V.; Wint, W.; Shaw, A.; Gerber, P.J.; Cecchi, G.; Mattioli, R.; Sykes, A.; Robinson, T. Assessing the Greenhouse Gas Mitigation effect of removing bovine trypanosomiasis in Eastern Africa. Sustainability 2018, 10, 1633. [Google Scholar] [CrossRef] [Green Version]
  44. Fashina, A.; Mundu, M.; Akiyode, O.; Abdullah, L.; Sanni, D.; Ounyesiga, L. The Drivers and Barriers of Renewable Energy Applications and Development in Uganda: A Review. Clean Technol. 2019, 1, 3. [Google Scholar] [CrossRef] [Green Version]
  45. Japan International Cooperation Agency. Project for Master Plan Study on Hydropower Development in the Republic of Uganda, Final Report; Ministry of Energy and Mineral Development: Kampala, Uganda, 2011. [Google Scholar]
  46. Andrychowicz, M. Optimization of distribution systems by using RES allocation and grid development. In Proceedings of the 15th International Conference of European Energy Market, Łodź, Poland, 27–29 June 2018. [Google Scholar]
  47. Gilman, P.; Lilienthal, P. Micropower System Modeling; John Wiley Sons, Inc.: Hoboken, NJ, USA, 2006; pp. 379–418. [Google Scholar]
  48. Sawle, Y.; Gupta, S.C.; Bohre, A.K. Optimal sizing of standalone PV/Wind/Biomass hybrid energy system using GA and PSO optimization technique. Energy Procedia 2017, 117, 690–698. [Google Scholar] [CrossRef]
  49. Come Zebra, E.I.; van der Windt, H.J.; Nhumaio, G.; Faaij, A.P.C. A review of hybrid renewable energy systems in mini-grids for off-grid electrification in developing countries. Renew. Sustain. Energy Rev. 2021, 144, 111036. [Google Scholar] [CrossRef]
  50. Milone, D.; Curto, D.; Franzitta, V.; Guercio, A.; Cirrincione, M.; Mohammadi, A. An Economic Approach to Size of a Renewable Energy Mix in Small Islands. Energies 2022, 15, 2005. [Google Scholar] [CrossRef]
  51. Murphy, P.M.; Twaha, S.; Murphy, I.S. Analysis of the cost of reliable electricity: A new method for analyzing grid-connected solar, diesel and hybrid distributed electricity systems considering an unreliable electric grid, with examples in Uganda. Energy 2014, 66, 523–534. [Google Scholar] [CrossRef]
  52. Yimen, N.; Tchotang, T.; Kanmogne, A.; Abdelkhalikh Idriss, I.; Musa, B.; Aliyu, A.; Okonkwo, E.C.; Abba, S.I.; Tata, D.; Meva’a, L.; et al. Optimal Sizing and Techno-Economic Analysis of Hybrid Renewable Energy Systems—A Case Study of a Photovoltaic/Wind/Battery/Diesel System in Fanisau, Northern Nigeria. Processes 2020, 8, 1381. [Google Scholar] [CrossRef]
  53. Bassi, S.A.; Tange, I.; Holm, B.; Boldrin, A.; Rygaard, M. A multi-criteria assessment of water supply in Ugandan refugee settlements. Water 2018, 10, 1493. [Google Scholar] [CrossRef]
  54. Twaha, S.; Idris, M.H.; Anwari, M.; Khairuddin, A. Applying grid-connected photovoltaic system as an alternative source of electricity to supplement hydropower instead of using diesel in Uganda. Energy 2012, 37, 185–194. [Google Scholar] [CrossRef]
Figure 1. Monthly average solar global irradiance of Kisiizi area.
Processes 11 00175 g001
Figure 2. Enrollment of outside customers to KHMG.
Processes 11 00175 g002
Figure 3. Energy Sales January–December 2019.
Processes 11 00175 g003
Figure 4. Energy Sales January–December 2020.
Processes 11 00175 g004
Figure 5. Energy Sales January–July 2021.
Processes 11 00175 g005
Figure 6. Total yearly sales showing declines in energy sales.
Processes 11 00175 g006
Figure 7. Simulated average peak demand for the year 2018.
Processes 11 00175 g007
Figure 8. Simulated average peak demand for the year 2019.
Processes 11 00175 g008
Figure 9. Simulated average peak demand for the year 2020.
Processes 11 00175 g009
Figure 10. Simulated average peak demand for the year 2021.
Processes 11 00175 g010
Figure 11. Number of system shutdowns in 2019.
Processes 11 00175 g011
Figure 12. Average monthly stream flow rate for river Rushoma that supplies KHMG.
Processes 11 00175 g012
Figure 13. Daily and seasonal profiles for solar Energy at KHMG.
Processes 11 00175 g013
Figure 14. HOMER system architecture showing the interconnections of the loads, components, and resources.
Processes 11 00175 g014
Figure 15. The result table showing the architectural design and cost comparison of simulated system, highlighting the base system (BS) and design options 1, 2, and 3.
Processes 11 00175 g015
Figure 16. Comparison costs of base and proposed systems.
Processes 11 00175 g016
Figure 17. Comparison of systems’ average fuel consumption per day and per hour.
Processes 11 00175 g017
Figure 18. Carbon dioxide and Carbon monoxide emissions.
Processes 11 00175 g018
Table 1. A list of villages supplied by KHPMG.
S/NVillage Name S/NVillage Name
1Kisiizi (Kisiizi Lower)18Stage Nyarushanje
2Binyena19Ibanda
3Kisiizi Upper Trading Centre20Ngarama
4Kamobwe21Ruyonza
5Nshugyezi22Gomborora Headquaters
6Omukikona23Ahamuginda
7Kasikizi24Nyakaginga
8Omukatooma25Rwentare
9Kahanga26Nyakasa
10Mucondo27Kicubanyungu
11Rubirizi28Kahumiro
12Rwere29Kanyinya
13Nyarutuntu30Kyakabarisinga
14Kasoni31Omukishanda
15Mushunga32Kamira
16Rutooma. A33Katobotobo
17Rutooma. B
Table 2. Research concerns and methodology used.
AnalysisConcernMethodology
Performance analysisCause of system failure
Mini-grid power output visa vie customer demands
Cause of continuous load shedding
Cause of fluctuations in customer enrollment
Emission levels
Load demand analysis (Enrollment trend, Energy sales, and average peak demand)
Field survey
Data collection
System sizing
HOMER pro × 64 software
Excel analysis
Systems AnalysisInitial cost
Replacement cost
Salvage value
Operation and maintenance cost
Fuel consumption
Emissions
Economic parameters (NPV, LCOE, and OC)
HOMER pro × 64 software
Key: NPV Net Present Value, LCOE Levelised Cost of Energy, OC Operating Cost.
Table 3. Determining total daily energy demand of KHMG users.
1Grain Millers and Coffee Hullers (12)
CFLs = Compact Fluorescent Lamps
AppliancePower Rating (W)QuantityHours Used (h)Energy Use (Wh)Total in NumberTotal Energy Use a Day (Wh/d)
CFLs10410400
Electric motor4000128000
840012100,800
2Fuel stations (06)
Fuel pump motor100011212,000
CFLs2546600
Decoder6016360
12,960677,760
3Uganda Martyrs Polytechnic Institute (01)
CFLs54061200
Printer601160
Desktop computer8026960
Television401280
Photocopier801180
Workshop motor4000114000
638016380
4Schools (12)
CFLs5306900
Printer601160
Desktop computer8016480
Television401140
Photocopier801180
15601218,720
5Churches (07)
CFLs5204400
Address system1000111000
140079800
6Health centers (02)
Fridge400162400
CFLs3309810
Computer8012160
Television4018320
Printer601160
375027500
7Small and Medium Enterprises (12)
Electric motor1000111000
Fridge40012800
Decoder6016360
Television4015200
CFLs565150
25101230,120
8Barber shops (saloons) (03)
CFLs7410280
Electric clipper151690
Hair drier1500123000
Decoder60110600
Television40110400
4370313,110
9Domestic customers (649)
CFLs554100
Television401280
Radio301260
240649155,760
10Kisiizi Hospital Domestic customers (133)
CFLs555125
Television4013120
Decoder601160
Laptop651165
37013349,210
11Kisiizi Hospital commercial customers (07)
CFLs566240
Television4016240
Fridge40012800
Decoder601160
134079380
Total energy demand per day478,540 kWh/day
Table 4. HOMER input values.
HydroGenerator
ItemAmountUnitItemAmountUnit
Capital cost700,000$Initial cost50,000$
Replacement cost350,000$Replacement50,000$
O&M cost150,000$O&M cost2$/op h
Lifetime25YearsFuel price1.2$
Available head29.8MMin Load ratio25%
Design flow rate500L/sLifetime15,000h
Minimum flow ratio50%
Maximum flow ratio150%
Efficiency80%
Pipe head loss15%
Daily Peak Demand AveragesMonthly Average stream flow data
TimePeak Demand(kW)MonthStream flow(L/s)
0:00250JAN0.8
1:00240FEB0.74
2:00235MAR0.75
3:00230APR0.56
4:00250MAY0.88
5:00275JUN0.71
6:00270JUL0.67
7:00249AUG0.67
8:00230SEP0.71
9:00220OCT0.91
10:00220NOV0.87
11:00200DEC0.81
12:00231
13:00274Annual average 0.76 L/s
14:00268Residual flow rate 0.26 L/s
15:00261
16:00214
17:00202
18:00226
19:00227
20:00217
21:00219
22:00258
23:00270
Table 5. (af): Design option 1 comparing technical parameters of the base system and proposed hybrid system of simulated values.
(a) Electricity Production (%)
Generator (%)PVAC Primary Load (kWh/yr)Excess Electricity (%)Unmet Load (%)Renewable Fraction (%)
Existing Base system1000174,66721.500
Design option 11090174,66720.7086.2
(b) Generic Battery
Batteries NoAutonomy
(h)
Lifetime throughput (kWh)Expected life (yrs)Energy in (kWh)Energy out (kWh/y)Losses (kWh/yr)
Existing system0000000
Design option 1445161,393,8621596,84089,0108174
(c) Generic 100 kW Fixed Generator
Operation (h/yr)Operation life (yr)Capacity factor (&)Electricity production (kWh/y)Fuel consumption (L)SFC L/kWhMEE (%)
Existing system87601.7125.4222,61780,850 (90.2%)0.36328
Design option 196515.52.7624,1918822 (9.8%)0.36527.9
(d) PV System Generic Flat Plate
Rated capacity (KW)Mean output (kW)Capacity factor (%)Hrs of Operation (h/yr)Levelised cost ($/kWh)
Existing Base system00000
Design option 115224.716.243800.103
(e) System Converter Inverter/Rectifier
Rated capacity I/R(kW)Capacity factor I/R (%)operation I/R (h/yr)Energy out I/R (kWh/y)Energy in I/R (kWh/y) Losses I/R (kWh/y)
Existing Base system 0 0 0 0 00
Design option 140.6/40.643.4/1.028036/723154,299/3632162,420/38238121/191
(f) Systems’ Emissions
Carbon dioxide (kg/y)Carbon monoxide (kg/y)Unburnt carbons (kg/y)Particulate matter (kg/y)Sulpher dioxide (kg/y)Nitrogen oxides (kg/y)
Existing Base system211,470 1439 58.2 5.76 518115
Design option 123,076 1576.350.62856.612.6
MEE Mean Electrical Efficiency SFC Specific fuel consumption.
Table 6. System architectural costs for proposed hybrid system option 1.
ComponentCapital ($)Replacement ($)O&M ($)Fuel ($)Salvage ($)Total ($)
Hydro 300kW700,0000255,53600955,536
Genset 100kW50,00030,65432,879180,3568915284,974
Battery(1kWh) Li-Ion229,620143,20687,472034,845425,453
Flat plate PV380,572017100380,742
System converter12,189649500416214,522
System1,372,387180,355376,058180,35647,9222,061,228
Table 7. (af): Design option 2 comparing technical parameters of the base system and proposed hybrid system of simulated values.
(a) Electricity Production (%)
Generator (%)PVAC Primary Load (kWh/yr)Excess Electricity (%)Unmet Load (%)Renewable Fraction (%)
Existing Base system1000174,66721.500
Design option 28.991.1174,66723.3087.3
(b) Generic battery
Batteries NoAutonomy
(h)
Lifetime throughput (kWh)Expected life (yrs)Energy in (kWh)Energy out (kWh/y)Losses (kWh/yr)
Existing system0000000
Design option 244916.11,405,9911597,70189,7858254
(c) Generic 100 kW fixed generator
Operation (h/yr)Operation life (yr)Capacity factor (&)Electricity production (kWh/y)Fuel consumption (L)SFC L/kWhMEE (%)
Existing system87601.7125.4222,61780,850 (90.2%)0.36328
Design option 288916.92.5422,25981210.36527.9
(d) PV system Generic flat plate
Rated capacity (KW)Mean output (kW)Capacity factor (%)Hrs of Operation (h/yr)Levelised cost ($/kWh)
Existing Base system00000
Design option 215925.916.243800.103
(e) System converter Inverter/Rectifier
Rated capacity I/R(kW)Capacity factor I/R (%)operation I/R (h/yr)Energy out I/R (kWh/y)Energy in I/R (kWh/y)Losses I/R (kWh/y)
Existing Base system000000
Design option 239.3/39.345.3/0.9618094/666155,888/3306164,093/34808205/174
(f) Systems’ Emissions
Carbon dioxide (kg/y)Carbon monoxide (kg/y)Unburnt carbons (kg/y)Particulate matter (kg/y)Sulpher dioxide (kg/y)Nitrogen oxides (kg/y)
Existing Base system211,470143958.25.76518115
Design option 221,2411455.850.57852.111.6
MEE Mean Electrical Efficiency SFC Specific fuel consumption.
Table 8. System architectural costs for proposed hybrid system for option 2.
ComponentCapital ($)Replacement ($)O&M ($)Fuel ($)Salvage ($)Total ($)
Genset 100 kW50,00029,39830,290166,01311,799263,901
Battery (1 kWh) Li-Ion231,684144,49388,258035,158429,277
Flat plate PV398,126017800398,305
System converter11,780627700402214,035
System691,590180,168118,726166,01350,9791,105,518
Table 9. (ad): Design option 3 comparing technical parameters of the base system and proposed hybrid system of simulated values.
(a) Electricity Production (%)
Generator (%)PVAC Primary Load (kWh/yr)Excess Electricity (%)Unmet Load (%)Renewable Fraction (%)
Existing Base system1000174,66721.500
Design option 30500,478174,55461.50.0648100
(b) Generic battery
Batteries NoAutonomy
(h)
Lifetime throughput (kWh)Expected life (yrs)Energy in (kWh)Energy out (kWh/y)Losses (kWh/yr)
Existing system0000000
Design option 385430.61,544,38615107,51998,6838970
(c) PV system Generic flat plate
Rated capacity (KW)Mean output (kW)Capacity factor (%)Hrs of Operation (h/yr)Levelised cost ($/kWh)
Existing Base system00000
Design option 335257.116.243800.103
(d) System converter Inverter/Rectifier
Rated capacity I/R (kW)Capacity factor I/R (%)operation I/R (h/yr)Energy out I/R (kWh/y)Energy in I/R (kWh/y)Losses I/R (kWh/y)
Existing Base system000000
Design option 346.4/042.9/08760/0174,554/0183,741/09187/0
MEE Mean Electrical Efficiency SFC Specific fuel consumption.
Table 10. System architectural costs for proposed hybrid option 3.
ComponentCapital ($)Replacement ($)O&M ($)Fuel ($)Salvage ($)Total ($)
Hydro 300 kW700,0000255,53600955,536
Battery (1 kWh) Li-Ion440,66474,827167,868066,871816,487
Flat plate PV879,450039400879,844
System converter13,933742400475716,599
System2,034,047282,251423,798071,628266,8467
Table 11. Comparison of NPC, LCOE, and Operating Cost (OC).
Base SystemDesign Option 1Design Option 2 (No Hydro)Design Option 3 (No Genset)
Total NPC ($)3,426,054.02,061,228.01,105,518.02,668,467.0
LCOE ($)1.150.69270.37150.8974
OC ($)157,084.740,435.3624,297.6237,240.55
Table 12. Comparison of economic parameters.
Economic ParameterDesign Option 1Design Option 2 (No Hydro)Design Option 3 (No Genset)
Present worth ($)1,364,8262,320,536757,587
Annual worth ($/yr)80,115136,21644,470
Return on Investment (%)14.70.05.3
Internal Rate of Return (%)18.8N/A8.0
Simple Pay Back (yr)5.26N/A9.88
Discounted Pay Back (yr)5.72N/A11.72
Disclaimer/Publisher’s Note: The statements, opinions and data contained in all publications are solely those of the individual author(s) and contributor(s) and not of MDPI and/or the editor(s). MDPI and/or the editor(s) disclaim responsibility for any injury to people or property resulting from any ideas, methods, instructions or products referred to in the content.

