Article

A PBM-Based Procedure for the CFD Simulation of Gas–Liquid Mixing with Compact Inline Static Mixers in Pipelines

by
Francesco Maluta
,
Alessandro Paglianti
and
Giuseppina Montante
*
Dipartimento di Chimica Industriale “Toso Montanari”, Alma Mater Studiorum—Università di Bologna, viale Risorgimento 4, 40136 Bologna, Italy
*
Author to whom correspondence should be addressed.
Processes 2023, 11(1), 198; https://doi.org/10.3390/pr11010198
Submission received: 27 November 2022 / Revised: 17 December 2022 / Accepted: 2 January 2023 / Published: 7 January 2023
(This article belongs to the Special Issue Recent Development of Mixing in Chemical Processes)

Abstract

:
A compact static mixer for gas–liquid dispersion in pipelines is studied in this paper with a Reynolds averaged two fluid model approach. A procedure based on the lumped parameter solution of a population balance model is applied to obtain the bubble Sauter mean diameter needed to model the interphase forces. The gas distribution in the pipe is analyzed in two different operative conditions and the efficiency of the static mixer is assessed in terms of the gas homogeneity in the pipe section, with low coefficients of variations being obtained. A computational model to obtain the volumetric mass transfer coefficient, kLa, developed for partially segregated systems is applied finding kLa values comparable to those typically obtained with other static mixers. The proposed computational model allows us to locally analyze the oxygen transfer rate by observing the limitations due to gas accumulation behind the body of the static mixer, which leads to the local depletion of the driving force. Geometrical optimization of the static element is proposed, based on the analysis of gas–liquid fluid dynamics and of the interphase mass transfer phenomena.

1. Introduction

Static mixers are employed in several industrial fields to homogenize miscible fluids, increase the interfacial area between immiscible phases, foster heat transfer and temperature homogenization, and to improve axial mixing [1]. Their adoption in the process industry is particularly interesting since it allows to enforce one of the process intensification principles, which is the maximization of synergistic effects [2]. For instance, in multi-phase operations, the contact between phases can be achieved directly in the pipelines needed to transport the mixture, thus reducing the number and size of the process equipment. The industrial applications of gas–liquid static mixing in horizontal pipelines span from the wastewater treatment, where for instance O2 and/or O3 are absorbed in the liquid phase for aerobic-activated sludge processes and advanced oxidation processes [3], respectively, to a number of chemical production processes, involving gas–liquid or gas–liquid–liquid chemical reactions [4].
In recent years several static mixer designs have been proposed [1,5], also thanks to the growing availability of 3D printing techniques [6]. Despite the large number of static mixer patents and commercial models, ordinarily the use of standard designs is common, due to the larger availability of experimental data and better characterization [1].
From an experimental point of view, the flow field in static mixers can be characterized by particle image velocimetry (PIV) in both single-phase [7] and multiphase applications [5]. The homogeneity obtained with static mixers is quantified by planar laser-induced fluorescence (PLIF) in laminar [8,9] and turbulent [10] single-phase applications. Tomographic techniques have also been adopted, such as X-ray [11] tomography for gas–liquid mixing and electrical resistance tomography (ERT) for investigations with complex fluids [12]. The ERT technique may also be applied to investigations into static mixing in multiphase systems, due to its proven suitability in liquid–liquid [13] and solid–liquid mixtures in different mixing equipment [14,15,16].
Alongside the experimental tools to characterize and study the behavior of static mixers, computational fluid dynamics (CFD) has already become essential for understanding static mixer performance [1]. Many single-phase studies have successfully predicted pressure drop [17,18], the heat transfer rate [19], and miscible liquids dynamics [20] together with the mixing efficiency in a large range of operative conditions. Static mixers have also been numerically studied for multiphase flows for liquid–liquid [13] and gas–liquid applications [11,21,22]. A key parameter that characterizes secondary phase distribution and homogenization in multiphase dispersion is the bubble/drop size, which can strongly influence the resulting fluid dynamic behavior [21]. To obtain the bubble/drop size, two approaches are usually adopted, either a single size is assumed based on the available correlations and experimental observations [21,22] or the bubble/drop size distribution is obtained from the solution of a population balance model (PBM) [13]. In the first case, the computational effort is lower than in the latter case, but purposely devised experiments must be designed to obtain the bubble size, thus shifting the effort from the computational to the experimental domain. The availability of correlations to obtain the bubble size is limited in the literature and they strongly depend on the phases, regimes and operative conditions involved, as well as the type of static mixer adopted [11]. On the other hand, the solution of a PBM can in principle predict the bubble size in a wide range of mixer geometries and operative conditions, as long as proper kernels are available, but the coupling between PBM and fluid dynamics equations largely increases the computational demands [23].
The goal of this work is to propose a CFD methodology for the determination of the bubble size obtained in static mixers, exploiting the versatility of the PBM approach, while at the same time reducing the computational efforts, as previously done for aerated stirred tanks [24]. The underlying idea is to solve a PBM adopting lumped parameters obtained from single-phase simulations to calculate a single bubble Sauter mean diameter representative of the bubbles size in the system under consideration and to perform gas–liquid simulations with a single constant bubble size. This will prevent the need to perform experiments to obtain the bubble size, while at the same time avoiding computationally intensive coupled solutions of fluid flow equations and PBM.
Firstly, the manuscript presents the system and the operative conditions considered in this study. Successively, the computational model is presented starting from the flow equations, then moving to the interphase mass transfer model, the PBM-based procedure for bubble size determination, and then the numerical solution procedure is reported. The results are presented and discussed in terms of bubble size and gas volume fraction distribution, kLa, and mass transfer rate. The local analysis of the interphase mass transfer phenomena is performed, highlighting the potential of the proposed CFD approach in troubleshooting and designing static mixers. Finally, conclusions are drawn.

2. Investigated System and Operative Conditions

The investigated system consists of a horizontal straight pipe with an internal diameter equal to 0.09 m and 1.8 m long. Midway inside the pipe, a compact gas–liquid static mixer is positioned. Mixing is achieved through the deflection of the gas–liquid mixture flow by six flat blades, tilted at 45° from the pipe axis, which are fixed to a central cylindric hub of 25 mm. The blades extend up to the pipe internal walls, their thickness is 2 mm, and the total axial length of the static mixer is 13 mm. The system is shown in Figure 1.
Pure degassed water at room temperature (density ρL = 998 kg/m3 and viscosity μL = 0.001 Pa∙s) enters the system, together with a gas phase consisting of air, assumed as a mixture of oxygen (mole fraction xO2 = 0.21) and nitrogen (mole fraction xN2 = 0.79), with a density ρG = 1.225 kg/m3 and a viscosity μG = 1.7 × 10⁻⁵ Pa∙s. Two operative conditions are considered in this study. In the first operative condition, the water volumetric flow rate is equal to 25 m3/h (6.94 × 10⁻³ m3/s) and the air volume flow rate is equal to 3.75 L/min (6.25 × 10⁻⁵ m3/s). The second operative condition consists of a water volumetric flow rate equal to 30 m3/h (8.33 × 10⁻³ m3/s) and an air volume flow rate equal to 7.50 L/min (1.25 × 10⁻⁴ m3/s). The gas volume fraction, αG, in the operative condition with lower fluids flow rates is equal to 0.0089, while in the operative condition with higher fluids flow rates, it is equal to 0.0148.

3. Computational Model

The set of equations numerically solved in this study are presented in this section, starting from the description of the Reynolds averaged Navier–Stokes (RANS) equations extended to multiphase flows through the Euler–Euler two-fluid model (TFM). Then, the interphase mass transfer model is described and lastly, the PBM-based procedure for the determination of the bubble size is presented.

3.1. RANS-TFM Equations

The Reynolds averaged formulation of the two-fluid model equations for incompressible fluids and isothermal conditions at the steady state are:
( α i ρ i u i ) = 0 ,
( α i ρ i u i u i ) = α i P + α i ρ i g + ( τ i + τ i t ) + F D + F T D ,
where α i is the volume fraction of the i-th phase, ρ i is its density, and u i is its mean velocity. The pressure shared by the two phases is P , g is the gravitational acceleration, τ i and τ i t are the viscous and Reynolds stress tensors, respectively, and the last terms on the right-hand side of Equation (2) are the interphase interaction forces. Namely, F D is the interphase drag force and F T D is the interphase turbulent dispersion force. Just these two interphase forces were considered, as usually done in the simulation of gas–liquid mixing in the context of RANS-based two-fluid model simulations. In fact it is difficult to accurately account for additional forces, such as added mass and lift, since the correlations usually adopted to evaluate these forces have numerous coefficients of an empirical nature subject to large uncertainties [25]. In single-phase calculations, just the liquid phase is accounted for and its volume fraction, α L , is equal to 1, and the interphase interaction forces are neglected. The Reynolds stress tensor is modelled with the eddy viscosity approach, in which the turbulent viscosity is obtained from the solution of transport equations for the turbulent kinetic energy, k, and its dissipation, ε, with the well-known standard k-ε turbulent model, that has been proven to give reliable results in both single and gas–liquid simulations in similar systems [23]. The turbulence model was extended to multiphase flows through the so-called dispersed formulation [26], as implemented in ANSYS Fluent 2020R2. In the present study no interfacial turbulent interaction terms were considered, and their effect on the final gas distribution may be the subject of future works.
The interphase drag force reads as:
F D = 3 4 d 32 ρ L α L α G C D u G u L ( u G u L ) ,
where d32 is the Sauter mean diameter of the bubble population, and CD is the drag coefficient, obtained from the correlation of Schiller and Naumann [27], as:
C D = 24 R e B ( 1 + 0.15 R e B 0.687 ) ,
which holds true for 1 < R e B < 1000 and single rigid spheres falling in a still fluid. The bubble Reynolds number, ReB, is defined as:
R e B = d 32 ρ L u G u L μ L .
Equation (4) is adopted since in the investigated conditions, the bubbles are in the spherical regime. The turbulent dispersion force is accounted for by the model developed by Burns et al. [28] and it reads:
F T D = 3 4 d 32 α L α G C D μ L t S c L t u G u L ( α G α G α L α L ) ,
with μ L t being the eddy viscosity and S c L t being the liquid phase turbulent Schmidt number, equal to 0.9. In Equations (3) and (6), both the gas and the liquid volume fractions are present due to a force balance in an Eulerian frame [29,30] which limits the interphase forces where gas segregation occurs [31]. The magnitude of the two interfacial forces is found to be similar in the whole system section downstream of the static mixer.

3.2. Interphase Mass Transfer Model

The species transport in each phase was modelled with a conservation equation in which both convection and diffusion were considered, as:
( α i ρ i Y i k u i ) = ( α i ( ρ i D i k + μ L t S c t ) Y i k ) + ( m ˙ i j k m ˙ j i k ) .
In Equation (7) the k-th species mass fraction in the i-th phase is Y i k , D i k is the k-th species diffusion coefficient in the phase i, and m ˙ i j k and m ˙ j i k are the mass transfer of k from the phase j to the phase i and vice versa, respectively. With oxygen being the only species transported across different phases and assuming negligible resistances to species diffusion in the gas phase, the interphase mass flux of oxygen m ˙ L G O 2 was quantified as:
m ˙ L G O 2 = k L a ( y O 2 m x O 2 ) M W O 2 M W L ρ L ,
where y O 2 is the mole fraction of oxygen in the gas phase, x O 2 is the mole fraction of oxygen in the liquid phase, m is the Henry constant, 4.40 × 10⁹ Pa, divided by the operative pressure equal to 1 atm, and M W O 2 and M W L are the molecular weights of oxygen and of the liquid mixture, respectively. The oxygen transfer rate, OTR, is derived from the interphase mass flux of oxygen as:
O T R = m ˙ L G O 2 / M W O 2 .
In Equation (8) k L is the liquid side mass transfer coefficient, a is the specific interfacial area, and their product gives the volumetric mass transfer coefficient, kLa. The liquid side mass transfer coefficient is modelled according to the eddy cell model of Lamont and Scott [32], and it reads:
k L = 0.4 D L 0.5 ( ρ L ε / μ L ) 0.25 ,
with the oxygen diffusion coefficient in water, DL, equal to 2 × 10⁻⁹ m2/s.
Since segregation is expected in the pipe section upstream of the static mixer, an expression for the specific interfacial area that accounts for this segregation must be employed. The model proposed by Maluta et al. [33] was adopted and it reads as:
a = { 6 α G / d 32 ,     α G 0.3 4 π   ( 3 4 π α G ) 2 / 3 / V c e l l 1 / 3 ,     0.3 < α G 0.5 4 π ( 3 4 π α L ) 2 / 3 / V c e l l 1 / 3 ,     α G > 0.5 ,
with Vcell being the volume of the computational grid cell. In a Eulerian–Eulerian description of the flow, below a local volume fraction of 0.3, the gas–liquid flow can be modelled as a mixture of bubbles in the continuous liquid medium, therefore the classical expression for the interfacial area can be adopted. For gas volume fractions higher than 0.3, coalescence increases [34] and therefore the average bubble diameter increases, while the gas phase is still in the dispersed phase. For gas volume fractions above 0.5, it was assumed that the liquid becomes the dispersed phase and the gas becomes the continuous phase. It is important to bear in mind that these considerations are limited to the Eulerian–Eulerian description of the flow with a constant bubble size and only for the calculation of the specific interfacial area. Further information on the interphase mass transfer model adopted in this investigation can be found in Maluta et al. [33].

3.3. PBM-Based Procedure for Bubble Size Determination

In order to close the set of equations presented in Section 3.1 and Section 3.2, a bubble Sauter mean diameter must be provided. In this work, the coupled solution of a PBM for the determination of the local bubble size is renounced and a single constant bubble diameter is assumed instead. With this simplified modelling approach, the bubble size must be representative of the whole bubble population, and it can be determined either by experimental observations or by the solution of a lumped parameter population balance model, as already done for gas–liquid stirred tanks [24]. A lumped parameter PBM was solved and the number density function, n ( d ) , transport equation reads as:
n ( d ) t + ( u G n ( d ) ) = B B + B C D B D C ,
where the terms on the right-hand side of Equation (12) are the discrete birth, B, and death, D, source terms due to bubble breakup and coalesce. As already done for a similar system [23], the breakup birth and death rates are obtained with the Luo and Svendsen [35] breakup kernel and their expression becomes:
B B D B = d Ω ( d , δ ) n ( d ) × n ( d ) d δ b ( d ) n ( d ) ,
with Ω ( d , δ ) being the total breakage frequency and b ( d ) being the breakage frequency function. Their expression is provided in Equations (14) and (16).
Ω ( d , δ ) n ( d ) = 0.923 ( 1 α G ) ( ε d 2 ) 1 / 3 Z m i n 1 ( 1 + Z ) 2 Z 11 3 exp ( 12 c f ( d , δ ) σ β ρ L ε 2 3 d 5 / 3 Z 11 3 ) d Z ,
c f ( d , δ ) = ( d 3 δ 3 ) 2 3 + ( 1 d 3 δ 3 ) 2 3 1 ,
b ( d ) = 1 2 0 d 2 1 / 3 Ω ( d , δ ) n ( d ) 3 δ 3 d 3 d δ .
In Equation (14), d and δ are the parent and daughter bubble diameter, respectively, Z is the ratio between the size of the eddy and the diameter of the bubble, β is a model constant equal to 2.045, σ is the air–water interfacial tension assumed equal to 0.072 N/m, and the lower limit of integration is assumed as Zmin~(11.4 ÷ 31.4)μL0.75ρL−0.75ε−0.25 [35]. Equation (15) describes the surface energy increase constraint, c f , and in the expression for the breakage frequency function, Equation (16), the term multiplying the integral accounts for binary breakage.
The coalescence birth and death rates are obtained with the Prince and Blanch coalescence kernel [36] and they read as:
B C D C = 1 2 0 d c ( ( d 3 δ 3 ) 1 3 , δ ) n ( ( d 3 δ 3 ) 1 3 ) n ( δ ) d δ n ( d ) 0 c ( d , δ ) n ( δ ) d δ ,
where c is the aggregation kernel obtained from the product of the collision frequency and the coalescence efficiency. The expression for c becomes:
c ( d , δ ) = π 2 4 ε 1 3 ( d + δ ) 2 ( d 2 / 3 + δ 2 / 3 ) 1 2 exp ( γ ε 1 3 ρ L 1 2 σ 1 2 ( 1 d + 1 δ ) 5 6 ) ,
where the model constant, γ, in the exponential quantifying the coalescence efficiency, is equal to 1.7 and it contains the ratio between the initial and final liquid film thickness between colliding bubbles [36]. In both the breakup and the coalescence kernel formulations, the values of the parameters are assumed equal to those proposed by the authors, as previously done for bubbly flows in both vertical [37] and horizontal [38] pipes.
The population balance model described above was solved with the quadrature method of moments [39], QMOM, transporting the first six moments of the bubble number density function, thus obtaining three weights and three abscissas through the product–difference algorithm.
The iterative procedure for the bubble size determination based on the solution of the lumped parameter PBM is schematically shown in Figure 2.
The procedure starts by determining the turbulent dissipation rate in the static mixer zone through the solution of a single-phase simulation. Due to the relatively small amount of gas in the system, coalescence is not expected to occur away from the static mixer, due to the redistribution of the gas phase. For this reason, the bubble distribution produced close to the static mixer is hypothesized to be representative of the whole gas–liquid mixture downstream of the static mixer. The average turbulent dissipation rate, εI, is employed in the PBM to obtain a first-guess bubble Sauter mean diameter, d32I. This bubble size is then adopted in the gas–liquid CFD simulations to obtain a first-guess gas–liquid flow field from which the updated value of the average turbulent dissipation rate in the static mixer is calculated, εII. A new solution of the PBM is performed, and the resulting updated Sauter mean diameter, d32II, is compared with the first-guess bubble size, d32I. If relevant differences are observed between these two values, then a new gas–liquid simulation is performed with the updated bubble size, repeating the procedure until the first-guess and updated bubble sizes are sufficiently similar. At this point, the gas–liquid simulation with the converged Sauter mean diameter is run coupling the interphase mass transfer model.

4. Numerical Solution

The computational model presented in Section 3 was numerically solved in the CFD software ANSYS Fluent 2020 R2. The domain described in Section 2 was discretized with a mesh of 1.5 million cells, and details of the mesh close to the static mixer are reported in Figure 1b. In a previous study [23], in different operative conditions, this grid produced mean and fluctuating velocity profiles that reasonably agreed with the experimental results. The volume around the static mixer was discretized with tetrahedral cells, while in the rest of the domain, hexahedral cells were employed. The cell nodes at the interface between tetrahedral and hexahedral cells matched univocally, thus producing a conformal mesh.
No-slip boundary conditions were enforced on the solid walls of the domain, the inlet was modelled as a velocity inlet with a uniform velocity profile and uniform gas volume fraction distribution and the outlet as a pressure outlet with a 0-gauge pressure. The length of the pipe upstream of the static mixer allowed us to obtain a fully developed flow before reaching the mixer.
The second-order upwind scheme was adopted for discretizing the divergence of the variables, except for the gas volume fraction for which the QUICK scheme was employed; the diffusive terms were discretized with the central difference scheme and the gradients were discretized with the cell-based least square scheme. A pressure-based solver was used, and the pressure interpolation was achieved with the PRESTO! scheme. A pseudo-transient approach was adopted, with a pseudo-time-step of 0.001 s. Convergence was assessed once the scaled residuals reach a constant value, which was of the order of 10−5 in each case. Moreover, gas and liquid velocity profiles and gas volume fraction were monitored in several points of the domain, and the simulations were stopped once those values reached a plateau. It was verified that the total mass flow entering the system equalled the mass at the outlet, to rule out mass imbalance.
The PBM was solved in MATLAB R2021b with the Adams–Bashforth–Moulton variable-step, variable-order solver of orders 1 to 13, ode113, with an absolute and relative error tolerances of 10−8. Steady state was assumed when the moments evolution in time reached a plateau and the final resolution time underwent a sensitivity study to confirm that the solution did not depend on the integration time.

5. Results and Discussion

In this section, firstly, the bubble Sauter mean diameters as predicted by the lumped parameter PBM are presented for each operative condition. The gas volume fraction distribution inside the pipe is shown, and the homogeneity of the distribution is assessed. Then, the volumetric mass transfer distributions and the oxygen concentrations in both phases are presented and the OTR profiles are reported. Lastly, the local OTR is analyzed and the effect of the gas accumulation behind the static mixer on the mass transfer phenomena are discussed and a geometrical modification based on the local fluid dynamics is proposed.

5.1. Bubble Size and Gas Volume Fraction Distribution

The procedure described in Section 3.3 was adopted to obtain the bubble Sauter mean diameter in the operative conditions considered. Single-phase simulations were run with a liquid flow rate of 25 m3/h and 30 m3/h, respectively, to obtain the mean turbulent dissipation rate in the static mixer zone, εSM. The results of the procedure are shown in Table 1.
The predicted d32 obtained from the εSM calculated from single-phase simulations is equal to 0.74 mm and 0.52 mm for the case of a liquid flow rate equal to 25 m3/h and 30 m3/h, respectively, and the corresponding bubble terminal velocity, Ut, is equal to 8.4 cm/s and 5.8 cm/s. Two gas–liquid simulations were then run with these bubble sizes and with gas flow rates equal to 3.75 L/min and 7.5 L/min, respectively, as described in Section 2. The turbulent dissipation rate shown in Table 1 is obtained by averaging the dissipation of the fluids in the static mixer region. In this region, turbulent dissipation rates considerably higher than in the bulk of the system are found, as similarly observed in stirred tanks [24]. The dissipation rates obtained from gas–liquid simulations were found to be close to the values obtained in single-phase conditions, with deviations of a few % in both the investigated cases. Consequently, a further iteration of the procedure to determine the bubble size returned d32 and terminal velocities that differed less than 5% from the results obtained in single-phase conditions. For these reasons, additional gas–liquid simulations with updated bubble sizes were not performed. The results of the gas–liquid simulations obtained with d32 derived from single-phase simulations were then analyzed and are described in the following section.
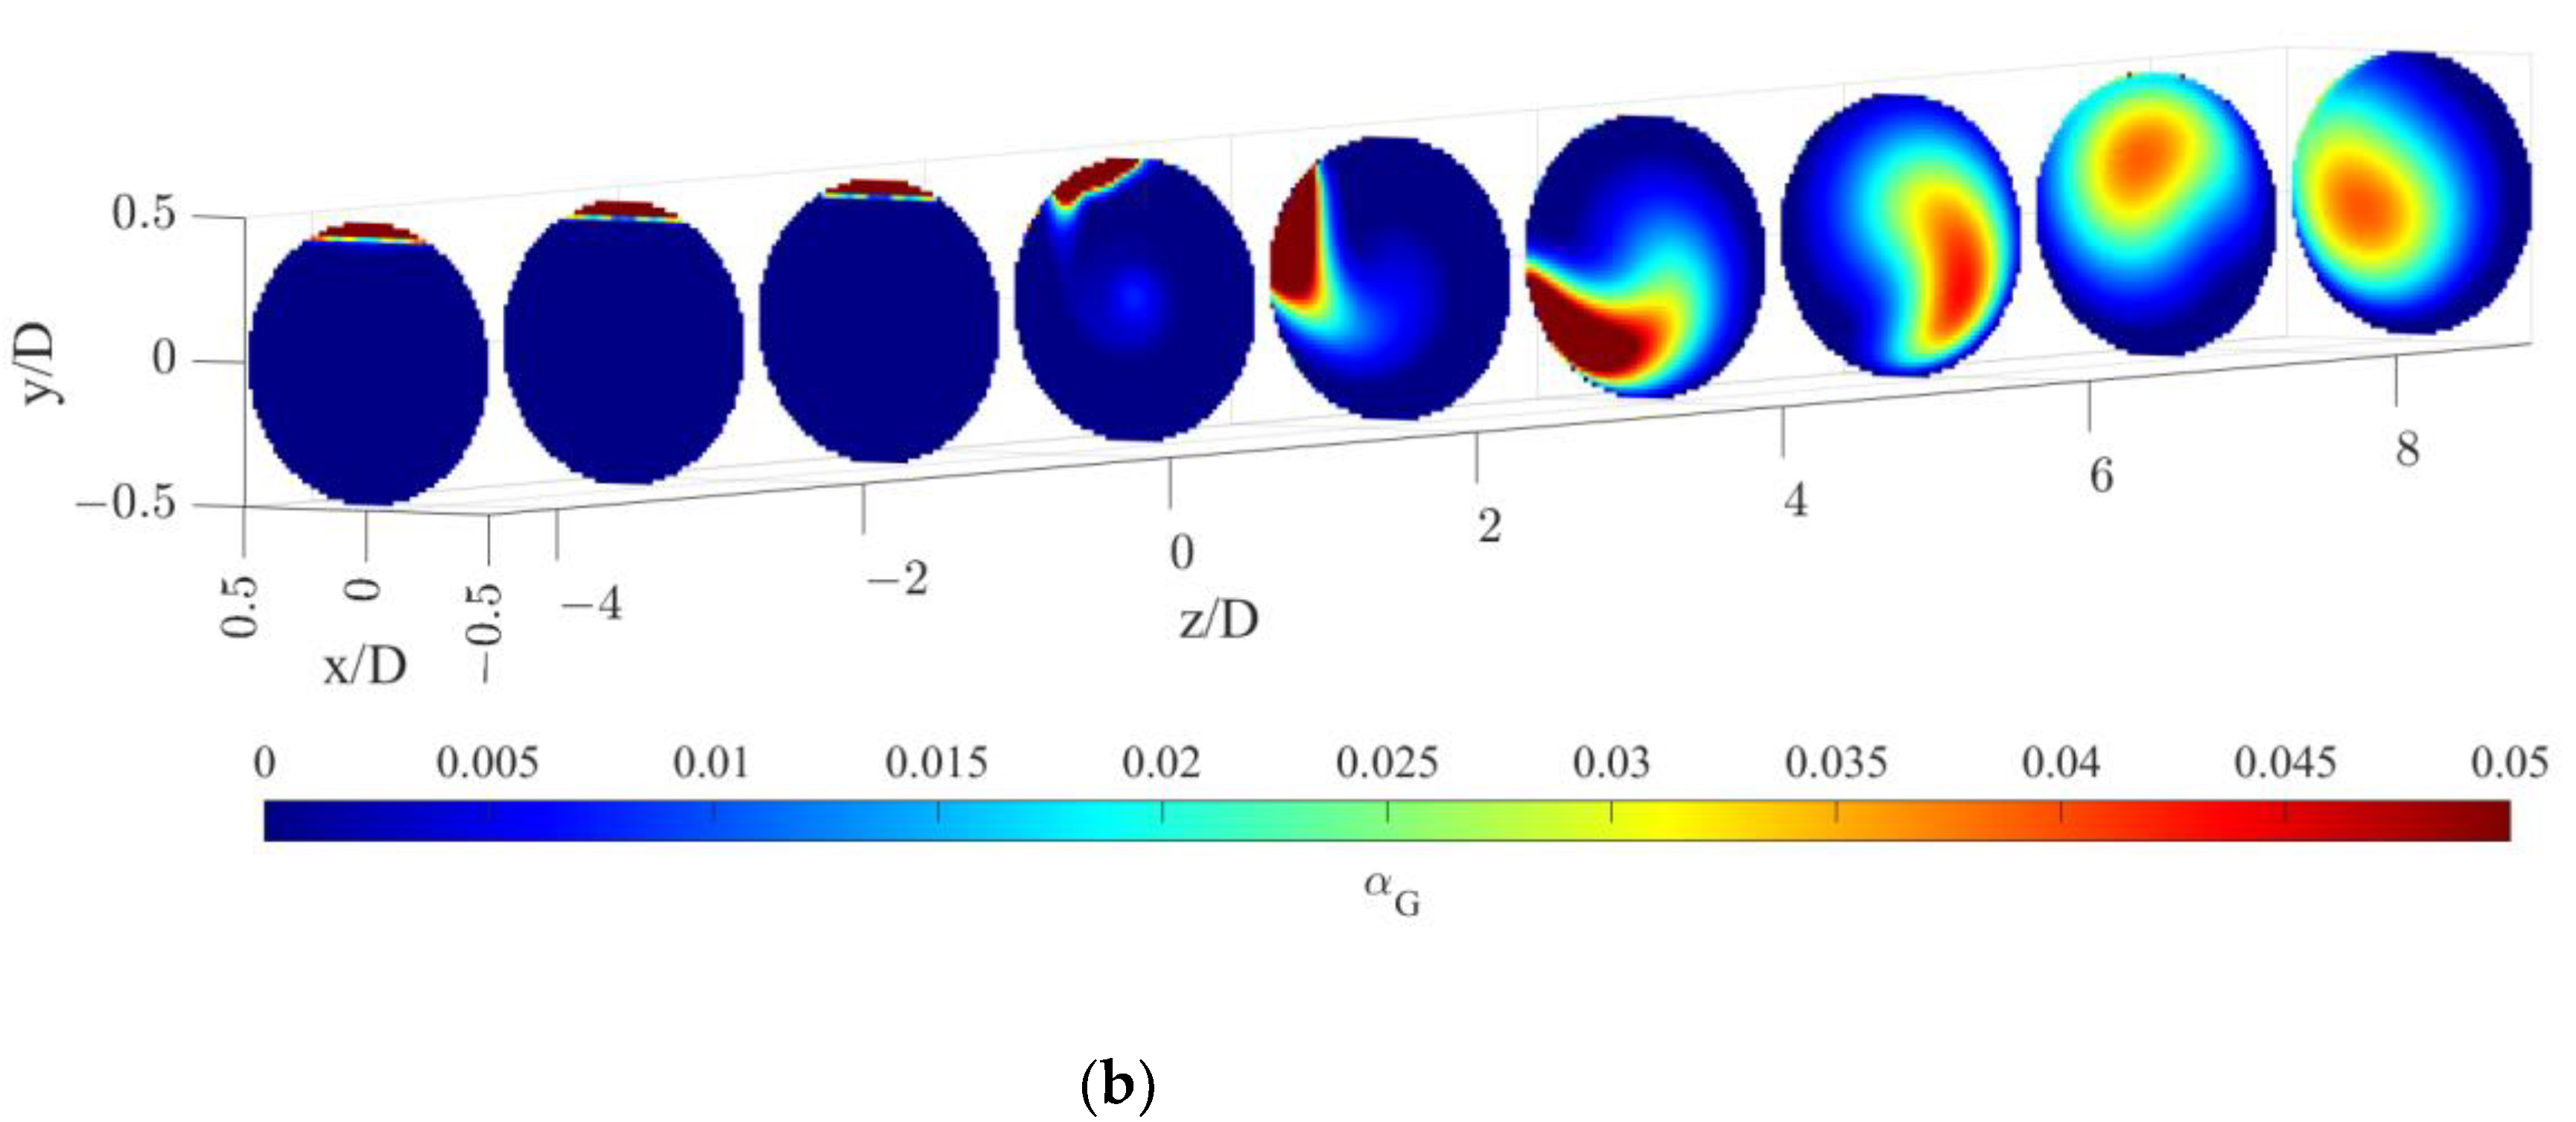
The gas volume fraction distributions for both operative conditions are reported on radial cutaway surfaces in Figure 3.
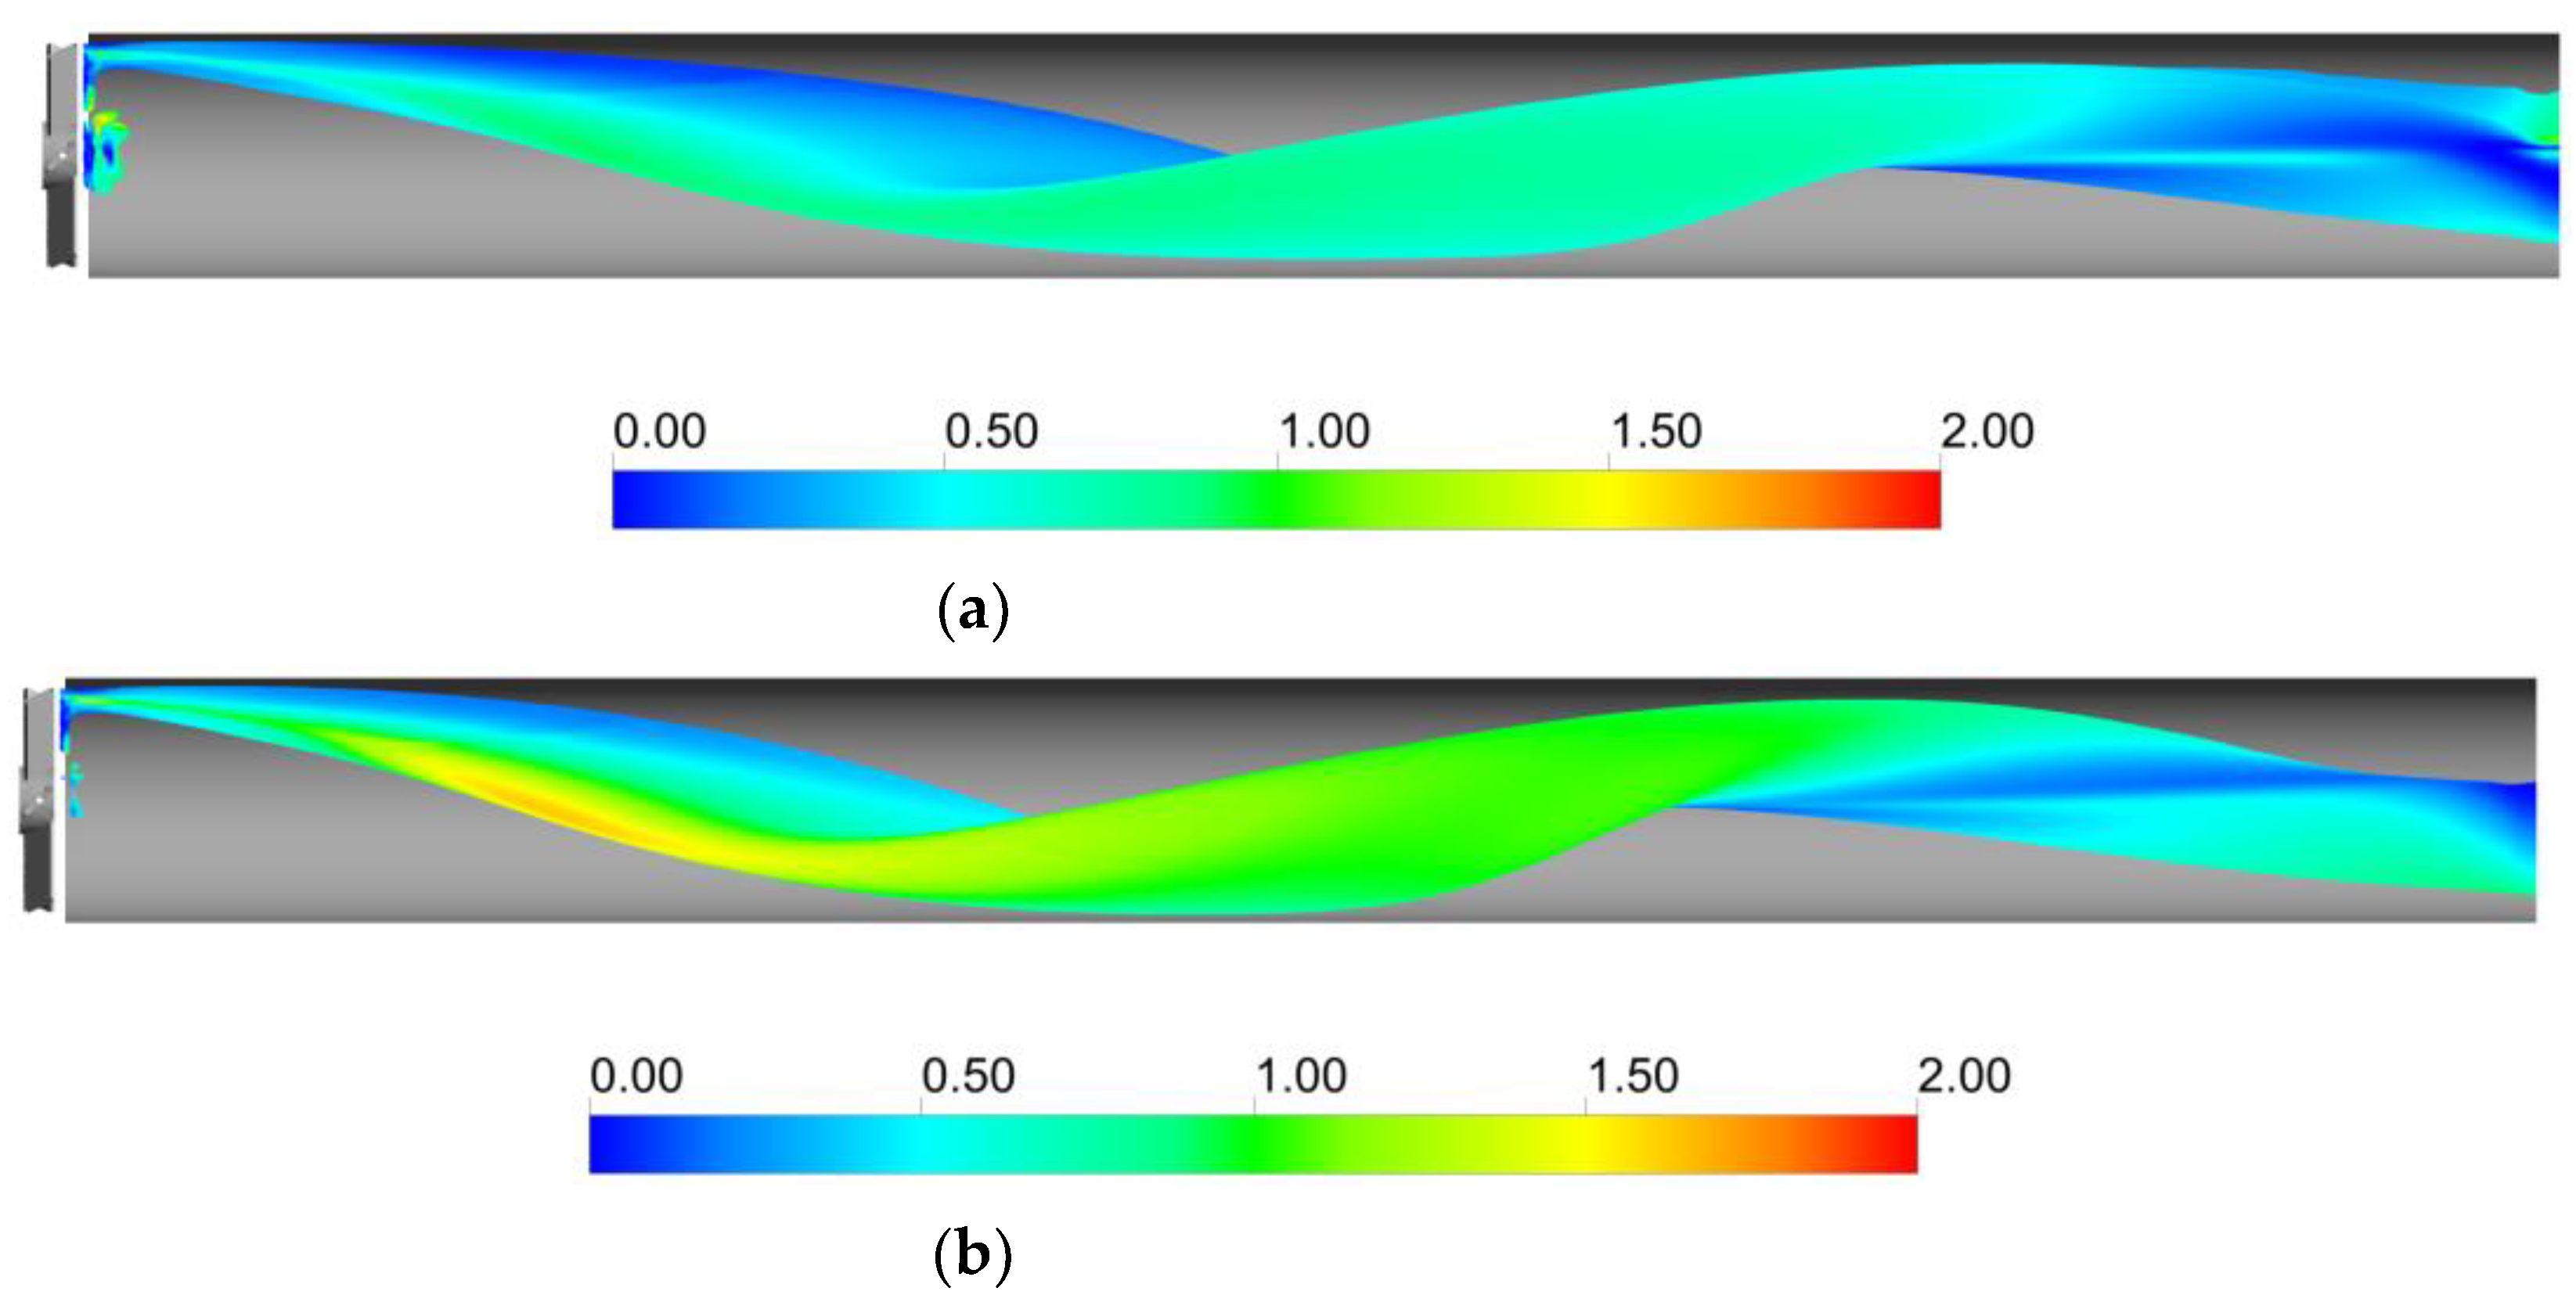
Figure 3 clearly shows that, upstream of the static mixer, gas accumulates in the upper part of the pipe. As the gas reaches the mixing device, it starts rotating in a counterclockwise direction, due to the swirl motion generated by the mixer blades. This motion, also confirmed by the analysis of gas volume fraction iso-surfaces along the axial coordinate, fosters the distribution of the gas phase evident at around four pipe diameters downstream of the mixer. The lighter phase then tends to move towards the pipe center due to the centripetal accelerations that overcome the gravitational acceleration acting on the bubbles, as shown in Figure 4. This behavior is well known [23], and it may be exploited to remove the oxygen-exhaust gas phase in a further downstream pipe section. The general behavior at non-dimensional axial coordinates higher than eight is qualitatively similar to the distributions at high axial coordinates shown in Figure 3. To study the further segregation due to the fading effect of the static mixer, a longer domain must be studied, and the extension of the effect of the static mixer may be studied in future works.
Figure 4 shows that the ratio between centripetal acceleration and gravitational acceleration is close to one away from the pipe axis, while it reaches values close to zero in the central part of the pipe. The intensity of the swirling motion generated by the static mixer is therefore sufficient to overcome the buoyancy force, since in most of the volume downstream of the static mixer, the ratio between the centripetal and gravitational acceleration is relatively close to one. Together with the action of the turbulent dispersion force, this allows the gas to be distributed more homogeneously downstream of the static mixer.
To quantitatively assess the homogeneity of the gas distribution, a weighted coefficient of variation of the gas volume fraction, CoV, was calculated in the sections of the pipe in both operative conditions. The weighted CoVi on the i-th section is defined as:
C o V i = 1 α G , i 1 j = 1 N i V j j = 1 N i V j ( α G , j α G , i ) 2 ,
with N i being the number of cells in section i, V j being the j-th cell volume, α G , j being the gas volume fraction in the j-th cell, and α G , i being the average gas volume fraction in the section. The CoV profiles are shown in Figure 5.
Figure 5 shows that a very similar CoV trend is obtained in the operative conditions considered. After an initial CoV increase due to gas accumulation in the upper part of the pipe, the gas is rapidly dispersed by the static mixer, producing a sudden drop in the CoV slightly before the mixer position. The CoV then gradually decreases to a value around 0.1 at about five pipe diameters downstream of the static mixer. This axial coordinate is consistent with the observations in Figure 3, where the segregation was observed up until a z/D of four. At higher axial coordinates, the CoV barely changes, with it reaching a value 90% lower than the conditions before the mixer. This 90% reduction in the CoV may serve as a performance index of the device and it may be compared to other devices typically adopted in process applications.
In the current study, the computational domain is limited to 10 pipe diameters downstream of the static mixer. In the end section of the pipe, the two fluids are still relatively homogeneously dispersed, with a coefficient of variation at 10 pipe diameters downstream of the static mixer still being similar to the CoV at around 6 pipe diameters. Clearly, the two fluids will undergo segregation as the fluids move away from the static mixer. From an operative point of view, a second static mixer can be employed, once the fluids are completely segregated, to foster an additional homogenization step. The axial distance at which segregation of the two fluids is recovered might be studied in future works, to provide an operative insight into the distance at which an additional static mixer may be needed.
At small positive axial, coordinates an increasing trend in the CoV is observed, which is more evident in the low fluids flow rates conditions. This hill is generated by the accumulation of the gas phase in the wake of the central hub of the static mixer, which produces a zone of low pressure, in which the gas is entrained. The effect of this zone on the oxygen mass transfer rate is discussed in the following sections.

5.2. kLa and Mass Transfer Rate

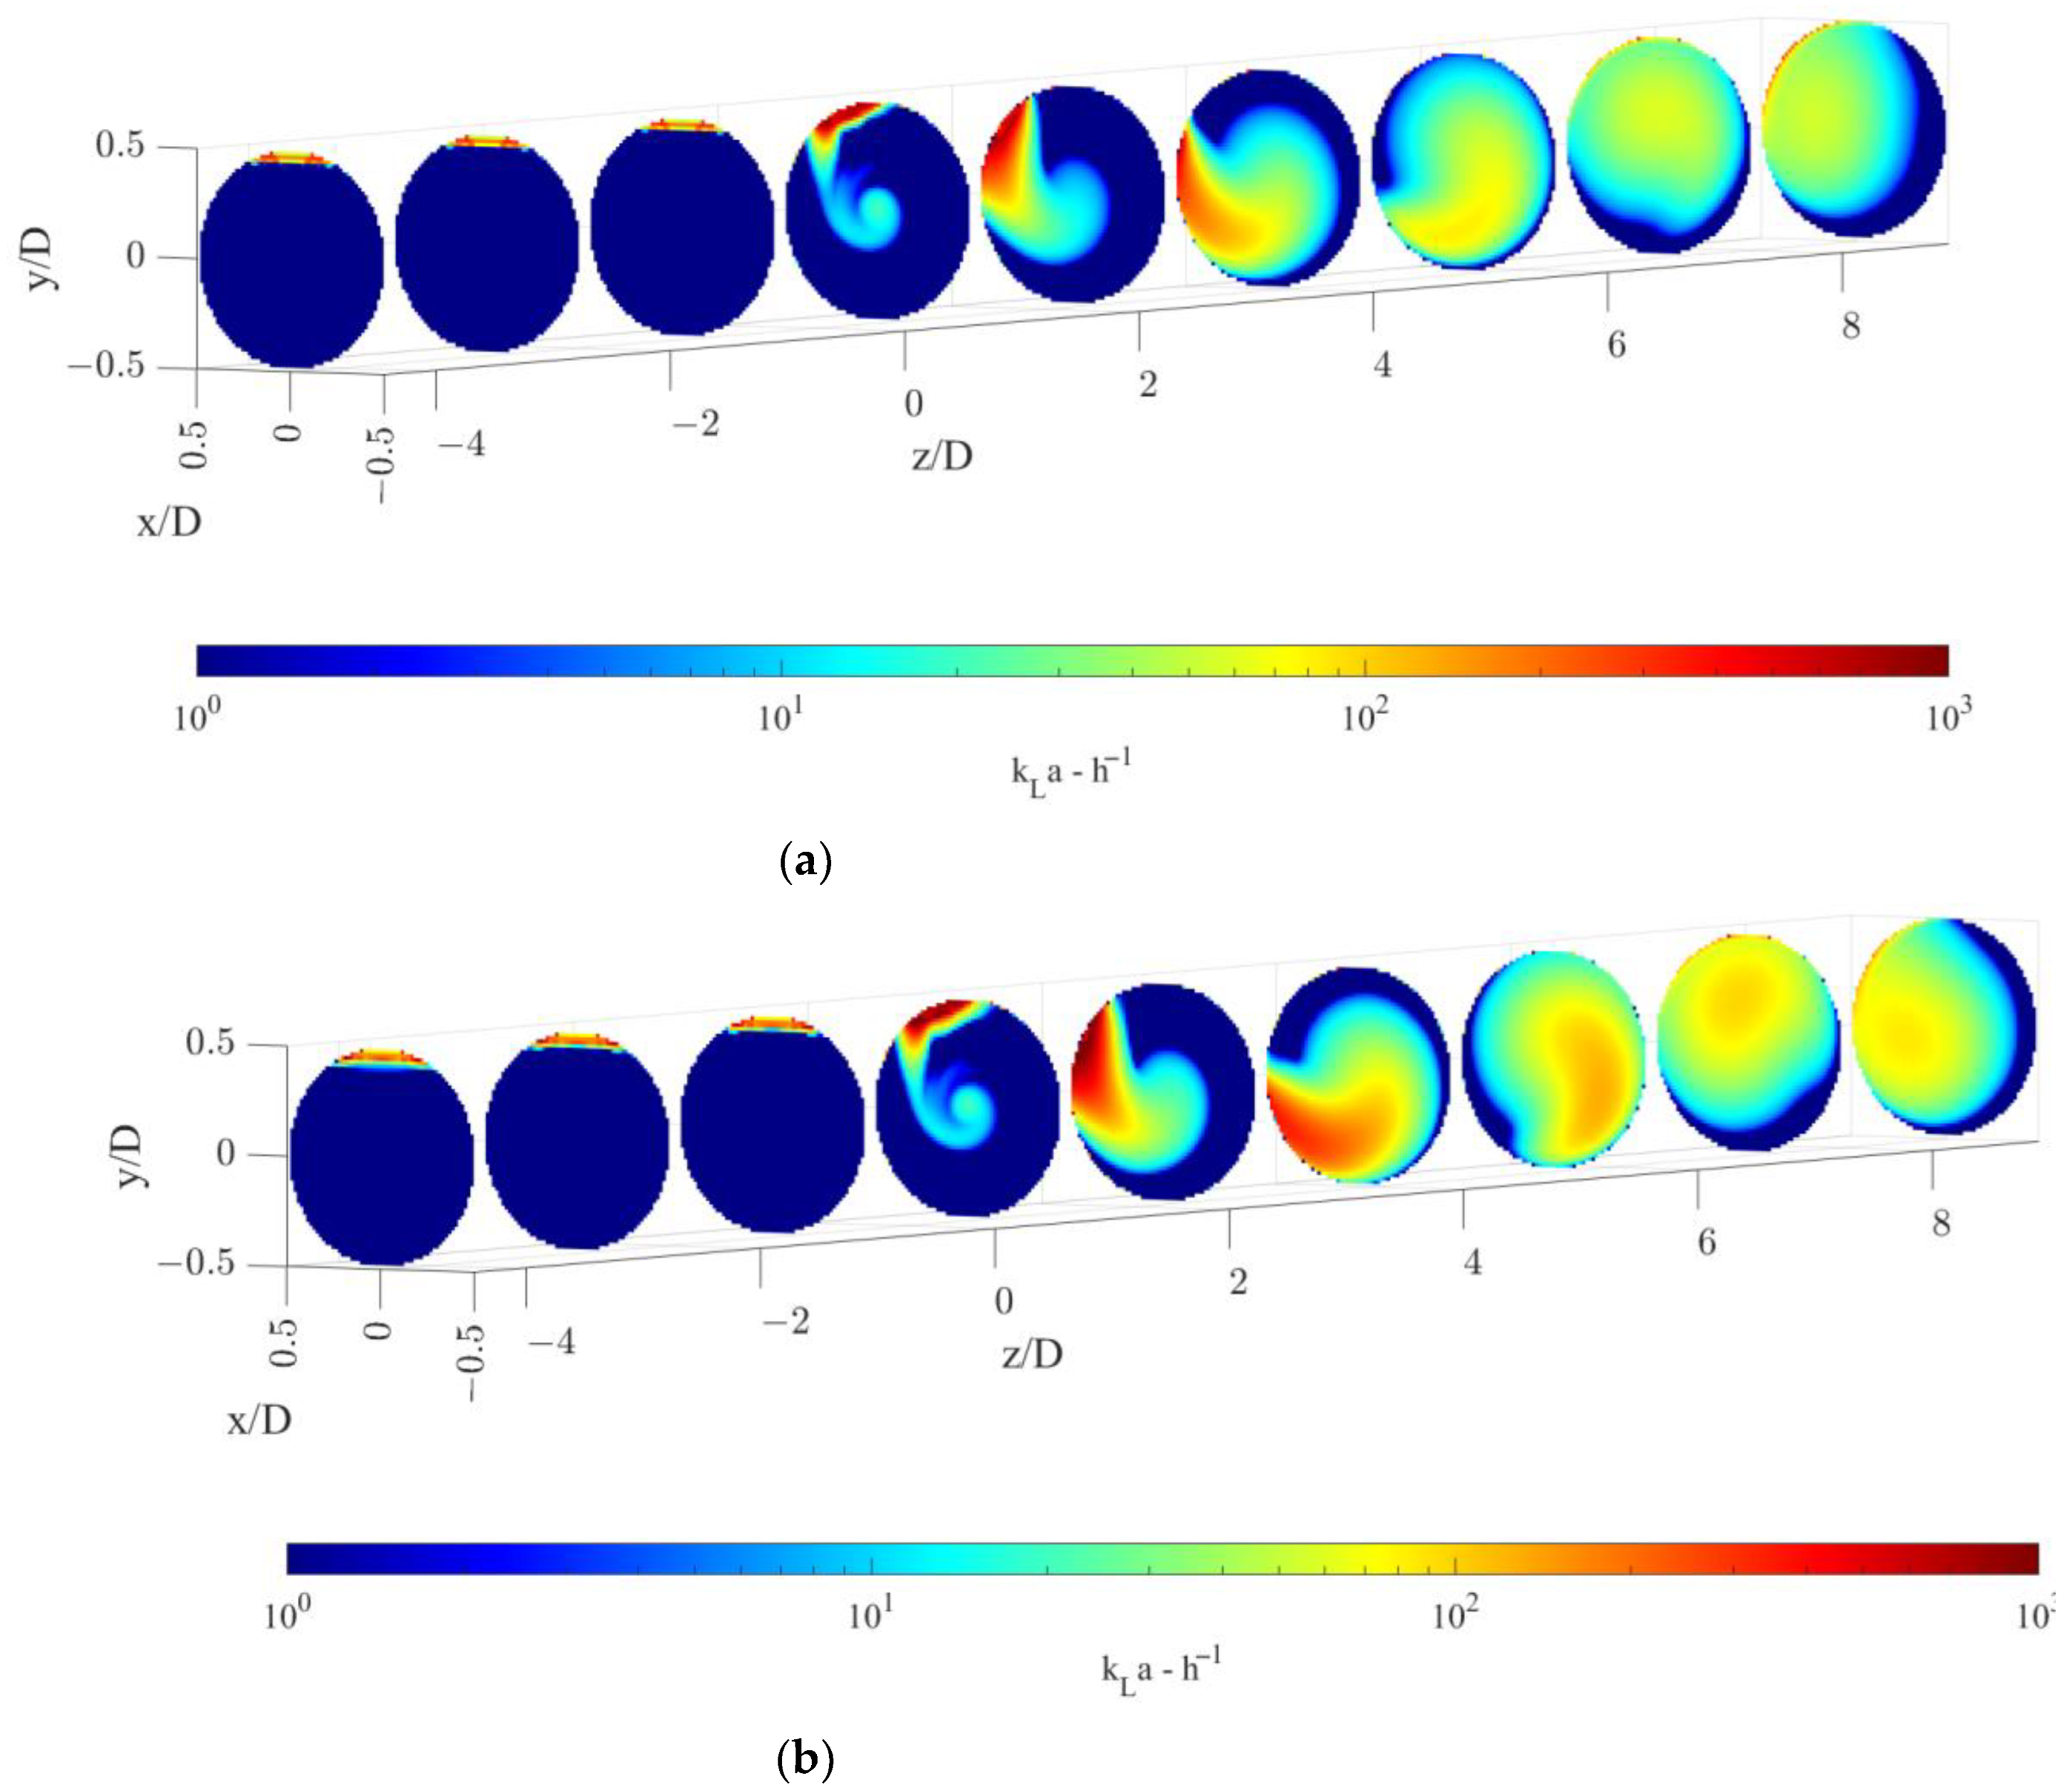
The volumetric mass transfer coefficient, kLa, calculated with the modelling approach described in Section 3.2 is shown on radial cutaway surfaces in Figure 6, for the two operative conditions considered.
Figure 6 shows that a relevant increase in the kLa is observed downstream of the static mixer. In particular, two distinct zones are discernible, the first being the zone between the static mixer and around two pipe diameters downstream of the device and the second being at higher axial coordinates. In the first zone, the gas is still largely segregated, and it has not undergone a substantial distribution. In this zone, the main contribution to the volumetric mass transfer coefficient is given by the central zone of the pipe and the gas accumulated in the top part of the tube that starts rotating due to the swirling motion of the static mixer. Local high kLa values are present alongside zones of nearly zero kLa values. After about two pipe diameters, the gas is more homogeneously distributed leading to a subsequent increase in the volumetric mass transfer coefficient in the whole pipe volume. At axial coordinates between 4–6 pipe diameters, almost all the pipe section encounters significant kLa values. In this latter section, inhomogeneities in the volumetric mass transfer coefficient are present and kLa maximum values are found in correspondence to the highest values of the gas volume fraction, as it can be observed when comparing the gas volume fraction distribution in Figure 3.
The profiles of liquid side mass transfer coefficient, kL, and the specific interfacial area, a, for the two operative conditions considered are reported in Figure 7.
Figure 7 shows that different trends are observable for kL and a in the sections downstream of the static mixer. At lower axial coordinates, high liquid side mass transfer coefficients are found due to the high turbulence dissipation rates generated by the static mixer, and relatively low specific interfacial areas are present due to the low dispersion of the gas phase. Conversely, at higher axial coordinates the inverse is obtained, since the turbulent energy is mostly dissipated close to the mixer, but in turn, the gas phase is more homogeneously distributed downstream. These trends limit the volumetric mass transfer coefficient, which is alternatively controlled either by a or kL. Nonetheless, the kLa values found in the system are comparable to those obtained with other static mixer designs [40].
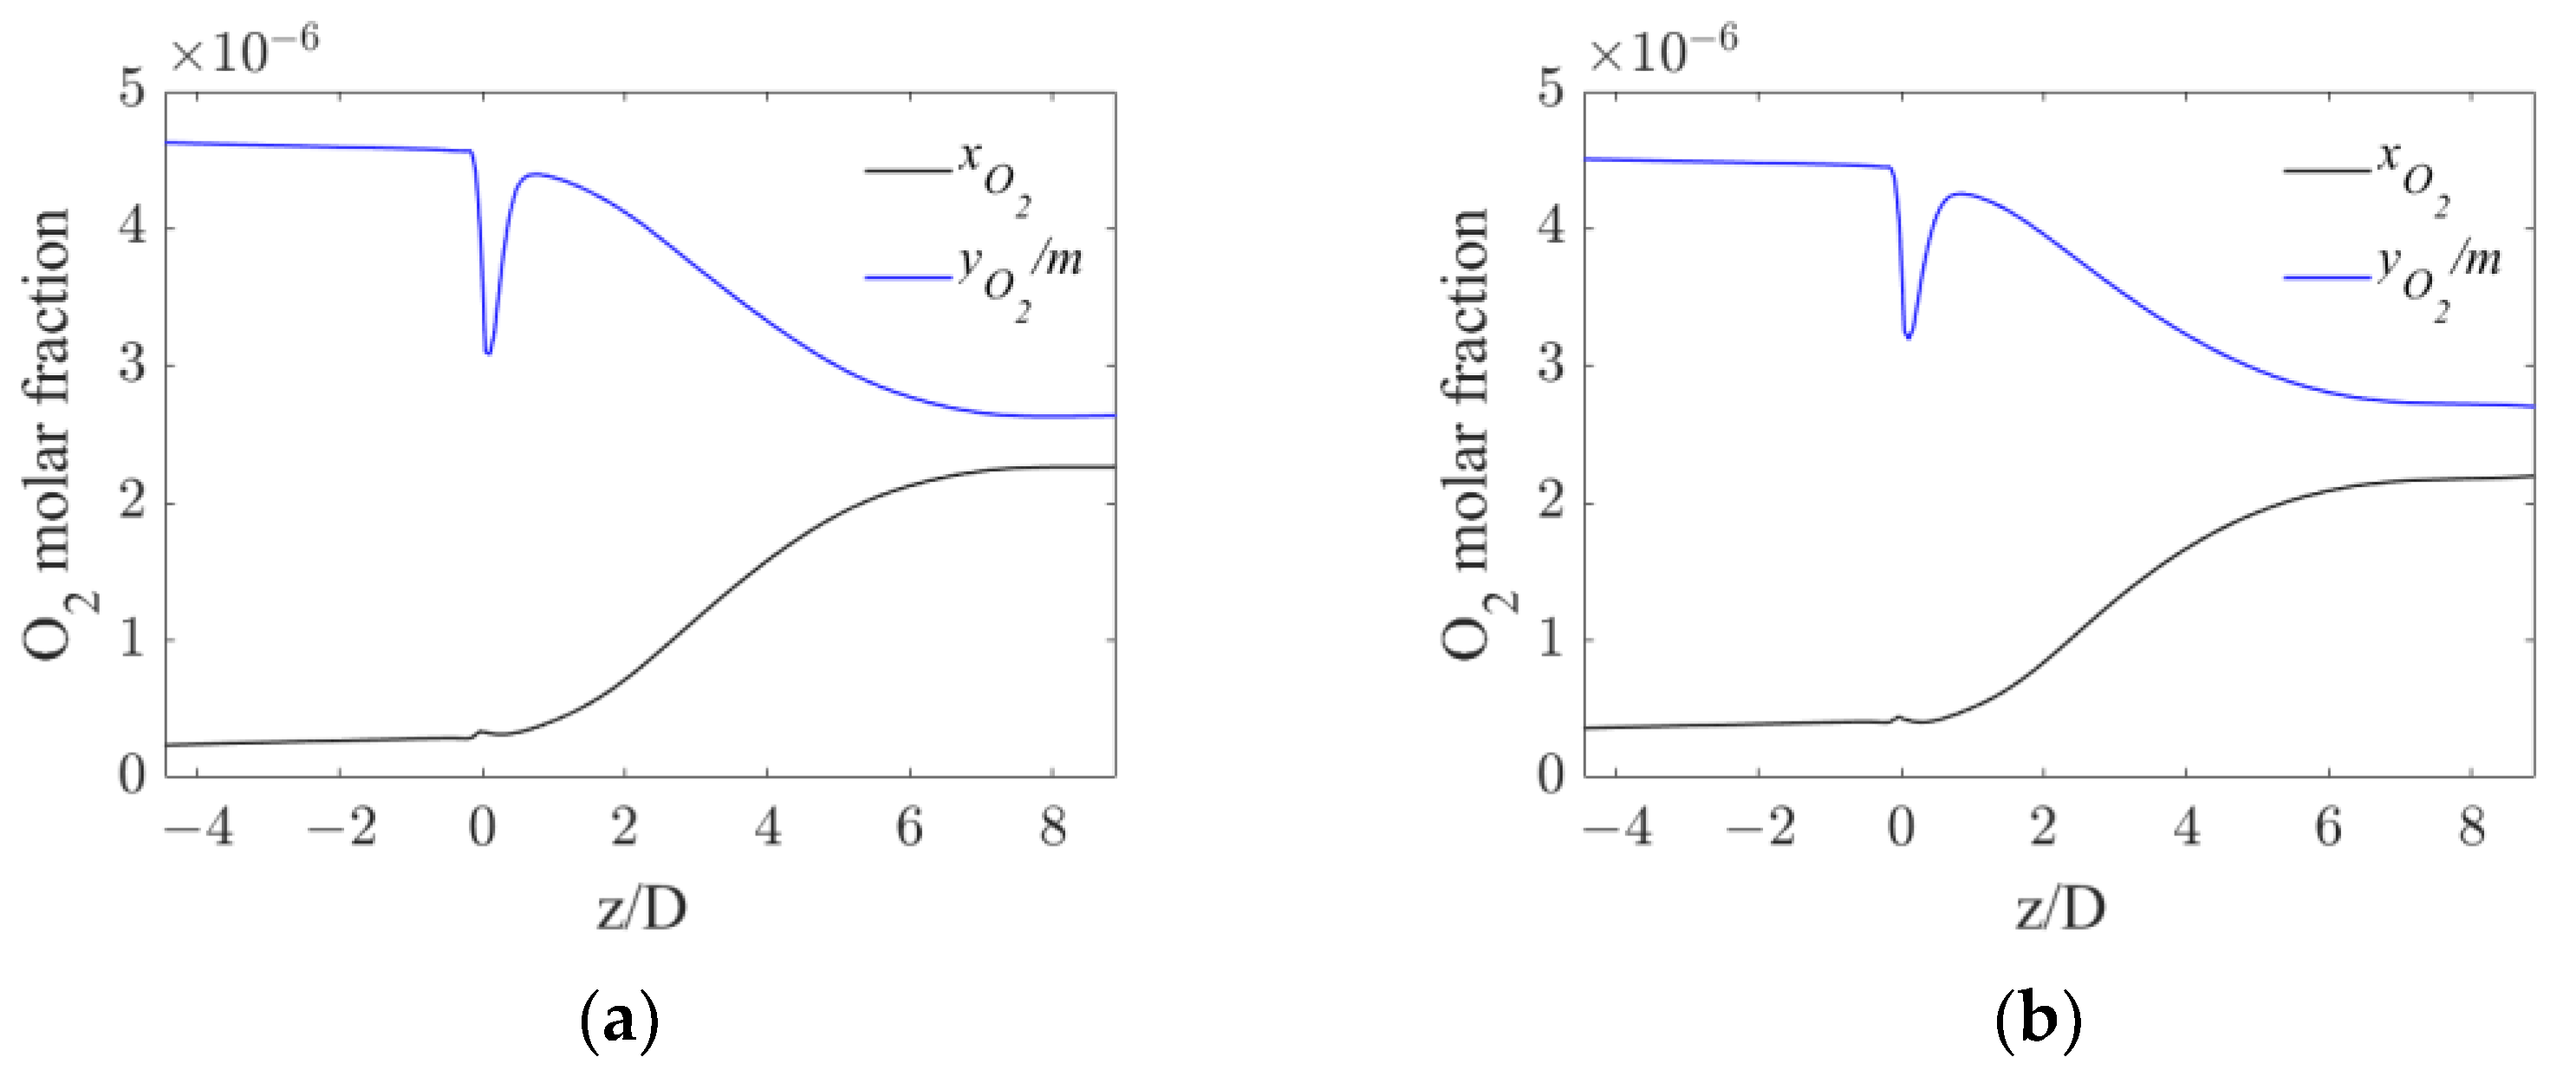
Alongside the analysis of the volumetric mass transfer coefficient, the resulting oxygen concentrations in the gas and liquid phase were also investigated. The equilibrium concentration obtained as the ratio between the oxygen mole fraction in the gas phase and m is shown together with the oxygen mole fraction in the liquid phase in Figure 8, where their axial profiles are reported.
The profiles in Figure 8 show that in both operative conditions before the static mixer, the concentration profiles are flat, meaning that very little oxygen is transferred from the gas to the liquid phase. Right after the mixer, a constant increase in the oxygen in the liquid phase is observable, due to the enhanced interphase mass transfer driven by the increase in kLa. At axial coordinates around six pipe diameters downstream of the mixer, the concentration profiles reach a plateau due to the reduced mass transfer driving force. In fact, the small differences between the equilibrium and the liquid oxygen mole fraction observable at high axial coordinates, together with the significant values of kLa in the same region observed in Figure 6, suggest that the oxygen transfer rate at high axial coordinates is limited by the driving force, rather than the interphase mass transfer coefficient.
The axial profiles of the OTR, kLa, and driving force are shown for the two operative conditions considered in Figure 9.
Figure 9 shows that, in both operative conditions, upstream of the static mixer, negligible OTRs are the result of the small volumetric mass transfer coefficient. As expected, despite a high interphase mass transfer driving force, the complete segregation of the two phases controls the OTR. Right after the static mixer, the OTR is governed by the relatively small specific interfacial area that limits the OTR, as shown in Figure 6. The OTR then increases sharply up to a z/D of around four, where the depletion in the oxygen concentration in the gas phase observed in Figure 8 reduces the driving force and the increase in the oxygen concentration in the liquid phase, leading to a steady decrease in the OTR. It is worth observing that in case of a chemical reaction in the liquid phase, good oxygen transfer might be expected far away from the static mixer, due to oxygen consumption. The comparison of the two operative conditions in Figure 9 provides a quantitative evaluation of the expected higher value of the OTR with higher fluid flow rates. Moreover, in the pipe section just downstream of the mixer, a sudden reduction in the OTR is visible for both operative conditions. The causes of this reduction and a local analysis in this zone of the system are investigated in the following section.

5.3. Local Analysis of the Interphase Mass Transfer Phenomena

From the axial profiles in Figure 9, it is evident that the sudden increase in the OTR observed at the static mixer axial coordinate is driven by the rapidly increasing kLa. The local kL and a distributions in the proximity of the static mixer are shown in Figure 10.
Figure 10 shows that high local values of kL are found in the static mixer zone and downstream, due to high local turbulent dissipation rates. In the operative conditions with the lower fluids flow rates, as shown in Figure 10a, a larger zone with low kL values is found towards the pipe center, with respect to the other operative condition, Figure 10c. In fact, the higher liquid flow rate generates more turbulence, while interacting with the static mixer, which thanks to its dissipation is more evenly distributed in the section. The turbulent dissipation also causes an axial turbulence decrease, as observable in both conditions, which in turn generates lower kL as the fluids move towards higher axial coordinates. For this reason, the pipe section with the highest liquid side mass transfer coefficient is the one closer to the static mixer.
Since as observed in Figure 3 the gas phase first rotates with the liquid phase, before being distributed in the section, relatively small a are found in the region just downstream of the static mixer, as observable in Figure 10b,d. Two zones of high specific interfacial area are found in both conditions, one behind the hub of the static mixer, where the gas locally accumulates due to the low pressure generated by the hub wake, and one towards the top of the pipe, where the gas pocket generated upstream of the mixer is still undergoing rotation. The combined effect of high local kL and a leads to high volumetric mass transfer coefficients in the close proximity of the mixer.
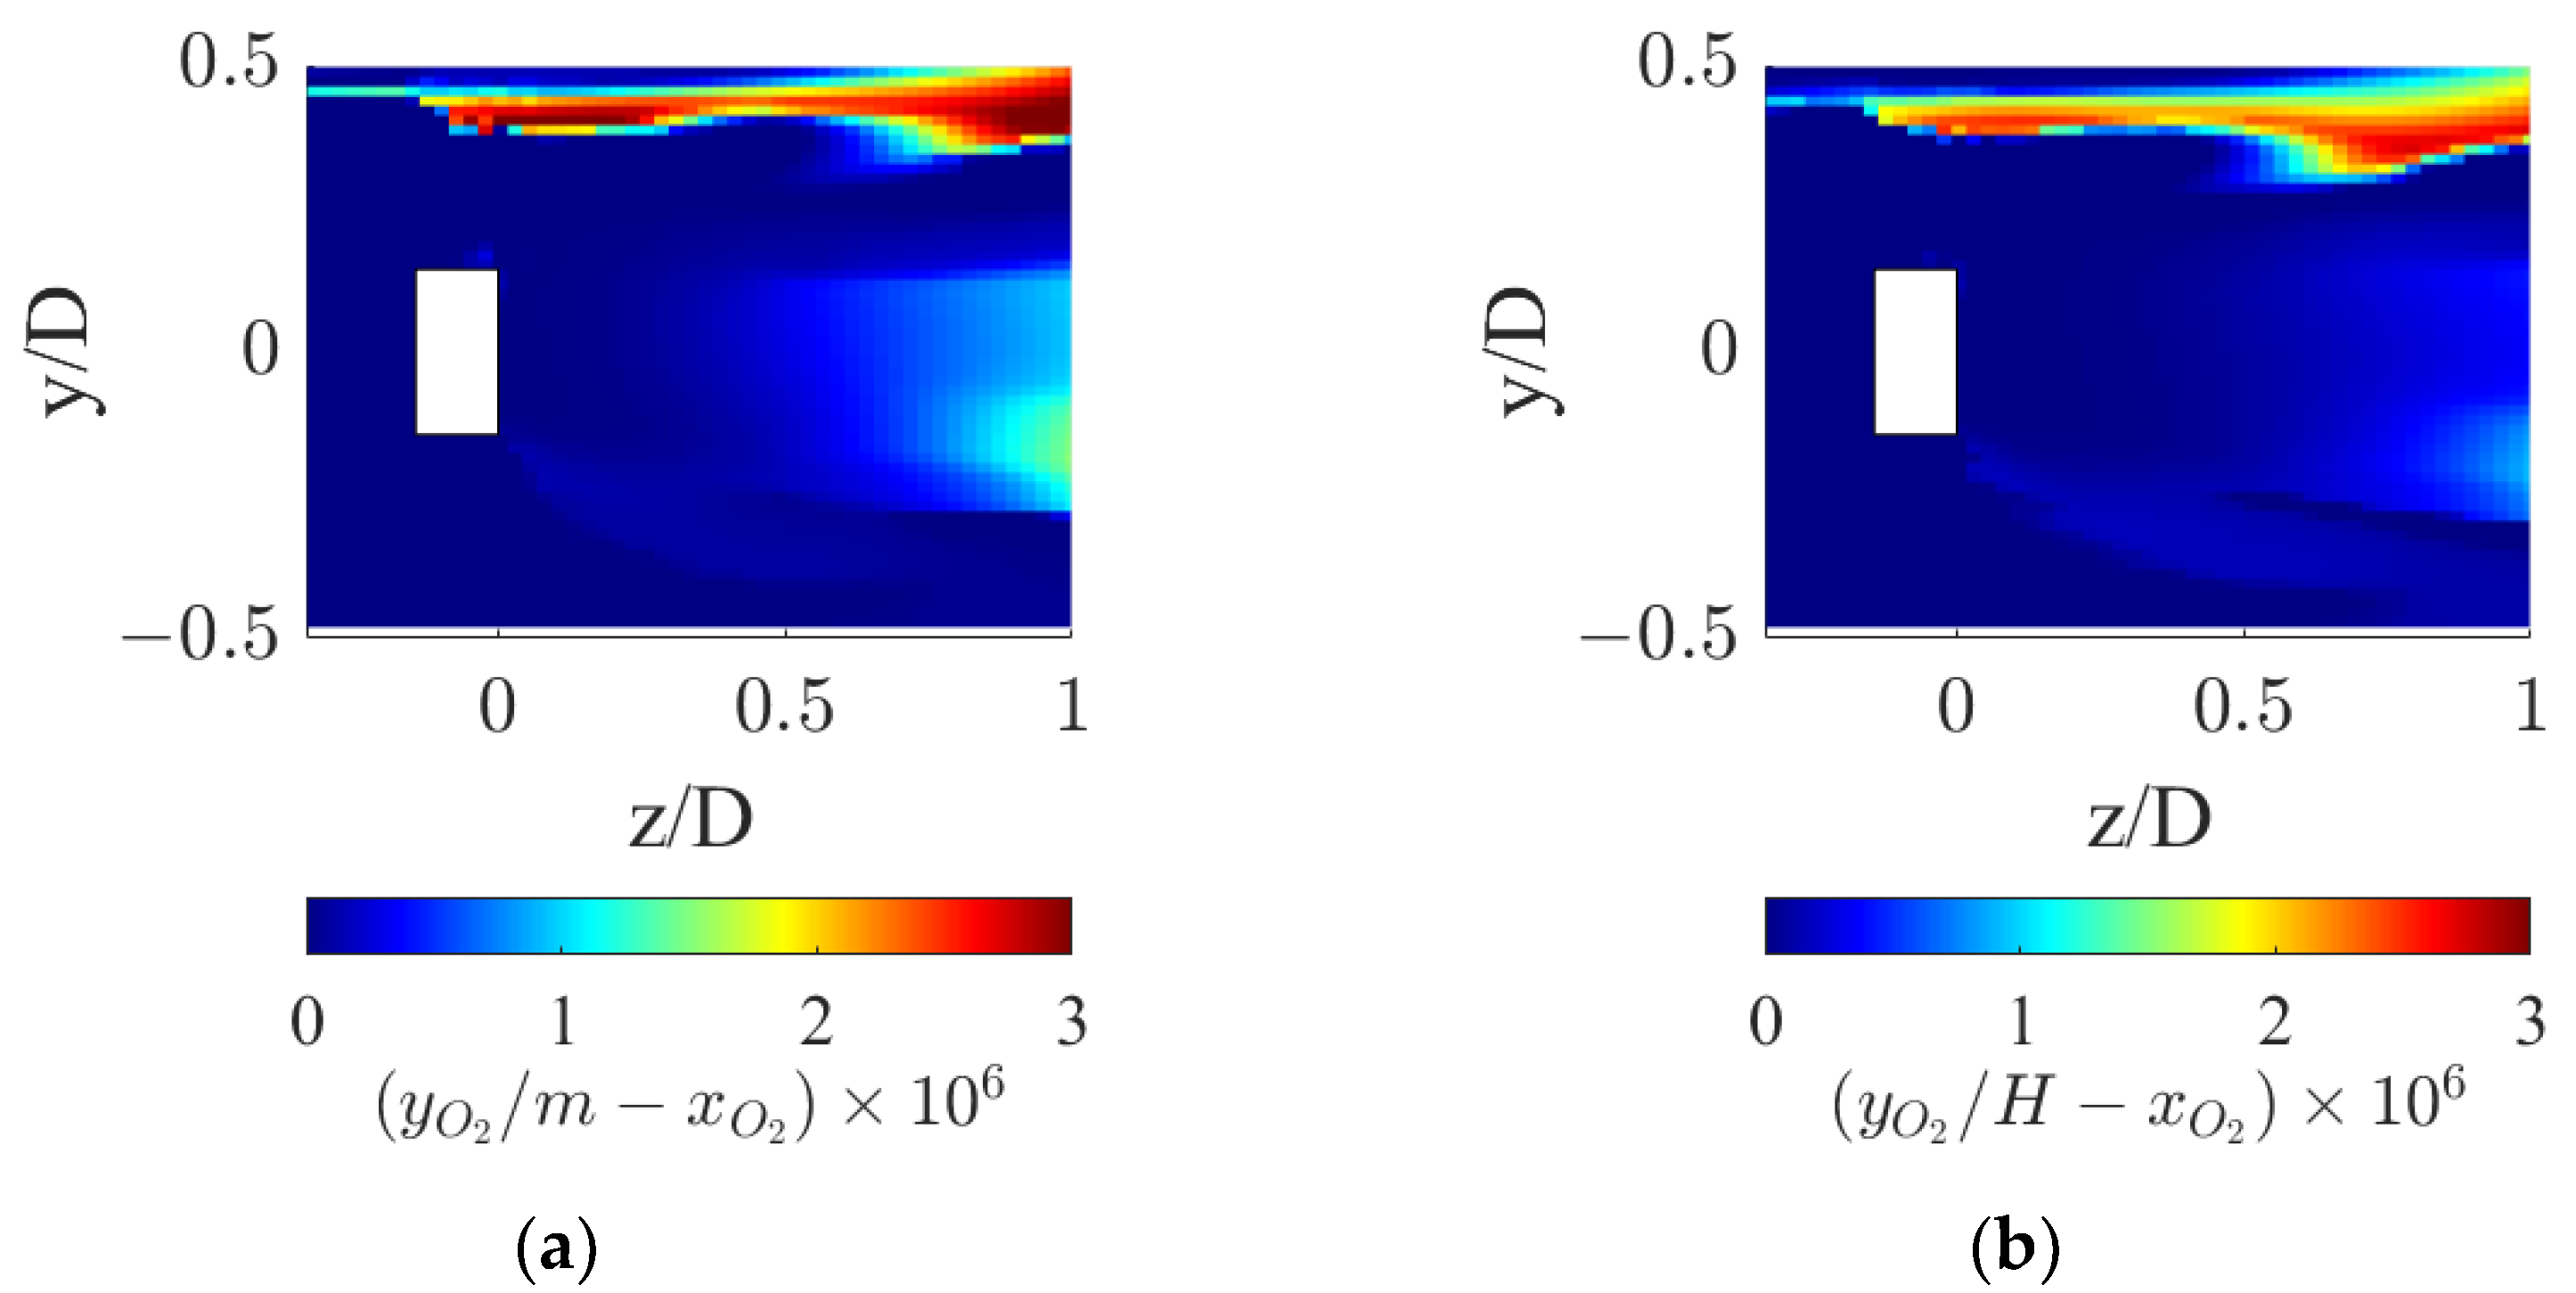
At axial coordinates matching the sudden peak in kLa shown in Figure 9, a corresponding sudden valley is found in the driving force profile. This reduction derives from the local drop in oxygen concentration in the gas phase coupled with the increase in the liquid phase, which drives the interphase mass transfer driving force to zero, as observable in Figure 11.
Figure 11 shows that the interphase mass transfer driving force is identically zero in the wake of the static mixer hub, where the gas accumulates. In fact, the recirculation zone leads to high local gas residence times, and this allows the oxygen in the gas phase to reach equilibrium with the oxygen in the liquid phase, thus locally zeroing the driving force.
A possible solution to limit the gas accumulation in the wake of the static mixer would be to adopt a holed hub, in order to suck the gas phase from the upper wall towards the center of the pipe. This geometrical feature would exploit the low-pressure zone downstream of the blade zone, thus improving the gas distribution in the section immediately downstream of the static mixer. Since in this section very high local kL values are found, an improvement in the OTR can be simultaneously driven by the enhanced volumetric mass transfer coefficient and by a local high interphase mass transfer driving force.
Other geometrical variations and the adoption of additional static elements along the pipe length would be appropriate depending on the relative flow rates of the liquid and of the gas phase and the total length of the available pipeline in industrial applications. For such design and optimization tasks, the simulation approach presented in this work might be particularly useful.

6. Conclusions

This study presents a computational procedure based on the lumped solution of a population balance model to determine the bubble size in gas–liquid systems with static mixers. The procedure is applied to a compact inline gas–liquid static mixer in two different operative conditions, and the resulting mass transfer phenomena are analyzed. The simulation method can be adopted to design the most appropriate static mixing system for obtaining effective dispersion and mass transfer with any combination of flow rates of the two phases.
The analysis of the simulation results highlights that:
  • Upstream of the static mixer, the gas bubbles accumulate towards the top of the pipe, resulting in a high coefficient of variations of the gas hold-up and low volumetric mass transfer coefficients, thus determining negligible oxygen transfer rates despite a high interphase mass transfer driving force;
  • Just downstream of the static mixer, the lighter phase starts to rotate following the liquid phase and gradually reduces the segregation, which lasts to axial coordinates up until 4–5 pipe diameters downstream of the static mixer. Despite the relatively high liquid side mass transfer coefficient, the oxygen transfer rate is limited by the available specific interfacial area;
  • At higher axial coordinates, the reduced interphase mass transfer driving force limits the oxygen transfer rate, even though very low coefficients of variations of the gas hold-up are found, indicating sufficient mixedness of the gas–liquid dispersion, together with relatively high values of kLa;
  • Modification of the hub geometry is suggested in order to better exploit the low-pressure region downstream of the static mixer to improve the gas distribution in the zone where kL is higher.
The local analysis of the process attainable with the developed CFD methodology allows us to troubleshoot and examine the local behavior of the gas–liquid fluid dynamics generated by the static mixer and to propose design solutions to improve oxygen transfer rates and the performances of the process.

Author Contributions

Conceptualization, A.P. and F.M.; methodology, F.M. and G.M; software, F.M.; investigation, F.M.; data curation, F.M., G.M. and A.P.; writing—original draft preparation, F.M.; writing—review and editing, A.P. and G.M. All authors have read and agreed to the published version of the manuscript.

Funding

This research received no external funding.

Data Availability Statement

The data presented in this study are available on request from the corresponding author.

Conflicts of Interest

The authors declare no conflict of interest.

References

  1. Thakur, R.; Vial, C.; Nigam, K.; Nauman, E.; Djelveh, G. Static Mixers in the Process Industries—A Review. Chem. Eng. Res. Des. 2003, 81, 787–826. [Google Scholar] [CrossRef]
  2. Van Gerven, T.; Stankiewicz, A. Structure, Energy, Synergy, Time—The Fundamentals of Process Intensification. Ind. Eng. Chem. Res. 2009, 48, 2465–2474. [Google Scholar] [CrossRef]
  3. Xu, Y.; Wang, L.; Wang, Y.; Qian, Y.; Wang, H.; Xu, Y.; Yang, X. Gas-liquid flow pattern identification and bubble characteristics analysis in a static mixer based HiPOxTM reactor. Chem. Eng. Sci. 2023, 267, 118269. [Google Scholar] [CrossRef]
  4. Schrimpf, M.; Esteban, J.; Rösler, T.; Vorholt, A.J.; Leitner, W. Intensified reactors for gas-liquid-liquid multiphase catalysis: From chemistry to Engineering. Chem. Eng. J. 2019, 372, 917–939. [Google Scholar] [CrossRef]
  5. Scala, M.; Gamet, L.; Malbec, L.-M.; Li, H.-Z. Hydrodynamics of gas-liquid dispersion in transparent Sulzer static mixers SMXTM. Chem. Eng. Sci. 2019, 213, 115398. [Google Scholar] [CrossRef]
  6. Tepper, M.; Eminoglu, Y.; Mehling, N.; Walorski, J.; Roth, H.; Wessling, M. Rotation-in-a-Spinneret integrates static mixers inside hollow fiber membranes. J. Membr. Sci. 2022, 656, 120599. [Google Scholar] [CrossRef]
  7. Lehwald, A.; Janiga, G.; Thévenin, D.; Zähringer, K. Simultaneous investigation of macro- and micro-mixing in a static mixer. Chem. Eng. Sci. 2012, 79, 8–18. [Google Scholar] [CrossRef]
  8. Alberini, F.; Simmons, M.; Ingram, A.; Stitt, E. Assessment of different methods of analysis to characterise the mixing of shear-thinning fluids in a Kenics KM static mixer using PLIF. Chem. Eng. Sci. 2014, 112, 152–169. [Google Scholar] [CrossRef] [Green Version]
  9. Alberini, F.; Simmons, M.J.H.; Ingram, A.; Stitt, E.H. Use of an areal distribution of mixing intensity to describe blending of non-newtonian fluids in a kenics KM static mixer using PLIF. AIChE J. 2013, 60, 332–342. [Google Scholar] [CrossRef] [Green Version]
  10. FEng, H.; Olsen, M.G.; Hill, J.C.; Fox, R.O. Investigation of passive scalar mixing in a confined rectangular wake using simultaneous PIV and PLIF. Chem. Eng. Sci. 2010, 65, 3372–3383. [Google Scholar] [CrossRef]
  11. Rabha, S.; Schubert, M.; Grugel, F.; Banowski, M.; Hampel, U. Visualization and quantitative analysis of dispersive mixing by a helical static mixer in upward co-current gas–liquid flow. Chem. Eng. J. 2015, 262, 527–540. [Google Scholar] [CrossRef]
  12. Jegatheeswaran, S.; Ein-Mozaffari, F.; Wu, J. Process intensification in a chaotic SMX static mixer to achieve an energy-efficient mixing operation of non-newtonian fluids. Chem. Eng. Process. Process. Intensif. 2018, 124, 1–10. [Google Scholar] [CrossRef]
  13. Jaworski, Z.; Pianko-Oprych, P.; Marchisio, D.; Nienow, A. CFD Modelling of Turbulent Drop Breakage in a Kenics Static Mixer and Comparison with Experimental Data. Chem. Eng. Res. Des. 2007, 85, 753–759. [Google Scholar] [CrossRef]
  14. Montante, G.; Carletti, C.; Maluta, F.; Paglianti, A. Solid Dissolution and Liquid Mixing in Turbulent Stirred Tanks. Chem. Eng. Technol. 2019, 42, 1627–1634. [Google Scholar] [CrossRef]
  15. Paglianti, A.; Carletti, C.; Montante, G. Liquid Mixing Time in Dense Solid-Liquid Stirred Tanks. Chem. Eng. Technol. 2017, 40, 862–869. [Google Scholar] [CrossRef]
  16. Maluta, F.; Paglianti, A.; Montante, G. RANS-based predictions of dense solid–liquid suspensions in turbulent stirred tanks. Chem. Eng. Res. Des. 2019, 147, 470–482. [Google Scholar] [CrossRef]
  17. Kumar, V.; Shirke, V.; Nigam, K. Performance of Kenics static mixer over a wide range of Reynolds number. Chem. Eng. J. 2008, 139, 284–295. [Google Scholar] [CrossRef]
  18. Byrde, O.; Sawley, M. Optimization of a Kenics static mixer for non-creeping flow conditions. Chem. Eng. J. 1999, 72, 163–169. [Google Scholar] [CrossRef]
  19. Visser, J.E.; Rozendal, P.F.; Hoogstraten, H.W.; Beenackers, A.A. Three-dimensional numerical simulation of flow and heat transfer in the Sulzer SMX static mixer. Chem. Eng. Sci. 1999, 54, 2491–2500. [Google Scholar] [CrossRef]
  20. Montante, G.; Coroneo, M.; Paglianti, A. Blending of miScible liquids with different densities and viscosities in static mixers. Chem. Eng. Sci. 2016, 141, 250–260. [Google Scholar] [CrossRef]
  21. Zidouni, F.; Krepper, E.; Rzehak, R.; Rabha, S.; Schubert, M.; Hampel, U. Simulation of Gas–Liquid flow in a helical static mixer. Chem. Eng. Sci. 2015, 137, 476–486. [Google Scholar] [CrossRef]
  22. Putra, R.A.; Neumann-Kipping, M.; Schäfer, T.; Lucas, D. Comparison of Gas–Liquid Flow Characteristics in Geometrically Different Swirl Generating Devices. Energy 2019, 12, 4653. [Google Scholar] [CrossRef] [Green Version]
  23. Maluta, F.; Paglianti, A.; Montante, G. Experimental and numerical study of a compact inline swirler for Gas–Liquid separation. Chem. Eng. Sci. 2023, 265, 118219. [Google Scholar] [CrossRef]
  24. Maluta, F.; Paglianti, A.; Montante, G. Towards a CFD-PBE simulation of aerated stirred tanks at high gas hold ups and different flow regimes. Chem. Eng. Res. Des. 2021, 180, 425–436. [Google Scholar] [CrossRef]
  25. Buffo, A.; Vanni, M.; Renze, P.; Marchisio, D. Empirical drag closure for polydisperse Gas–Liquid systems in bubbly flow regime: Bubble swarm and micro-scale turbulence. Chem. Eng. Res. Des. 2016, 113, 284–303. [Google Scholar] [CrossRef]
  26. Yacilom, A.M. Turbulence, 2nd ed.; McGraw-Hill Publishing Co.: New York, NY, USA, 1977. [Google Scholar] [CrossRef]
  27. Schiller, L.; Naumann, A. Über die grundlegenden berechnungen bei der schwerkraftbereitung. Z. Des Ver. Dtsch. Ing. 1933, 77, 318–321. [Google Scholar]
  28. Burns, A.D.; Frank, T.; Hamill, I.; Shi, J.-M.M. The Favre Averaged Drag Model for Turbulent Dispersion in Eulerian Multi-Phase Flows. In Proceedings of the Fifth International Conference on Multiphase Flow, Yokohama, Japan, 30 May–4 June 2004; pp. 1–17. [Google Scholar]
  29. Simonnet, M.; Gentric, C.; Olmos, E.; Midoux, N. Experimental determination of the drag coefficient in a swarm of bubbles. Chem. Eng. Sci. 2007, 62, 858–866. [Google Scholar] [CrossRef]
  30. Maluta, F.; Paglianti, A.; Montante, G. Prediction of gas cavities size and structure and their effect on the power consumption in a gas-liquid stirred tank by means of a two-fluid RANS model. Chem. Eng. Sci. 2021, 241, 116677. [Google Scholar] [CrossRef]
  31. Maluta, F.; Paglianti, A.; Montante, G. Two-fluids RANS predictions of gas cavities, power consumption, mixing time and oxygen transfer rate in an aerated fermenter scale-down stirred with multiple impellers. Biochem. Eng. J. 2020, 166, 107867. [Google Scholar] [CrossRef]
  32. Lamont, J.C.; Scott, D.S. An eddy cell model of mass transfer into the surface of a turbulent liquid. AIChE J. 1970, 16, 513–519. [Google Scholar] [CrossRef]
  33. Maluta, F.; Paglianti, A.; Montante, G. Modelling of biohydrogen production in stirred fermenters by Computational Fluid Dynamics. Process Saf. Environ. Prot. 2018, 125, 342–357. [Google Scholar] [CrossRef]
  34. Hänsch, S.; Lucas, D.; Krepper, E.; Höhne, T. A multi-field two-fluid concept for transitions between different scales of interfacial structures. Int. J. Multiph. Flow 2012, 47, 171–182. [Google Scholar] [CrossRef]
  35. Luo, H.; Svendsen, H.F. Theoretical model for drop and bubble breakup in turbulent dispersions. AIChE J. 1996, 42, 1225–1233. [Google Scholar] [CrossRef]
  36. Prince, M.J.; Blanch, H.W. Bubble coalescence and break-up in air-sparged bubble columns. AIChE J. 1990, 36, 1485–1499. [Google Scholar] [CrossRef]
  37. Cheung, S.C.; Yeoh, G.; Tu, J. On the numerical study of isothermal vertical bubbly flow using two population balance approaches. Chem. Eng. Sci. 2007, 62, 4659–4674. [Google Scholar] [CrossRef] [Green Version]
  38. Ekambara, K.; Sanders, R.; Nandakumar, K.; Masliyah, J. CFD simulation of bubbly two-phase flow in horizontal pipes. Chem. Eng. J. 2008, 144, 277–288. [Google Scholar] [CrossRef]
  39. Marchisio, D.L.; Fox, R.O. Computational Models for Polydisperse Particulate and Multiphase Systems; Cambridge University Press: Cambridge, UK, 2013. [Google Scholar] [CrossRef] [Green Version]
  40. Munter, R. Comparison of Mass Transfer Efficiency and Energy Consumption in Static Mixers. Ozone Sci. Eng. 2010, 32, 399–407. [Google Scholar] [CrossRef]
Figure 1. (a) Cutaway drawing of the pipe with the compact static mixer in red. The gas–liquid mixture enters from the left pipe opening. (b) Details of the mesh close to the static mixer.
Processes 11 00198 g001
Figure 2. Schematic diagram of the PBM-based iterative procedure for the bubble size determination and gas–liquid simulations.
Processes 11 00198 g002
Figure 3. Gas volume fraction distribution on radial pipe cutaway surfaces for the operative conditions considered: (a) QL = 25 m3/h and QG = 3.75 L/min; (b) QL = 30 m3/h and QG = 7.5 L/min. The static mixer is placed at −0.14 < z/D < 0 and the fluids are moving from left to right. The initial and final part of the pipe are omitted to improve readability.
Processes 11 00198 g003aProcesses 11 00198 g003b
Figure 4. Iso-surfaces of a gas volume fraction downstream of the static mixer obtained at a value of αG = 0.025 for the operative conditions considered: (a) QL = 25 m3/h and QG = 3.75 L/min; (b) QL = 30 m3/h and QG = 7.5 L/min. The iso-surfaces are colored with the ratio between the centripetal acceleration and the gravitational acceleration.
Processes 11 00198 g004
Figure 5. Axial profiles of gas volume fraction CoV for the operative conditions considered: (a) QL = 25 m3/h and QG = 3.75 L/min; (b) QL = 30 m3/h and QG = 7.5 L/min.
Processes 11 00198 g005
Figure 6. Volumetric mass transfer coefficient on radial pipe cutaway surfaces for the operative conditions considered: (a) QL = 25 m3/h and QG = 3.75 L/min; (b) QL = 30 m3/h and QG = 7.5 L/min. The static mixer is placed at −0.14 < z/D < 0 and fluids move from left to right. The initial and final part of the pipe are omitted to improve readability.
Processes 11 00198 g006
Figure 7. Axial profiles of kL and a, for the operative conditions considered: (a) QL = 25 m3/h and QG = 3.75 L/min; (b) QL = 30 m3/h and QG = 7.5 L/min. The initial and final part of the pipe are omitted to improve readability.
Processes 11 00198 g007
Figure 8. Axial profiles of oxygen mole fraction in water and equilibrium oxygen mole fraction for the operative conditions considered: (a) QL = 25 m3/h and QG = 3.75 L/min; (b) QL = 30 m3/h and QG = 7.5 L/min. The initial and final part of the pipe are omitted to improve readability.
Processes 11 00198 g008
Figure 9. Axial profiles of OTR, kLa, and interphase mass transfer driving force, yO2/m-xO2, for the operative conditions considered: (a) QL = 25 m3/h and QG = 3.75 L/min; (b) QL = 30 m3/h and QG = 7.5 L/min. The initial and final part of the pipe are omitted to improve readability.
Processes 11 00198 g009
Figure 10. kL and a distributions in the proximity of the static mixer for the two operative conditions considered: (a,b) QL = 25 m3/h and QG = 3.75 L/min and (c,d) QL = 30 m3/h and QG = 7.5 L/min.
Processes 11 00198 g010
Figure 11. Interphase mass transfer driving force in the proximity of the static mixer for the two operative conditions considered: (a) QL = 25 m3/h and QG = 3.75 L/min and (b) QL = 30 m3/h and QG = 7.5 L/min.
Processes 11 00198 g011
Table 1. Results of the procedure for the determination of the d32.
QL (m3/h)QG (L/min)εSM (m2/s3)d32 (m)Ut (m/s)
2503.787.4 × 10−40.084
253.753.567.7 × 10−40.087
30010.075.2 × 10−40.058
307.59.815.4 × 10−40.060
Disclaimer/Publisher’s Note: The statements, opinions and data contained in all publications are solely those of the individual author(s) and contributor(s) and not of MDPI and/or the editor(s). MDPI and/or the editor(s) disclaim responsibility for any injury to people or property resulting from any ideas, methods, instructions or products referred to in the content.