1. Introduction
The discharge of synthetic textile dyes in wastewater is a significant threat to the environment. Therefore, a plethora of advanced processes has been designed in order to improve the dye degradation process. Some of them are the Fenton process [
1,
2], catalytic ozonation [
3,
4], and membrane separation [
5]. One of the intensively investigated advanced oxidation processes is catalytic oxidation [
6]. Among various oxide semiconductor photocatalysts for environmental applications, titania, TiO
2, has been most intensively investigated due to its high efficiency, nontoxicity, low cost as well as physical and chemical stability [
7]. Among three titanium dioxide polymorphs (anatase, rutile, and brookite), anatase is considered the most desirable photocatalyst due to the highest photosensitivity [
8]. Upon UV light irradiation, anatase generates highly reactive species, which can degrade most recalcitrant pollutants [
9]. There are two major obstacles to achieving improved photocatalytic properties of anatase: high bandgap and high electron-hole recombination rate [
10]. Due to a high bandgap (
Eg > 3.2 eV) anatase is excited only by radiation with wavelengths below 388 nm. This limits the use of sunlight or any visible light irradiation source in photocatalytic reactions with anatase as a catalyst [
10]. In the course of the excitation process, electrons are injected into the conduction band, thus leaving holes in the valence band. The semiconductor material photocatalytic efficiency depends greatly on the rates of two concurrent processes: electron-hole recombination and surface charge carrier transfer [
11]. If recombination takes place instead electron transfer to oxygen, the outcome is low photocatalyst efficiency [
8,
10].
Various approaches for overcoming these limitations, i.e., for extending the absorption range of anatase into the visible part of the spectrum and enhancing electron–hole separation, have been proposed. These approaches include the incorporation of metal ions into the anatase lattice, photosensitization with dyes, and deposition of noble metals [
12]. Noble metal deposition turned out to be a successful method of enhancing photocatalytic performance [
13] since noble metals on anatase surface act as a trap for photoinduced electrons, facilitating electron–hole separation (i.e., decreasing the probability of electron-hole recombination) and promoting the electron transfer process [
14]. Among noble metals, silver, having the lowest price, has the most significant practical value [
15]. The mechanism of silver-mediated electrons scavenging and transfer to oxygen is as follows: [
8] Since the anatase work function (3.2 eV) is less positive than the silver work function (4.6 eV) [
16], in the vicinity of silver particles at the anatase surface a spontaneous transfer of electrons from the anatase conduction band to silver particles occurs. Due to the accumulation of electrons on silver particles, the negative charge enrichment of metal occurs, enhancing the separation of reduction and oxidation surface sites. The lowering of the surface recombination yields with increased availability of holes and electrons for redox reactions [
17]. Subsequently, the rate of electron transfer to O
2 molecules increases, benefiting the photooxidation of organic compounds [
18].
Several synthesis approaches have been reported for the preparation of titania decorated with nanosized Ag [
19]. Beyond being complex, these methods often involve thermal treatment resulting in the agglomeration of anatase and metal particles and the reduction of anatase-specific surface area. Thus, a simple methodology for the synthesis of Ag nanoparticles dispersed on a crystalline anatase matrix, without the need for additional thermal treatment, is still a desirable outcome. In order to achieve this goal, one of the possible preparation routes is hydrothermal or solvothermal synthesis. Aside from the after-treatment of the hydrothermally prepared anatase approach, just a few papers on hydrothermal synthesis of Ag-doped anatase could be found [
20,
21,
22]. So, the investigation of this synthesis approach should be further investigated in order to work out the simple and robust process at low temperatures without the need for additional thermal treatment and to obtain nanocrystalline anatase decorated with silver nanoparticles. Additionally, phase composition and morphology are influenced by the synthetic approach [
23]. Therefore, the aim of this investigation was to explore the simple hydrothermal technique for direct preparation of silver nanoparticles deposited on anatase and to investigate the properties and photocatalytic efficiency of the obtained photocatalyst. Photocatalytic activity was estimated based on the degradation of the C.I. Reactive Violet 2 (RV2) azo dye. Previous works suggested a preferred degradation pathway of the dye via the OH radical mechanism rather than the hole-trapping direct degradation. Thus, the choice of the pollutant is useful for the determination of photocatalytic performance related to advanced oxidation via OH radicals. The experiments were performed in the batch annular reactor using monochromatic UVA light and a source of visible light only. The photocatalytic activity of Ag nanoparticles decorated anatase was compared with the photocatalytic activity of anatase without Ag nanoparticles presented in our earlier paper [
24]. The comparison was done experimentally and using a simple kinetic model based on the intrinsic kinetic constant and optical properties.
2. Materials and Methods
2.1. Synthesis
Silver nanoparticles colloid solution was prepared through the reduction of silver nitrate (AgNO3, AR, Merck, Germany) with sodium borohydride (NaBH4 99%, Fluka, Germany). 10 mL of 0.001 M AgNO3 water solution was added dropwise (~1 drop per second) to 90 mL of 0.003 M NaBH4 water solution cooled in an ice bath. The addition took ~3 min, during which the reaction mixture was vigorously stirred. The light yellow color of the obtained colloidal silver solution was observed due to surface plasmon resonance.
The chelate has been prepared by mixing 0.1 mol of ethyl acetoacetate (C6H10O3, 99%, Fluka, Germany) with 0.5 mol of isopropyl alcohol (C3H7OH, 99%, Kemika, Croatia) and addition of 0.1 mol of titanium n-butoxide (Ti(OnBu)4, 97%, Aldrich, Great Britain) to the solution. In order to avoid exposure to moisture, titanium n-butoxide was added to the solution with a syringe. The reactor was sealed, and the mixture was stirred at room temperature for 1 h.
A mixture of 0.2 mol of isopropanol and 9 mL of silver nanoparticles colloidal solution was dropwise added to the chelate solution and again stirred in a closed reactor for 1 h at room temperature.
The mixture was then transferred into a Teflon-lined autoclave, and hydrothermal synthesis proceeded for 24 h at 150 °C. After this, the autoclave was cooled down, and the as-prepared powder was separated by decantation, rinsed with deionized water, and dried.
2.2. Characterization
The powder X-ray diffraction (XRD) data were collected using Shimadzu diffractometer XRD 6000 with CuKα radiation working in a step scan mode between 20–70°2θ, with steps of 0.02° and counting time of 0.6 s. The anatase crystallite size was calculated from the width of the (100) diffraction peak using the Scherrer’s equation: D = kλ/(Bcosθ), where D is the average crystallite size, k is the Scherrer constant (0.94), λ is the CuKα wavelength (0.15418 nm), θ is the diffraction angle and B is the full width at the half height of (101) diffraction peak corrected for instrumental broadening.
The UV–Vis spectrum of the prepared sample was obtained using a DRS apparatus (Shimadzu UV–3101PC) with an integrating sphere in the wavelength range of 200–800 nm. The diffuse reflectance spectrum was transformed via Kubelka–Munk transformation of the reflectance data according to:
F(R) = (1–R)2/(2R), where
F(R) is proportional to the extinction coefficient (
α) and
R is the reflectance of the “infinitely thick” solid layer. [
25] The bandgap energy was estimated from UV–Vis DRS spectrum using modified Kubelka–Munk function,
(F(R)hν)n where
h is Planck’s constant (4.13566733 eVs) and
ν is frequency, the quotient of light velocity, (
c = 299,792,458 ms
−1) and wavelength (
λ/m). The exponent n characterizes the optical absorption process and is theoretically equal to ½ and 2 for indirect and direct allowed transitions, respectively [
25]. The optical bandgap energy,
Eg, was determined from the Tauc’s plot,
(F(R)hν)n vs. photon energy (
hν), by the extrapolation of the linear curve region onto the energy axis.
Surface morphology and elemental composition were investigated by Tescan, Vega 3 scanning electron microscope operating at 30 kV equipped with an energy dispersive X-ray spectrometer (Oxford Instruments). The powder was deposited on carbon tape and then coated using Quorum SC 7620 sputter coater for 1 min.
High-resolution transmission electron microscopy (HRTEM) was accomplished using a Jeol JEM-2100 transmission electron microscope operating at 200 kV accelerating voltage. The powder was dispersed in ethanol (C2H5OH, 99% Kemika, Croatia) in an ultrasonic bath for 15 min and deposited on a copper grid.
Physisorption analysis was performed in order to obtain the surface area and pore size distribution of the prepared sample. N2 gas adsorption–desorption isotherm was obtained at 77 K on Micromeritics ASAP–2000 apparatus on a degassed sample. Surface area was determined using the Brunauer–Emmet–Teller (BET) model. Pore size distribution was calculated using Barret–Joyner–Halenda (BJH) model.
The prepared photocatalyst optical properties were obtained using the combination of DRS and spectrophotometry, as shown in our previous publication [
24].
2.3. Photocatalytic Activity
The photocatalytic activity of the prepared photocatalyst was assessed through the degradation of Reactive Violet 2 (RV2) dye, which was used as a model compound. Reactive Violet 2 was obtained from Ciba, Switzerland. An annular batch reactor was made of a cylindrical glass vessel (
ϕ = 37 mm) and a quartz glass tube (
ϕ = 10 mm) located axially in the center of the vessel. A Pen Ray lamp (UVP Products Cat. No. 90-0019-04), with a radiation wavelength of 365 nm and emission intensity of 1.255 Wcm
−2 was placed into the quartz glass tube. Alternatively, a metal halide lamp (100 W) of the same dimensions was used only as a source of visible light. In the case of a metal halide lamp, the reactor was placed in an ice-cooled bath to maintain the desired temperature of 25 ± 3 °C. In a typical experiment, RV2 aqueous solution (V = 100 mL) with 1.0 gL
−1 of catalyst was stirred for 30 min in the dark to achieve sorption equilibrium. The stirrer was operated at 510 rpm to maintain a homogeneous reaction mixture and to ensure the isoactinic and isothermal conditions inside the reactor. Aliquots of 1 mL were withdrawn using a syringe at set time intervals. The dye degradation was evaluated by observing the dye absorbance at the maximum RV2 absorbance wavelength (
λmax = 550 nm) with a Shimadzu UV-3101PC spectrophotometer. The concentration profile of RV2 was obtained from the absorbance measurements using Lambert–Beer equation and the extinction coefficient of RV2-ε
550nm = 18,100 (cm
−1L mol
−1) [
26].
3. Results and Discussion
The prepared powder containing silver nanoparticles was examined by SEM in two modes, secondary electron (SE) and backscattered electron (BSE), in order to investigate the morphology of the samples, as well as the appearance of silver nanoparticles.
Figure 1a shows the SEM micrograph of prepared powder in SE mode, presenting strong agglomeration. The titania particle morphology and size cannot be resolved using this technique, while silver particles cannot be observed at all. On the other hand, BSE mode is suitable for detecting areas with different elemental compositions since heavy elements backscatter electrons more strongly than light elements; as a consequence, they appear brighter in the micrograph. In the BSE mode SEM micrograph (
Figure 1b), a few silver nanoparticles were indeed observed as brighter particles embedded in a darker titania matrix.
The XRD pattern of the sample obtained by synthesis is shown in
Figure 2. Broad peaks corresponding to anatase TiO
2 crystal structure (ICDD PDF No. 21-1272) could be observed. The diffraction peaks due to metallic silver (ICDD PDF No. 04-0783) could not be observed due to silver concentrations below the X-ray diffraction detection limit. The most intense silver peak at 38.21°2θ due to the (111) crystal plane may be overlapped by the broad (004) peak of anatase at 37.8°2θ. The broadness of anatase peaks is due to the formation of fine crystallites. Crystallite size was estimated from the anatase (101) reflection located at 25.4°2θ via the Scherrer equation. It was determined that the anatase particle size was 8 ± 1 nm. The XRD pattern showed that the hydrothermal synthesis enabled the direct preparation of nanocrystalline anatase without the need for additional thermal treatment.
Figure 3 displays the HRTEM image of the prepared photocatalyst. As can be seen, the sample consisted of irregular particles formed by the aggregation of small spherical particles. Nanoparticles possess high unsaturated surface energy and thus exhibit a strong inclination to aggregation. Diameter of primary particles between 5 and 12 nm could be observed. Average Feret diameter was determined by measuring 20 particles, and it was found to be 7.9 nm, which is in concordance with the particle size obtained using Scherrer’s method. The lattice fringes with distances of
d = 0.35 nm and
d = 0.23 nm, corresponding to the spacings of (101) and (001) planes of anatase crystal structure, could be observed. Although most of the particles are spherical, the typical shape of the truncated octahedron is clearly noticeable for some of them. Among other properties (e.g., size, crystallinity, degree of dispersion, morphology), the photocatalytic efficiency of anatase depends on crystal facets exposure. In anatase nanocrystals, there are three fundamental surface planes exposed: {001}, {100}, and {101} with average surface energies of 0.90, 0.53, and 0.44 J m
−2, respectively [
27]. Normally, anatase grains are dominated by {101} planes [
28], which is also true for the investigated sample. However, the obtained results indicate the presence of {001} planes as well, and the exposure of a more active crystal surface should yield with better photocatalytic effect.
A wider area HRTEM micrograph of the catalyst is shown in
Figure 4. Anatase is observed as matrix-forming light fine particles, while silver particles are seen as big dark particles. Diameter of silver particles is between 50 and 90 nm. Unfortunately, it seems that the high temperature and pressure autoclave conditions promote silver nanoparticle aggregation and growth.
The electron diffraction pattern of particles observed in
Figure 4 is shown in
Figure 5a,c. The selected area diffraction patterns of fine light grain area yield continuous diffraction rings of the anatase polycrystalline grains. On the other hand, the SAED pattern of big dark grain area beside polycrystalline anatase grains is also characterized by diffraction spots consistent with monocrystalline silver grain. EDS spectra (
Figure 5b,d) are consistent with SAED patterns. For the case of the anatase matrix, Ti and O peaks could be observed, while in the spectra of the silver grain, besides Ti and O peaks, Ag peaks could be observed, giving conclusive evidence for the presence of Ag. Although, in this manner, the satisfactory chemical stability of metallic silver in the course of the hydrothermal process has been proved, it has to be noted that undesirable growth of silver nanoparticles occurred.
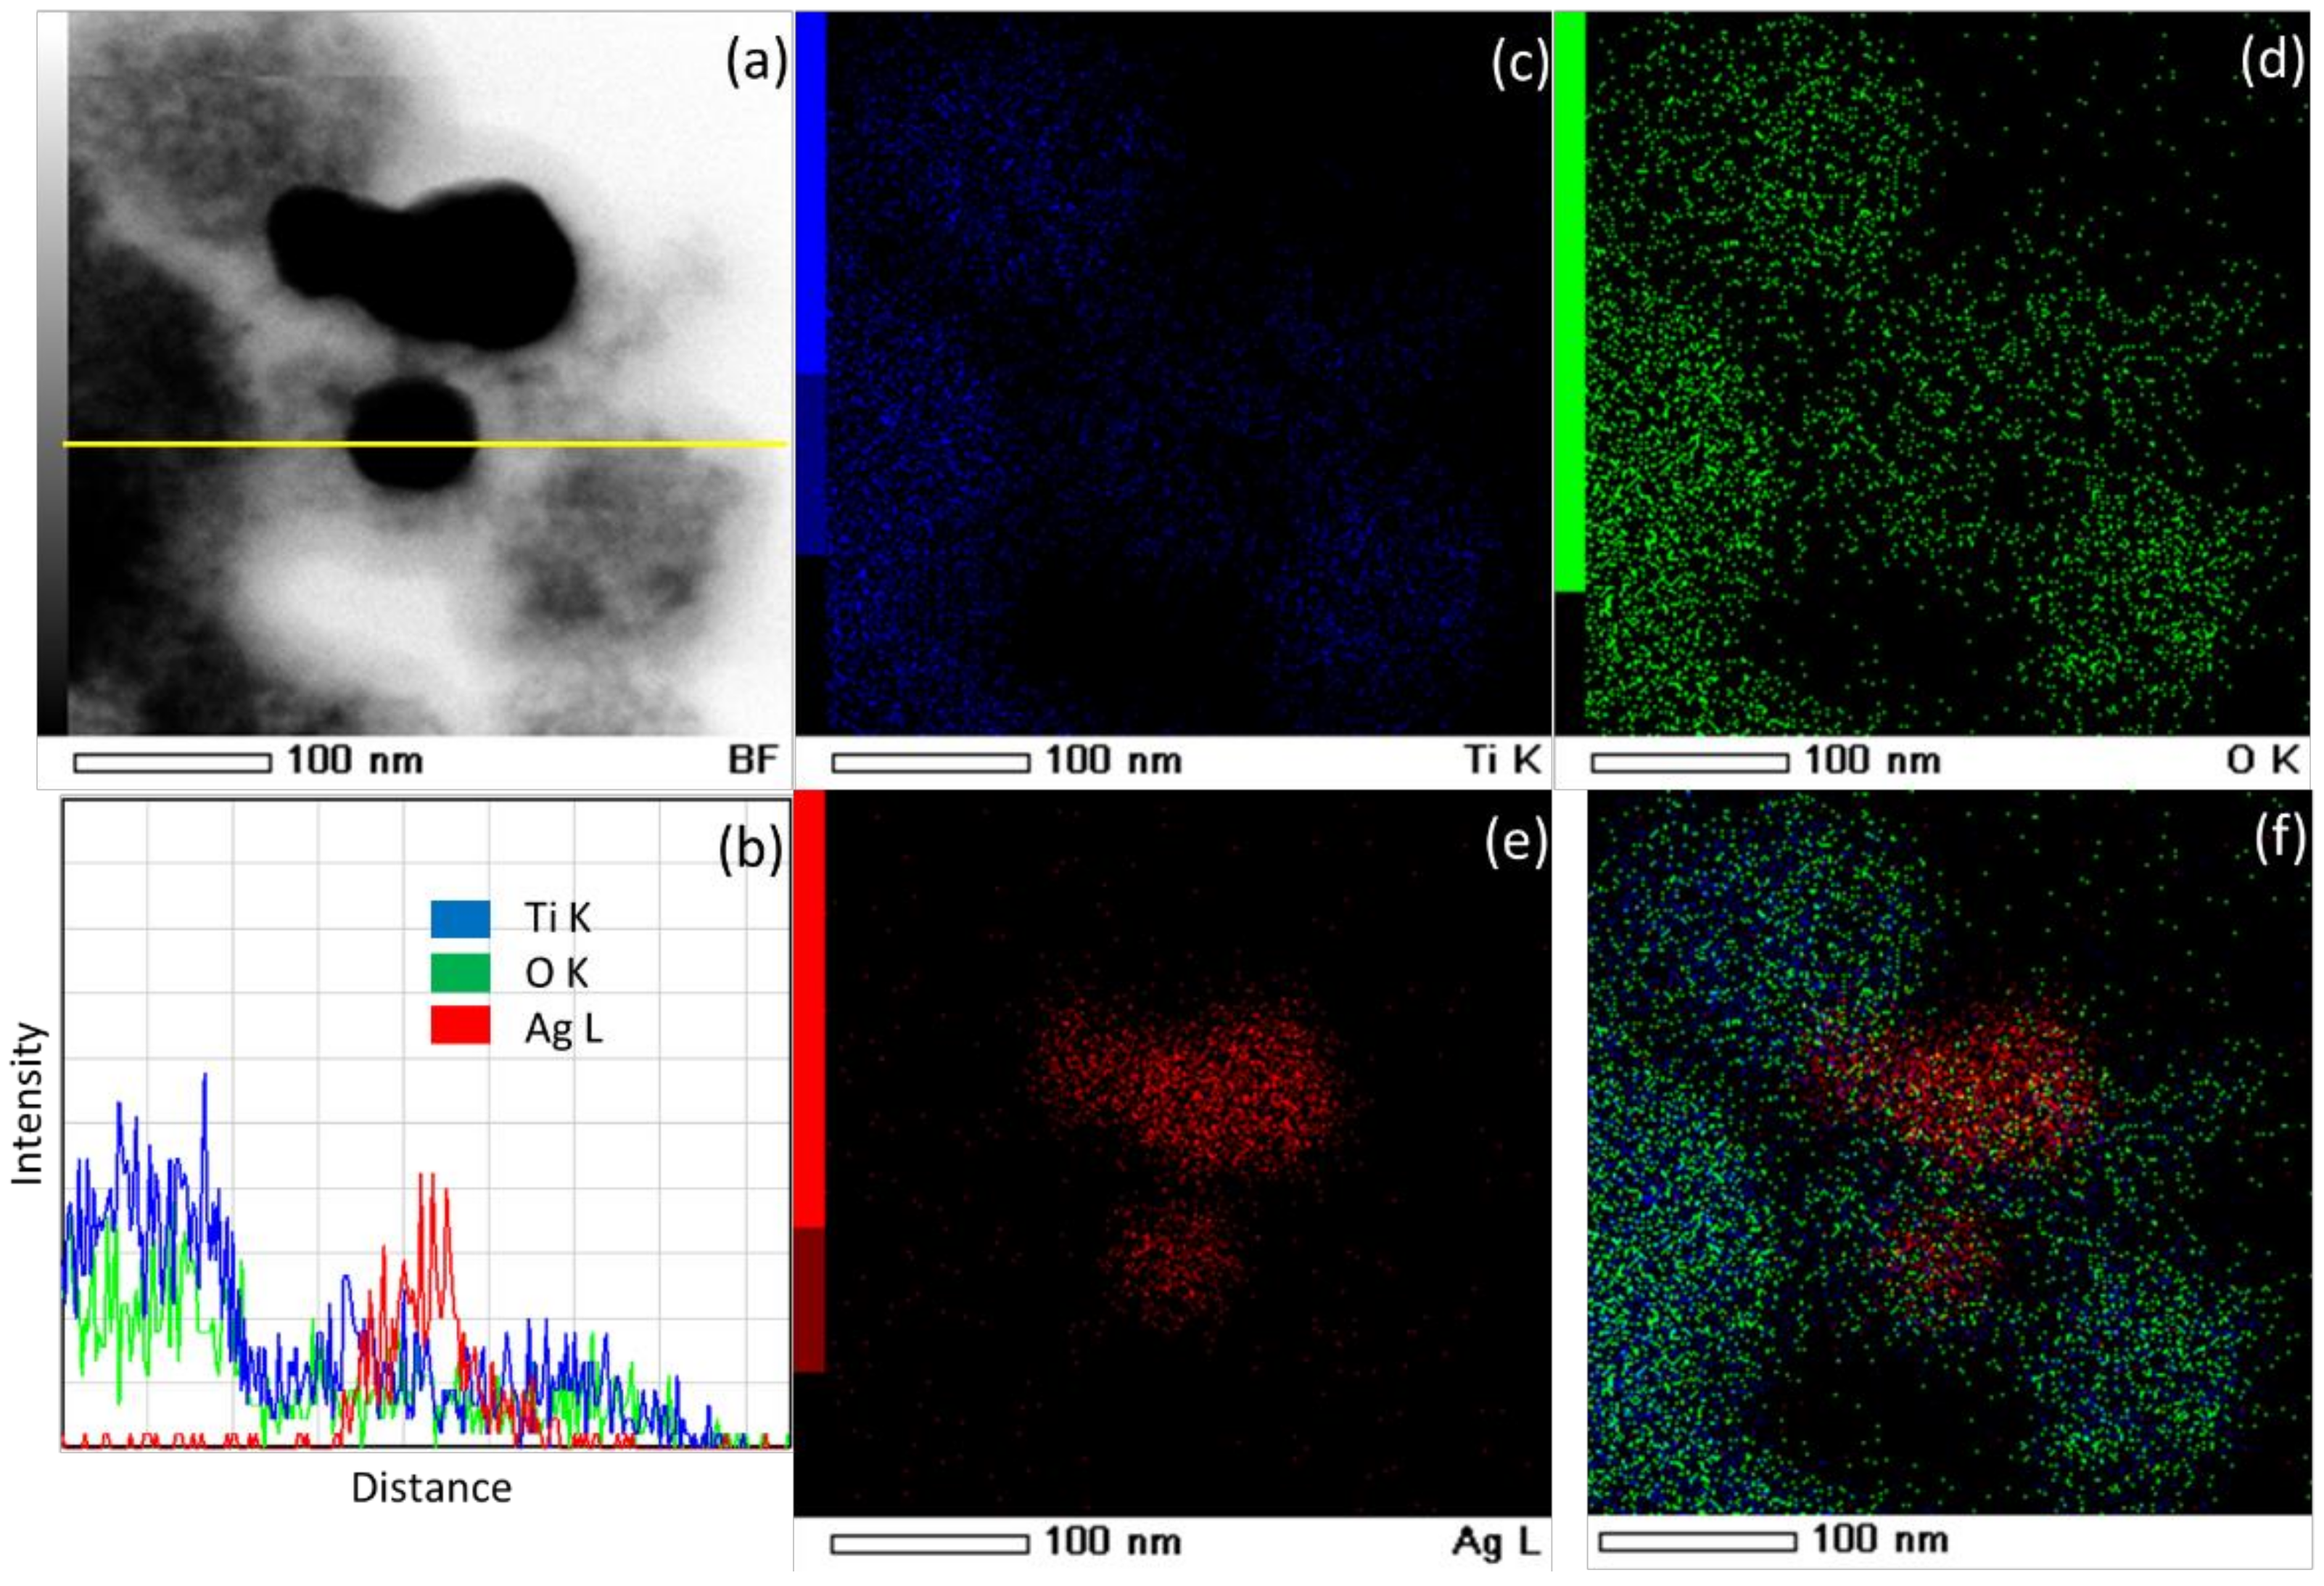
Additional insight into elemental distribution has been obtained through STEM-EDS mapping and line analysis (
Figure 6). As can be observed, STEM-EDS mapping and line analysis confirm the SAED and EDS results discussed in the previous paragraph. The dark grains are obviously silver nanoparticles, while fine light grains are titania nanoparticles.
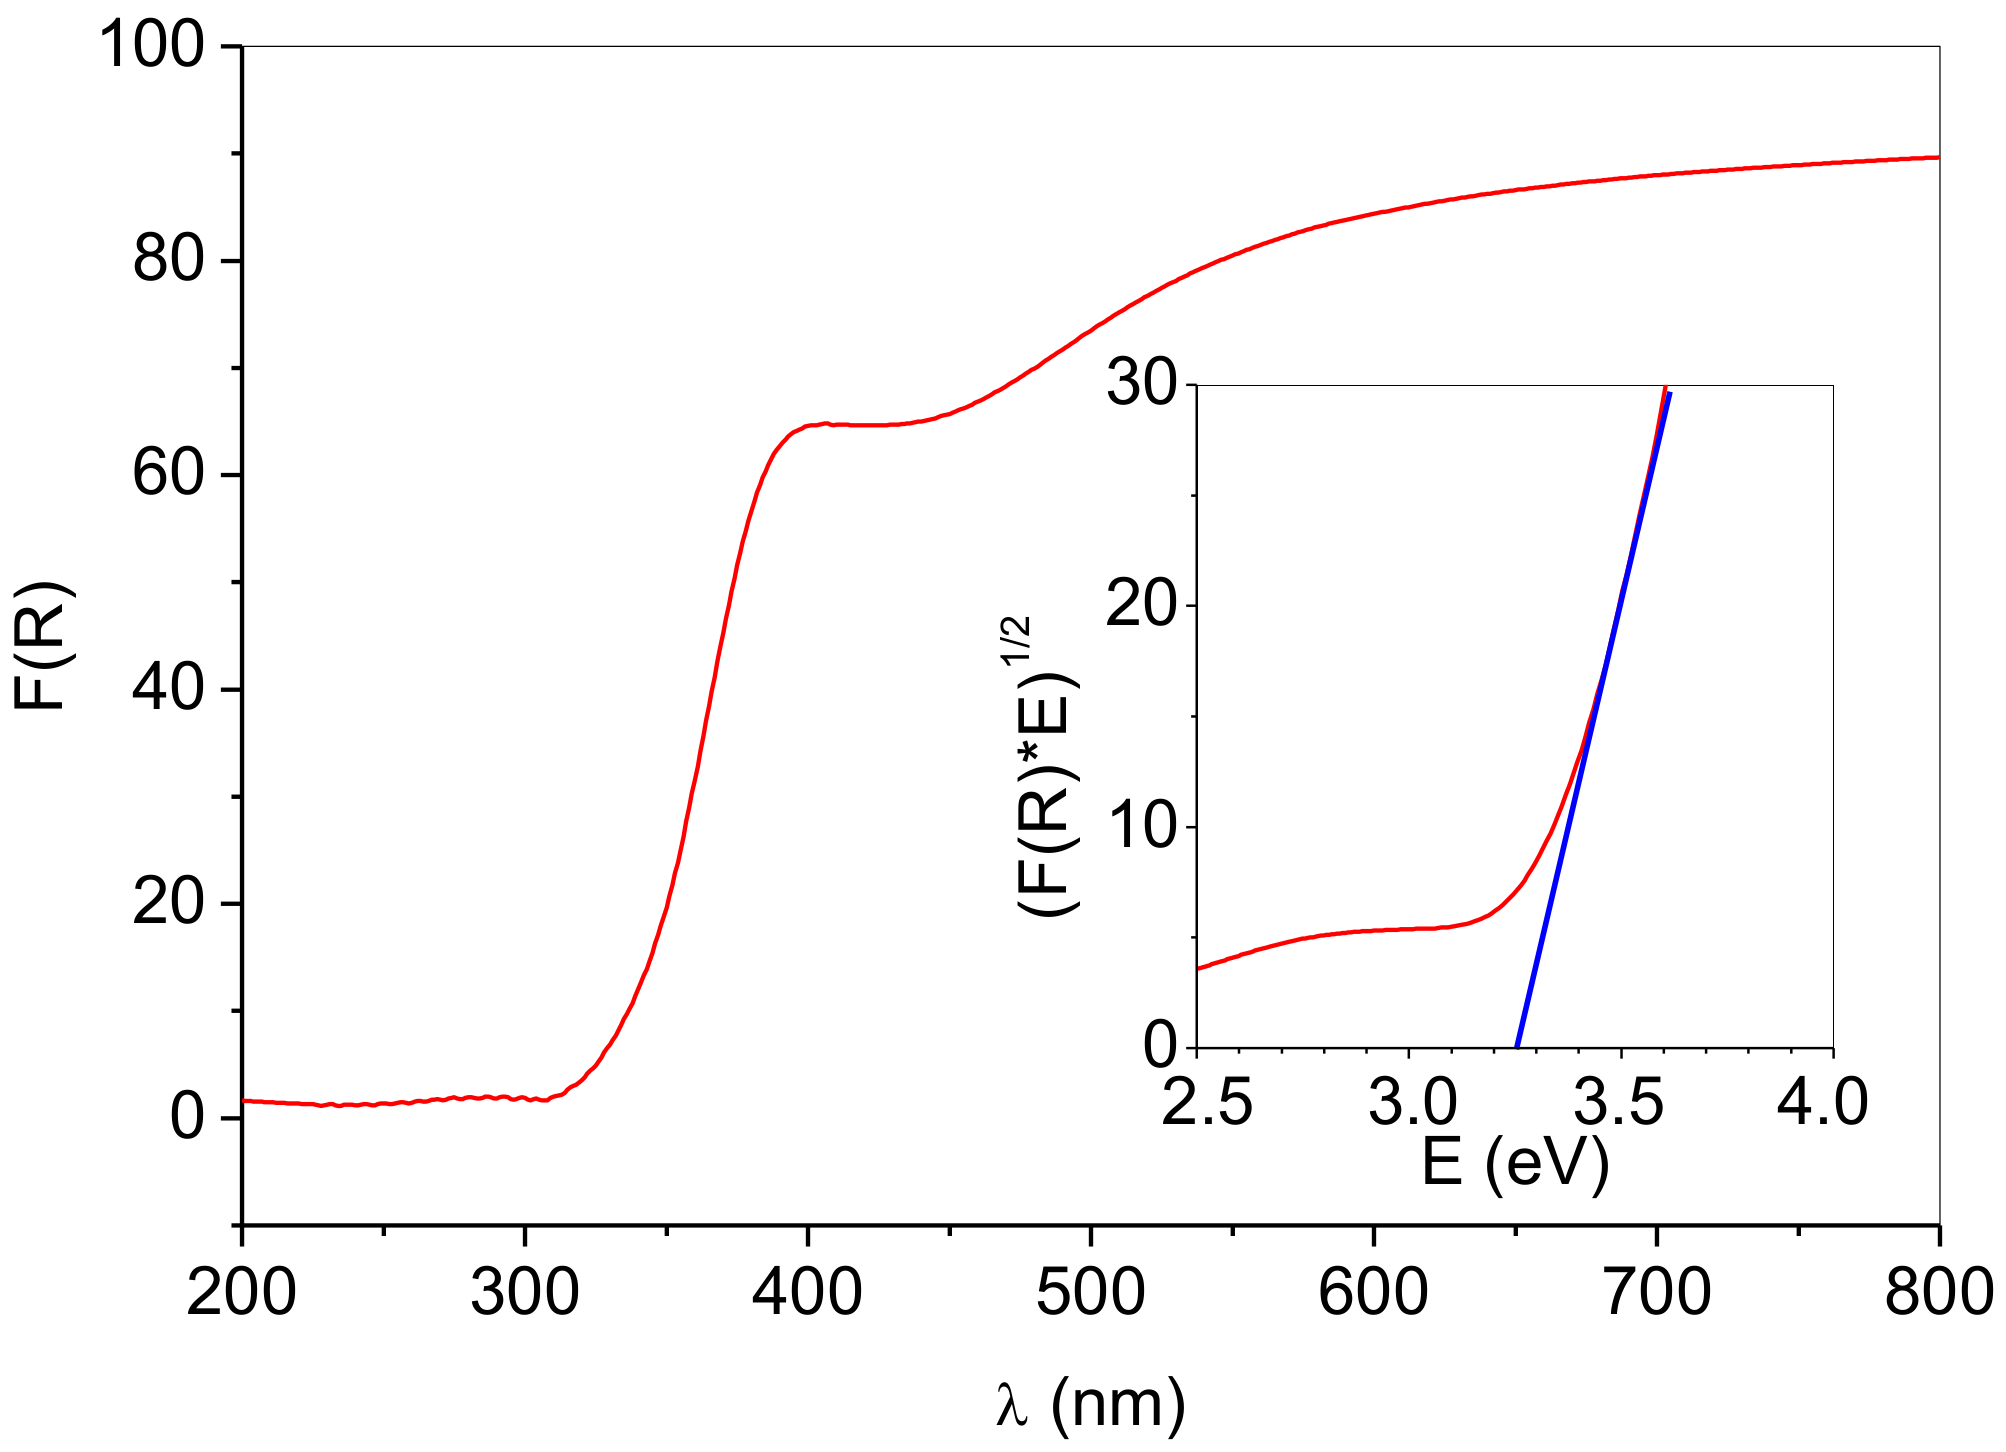
Kubelka–Munk converted Uv-Vis DRS spectra of the prepared photocatalyst are shown in
Figure 7. The spectrum shows strong absorbance in the UV region and fair reflectance in the Vis region. A single absorption below ~380 nm is generally ascribed to charge-transfer from the valence band (mainly formed by oxygen 2p orbitals) to the conduction band (mainly formed by Ti 3d orbitals) [
15]. The spectrum contains a broad peak centered at 420 nm, typical for Ag nanoparticles surface plasmon resonance [
29]. The appearance of the plasmon band confirms the presence of metallic silver nanoparticles [
10]. Compared with colloidal Ag particles [
30], the surface plasmon resonance band of silver nanoparticles supported on the surface of anatase is broadened and shifted towards a longer wavelength. The absorption spectrum red shift could be explained by surface effects due to the interaction of silver and anatase, i.e., the microenvironment around silver particles. However, it is far more plausible that the red shift is a consequence of the size and shape effect, i.e., the increase in particle size or change of the particle shape [
31,
32,
33].
Anatase is an indirect bandgap material, so the
(F(R)*E)1/2 function was plotted against
E, and the absorption data were fitted to a straight line showing a reasonable fit. The bandgap of the sample was calculated from the absorption edge extrapolation onto the energy axis (
Figure 7, inset). The
Eg value of 3.26 eV obtained is close to the literature values for the bandgap of bulk anatase. The majority of authors have determined that the anatase has indirect bandgap values between 2.86–3.34 eV [
34,
35,
36]. The differences in reported literature values are attributed to stoichiometric variations, crystallinity, crystallite size, and to the presence of impurities [
34]. Therefore, it appears that the deposition of silver nanoparticles on the anatase matrix did not influence the bandgap of the anatase.
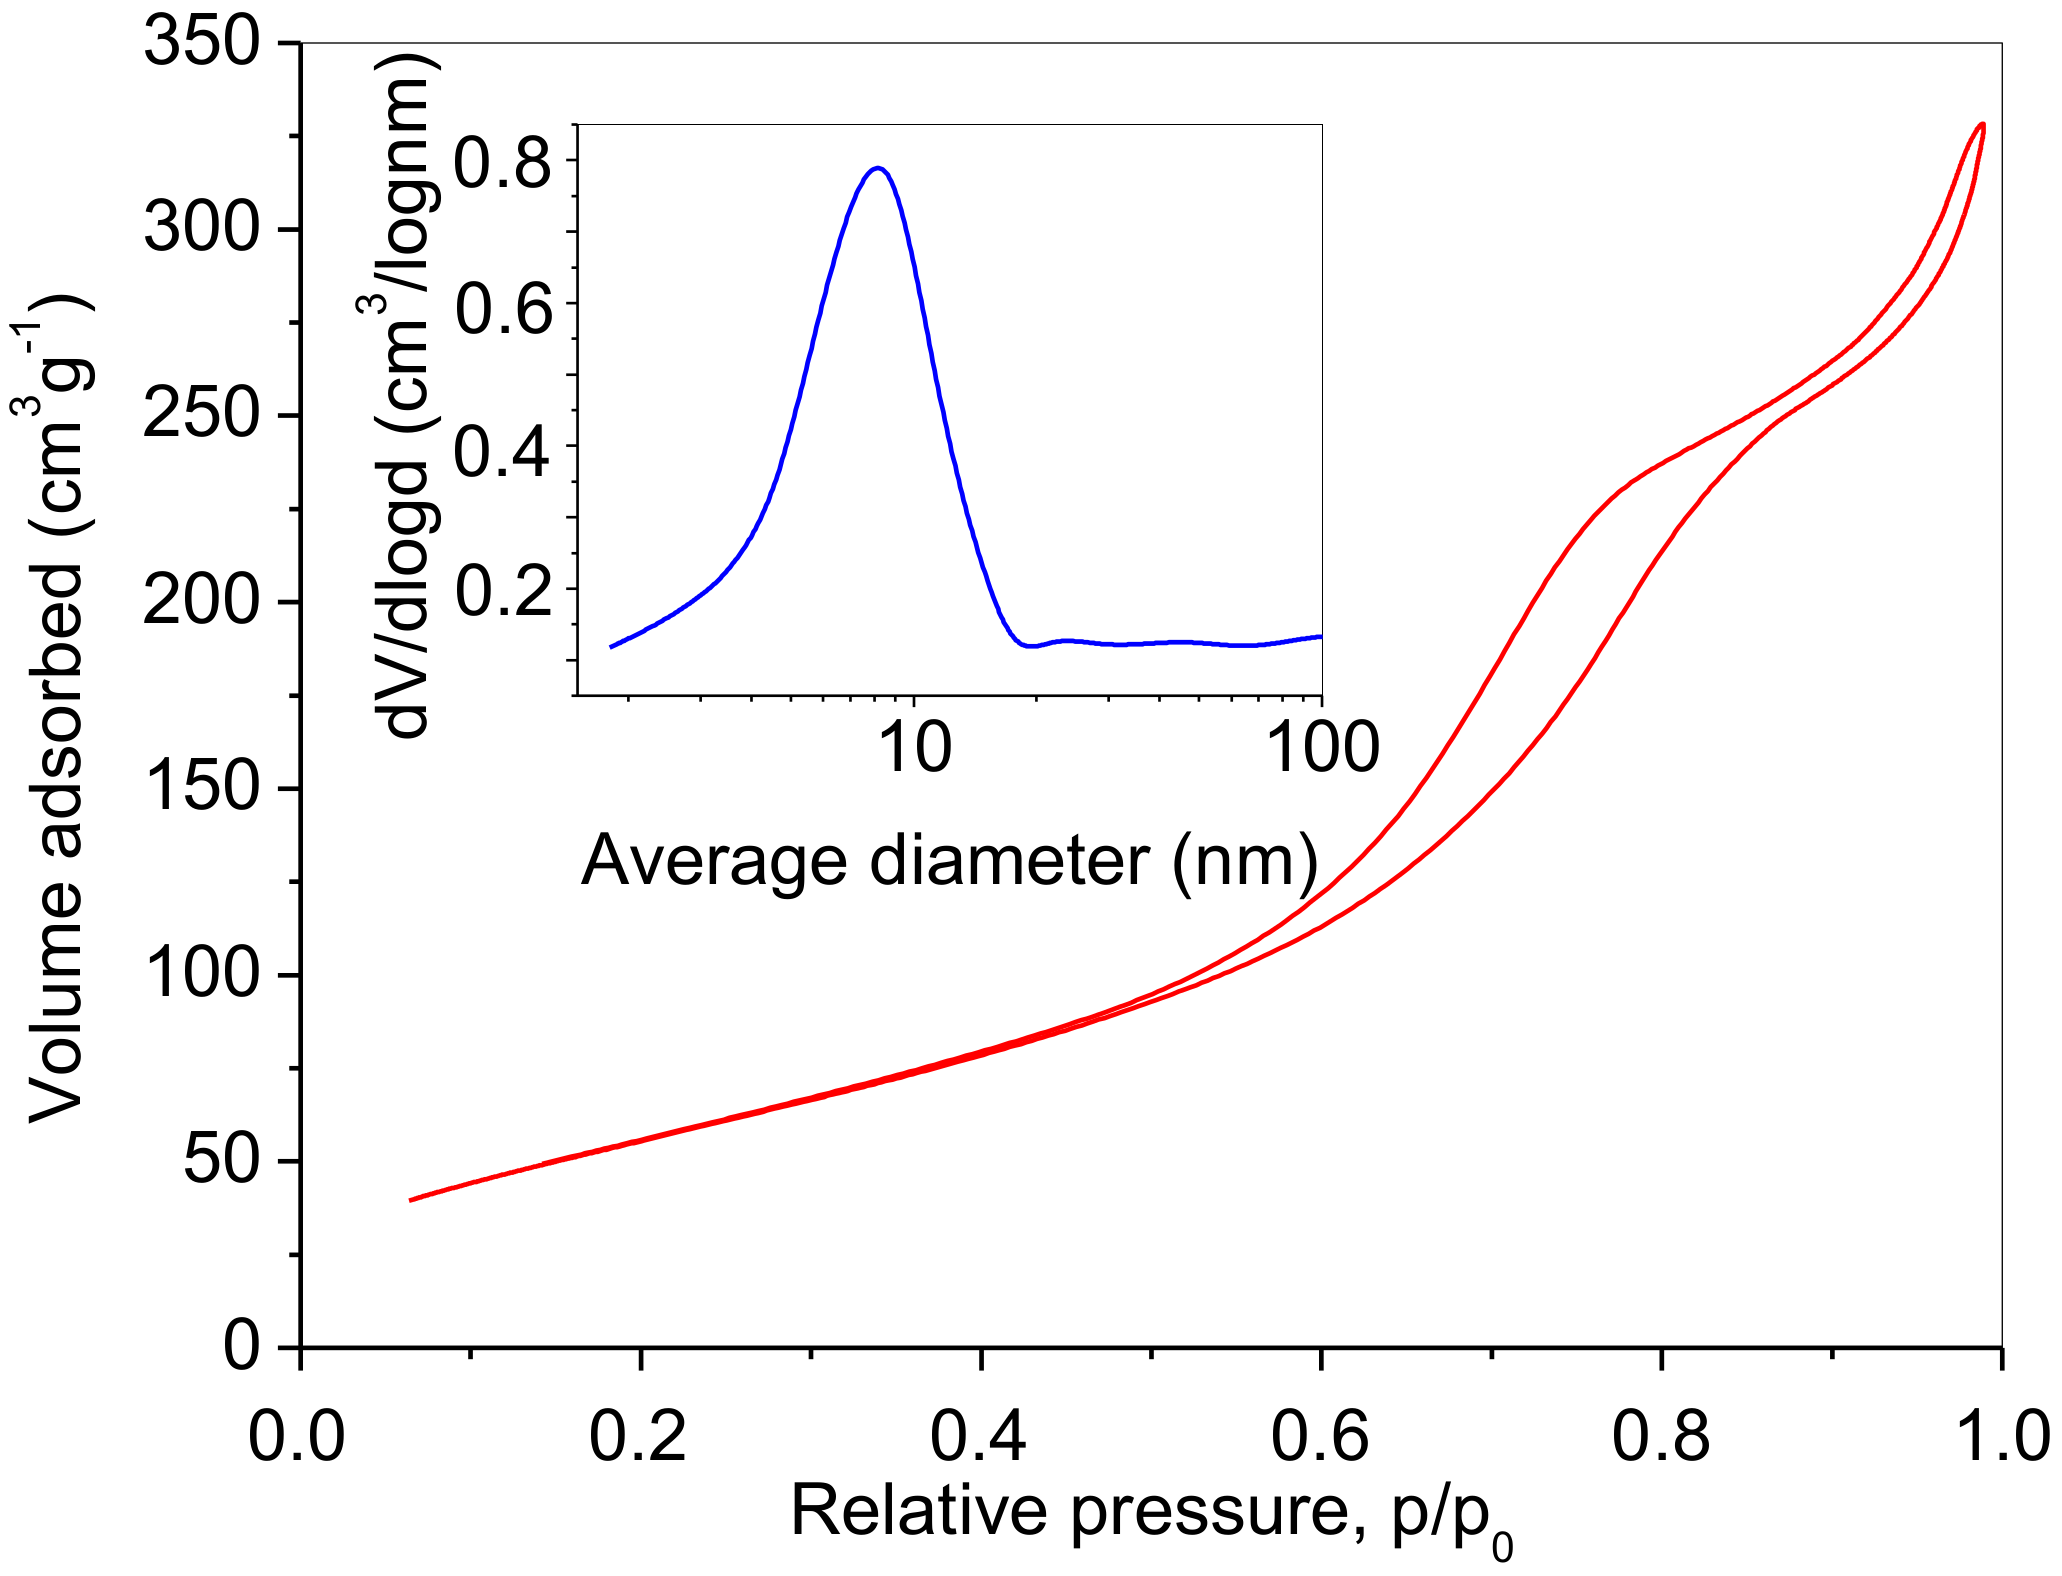
Figure 8 presents the N
2 adsorption/desorption isotherm of the prepared powder, while pore size distribution is given in the inset. The obtained type IV physisorption isotherm accompanied by an H2 hysteresis loop indicates the presence of mesopores [
37,
38]. The surface area has been calculated to be 209 m
2g
−1, the approximate pore radius 8.1 nm (
Figure 8, inset), and the total pore volume 4.6 cm
3g
−1. The pore size distribution indicates the existence of a mesostructure.
The as-synthesized sample was tested for photocatalytic oxidation of RV2 under UV-A irradiation (365 nm) and under visible light. The degradation extents were assessed as dye chromophore degradation by monitoring the decrease in the respective absorption of RV2 in the sample. The dye RV2 was chosen based on a previously established tentative reaction pathway [
39,
40]. According to the tentative pathway, the decomposition of RV2 by hydroxyl radicals resulted in the formation of all aromatic by-products in the first step, i.e., chromophore breakdown and hydroxylation of the aromatic ring. Normally, following the steps of the degradation mechanism initiated by the OH radical includes ring opening, formation of small organic molecules such as oxalic and formic acid, and finally, mineralization toward CO
2 and water. As the hydroxyl radical is responsible for dye molecule initial breakdown, the absorbance readings alone can give an unbiased insight into photocatalyst performance in terms of electrons and hole generation rates and surface reactions leading to OH radical generation. The adsorption of dye on the catalyst surface during reaction time was considered insignificant since the precipitated photocatalyst had no visible change in color after the treatment. The adsorption of RV2 on the photocatalyst surface in the dark prior to the experiments was crucial for the initiation of the photocatalytic oxidation cycle directed by OH radicals [
24]. The prepared photocatalyst performance was compared with the performance of the reference sample, photocatalysts prepared by solvothermal synthesis under the same conditions but without silver [
24]. Both photocatalysts were used under UV-A light (namely 365 nm) and visible light with no UV-A at all. The results of the photocatalytic activity analysis of the prepared materials for the decomposition of RV2 are shown in
Figure 9.
The
RV2 photocatalytic degradation kinetics was fitted to the pseudo-first-order reaction rate model in the batch reaction system, Equation (1):
The pseudo-first-order rate constant,
kRV2, was determined from Equation (2) through the linear regression of −
ln(
cRV2,t/
cRV2,0) vs. time:
The corresponding values of
kRV2 and respective determination coefficient R
2 are given in
Table 1.
The observed photocatalytic activity revealed a similar performance of the prepared Ag-doped photocatalyst to the one determined previously for the reference sample under a monochromatic UV-A irradiation source, with similar photodegradation rate constants of 1.24 × 10
−2 and 1.08 × 10
−2 min
−1 (
Table 1). Under visible irradiation, the rates of RV2 degradation were lower. However, a higher photodegradation rate was obtained using the prepared Ag-doped sample, i.e., 1.07 × 10
−3 min
−1 (
Table 1). The degradation rate constant observed when using reference sample was one order of magnitude lower than the one of the Ag-doped sample (1.2 × 10
−4 min
−1).
The intrinsic optical properties of prepared photocatalysts were determined using previously established methodology using two spectrometric techniques: UV-Vis DRS of powder sample and UV-Vis spectrometry of suspensions in water (exitance measurements). The sum of the absorption and the scattering coefficients, i.e., the extinction coefficient, was gained from extinction measurements (Equation (3)) of a suspension sample [
24].
where
βλ is the extinction coefficient,
σλ is the absorption coefficient,
κλ is the scattering coefficient,
EXTλ is the extinction, and
L is the cell length in cm.
The absorption and scattering coefficients were determined for every single wavelength in the UV and visible parts of the electromagnetic spectrum (
Figure 10). The numeric results were given in
Table 1 for data calculated at 365 nm (as for monochromatic UV-A source of irradiation) and the average value of calculated
σλ and
κλ in the visible spectrum (400 <
λ (nm) < 800) since the used metal halide lamp emission covers the entire visible spectrum.
The similar observed photocatalytic activities of both photocatalysts under UV-A irradiation and the inferior photocatalytic activity of the reference sample under Vis irradiation are finely related to the optical properties of the catalyst, i.e., absorption (
σλ) and scattering coefficients (
κλ) (
Figure 10,
Table 1). As shown in
Figure 10, the absorption coefficients are high at lower wavelengths due to the irradiation energy being greater than the anatase bandgap. Therefore, in the UV part of the spectrum, the absorption coefficients reach higher values, i.e., more irradiation is being absorbed, while scattering coefficients approach zero. At
λ = 365 nm, absorption coefficients were 4346.3 and 2466.9 cm
2g
−1 for the Ag-doped anatase and the reference sample, respectively. Although these numbers implied the difference in photocatalyst absorption capability, the scattering coefficient follows the same trend. The scattering albedo of Ag-doped anatase is also higher but not significant enough to result in a critically different overall photocatalytic performance at 365 nm. However, under visible irradiation, their respective overall activities are affected by their intrinsic optical properties. The absorption coefficient of Ag-doped anatase is two orders of magnitude higher than the one detected for the reference sample, which can give an explanation for the differences in photocatalytic activity. Moreover, the surface plasmon resonance absorption band in the visible region (400–550 nm) is typical for the Ag-doped sample (
Figure 10).
The absorption and scattering coefficient calculations revealed the uniformity in the scattering characteristics of the samples, meaning that it has no particular effect on the photocatalysts’ performance. The irrelevance of scattering characteristics of the photocatalyst is important for the future development of immobilized photocatalytic structures, whereby only absorption of light on a catalyst surface is relevant for the respective photocatalytic performance. The neglect of scattering coefficients could also simplify the modeling of the photocatalytic oxidation process and calculation of intrinsic degradation rates necessary for eventual scale-up and real-scale applications.


