Abstract
Food waste is a matter of deep concern as it is creating multidimensional threats to the environment. Though these are potential sources of plant nutrients, a detailed investigation has not yet been conducted. Hence, a physico-chemical characterization of non-edible food waste such as brinjal waste, potato peels, banana peels, orange peels, eggshells, cow bones, chicken bones, fish bones, and their combined waste was accomplished using FTIR, TGA, XGT-5000, CHN corder, etc. The present study revealed that plant waste samples had lower ash contents (1.36–7.79%) but higher volatile matter (72.33–80.04%), and the reverse was true in animal waste. In addition, animal waste, except eggshells (22.48%), had lower fixed carbon (1.01–2.83%). On the other hand, fruit waste was documented with higher fixed carbon (11.33–14.27%). Results also indicated that animal waste and their combined samples, except eggshells, contained more nitrogen (3.82–5.06%). The concentration of P was statistically significant in the combined fruit sample (28.21% ± 8.451), followed by banana peels (24.96% ± 11.644). Vegetable waste contained a significantly higher amount of K (24.90% ± 28.311–37.92% ± 24.833) than other waste. Maximum Ca (68.82% ± 10.778) and Mg (15.37% ± 29.88) were recorded in eggshell and fish bone waste, respectively. Except for Zn and Mn in eggshells, the waste studied contained a significant amount of micronutrients. FTIR demonstrated the presence of different functional groups such as alcoholic group (OH), aliphatic chain (C–H), aromatic chain (C–H), alkyl aryl ether (C–O), carbonyl group (C=O), alkene (C=C), thiocyanate (S–CN), isothiocyanate (N=C=S), allene (C=C=C), sulphate (S=O), amine (N–H), and NO stretching band, which varied with the waste used. Thermogravimetric analysis revealed that plant waste degraded more quickly than animal waste. Eggshells were found to be less degradable by increased temperature, followed by cow bones > fish bones > chicken bones. The waste material used in the study was slightly acidic (6.67–6.82) in nature. Correlation analysis of the nutrients showed mainly positive relations in all samples for macro and micronutrients. Therefore, non-edible food waste can be a possible source of plant nutrients.
1. Introduction
Food waste has received due attention in recent years because it causes serious environmental, economic, and even social problems throughout the world, especially in developing countries [1]. It is generally produced during production, storage, processing, transportation, wholesale retail, food service, and consumption of foodstuffs. According to the United Nations Environment Program’s (UNEP) Food Waste Index Report 2021, people produced one-third of all food waste produced globally [2], amounting to 1.3 billion tonnes (BT) per year, equivalent to 3.3 billion tonnes of CO2 [3]. According to the report, 28% of agricultural land is required to produce the amount of wasted food each year [3].
There are a lot of methods of managing food waste, and landfilling [4] is one of them. The method is currently used for approximately 37% of waste globally [5]. In Malaysia, approximately 95% of waste is disposed of in landfills, 79% in China, 53% in the United States of America [6], and 42% in Bangladesh [7]. However, waste deposited in landfills adversely affects the environment [8] including surface, and groundwater contamination [9,10] and aquifers [11]. This waste is dumped nearby in almost all developing countries [12]. That is why air, soil, and even water become polluted, and the people of the adjacent locality, especially school-going children, adults, patients, pedestrians, etc., become the worst sufferers. Finally, the locality becomes unfavorable for living. To avoid the situation, comprehensive action is adopted to address the issue, viz., sorting at the sink, collecting, dumping, and finally landfilling and incineration [13]. Though this comprehensive approach is almost absent in all developing countries.
Basically, food waste is of two types: edible (date expired, plate waste, unsold food, burned food, packaging defects, etc.) and non-edible (peels, bone, skin, shells, etc.). Edible food waste can be minimized by adopting different guidelines, such as the Appropriate Food Packaging Solutions for Developing Countries [14], Global Food Losses and Food Waste [15], Guidelines on the Preparation of Food Waste Prevention Programs [16], Food Waste Collection Guidance [17], Managing Food Waste in the National Health System [18]. However, the non-edible part of food waste cannot be reduced. That is why non-edible food is still a matter of concern throughout the world. In addition, Sustainable Development Goal (SDG) 12, ‘Responsible consumption and production’, adopted by the United Nations (UN) in 2015 involves a target of halving per capita global food waste at the retailer and consumer levels, and a reduction in food losses during production, supply chain, and post-harvest by 2030 [19]. Additionally, goal 2, ‘Zero Hunger’, includes a specific target of doubling agricultural productivity by 2030 [19].
There are many non-edible food wastes, categorized basically as plant and animal sources. It is quite difficult to characterize all non-edible food wastes. That is the reason why, we considered eight frequent and widely generated non-edible food wastes, four from plant sources and the rest four from animal wastes, to make a representation of all categories. Food waste is considered a feasible alternative for soil application, as it contains essential plant nutrients. For this, we reviewed previous studies [20,21,22,23,24,25,26,27,28] to find out the presence of plant nutrients in the studied food waste. The previous researchers noted the concentration of very few elements as a part of their research. Though plants require 17 elements essential for their growth and development, a comprehensive measurement of essential plant elements was not reported before. Keeping in mind this research gap, the initiative of characterization of food waste from an agricultural perspective might help to fulfill the partial requirement of the fertilizer demand. Therefore, the study was carried out to characterize different non-edible food wastes following proximate and ultimate analysis, functionality, gravimetric characteristics, and correlation analysis for the purpose of potential soil application.
2. Materials and Methods
2.1. Sample Preparation
Eight non-edible food wastes, namely brinjal (Solanum melongena) waste, potato (Solanum tuberosum) peels, banana (Musa acuminata) peels, orange (Citrus sinensis) peels, eggshells (Gallus gallus domesticus), cow bone (Bos taurus), chicken (Gallus gallus domesticus) bone, and fish (Labeo rohita) bone were considered for the study. Brinjal, potato, banana, orange, and eggs were bought from the Maruetsu Urawa Okubo branch (35°52′23.9″ N 139°38′45.4″ E), Saitama, Japan. Beef with bone, chicken bone, and fish were bought from the halal shop of the Saitama Muslim Cultural Association (35°89′96.6″ N 139°58′53.7″ E), Saitama, Japan. The brinjal and potato were cleaned before cutting. The bones of beef, chicken, and fish were collected after eating. Then, the collected bone was cleaned with tap water. The collected samples were dried in a shed for 7 days. After proper drying, the plant sample and eggshells were crushed and sieved (MF 0.25 Sieve) using an IKA 2870900 MF 10.1 Cutting-Grinding Head (IKA® Japan K.K., Osaka, Japan). The bones were chopped with the help of an axe. Then, the animal bones were crushed with the help of a crusher (WB-1, 700 W, Osaka Chemical Co., Ltd., Osaka, Japan). The ground samples were exposed for one hour in the laboratory atmosphere to obtain air-dried samples. Then, combined vegetable, combined fruit, and combined animal samples were formulated by combining similar samples in equal proportions, except for combined fruit. In the case of combined fruit, the ratio of orange peels to banana peels was 1:2. In most developing countries, the amount of banana peels was doubled due to higher production and ease of purchase compared with orange fruit. A composite sample was prepared by combining eight individual samples (50% for orange peels) and maintaining an equal proportion. Then, the twelve samples were stored in an airtight polyethylene bag separately for analysis.
2.2. Analytical Procedure
2.2.1. Proximate Analysis
The stored air-dried food waste sample was inserted into the desiccator. Air-dried samples were subjected to proximate analysis (moisture, volatile matter, ash, and fixed carbon) following JIS-M8813. A crucible containing 1 g of finely ground, air-dried sample was placed in an electric oven at 105 °C for 1 h. After the stipulated time, the crucible was removed, desiccated, and weighed. The weight loss was measured and the moisture content (%) was measured using the following formula presented in Equation (1):
The dried sample in the crucible was then placed in an electric furnace (muffle furnace) at a temperature of 925 ± 20 °C for 7 min. The crucible was desiccated after cooling in the open air. The sample was weighed. The volatile matter (%) was measured using the following formula shown in Equation (2):
The residue was then heated at 700 ± 50 °C for 30 min without a lid in a muffle furnace. After that, the crucible was then cooled in the open air and in a desiccator and weighed. The process was repeated until a constant weight was obtained. The ash (%) was measured using the following formula given in Equation (3):
Fixed carbon (%) was measured using the following formula presented in Equation (4):
2.2.2. Ultimate or Elemental Analysis
Ultimate or elemental analysis was performed to quantify carbon, hydrogen, and nitrogen by using a CHN Corder (Model MT-5 Yanaco, Co., Ltd., Yanaco, Japan). For this, a 2.5 mg maximum sample was taken for each case. Antipyrine was used for the standard value.
2.2.3. XGT-5000 Analysis
XGT-5000 uses X-ray fluorescence methodology with small spot analysis to determine the sample. The analysis was carried out to determine the mass concentration of phosphorus (P), potassium (K), sulfur (S), calcium (Ca), magnesium (Mg), zinc (Zn), copper (Cu), iron (Fe), manganese (Mn), molybdenum (Mo), chlorine (Cl), and nickel (Ni) using XGT-5000. For this, liquid nitrogen was used for the analysis. The sample was placed on the sample holder and attached with both sides of Scotch tape. Before that, the sample was kept in an oven for 30 min to dry. After mounting the sample, the sample holder was placed in the XGT. Then, data obtained from five different locations in the sample were recorded.
2.2.4. Thermogravimetric Analysis
Thermogravimetric analysis of the sample was accomplished by using a Thermogravimetric-Differential Thermal Analyzer (TG-DTA) (Model DTG-60, Shimadzu Co., Ltd., Kyoto, Japan). For analysis, around 5 mg of biomass samples were taken in a crucible. Inert gas Argon (Ar) was delivered with a continuous flow rate of 200 mL/min to make the inert condition that acts as a carrier gas. The sample was heated to 900 °C at a constant heating rate of 10 °C/min. The TGA curve was collected, and the weight loss of the samples was constantly monitored. During the heating process, the volumetric weights of each sample and furnace temperatures were recorded.
2.2.5. Functional Group Analysis
The functional groups on the surface of the food waste sample were determined by Fourier Transform Infrared (FTIR) spectroscopy (IR-6100, JASCO Co., Ltd., Hachioji, Tokyo, Japan). The blank was done before analyzing the waste samples. Then, the sample was placed on the sample holder in the instrument. An infrared spectrum averaging 64 scans at a resolution of 4 cm−1 within the 400–4000 cm−1 range was recorded.
2.2.6. pH
pH was determined with the help of a digital pH meter. A total of 0.5 g of each sample was taken into the beaker. Then, 40 mL of distilled water was added to the beaker. Then, the solution was stirred with the help of a glass rod. Then, the data were recorded after 30 min.
2.3. Statistical Analysis
The spectra of absorbance against wave number were made following Beer–Lambert’s law. IBM SPSS Statistics 20 and Microsoft Office Excel 2013 (Microsoft, Inc., Washington, DC, USA) were used for calculation and data analysis.
3. Results and Discussion
3.1. Proximate Analysis
3.1.1. Moisture Content
The moisture content of the food wastes ranged from 1.44 to 11.61 weight percent (Table 1). The lowest percentage of moisture content was recorded in the eggshells, whereas the highest was recorded in fish bone. The findings are similar to those of [28,29], who found lower moisture contents in chicken eggshells of 0.5 ± 0.03% and 0.95 ± 0.09%, respectively. Low moisture content indicates the compact structure, high stability, and long shelf life of the waste biomass. The finding was justified by the gravimetric analysis of the eggshells. The weight of the eggshells remained constant (52.5%) at temperatures above 755 °C (mention in Figure 4e). On the other hand, other plant and animal wastes had a higher moisture content than eggshells, which triggers degradation [30]. Higher moisture content makes the biomasses affable to degradation, which helps the faster release of nutrients.
3.1.2. Ash Content
The ash content of the twelve different samples is mentioned in Table 1. The result revealed that the ash content varied from 1.36 to 44.62 wt. (%). The lowest value was recorded in orange peels, and the highest value was obtained in eggshells. The results showed that animal waste contained a higher ash content than plant waste. The ash content of animal waste ranged from 39.10 to 44.62%, whereas plant waste had 1.36 to 7.79% ash. The highest ash content of eggshells was also recorded by [29], who reported 45.29 ± 0.06%. The authors of [31] reported a crude ash content of 37.86% in bone char in cow bone, which is similar to the finding in the present study. The authors of [20] stated the lowest ash content (0.9–1.6%) was in potato peels. The authors of [32,33] reported an ash content of 8.8 ± 0.54% and 6.4 to 12.8%, respectively, in banana peel, which is almost similar to the present study. The result revealed that animal waste had more mineral content than plant waste. It depicts the incombustible portion of a sample after total incineration. Ash content denotes the total mineral content of the waste sample. High ash content indicates the presence of different minerals such as Ca, K, Mn, Mg, P, Na, etc.
3.1.3. Volatile Matter (VM)
The volatile matter ranged from 31.46 to 80.04% as cited in Table 1. The highest value was recorded at 80.04% in orange peels, followed by potato peels > vegetables > brinjal waste > combined fruit > banana peels > eggshells. Compared to the two waste sources, the volatile matter was lower in the animal waste (31.46–49.68%) than in the plant waste (72.33–80.04%). The authors of [34] also described the highest volatile matter (99.261 ± 0.074%) in orange peels. Volatile matter expresses the presence of volatile organic compounds and is a vital factor in biogas production for assessing anaerobic digestion [35]. High VM in the soil may have a negative but temporary effect on soil fertilizer (causing immobilization of nitrogen) and thus the growth of crops [36,37].
3.1.4. Fixed Carbon
The result shown in Table 1 indicates that the lowest fixed carbon was found in fish bone (1.01%), while the highest was found in eggshells. The fixed carbon trend was (14.27%) banana peels > combined fruits/orange peels. The fixed carbon of the animal waste samples was lower in all but the eggshell sample. The authors of [38] stated that raw, carbonized, and acid-modified eggshells have 10%, 63.73%, and 71.28% fixed carbon, respectively. Fixed carbon is the solid combustible residue obtained after heating the biomass and driving off volatile matter, not including moisture or ash content [35]. It shows the ability to convert to char. The production of char is proportional to the amount of fixed carbon in the thermochemical conversion process.

Table 1.
Proximate analysis of different food wastes.
Table 1.
Proximate analysis of different food wastes.
| Food Waste | Proximate Analysis (%) | |||
|---|---|---|---|---|
| Moisture Content | Ash Content | Volatile Matter | Fixed Carbon | |
| Brinjal Waste | 9.10 | 6.22 | 75.44 | 9.24 |
| Potato Peels | 9.91 | 4.50 | 79.99 | 5.60 |
| Banana Peels | 5.61 | 7.79 | 72.33 | 14.27 |
| Orange Peels | 7.27 | 1.36 | 80.04 | 11.33 |
| Eggshell | 1.44 | 44.62 | 31.46 | 22.48 |
| Cow Bone | 7.99 | 41.26 | 47.92 | 2.83 |
| Chicken Bone | 8.88 | 39.10 | 49.68 | 2.34 |
| Fish Bone | 11.61 | 40.64 | 46.74 | 1.01 |
| Combined vegetables | 8.39 | 5.19 | 77.43 | 8.99 |
| Combined fruits | 6.88 | 5.24 | 74.47 | 13.41 |
| Combined animals | 7.09 | 40.42 | 49.06 | 3.43 |
| All Combined | 7.26 | 26.83 | 63.85 | 2.06 |
| Range | 1.44–11.61 | 1.36–44.62 | 31.46–80.04 | 1.01–22.48 |
| Mean | 7.62 | 21.93 | 62.37 | 8.08 |
3.2. Essential Plant Nutrient Content of Different Food Wastes
Food waste contains a significant amount of the essential plant nutrients mentioned in Table 2 and Table 3. The nutrient content of different wastes is discussed under the following nonfertilizer nutrients, primary nutrients, secondary nutrients, and micro plant nutrients as follows:
3.2.1. Non-Fertilizer Nutrients
The carbon content of waste ranged from 14.61 to 44.95% with a mean of 34.72% (Table 2). Results revealed that plant food waste and chicken bone had higher carbon concentrations than eggshells, cow bone, fish bone, and combined animal waste. The lowest carbon concentration was recorded in eggshells. The concentration is comparable with the study of [20,27,39]. The higher carbon concentration suggests that different wastes may be useful for maintaining healthy soil conditions such as soil moisture, water retention capacity, soil structure, physical stability, fertility, and productivity [40]. The concentration of another nonfertilizer element, hydrogen, was noted at 0.64–6.32% with a mean of 4.82% (Table 2). Except for eggshells, all of the waste samples had a higher hydrogen content, according to the results. The finding was similar to the findings of [20,27], who reported hydrogen concentrations of 5.96 ± 0.12% and 0.35 ± 0.01% in potato peels and eggshells, respectively. Hydrogen makes a building block with carbon and oxygen that is important for plant growth. It affects sugar formation, soil pH, and nutrient availability in the soil.
3.2.2. Primary Nutrients
Primary nutrient N ranged from 0.94 to 5.06% with a mean of 2.67% presented in Table 2. The results indicate that animal waste had the highest N content, followed by vegetable waste, fruit waste, and eggshell, respectively. The concentration was two and four times higher than that of the findings of [26,27]. On the contrary, the concentration of N in potato peels was almost half of the documented value [20]. Nitrogen is mandatory for chlorophyll synthesis and ultimately for photosynthesis. It is the component of amino acids and vitamins, thus affecting plant growth.
Waste is a potential source of phosphorus (P). P ranged from 2.38% to 28.21%. Phosphorus concentration was highest in combined fruit waste and lowest in cow bone. Findings expose the fact that plant waste has a higher concentration than animal waste. The authors of [22,23,24,26,27] recorded a significant amount of P in brinjal, potato peels, banana peels, orange peels, and eggshells, respectively. P is very important for root growth, winter hardiness, stem strength, tillering, flower formation, maturation, and seed production. It captures and converts solar energy into photosynthate [26].
Potassium (K) is another essential macro primary nutrient found in all food waste. In our study, the elements ranged from 0 to 37.92%. K was found to be higher in plant food waste than in animal food waste. Potassium concentration followed the order; brinjal waste > potato peels > combined vegetable > banana peels > combined fruits. A significant amount of K was found by [22,23,26] in brinjal, banana peels, and orange peels, respectively. The authors of [28] mentioned 0.009% K in eggshells, but during analysis, it was not detected in eggshells in the current study. K is an essential plant nutrient for photosynthesis, protein synthesis, and many other important functions. It promotes plant growth [41]. Not only that, but it also affects turgor, maintaining water balance. It increases the resistance to insect disease attack and drought tolerance.
3.2.3. Secondary Nutrients
Sulfur (S) is the secondary essential plant nutrient. Food waste contains S, except cow bone. Brinjal waste, potato peels, chicken bone, fish bone, combined vegetable, all combined, and eggshells had higher S contents than other waste. The authors of [27,42] reported the presence of S in banana peels, orange peels, and eggshells. It helps in chlorophyll synthesis, nitrogen fixation, seed production, and protein synthesis. It also helps develop the characteristic odors of onion, garlic, and mustard.
On the other hand, Ca concentration was statistically significant in different wastes. Ca concentrations ranged from 1.31% to 73%. Animal waste contained a massive amount of Ca such as combined animal (73.86%), eggshells (68.82%), cow bone (47.38%), chicken bone (45.51%), fish bone (40.23%), and all combined (34.38%). A higher concentration of Ca indicates the presence of CaCO3 in the animal waste sample. The authors of [23,24,25,26,27,28] described the presence of Ca in brinjal, potato peels, banana peels, orange peels, and eggshells, respectively. It promotes root and leaf development, nodule formation by microbial activity, and nutrient availability.
In addition, magnesium (Mg) is also an important secondary nutrient that is involved in photosynthesis, phosphate metabolism, plant respiration, enzyme system activation, phosphorus carrier activity, root formation, and water use efficiency in plants. Waste has a significant amount of Mg, especially in fruit waste and their combined sample. Potato peels, cow bones, and chicken bones were devoid of Mg. The results obtained in the current study agree with previous reports for brinjal, potato peels, banana peels, orange peels, and eggshells, respectively [21,22,23,24,25,28,29].
Table 2.
Macro plant nutrient content of different food wastes.
Table 2.
Macro plant nutrient content of different food wastes.
| Food Waste | Macro Plant Nutrients (%) | |||||||
|---|---|---|---|---|---|---|---|---|
| Non-Fertilizer | Primary Nutrients | Secondary Nutrients | ||||||
| C | H | N | P | K | S | Ca | Mg | |
| Brinjal waste | 35.71 | 5.44 | 2.17 | 11.88 bcd ± 15.888 | 37.92 a ± 24.833 | 2.45 ± 3.874 | 3.31 c ± 2.989 | 0.35 b ± 0.774 |
| Potato peels | 44.25 | 6.32 | 2.33 | 8.05 cd ± 10.917 | 24.90 ab ± 28.311 | 2.22 ± 4.099 | 3.59 c ± 7.482 | 0.0 |
| Banana peels | 44.95 | 6.00 | 1.59 | 24.96 ab ± 11.644 | 20.29 b ± 10.824 | 0.04 ± 0.094 | 1.31 c ± 0.672 | 2.24 b ± 5.00 |
| Orange peels | 42.00 | 5.48 | 1.05 | 19.38 abc ± 19.976 | 11.37 bc ± 2.557 | 0.52 ± 0.936 | 3.07 c ± 2.49 | 1.71 b ± 2.886 |
| Eggshell | 14.61 | 0.64 | 0.94 | 4.58 cd ± 4.267 | 0.0 | 1.17 ± 1.679 | 68.82 a ± 10.778 | 0.39 b ± 0.872 |
| Cow bone | 24.74 | 4.17 | 3.82 | 2.38 de ± 1.143 | 0.08 cd ± 0.094 | 0.0 | 47.38 b ± 20.67 | 0.0 |
| Chicken bone | 38.03 | 5.44 | 5.04 | 11.05 bcd ± 3.239 | 0.64 cd ± 0.499 | 1.73 ± 2.42 | 45.51 b ± 31.166 | 0.0 |
| Fish bone | 27.94 | 4.41 | 5.06 | 7.25 cd ± 8.196 | 0.39 cd ± 0.385 | 1.59 ± 2.281 | 40.23 b ± 39.001 | 15.37 a ± 29.88 |
| Combined vegetables | 42.74 | 5.78 | 2.34 | 18.32 abcd ± 16.501 | 20.96 ab ± 18.538 | 1.47 ± 2.046 | 1.51 c ± 0.999 | 0.0 |
| Combined fruits | 40.11 | 5.39 | 1.09 | 28.21 a ± 8.451 | 16.64 bc ± 7.972 | 0.02 ± 0.049 | 1.68 c ± 1.125 | 0.80 b ± 0.947 |
| Combined animals | 27.69 | 4.00 | 3.89 | 2.79 de ± 3.245 | 0.28 cd ± 0.207 | 0.41 ± 0.747 | 73.86 a ± 14.903 | 1.54 b ± 3.448 |
| All combined | 33.85 | 4.73 | 2.69 | 16.43 abcd ± 9.324 | 7.78 bc ± 1.933 | 1.20 ± 2.628 | 34.38 b ± 8.375 | 0.31 b ± 0.702 |
[Mean values in a row with uncommon superscript letters differ significantly (p < 0.05)].
3.2.4. Micro Plant Nutrient Content of Different Food Wastes
Food waste is a possible source of different micronutrients. Results showed that the studied waste contained a significant amount of Zn and was significantly different (p < 0.05) among wastes except eggshells, which was not detectable. The results noted that animal bone contained a higher amount of Zn. The authors of [22,23,25,26] described the presence of Zn in brinjal, potato peels, banana peels, and orange peels, respectively. It helps with plant growth regulation and protein synthesis. In the absence of Zn, plants become dwarfs. Similarly, Cu plays an important role in chlorophyll formation, vitamin and protein synthesis, and enzyme activity. This study also recorded a significant amount of Cu in the waste that has been justified by [21,22,23,24,25,26,28,29]. In addition, higher concentrations of Fe in different wastes were determined by the XGT method. They also quantified the Fe concentration in brinjal waste, potato peels, banana peels, orange peels, and eggshells, respectively. Fe is an acid-forming nutrient in soil and helps in chlorophyll formation, hindering interveinal chlorosis.
Table 3.
Micro plant nutrient content of different food wastes.
Table 3.
Micro plant nutrient content of different food wastes.
| Waste | Micro Plant Nutrients (%) | ||||||
|---|---|---|---|---|---|---|---|
| Zn | Cu | Fe | Mn | Mo | Cl | Ni | |
| Brinjal waste | 0.030 abc ± 0.021 | 0.046 a ± 0.043 | 0.774 a ± 0.681 | 0.206 a ± 0.276 | 0.016 bc ± 0.025 | 2.912 ab ± 2.137 | 0.028 ± 0.028 |
| Potato peels | 0.008 cde ± 0.008 | 0.030 ab ± 0.022 | 0.734 ab ± 1.303 | 0.034 b ± 0.044 | 0.006 bc ± 0.009 | 4.142 a ± 2.057 | 0.020 ± 0.029 |
| Banana peels | 0.006 cde ± 0.005 | 0.006 bc ± 0.005 | 0.040 bc ± 0.025 | 0.010 b ± 0.017 | 0.048 ab ± 0.029 | 2.446 abc ± 2.364 | 0.010 ± 0.007 |
| Orange peels | 0.004 de ± 0.005 | 0.016 bc ± 0.015 | 0.078 ab ± 0.026 | 0.024 b ± 0.029 | 0.142 ab ± 0.026 | 1.992 abc ± 3.116 | 0.020 ± 0.014 |
| Eggshell | 0.0 | 0.006 bc ± 0.005 | 0.024 bc ± 0.013 | 0.0 | 0.042 bc ± 0.019 | 0.032 cd ± 0.038 | 0.006 ± 0.005 |
| Cow bone | 0.028 bcd ± 0.013 | 0.020 ab ± 0.010 | 0.286 ab ± 0.311 | 0.004 b ± 0.009 | 0.092 ab ± 0.063 | 0.052 cd ± 0.028 | 0.014 ± 0.005 |
| Chicken bone | 0.046 ab ± 0.015 | 0.030 ab ± 0.031 | 0.566 ab ± 0.506 | 0.038 b ± 0.085 | 0.310 a ± 0.322 | 3.462 a ± 1.893 | 0.032 ± 0.035 |
| Fish bone | 0.044 ab ± 0.038 | 0.028 ab ± 0.028 | 0.126 ab ± 0.156 | 0.034 b ± 0.050 | 0.146 ab ± 0.187 | 0.518 bc ± 0.710 | 0.012 ± 0.013 |
| Combined vegetables | 0.009 cde ± 0.005 | 0.010 bc ± 0.000 | 0.418 ab ± 0.421 | 0.024 b ± 0.038 | 0.260 ab ± 0.448 | 4.022 a ± 3.536 | 0.010 ± 0.012 |
| Combined fruits | 0.002 ef ± 0.004 | 0.006 bc ± 0.005 | 0.026 bc ± 0.011 | 0.004 b ± 0.005 | 0.038 bc ± 0.019 | 2.728 abc ± 1.062 | 0.006 ± 0.005 |
| Combined animals | 0.052 a ± 0.028 | 0.022 ab ± 0.008 | 0.258 ab ± 0.208 | 0.010 b ± 0.014 | 0.128 ab ± 0.194 | 0.656 bc ± 0.868 | 0.016 ± 0.009 |
| All combined | 0.024 bcde ± 0.011 | 0.012 bc ± 0.008 | 0.122 ab ± 0.046 | 0.010 b ± 0.010 | 0.070 ab ± 0.029 | 1.716 abc ± 1.276 | 0.016 ± 0.009 |
[Mean values in a row with uncommon superscript letters differ significantly (p < 0.05)].
Food waste contains a significant amount of Mn and is similar to those reported previously [21,22,23,24,25,26]. Mn affects photosynthesis, germination, and maturation, as well as P and Ca availability. On the other hand, Cl concentration was higher than other micronutrients except in eggshells, cow bone, fish bone, and combined animal waste comparatively. The concentration of Cl in banana peels is comparable with the finding of [39]. It affects stomatal regulation. In addition, a considerable amount of Mo is found in food waste, ranging from 0.006 ± 0.009% in potato peels to 0.310 ± 0.322% in chicken bone (Table 3). Mo, when added to soil, aids in the synthesis of the nitrate reductase enzyme, which is essential for nitrogen fixation. Ni concentrations are generally low when compared to allowable limits for soil. Therefore, the waste may not leach a significant amount of Ni into the soil. Ni plays a great role in enzyme formation and nitrogen metabolism.
3.3. pH
The waste materials used in the study were slightly acidic in nature. The pH ranged from 6.67 to 6.82 (Figure 1). These wastes contain acid-forming ions such as H, and Fe and basic-forming ions such as Ca, Mg, etc. Therefore, this waste can be used to cover most of the agricultural soils after proper treatment. In another study, pH was recorded at 5.24 in eggplant peels [43], 5.99 in potato peels [44], 6.59 in banana peels [45], 6.62 ± 2.2 in orange peels [46], 6.59 in eggshells [47], 6.2 in meat bone [48], and 5.4 in fish sludge [48], which was similar to the present study. As the pH of the waste is less than 7, it can easily be used on almost all agricultural soils, especially calcareous soil [49]. pH affects the nutrient availability of the plants. Most agricultural crops prefer neutral soil pH. For example, P fixation is insisted in extremely low or high soil pH conditions that make P unavailable to the crop. As waste biomasses possess almost neutral pH, so it might facilitate nutrient availability in the soil.
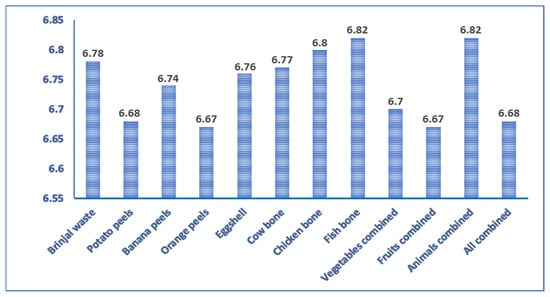
Figure 1.
pH of different non-edible food waste.
3.4. Correlation Analysis
Pearson’s correlation coefficient was calculated to find out the correlation of different nutrients in waste used in the study mentioned in Supplementary Tables S1–S12. A positive value represents a significant correlation, whereas a negative value indicates a negative correlation. The elements with strong associations suggest that they could work in tandem when applied to soils. In summary, the analysis of essential plant nutrients in different food wastes showed that there are significant correlations between different nutrients in different waste samples. For example, phosphorus had a strong correlation with magnesium and molybdenum in brinjal waste, while potassium was correlated with calcium, iron, manganese, and nickel in the same waste. In banana peels, phosphorus had a significant relationship with sulfur, while potassium was correlated with calcium, copper, iron, manganese, chlorine, and nickel. In orange peels, a strong correlation of potassium was found with sulfur, copper, iron, chlorine, and nickel. The correlations between different nutrients varied among the different waste samples, indicating that the nutrient content of food waste is complex and may be influenced by the specific characteristics of the waste. These findings suggest that food waste has the potential to be used as a source of essential plant nutrients and could potentially be used as a soil amendment to improve soil health and crop production. The interactions or strong correlations of some elements have been reported in previous studies [49,50,51,52]. Chowdhury et al. [49] reported a strong correlation between P/K/S/Mg/Mn/Fe in aloe vera plants when treated with organic and inorganic fertilizers. However, interactions between elements in plants may emerge when a plant absorbs significant quantities of an accessible element and its concentration in the plant reaches excessive or dangerous levels that interfere with the normal metabolic processes of another element. Interactions discovered inside plants between elements have also suggested that these processes are highly complicated, being both antagonistic and synergistic in nature at the same time, and are sometimes engaged in the metabolism of more than two elements [50,51]. For example, high absorption of Zn by a plant may impair the metabolic activity of Fe, and the plant may suffer from Fe chlorosis even when Fe is present in normal quantities in the plant [51]. In this scenario, there appears to be an antagonistic interaction between Fe and Zn. Interaction processes are governed by numerous processes, and these processes are influenced by several other elements.
3.5. Principal Component Analysis (PCA)
Principal component analysis (PCA) was performed by maximizing the sum of the variances of the component coefficients of nutrient concentration by utilizing varimax rotation and Kaiser normalization. It was performed to point out the association of essential plant nutrients in different waste samples. Similar components extracted for the nutrients indicate or confirm that they could work in tandem or in synergy when applied to soils. A PCA plot of brinjal waste showed four clusters (Figure 2a). Ca, Mn, Cu, Zn, Fe, K, and Ni; Zn, Cu, and Cl; Mo and Mg; P, S, Ca, and Mn were found in PC1 (55.91%), PC2 (21.10%), PC3 (13.62%), and PC4 (9.38%), respectively.
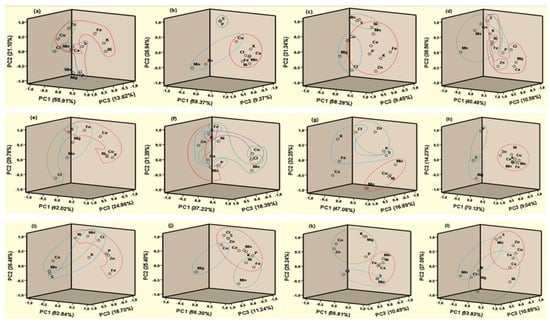
Figure 2.
Principal Component (PC) plot of different waste ((a). brinjal waste, (b). potato peels, (c). banana peels, (d). orange peels, (e). eggshell, (f). cow bone, (g). chicken bone, (h). fish bone, (i). combined vegetable, (j). combined fruit, (k). combined animal, and (l). all combined).
Three clusters were found, namely PC1 (59.37%), PC2 (26.94%), and PC3 (9.37%), which contained Ca, Mn, Cu, Fe, K, Ni, and Cl; P and S; Mo, Zn, and Cu, respectively, in potato peels (Figure 2b). In addition, three groups, PC1 (58.26%), PC2 (31.34%), and PC3 (9.45%) were found to contain P, K, Ca, Zn, Cu, Fe, Mo, Ni, and Cl; S, Mn, and Ni; Mg, Cu, and Cl, respectively in banana peels. K, S, Ni, Fe, Zn, Ca, Mg, and Cl were found in PC1 (40.46%), PC2 (38.56%), PC3 (10.58%), and PC4 (10.40%); Mn, Mo, Cu, S, K, Ni, and Fe; P and S; Zn and Ni were found in orange peels (Figure 2d).
Eggshell PCA showed three bunches of interactions such as PC1 (42.02%), PC2 (29.78%), and PC3 (24.86%) containing S, Fe, Ca, P, Cu, Ni; S and Cl; S, Fe, Mg, and Mo, respectively (Figure 2e). Similarly, four strong correlations were observed among Mn, Zn, K, and Fe in PC1 (37.22%); Cu, Mo, Ni, Fe, and Ca in PC2 (31.39%); P, Zn, and Fe in PC3 (18.39%); K, Cu, and Cl in PC4 (13.01%) in cow bone (Figure 2f). On the other hand, in chicken bone, three groups of nutrients interacted among Mo, Cu, Mn, and Ni; Zn, P, and Cl; K, S, Fe, and Cl, respectively, mentioned in Figure 2g. In the case of fish bone, PC1 K, Ca, Zn, Cu, Mo, Fe, Mn, and Ni were strongly correlated. Similarly, combined vegetables, fruits, animals, and all waste material showed three strong correlations in PCA analysis (Figure 2i–l). The components extracted were comparable with those extracted for maize biomass [53] and some edible crops [54].
3.6. Hierarchical Cluster Analysis (HCA)
Hierarchical cluster analysis (HCA) is an analytical tool for understanding the relationships and togetherness of a group. For this, a tree branch-like diagram is made that illustrates the extent of the relationship between parameters [53].
A dendrogram of mineral nutrients in brinjal waste showed a similar correlation among Zn, Cu, Ni, Mo, Mn, Mg, Fe, Cl, Ca, and S. This might be uptaken and accumulated in the brinjal peduncle, and fruits from the organic matter used during production. On the other hand, a second cluster was observed with Ca, S, and P that relates to the supply of macronutrients applied during production (Figure 3a). In the case of banana peels, the largest group of Zn, Mo, Mg, Cu, Ni, Mn, Fe, S, and Cl may be obtained from the soil from organic matter used in the soil. Fe and Ca remained in the same group that relates to P and K and were predicted to come from the chemical fertilizer sources (Figure 3b). Correlation among Cu, Ni, Zn, Mn, Fe, Mo, S, Ca, and Cl was observed among similar groups that may be obtained from the inorganic sources of fertilizers. Two identical clusters were observed in S and Mg as well as P and K that related to each other, mentioning the chemical fertilizer sources (Figure 3c). For orange peels, a strong correlation was noted among Ca, Cl, Mg, S, Mo, Fe, Mn, Zn, Ni, and Co, which can be explained by the sources of this nutrient from inorganic manure used during the cultivation (Figure 3d). Chemical fertilizers also provide nutrients K and S, as well as P. Similar types of findings were observed in the cases of vegetable (Figure 3i) and combined fruit (Figure 3j) waste materials.
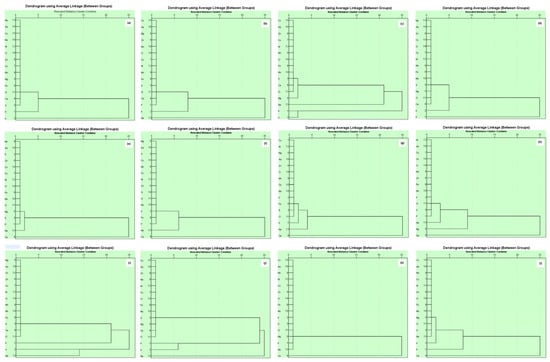
Figure 3.
Hierarchical cluster analysis showing grouping of essential plant nutrients of different waste ((a). brinjal waste, (b). potato peels, (c). banana peels, (d). orange peels, (e). eggshell, (f). cow bone, (g). chicken bone, (h). fish bone, (i). combined vegetable, (j). combined fruit, (k). combined animal, and (l). all combined).
The dendrogram for the eggshells showed that the strong correlation among P, S, Mg, Cl, Mo, Fe, Ni, Cu, K, Mn, and Zn was probably derived from plant sources such as wheat, sorghum, maize, and soybean. Another interaction was found between Ca and Mg, which may be obtained from limestone (Figure 3e). The result was justified by the findings of [54]. A similar pattern of sources was described for chicken bones (Figure 3g). In cow bone, a strong correlation was noted among P, Fe, K, Mo, Cl, Zn, Ni, Cu, Mn, Mg, and S, which may be accumulated by the feed, namely green grass, straw, etc., and another correlation between K and Ca was recorded, possibly for the soybean oil cake (Figure 3f). In the case of fish, the significant amount of interaction among P, S, Cl, K, K, Mo, Fe, Mn, Zn, and Ni, was assumed to be due to the poultry litter and other feeds used during the rearing of fish. In addition, Mg and Cl, which are connected with Ca, may be from the lime used in the pond (Figure 3h). The finding is comparable with the combined animal waste (Figure 3k). In combined waste, four groups showed different sources of nutrients (Figure 3l). The result of the HCA agrees with the PCA and is also comparable with previous reports [55].
3.7. Degradation Process and Thermal Stability Assessment
Thermogravimetric analysis represents the thermal stability of the food waste used in the study. The result revealed that the weight was reduced sharply with increasing temperature in brinjal waste till at 510 °C when the weight reached 11% (Figure 4a). Then, the weight remains constant even after the temperature increases. Similarly, the weight of the potato, orange peels, and the combined vegetable sample was reduced abruptly with rising temperature to 8%, 6%, and 12% at 543 °C (Figure 5b), 530 °C (Figure 5d), and 580 °C (Figure 4i), respectively. Then, the weight did not change with the increasing temperature. However, the banana peel weight lowered gradually with increasing temperature, up to 7% at 880 °C (Figure 4c) and then showed no change in weight even with increasing temperature. In the case of the combined fruits sample, the weight decreased rapidly with increasing temperature to 20% at 495 °C (Figure 4j). Then, the weight was released very slowly until 674 °C when the weight was 12.8%. Then, the sample weight was not reduced with increasing temperature. The result revealed that the plant waste sample was easily degradable.
The result revealed that about 12% of the mass of eggshells was lost gradually at 650 °C. Then, a sharp weight loss occurred between 650 °C and 755 °C to reach 52.5% weight, and then the weight remained almost identical (Figure 4e). Furthermore, the weight of cow bone, chicken bone, and fish bone sharply increased up to 52%, 35%, and 57% at a temperature of 540 °C (Figure 5f), 600 °C (Figure 5g), 580 °C (Figure 4h), respectively. After this temperature, the weight remained almost constant. However, as the temperature rose, combined animal samples and all combined samples lost significant weight. The weight loss accounts for 42% and 34% at 513 °C and 484 °C, respectively. Then, the loss occurred gradually until the weight was 55.8% and 31% lower at 674 °C (Figure 4k) and 680 °C (Figure 4l), respectively. The weight remained approximately unchanged from 674 °C and 680 °C for combined animal samples and all combined samples and onward. Overall, the result showed that the eggshells had resistance to high temperatures, which is due to their low moisture content as found by proximate analysis (Table 1).

Figure 4.
Thermogravimetric analysis of different food waste ((a). brinjal waste, (b). potato peels, (c). banana peels, (d). orange peel, (e). eggshell, (f). cow bone, (g). chicken bone, (h). fish bone, (i). combined vegetable, (j). combined fruits, (k). combined animal, and (l). all combined).
Figure 4.
Thermogravimetric analysis of different food waste ((a). brinjal waste, (b). potato peels, (c). banana peels, (d). orange peel, (e). eggshell, (f). cow bone, (g). chicken bone, (h). fish bone, (i). combined vegetable, (j). combined fruits, (k). combined animal, and (l). all combined).


Figure 5.
FTIR analysis of different non-edible food waste ((a). brinjal waste, (b). potato peels, (c). banana peels, (d). orange peel, (e). eggshell, (f). cow bone, (g). chicken bone, (h). fish bone, (i). combined vegetable, (j). combined fruits, (k). combined animal, and (l). all combined).
Figure 5.
FTIR analysis of different non-edible food waste ((a). brinjal waste, (b). potato peels, (c). banana peels, (d). orange peel, (e). eggshell, (f). cow bone, (g). chicken bone, (h). fish bone, (i). combined vegetable, (j). combined fruits, (k). combined animal, and (l). all combined).

3.8. Chemical Functionality Assessment
FTIR spectroscopy was used to find out the available functional groups on the surface of the food waste [56]. Figure 5 depicts the FTIR spectra of twelve different non-edible plant and animal food wastes. The result showed that the intensity of absorption varied with the sample used during the study (Table 4). A strong, broad peak was formed in all FTIR spectra within the range of 3270 to 3285 cm−1 wave number except eggshells (3732 cm−1), which represents the presence of an alcoholic group (OH) stretching band. It indicates the presence of polymeric compounds such as carbohydrates and lignin in the waste materials. The finding is established by the results of [25,57,58,59,60,61].
Table 4.
Comparison of the functional groups of different wastes.
A narrow and a medium peak were also found in the individual vegetables, fruit, and their combined samples. On the other hand, a sharp, narrow, strong peak was noted in all animal waste except eggshells. The narrow, intense absorption peak is associated with the stretching of the C–H mode, which indicates an aliphatic chain that is the main structure of lignocellulosic compounds [58,61]. Similar narrow and strong peaks were also found in the animal waste sample. The narrow, intense peak corresponds to the symmetric stretching of C–H mode (aliphatic chain), constructing the main structure of lignocellulosic compounds [25,59,61]. A narrow and a medium peak were recorded at 2166 cm−1 and 2170 cm−1 in orange peels and eggshells, respectively. The peak is related to the stretching of the SCN (thiocyanate) mode. Furthermore, two small narrow peaks at 2036 cm−1 and 1984 cm−1 that signify NCS and C–H (aromatic compound) stretching bands were observed.
A narrow peak was detected in the FTIR spectrum of orange peel, cow bone, chicken bone, fish bone, and combined animal waste within a 1730 to 1740 cm−1 wavenumber link with the C=O stretching band. The functional group is associated with fatty acids, phospholipids, and suberin [59,62,63]. An identical narrow and medium peak was formed in all waste samples except banana peels, eggshells, and combined fruit with a range of 1604 cm−1–138 cm−1. The narrow and intense absorption peak indicates the presence of stretching of N–H vibrations that signifies the element of amino acids and proteins [58,59]. On the other hand, [63,64,65] described the stretching of the C=C band at 1608 cm−1 and 1638 cm−1 in orange peel and cow bone, respectively. In addition, a narrow and medium peak was formed in brinjal waste at 1585 cm−1 that mentioned the stretching band of the aromatic C=C stretching mode. In addition, a narrow peak of cow bone, chicken bone, fish bone, and combined fruit with a range of 1533 cm−1–1593 cm−1 was ascribed to nitro compounds (N=O).
The peaks obtained at 1465 cm−1 and 1455 cm−1 ascribed to the C–H stretching band indicate the presence of a methyl group. Similarly, a peak at 1400 cm−1, 1404 cm−1, 1408 cm−1, and 1410 cm−1 under the spectrum of all combined, eggshell, fish bone, and combined animal waste suggests the S=O stretching vibrations that indicate the presence of protein. The band at 1360 cm−1 to 1385 cm−1 in different waste corresponded to O–H stretching vibrations that indicate the existence of free and intermolecular bonded hydroxyl groups.
The stretching band of C–O was noted at 1245 cm−1 for brinjal and potato peels, which indicated the presence of fatty acid. On the other hand, the vibration band of a C–N was noted at 1235 cm−1 to 1240 cm−1 from the animal waste spectrum. The functional group is the skeletal frame of the protein. However, in the case of orange peel, a C–H stretching band with an alkyl group was noticed. The peak at 1158 cm−1 to 1170 cm−1 ascribed to C–O stretching in cow bone, chicken bone, and combined animal samples implies the presence of tertiary alcohol. The band around 1007 cm−1 to 1028 cm−1 represents the presence of the C–N or C–F stretching band, which is an element of protein and floro compounds. A C–H stretching band was noticed at 869 cm−1 and 870 cm−1, which indicated the presence of lignocellulosic materials in eggshells and combined animal waste. The peaks at 708 cm−1 and 718 cm−1 were due to C=C stretching present in aromatic rings.
4. Conclusions
Overall, the results of the present study provide insights into the characteristics and potential use of food waste as a source of essential plant nutrients and as a soil amendment. The proximate analysis showed that food waste contains a range of nutrients, with plant wastes generally having higher concentrations of volatile matter and lower concentrations of ash compared to animal wastes. The analysis of essential plant nutrients revealed that food waste has the potential to be used as a source of non-fertilizer nutrients, primary nutrients, secondary nutrients, and micronutrients. The presence of significant correlations between different nutrients in the waste samples suggests that they may work together when applied to soil, potentially improving soil health and crop production. The thermogravimetric analysis results showed that the thermal stability of food waste varies based on its moisture content and the presence of different nutrients, and the FTIR spectroscopy results identified various functional groups present on the surface of the waste samples. These findings indicate that food waste has the potential for use as a source of plant nutrients and as a soil amendment, and further research is needed to fully understand and optimize its use in these applications.
Supplementary Materials
The following supporting information can be downloaded at: www.mdpi.com/article/10.3390/pr11010250/s1, Table S1: Correlation matrix for essential plant nutrients in brinjal waste. Table S2: Correlation matrix for essential plant nutrients in potato peels. Table S3: Correlation matrix for essential plant nutrients in banana peels. Table S4: Correlation matrix for essential plant nutrients in orange peels. Table S5: Correlation matrix for essential plant nutrients in eggshell. Table S6: Correlation matrix for essential plant nutrients in cow bone. Table S7: Correlation matrix for essential plant nutrients in chicken bone. Table S8: Correlation matrix for essential plant nutrients in fish bone. Table S9: Correlation matrix for essential plant nutrients in vegetable combined. Table S10: Correlation matrix for essential plant nutrients in fruit combined. Table S11: Correlation matrix for essential plant nutrients in animal combined. Table S12: Correlation matrix for essential plant nutrients in all combined.
Author Contributions
Conceptualization: M.R.I. and Q.W.; methodology: M.R.I. and Y.G.; validation; Q.W.; formal analysis: M.R.I.; investigation: M.R.I.; writing—original draft preparation: M.R.I. and C.E.E.; writing—review and editing: M.R.I., Q.W., W.W. and S.S.; supervision: Q.W.; funding acquisition: Q.W. All authors have read and agreed to the published version of the manuscript.
Funding
This study was partially supported by the Special Funds for Innovative Area Research (No. 20120015, FY 2008-FY2012) and Basic Research (B) (No. 24310005, FY2012-FY2014; No. 18H03384, FY2017-FY2020; No. 22H03747, FY2022-FY2024) of Grant-in-Aid for Scientific Research of Japanese Ministry of Education, Culture, Sports, Science and Technology (MEXT).
Institutional Review Board Statement
Not applicable.
Informed Consent Statement
Not applicable.
Data Availability Statement
The data presented in this study are available on request from the corresponding author. The data are not publicly available since these data are published for the first time. The authors have no problems providing them on request.
Conflicts of Interest
The authors declare that they have no known competing financial interests or personal relationships that could have influenced the research presented in this study.
References
- Martínez, Z.N.; Pachón-Ariza, F. Food loss in a hungry world, a problem? Agron. Colomb. 2014, 32, 283–293. [Google Scholar]
- UNEP. UNEP Food Waste Index Report 2021|UNEP-UN Environment Programme, 2021. Available online: https://www.unep.org/resources/report/unep-food-waste-index-report-2021 (accessed on 4 April 2022).
- FAO. The State of Food and Agriculture 2020. Overcoming Water Challenges in Agriculture. Rome, Italy. Available online: https://www.fao.org/3/cb1447en/cb1447en.pdf (accessed on 15 November 2022).
- FAO. The State of Food and Agriculture 2013. Food Systems for Better Nutrition. Rome, Italy. Available online: https://www.fao.org/3/i3300e/i3300e.pdf (accessed on 15 November 2022).
- Kaza, S.; Yao, L.; Bhada-Tada, P.; Van Woerden, F. What a Waste 2.0: A Global Snapshot of Solid Waste Management to 2050; World Bank Group: Washington, DC, USA, 2018. [Google Scholar]
- Vaverková, M.D. Landfill impacts on the environment—Review. Geosciences 2019, 9, 431. [Google Scholar] [CrossRef]
- Amin, A.N. State of the 3Rs in Asia and the Pacific Country Chapter: The People’s Republic of Bangladesh. United Nations Center for Regional Development. 2017, pp. 1–37. Available online: https://www.uncrd.or.jp/content/documents/6777[full%20document]%20State%20of%20the%203Rs%20in%20Asia%20and%20the%20Pacific.pdf (accessed on 20 June 2022).
- Njoku, P.O.; Edokpayi, J.N.; Odiyo, J.O. Health and environmental risks of residents living close to a landfill: A case study of thohoyandou landfill, Limpopo province, South Africa. Int. J. Environ. Res. Public Health 2019, 16, 2125. [Google Scholar] [CrossRef]
- De Feo, G.; De Gisi, S.; Williams, I.D. Public perception of odour and environmental pollution attributed to MSW treatment and disposal facilities: A case study. Waste Manag. 2013, 33, 974–987. [Google Scholar] [CrossRef]
- Ibtisam, B.; Ghaffar, A. Ground water quality assessment near mehmood boti landfill, lahore, pakistan. Asian J. Soc. Sci. Humanit. 2012, 1, 13–24. [Google Scholar]
- Abd El-Salam, M.M.; Abu-Zuid, G.I. Impact of landfill leachate on the groundwater quality: A case study in Egypt. J. Adv. Res. 2015, 6, 579–586. [Google Scholar] [CrossRef]
- Urme, S.A.; Radia, M.A.; Alam, R.; Chowdhury, M.U.; Hasan, S.; Ahmed, S.; Sara, H.H.; Islam, M.S.; Jerin, D.T.; Hema, P.S.; et al. Dhaka landfill waste practices: Addressing urban pollution and health hazards. Build. Cities 2021, 2, 700–716. [Google Scholar] [CrossRef]
- Nabavi-Pelesaraei, A.; Bayat, R.; Hosseinzadeh-Bandbafha, H.; Afrasyabi, H.; Wing Chau, K. Modeling of energy consumption and environmental life cycle assessment for incineration and landfill systems of municipal solid waste management-A case study in Tehran Metropolis of Iran. J. Clean. Prod. 2017, 148, 427–440. [Google Scholar] [CrossRef]
- FAO. Appropriate Food Packaging Solutions for Developing Countries. 2011. Available online: https://www.fao.org/3/mb061e/mb061e00.pdf (accessed on 20 June 2022).
- FAO. Food Loss and Food Waste: Causes and Solutions. 2011. Available online: https://www.fao.org/3/i2697e/i2697e.pdf (accessed on 17 June 2022).
- EC. Guidelines on the Preparation of Food Waste Prevention Programmes. 2011, pp. 1–32. Available online: https://ec.europa.eu/environment/pdf/waste/prevention/prevention_guidelines.pdf (accessed on 17 June 2022).
- Chris, M.; Andrews, J. Food Waste Collection Guidance. Wrap Rotate Wrap. 2009, pp. 1–49. Available online: https://www.zerowastescotland.org.uk/sites/default/files/Information%20on%20collecting%20food%20waste%20for%20recycling.pdf (accessed on 17 June 2022).
- UK. Managing Food Waste in the NHS 2005. 2005. Available online: https://www.emerald.com/insight/content/doi/10.1108/nfs.2005.01735eab.010/full/html (accessed on 20 June 2022).
- UNDP. Sustainable Development Goals|United Nations Development Programme. 2015. Available online: https://www.undp.org/sustainable-development-goals#responsible-consumption-and-production (accessed on 5 June 2022).
- Javed, A.; Ahmad, A.; Tahir, A.; Shabbir, U.; Nouman, M.; Hameed, A. Potato peel waste-its nutraceutical, industrial and biotechnological applacations. AIMS Agric. Food 2019, 3807, 807–823. [Google Scholar] [CrossRef]
- Quamruzzaman, A.K.M.; Khatun, A.; Islam, F. Nutritional Content and Health Benefits of Bangladeshi Eggplant cultivars. Eur. J. Agric. Food Sci. 2020, 2, 807–823. [Google Scholar]
- Sharma, M.; Kaushik, P. Biochemical composition of eggplant fruits: A review. Appl. Sci. 2021, 11, 7078. [Google Scholar] [CrossRef]
- Jekayinfa, S.O.; Linke, B.; Pecenka, R. Biogas production from selected crop residues in Nigeria and estimation of its electricity value. Int. J. Renew. Energy Technol. 2015, 6, 101. [Google Scholar] [CrossRef]
- Hassan, N.N.; Hassan, H.F.; Usher, U.F.; Ibrahim, O.A.; Tabe, A.B. Exploring the Potentials of Banana (Musa Sapietum) Peels in Feed Formulation. Int. J. Adv. Res. Chem. Sci. 2018, 5, 10–14. [Google Scholar]
- Oguntade, O.B. Bukunola, Removal of Nickel Ions from Aqueous Solution by Adsorption Using Powdered Fishbone. J. Multidiscip. Eng. Sci. Technol. 2019, 6, 11051–11055. [Google Scholar]
- Abdelazem, R.E.; Hefnawy, H.T.; El-Shorbagy, G.A. Chemical composition and phytochemical screening of Citrus sinensis (orange) peels. Zagazig J. Agric. Res. 2021, 48, 793. [Google Scholar] [CrossRef]
- Tsai, W.T.; Yang, J.M.; Lai, C.W.; Cheng, Y.H.; Lin, C.C.; Yeh, C.W. Characterization and adsorption properties of eggshells and eggshell membrane. Bioresour. Technol. 2006, 97, 488–493. [Google Scholar] [CrossRef]
- Al-awwal, N.Y.; Ali, U.L. Proximate Analyses of Different Samples of Egg Shells Obtained from Sokoto Market in Nigeria. Int. J. Sci. Res. 2015, 4, 564–566. [Google Scholar]
- Ajala, E.O.; Eletta, O.A.A.; Ajala, M.A.A.; Oyeniyi, S.K. Characterization and evaluation of chicken eggshell for use as a bio-resource. Arid Zo. J. Eng. Technol. Environ. 2018, 14, 26–40. [Google Scholar]
- Ooi, D.J.; Iqbal, S.; Ismail, M. Proximate composition, nutritional attributes and mineral composition of Peperomia pellucida L. (ketumpangan air) grown in Malaysia. Molecules 2012, 17, 11139–11145. [Google Scholar] [CrossRef]
- Khalil; Reswati; Ferawati; Kurnia, Y.F.; Agustin, F. Studies on physical characteristics, mineral composition and nutritive value of bone meal and bone char produced from inedible cow bones. Pakistan J. Nutr. 2017, 16, 426–434. [Google Scholar]
- Pyar, H.; Peh, K.K. Chemical compositions of banana peels (Musa sapientum) fruits cultivated in Malaysia using proximate analysis. Res. J. Chem. Environ. 2018, 22, 108–113. [Google Scholar]
- Emaga, T.H.; Agneesens, J.B.R.; Wathelet, A.B.B. Ripening influences banana and plantain peels composition and energy content. Trop. Anim. Health Prod. 2011, 43, 171–177. [Google Scholar] [CrossRef]
- Ayala, C.A.S.; Ayala, D.G.M.J.R.; Montero, G.; Coronado, M.A.; Garcia, C.; Curiel-Alvarez, M.A.; León, J.A. Characterization of orange peel waste and valorization to obtain reducing sugars. Molecules 2021, 26, 1348. [Google Scholar] [CrossRef] [PubMed]
- Cavalaglio, G.; Cotana, F.; Nicolini, A.; Coccia, V.; Petrozzi, A.; Formica, A.; Bertini, A. Characterization of Various Biomass Feedstock Suitable for Small-Scale Energy Plants as Preliminary Activity of Biocheaper Project. Sustainability 2020, 12, 6678. [Google Scholar] [CrossRef]
- Deenik, J.L.; Diarra, A.; Uehara, G.; Campbell, S.; Sumiyoshi, Y.; Antal, M.J. Charcoal ash and volatile matter effects on soil properties and plant growth in an acid ultisol. Soil Sci. 2011, 176, 336–345. [Google Scholar] [CrossRef]
- Maaz, T.M.C.; Hockaday, W.C.; Deenik, J.L. Biochar volatile matter and feedstock effects on soil nitrogen mineralization and soil fungal colonization. Sustainability 2021, 13, 2018. [Google Scholar] [CrossRef]
- Emaga, T.H.; Andrianaivo, R.H.; Wathelet, B.; Tchango, J.T.; Paquot, M. Effects of the stage of maturation and varieties on the chemical composition of banana and plantain peels. Food Chem. 2007, 103, 590–600. [Google Scholar] [CrossRef]
- Orozco, R.S.; Hernández, P.B.; Morales, G.R.; Núñez, F.U.; Villafuerte, J.O.; Lugo, V.L.; Ramírez, N.F.; Díaz, C.E.B.; Vázquez, P.C. Characterization of lignocellulosic fruit waste as an alternative feedstock for bioethanol production. BioResources 2014, 9, 1873–1885. [Google Scholar]
- Ebere, E.C.; Amarachukwu, E.; Wirnkor, V.A.; Ngozi, P. Physicochemical Parameter of Palm Oil and Soil from Ihube Community, Okigwe, Imo State Nigeria. Int. Lett. Nat. Sci. 2017, 62, 35–43. [Google Scholar]
- White, P.J.; Karley, A.K. Potassium. Cell Biol. Met. Nutr. 2010, 17, 199–224. [Google Scholar]
- Pathak, P.D.; Puranik, N.M.; Jaygopal, S.; Ambedkar, J.B.; Mandavgane, S.A. Valorization of Potato Peel: A biorefinery approach Anaerobic digestion and composting View project MTech Project View project. Crit. Rev. Biotechnol. 2018, 38, 218–230. [Google Scholar] [CrossRef]
- Hosseini, S.; Gharachorloo, M.; Ghiassi-Tarzi, B.; Ghavami, M. Evaluation of the organic acids ability for extraction of anthocyanins and phenolic compounds from different sources and their degradation kinetics during cold storage. Polish J. Food Nutr. Sci. 2016, 66, 261–269. [Google Scholar] [CrossRef]
- Joshi, A.; Dabhi, M.N.; Kashyap, R. Extraction of Enzymes from Potato Peels Substrate using Bacillus subtilis. Int. J. Curr. Microbiol. App. Sci. 2015, 4, 451–458. [Google Scholar]
- Mondal, N.K.; Roy, A. Potentiality of a fruit peel (banana peel) toward abatement of fluoride from synthetic and underground water samples collected from fluoride affected villages of Birbhum district. Appl. Water Sci. 2018, 8, 90. [Google Scholar] [CrossRef]
- Irkin, R.; Dogan, S.; Degirmenioglu, N.; Diken, M.E.; Guldas, M. Phenolic content, antioxidant activities and stimulatory roles of citrus fruits on some lactic acid bacteria. Arch. Biol. Sci. 2015, 67, 1313–1321. [Google Scholar] [CrossRef]
- Bhaumik, R.; Mondal, N.K.; Das, B.; Roy, P.; Pal, K.C.; Das, C. Eggshell powder as an adsorbent for Removal of fluoride from aqueous solution. J. Chem. 2012, 9, 1457–1480. [Google Scholar]
- Brod, E.; Øgaard, A.F.; Hansen, E.; Wragg, D.; Haraldsen, T.K.; Krogstad, T. Waste products as alternative phosphorus fertilisers part I: Inorganic P species affect fertilisation effects depending on soil pH. Nutr. Cycl. Agroecosystems 2015, 103, 167–185. [Google Scholar] [CrossRef]
- Chowdhury, T.; Chowdhury, M.A.H.; Qingyue, W.; Enyoh, C.E.; Wang, W.; Khan, M.S.I. Nutrient uptake and pharmaceutical compounds of Aloe vera as influenced by integration of inorganic fertilizer and poultry manure in soil. Heliyon 2021, 7, e07464. [Google Scholar] [CrossRef]
- Kabata-Pendias, A.; Pendias, H. Trace Elements in Soils and Plants; CRC Press, Inc.: Boca Raton, FL, USA, 1984; Available online: https://www.scirp.org/(S(351jmbntvnsjt1aadkposzje))/reference/ReferencesPapers.aspx?ReferenceID=1250218 (accessed on 5 June 2022).
- Olson, S. Micronutrient interactions. In Micronutrients in Agriculture; Mortvedt, J.J., Giordano, P.M., Lindsay, W.L., Eds.; Soil Science Society of America: Madison, WI, USA, 1972; pp. 243–264. [Google Scholar]
- Markert, B. Interelement correlations in plants. Fresenius Z. Anal. Chem. 1987, 329, 462–465. [Google Scholar] [CrossRef]
- Watanabe, T.; Urayama, M.; Shinano, T.; Okada, R.; Osaki, M. Application of ionomics to plant and soil in fields under long-term fertilizer trials. Springerplus 2015, 4, 781. [Google Scholar] [CrossRef]
- Assad, M.; Tatin-Froux, F.; Blaudez, D.; Chalot, M.; Parelle, J. Accumulation of trace elements in edible crops and poplar grown on a titanium ore landfill. Environ. Sci. Pollut. Res. Int. 2017, 24, 5019–5031. [Google Scholar] [CrossRef] [PubMed]
- Verla, E.N.; Verla, A.W.; Enyoh, C.E. Finding a relationship between physicochemical characteristics and ionic composition of River Nworie, Imo State, Nigeria. Peer J. Anal. Chem. 2020, 2, e5. [Google Scholar] [CrossRef]
- Thomas, D.V.; Ravindran, V. Mineral retention in young broiler chicks fed diets based on wheat, Sorghum or maize. Asian-Australasian J. Anim. Sci. 2010, 23, 68–73. [Google Scholar] [CrossRef]
- Ioakeimidis, C.; Fotopoulou, K.; Karapanagioti, H.; Geraga, M.; Zeri, C.; Papathanassiou, E.; Galgani, F.; Papatheodorou, G. The degradation potential of PET bottles in the marine environment: An ATR-FTIR based approach. Sci. Rep. 2016, 6, 23501. [Google Scholar] [CrossRef] [PubMed]
- Ibrahim, T.H.; Chehade, Y.; Zour, M.A. Corrosion Inhibition of Mild Steel using Potato Peel Extract in 2M HCl Solution. Int. J. Electrochem. Sci. 2011, 6, 6542–6556. [Google Scholar]
- Widhyahrini, K.; Hidayati, E.N. Analysis and Characterization of Bioethanol from Banana (Musa acuminata Balbisiana) Peel Pulp by Yeast Enzymatic Production. J. Kartika Kim. 2019, 2, 74–77. [Google Scholar] [CrossRef]
- Khalil, S. Analysis of Bone of Chicken Gallus gallus domesticus. Int. J. Innov. Res. Sci. Eng. Technol. 2018, 7, 6243–6246. [Google Scholar]
- Zairin, D.A.B.; Phang, S.W. Calcination time and temperature effect on natural hydroxyapatite obtained from fish bones for bone tissue engineering. J. Eng. Sci. Technol. 2018, 13, 39–51. [Google Scholar]
- Hooi, M.T.; Phang, S.W.; Yow, H.Y.; David, E.; Kim, N.X.; Choo, H.L. FTIR spectroscopy characterization and critical comparison of poly(vinyl)alcohol and natural hydroxyapatite derived from fish bone composite for bone-scaffold. J. Phys. Conf. Ser. 2021, 2120, 012004. [Google Scholar] [CrossRef]
- Li, P.J.; Xia, J.L.; Shan, Y.; Nie, Z.Y.; Wang, F.R. Effects of Surfactants and Microwave-assisted Pretreatment of Orange Peel on Extracellular Enzymes Production by Aspergillus japonicus PJ01. Appl. Biochem. Biotechnol. 2015, 176, 758–771. [Google Scholar] [CrossRef]
- Gutierrez, I.R.; Tovar, A.K.; Godinez, L.A. Sustainable Sorbent Materials Obtained from Orange Peel as an Alternative for Water Treatment. In Wastewater and Water Quality; IntechOpen: London, UK, 2018; pp. 201–218. [Google Scholar] [CrossRef]
- Nwankwo, I.H. Production And Characterization Of Activated Carbon From Animal Bone. Am. J. Eng. Res. 2018, 7, 335–341. [Google Scholar]


Disclaimer/Publisher’s Note: The statements, opinions and data contained in all publications are solely those of the individual author(s) and contributor(s) and not of MDPI and/or the editor(s). MDPI and/or the editor(s) disclaim responsibility for any injury to people or property resulting from any ideas, methods, instructions or products referred to in the content. |
© 2023 by the authors. Licensee MDPI, Basel, Switzerland. This article is an open access article distributed under the terms and conditions of the Creative Commons Attribution (CC BY) license (https://creativecommons.org/licenses/by/4.0/).