Abstract
In adhesive bonding, two different substrate materials are joined together, usually by forming chemical bonds. The adhesive can stick things together. The loading rate and deformation mode can easily change the mechanical properties of the adhesive material. Hence, a vital aim of the current study is to evaluate the strain rate effect on the damage response of adhesive joints for Mode I loading scenarios. The adherend material was aluminum AL6061-T6, and Araldite 2015 was the adherent material. This experiment for delamination had a prescribed adherend size of 200 mm × 25 mm × 3 mm and an adhesive thickness of 0.5 mm. In situations where the strain rate affects the failure mechanism, a displacement rate of 5, 50, or 500 mm/min is sufficient to attain the failure mechanism. A double cantilever beam (DCB) specimen was employed to construct the FE model geometry for simulation. A hybrid experimental–FE technique was utilized to extract the properties of the adhesive interface. FE simulation has proven to have an excellent correlation with the experimental findings.
1. Introduction
Adhesive joints have grown in popularity in recent years due to the benefits they offer, such as lower stress concentrations and weight when compared to traditional mechanical bonding, such as bolted or riveted joints [1]. The application of adhesive joints can be found in structures of various strength levels. Applications include miniature products as well as aircraft and vehicle components such as honeycomb and composite laminate structures. They are also used in a variety of electronic and packaging industries for applications such as EMI shielding and grounding microelectronic components [2]. Adhesive joints have been used to attach printed circuit boards to heat sinks of aluminum or copper, and they are also used in automotive applications [3]. If contrasted with other types of joint fabrication, such as welding, riveting, and bolting, adhesively bonded joints provide a variety of features [4,5]. For example, the adhesive joint has the flexibility to disseminate stress further uniformly over the joint area, offers enhanced strength efficiency, minimizes electrochemical degradation among dissimilar metal adherents, and produces the efficiencies of the ultimate arrangement concerning many other joining techniques. The design of adhesive joints allows them to withstand flexural stress and reduce vibration and noise in such applications. Both initial tack and resistance to shear and peel are characteristics of these adhesives. The dependability of adhesives in microelectronic components is determined by the integrity of the assembly’s different interfaces. In order to establish the reliability of adhesive joints, both the failure process and the deformation attributes of the joint must be quantified [2].
The general loads inevitably contribute to complex stresses that also include tensile, shear, and mixed stresses on the parts that are held together. As a result, various dominant joint failure modes such as adhesive failure, cohesive failure, and their combination have been recognized [6]. Cracking inside the bond is referred to as cohesive failure, whereas interface delamination of the adhesive and adherend is referred to as adhesive failure. The material strength of adhesive materials is also susceptible to loads, loading types, and load variations. Fracture events in the layered structures can occur in Mode I, Mode II, Mode III, and mixed-mode conditions. These effects have been studied using a double cantilever beam (DCB), end-notched flexure (ENF), edge crack torsion, and mixed-mode bending tests [7,8,9,10,11,12,13,14]. Mode I delamination has been identified as a major failure event due to the significant loss of stiffness in polymer-based adhesive jointed structures [15]. When compared to ductile adhesive, composite joints having brittle adhesive exhibit lower Mode I fracture toughness [16].
Numerous factors, such as operating conditions, improper surface cleaning of adherents, and chemical contamination, influence the strength and correlated damage mechanism of an adhesive joint. [17]. From dry to wet environments, fracture toughness can be reduced by 92%, and the cohesive mode of failure is shifted to the adhesive mode of failure [18]. When epoxy-to-steel adhesive joints are tested in seawater, the tensile modulus and strength decrease as the aging time increases [19]. At various combinations of absorbed moisture and temperature, a double cantilever beam (DCB) specimen demonstrated varied mechanical properties. At −40 °C, a cohesive mode of failure was noticed [20]. Temperature effects on basalt FRP-aluminum adhesive joints’ mechanical properties are well established [21]. In another work, the collective effects of the rate of loading and change in temperature on a DCB specimen’s strength and fracture energy considering structural acrylic adhesives were measured [22]. Mode I fracture toughness was also examined in a study analyzing the behavior of a modified eco-epoxy adhesive (tannic acid (TA)) to assess the performance of the new material [23]. The strain rate dependence has been shown by the mechanical properties of both mild steel adherents and the adhesives. The evaluation of the trustworthiness of adhesively bonded structures and assemblies requires in-depth knowledge of the mechanisms of degradation that influence the component’s reliability [24]. The influence of the strain rates on the tensile and shear characteristics governs how well the adhesive joints react structurally and how they break.
To ensure the structure’s reliability, it is critical to precisely estimate the preliminary and long-term reactions of these joints. In this regard, the CZM is frequently used to simulate the damage process of adhesive joints [25,26]. The CZM establishes the relation between traction and relative displacement at any material point on the interface for the onset of damage and consequent separation. Several traction–separation laws, including bilinear, exponential, trapezoidal, cubic, and rigid linear laws, have been investigated [27]. In an FE simulation, the CZM model was used to explain the bonded interfaces’ damage process [28]. To foresee the damage response of an aged single lap joint specimen, a bilinear cohesive law was used [29]. The calculated and quantified static strengths, as well as the responses of load and displacement, show a strong correlation. However, there are few FE simulations that predict the effects of moisture and loading rate on the adhesive joint’s functioning. Through a series of experiments conducted on adhesive aluminum adherend samples for Mode I, the effects of the strain rates on the structural adhesive response were determined. The parameters of the CZM are calculated from the output load behavior employing a methodology that utilizes a hybrid experimental–finite element analysis (FE) approach [30]. The generated load–displacement response is employed to verify the adhesive bonding joint’s predictive damage model.
The primary goal of this research is to develop a model to predict the deformation and failure mechanisms of adhesively bonded joints subjected to varying strain rates under Mode I loading. The essential parameters for the CZM are determined using a hybrid experimental–FE methodology. This methodology is described in a context reflecting its importance in the following section. In evaluating the validity of the CZM extracted interface properties, it is necessary to employ a load–displacement response that would be comparable and determined by FE.
2. Cohesive Zone Model
The fracture process is treated as a gradual phenomenon in cohesive zone modeling (CZM), with cohesive tractions opposing the separation of the mating surfaces [31]. The interface’s cohesive behavior can be explained by interface degradation in adhesive joints. The CZM model depicts the separation of the interface as a progressive damage initiation and propagation process. The model was developed in 1959 when Barenblatt [32] used the term “CZM” referring to the brittle interface fracture and separation.
Cohesive Zone Model Formulation
The cohesive zone model (CZM) is briefly analyzed here for the explanation of mixed-mode interface failure. Figure 1 shows the traction separation law for individual and mixed-mode loading conditions [33].
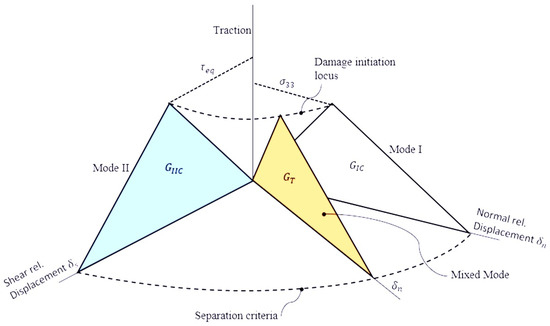
Figure 1.
Bilinear traction–separation in mixed mode [33].
Until the damage onset, the slope of penalty stiffness is linear. In individual mode, the interface penalty stiffness () is the rate of development of elastic stress. The initiation of damage is characterized according to the quadratic stress criteria [33]:
where Macaulay’s bracket ⟨ ⟩ means that only a positive quantity of the normal stress will cause damage (no damage in normal compression as it would close the crack). The shear stresses are , whereas S and N are the interface’s shear and normal strengths, respectively. This signifies that mixed-mode loading delamination onset can take place at individual stress levels smaller than the subsequent interface’s shear or tensile strength. After the onset of damage, the evolution of damage to fracture is estimated through the release rate of strain energy. When the following criteria are satisfied, the critical material point on the interface is separated [34]:
GIC and GIIC in Equation (2) are the fracture energies for Mode I and Mode II, respectively. The degree of interaction of each individual mode is represented by the exponent η. Table 1 lists the adherend and adherent properties.

Table 1.
Araldite 2015 [35] and Al6061-T6 [36] mechanical properties.
In order to quantify the influence of strain or loading rate on the damage process of the adhesive joints, it is essential to take into account the changes that were measured in the parameters of stiffness and strength. This effect can be observed by taking into account the usual traction–displacement law for various straining effects, as shown in Figure 2. With higher rates, the area under the curve (representing the strain energy release rate, GIC) lowers as the penalty stiffness (kn) and tensile strength (N) grow. Thus, Equation (1) predicts a later damage initiation event, while Equation (2) predicts a more rapid damage evolution as a result of the decreased toughness. For the shear traction–displacement reaction, it is expected that similar effects will occur. This indicates that the contact has a response similar to brittleness when subjected to a high strain rate.
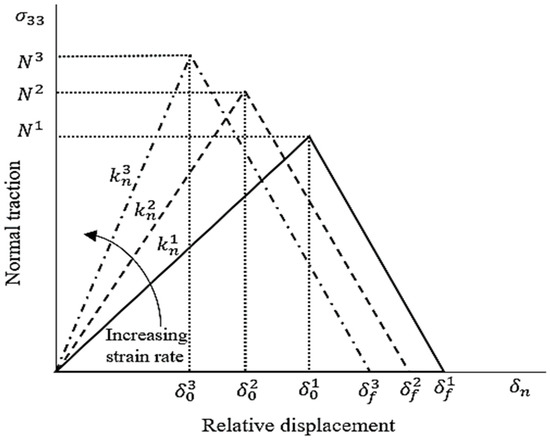
Figure 2.
Influence of strain/loading rate on Mode I traction–displacement law for softening of interface material.
3. Materials and Methods
3.1. Mode I (Crack opening) Test
- (a)
- The Specimen Preparations
The fracture energy of this joint configuration was assessed using a DCB specimen, as shown in Figure 3. Araldite 2015 bonded the Al6061-T6 joint; Table 1 summarizes the properties of the adhesives and adherents. The dimensions of the specimen were 200 mm × 25 mm × 3 mm. After the joint was bonded, 100 μm silica particles were employed to sandblast the aluminum adherend. Then, the surface roughness was determined as 5.26 μm using a MarSurf CD 140 series machine.
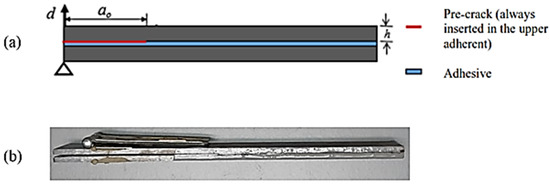
Figure 3.
(a) DCB schematic representation; (b) the actual DCB specimen.
Before the bonding process, acetone was used for degreasing the surfaces of adherents. In order to make sure that the bond was uniformly thick, a spacer with 0.5 mm thickness was employed. A Teflon film (~16 µm) was placed amid the 0.5 mm polymer adhesive and the top adherend to form a pre-crack length of ao = 50. The bonded samples were exposed to 2 MPa for 15 s. The sample was dried at 50 °C for two hours. The samples were at room temperature for 24 h before testing.
- (b)
- Mode I Test
In order to perform the crack opening Mode I test, a test machine (Instron 5982) having a 5000 N load cell was employed. The experiments were conducted using various displacements of 5, 50, and 500 mm/min rates under an ambient environment. In each test, the response of load and corresponding displacement was recorded and monitored until the sample fractured. The test was repeated three times to make sure that it was the same each time and to obtain an average.
- (c)
- Critical Strain Energy Release Rate
The load–displacement response curve was used to assess GIIC for different displacement speeds. Simple beam theory Equation (3) determines the critical energy release rate:
where Pi is the load at damage onset (N), is displacement (mm), b is adherend aluminum specimen width (mm), and a is crack length (mm).
3.2. Finite Element Simulation
The CZM characterizes the fracture features of mode I debonding by integrating strain rate responses. The simulation findings are reported in this paper. Figure 4 illustrates the FE model discretized into 3D elements, illustrating the geometrical outlook and boundary conditions for the DCB specimen. The adherents and the bulk adhesive layer were both discretized using continuum elements with reduced integration (SC8R). The interface adhesive was then modeled using 8 nodes of cohesive element (COH3D) with zero thickness.
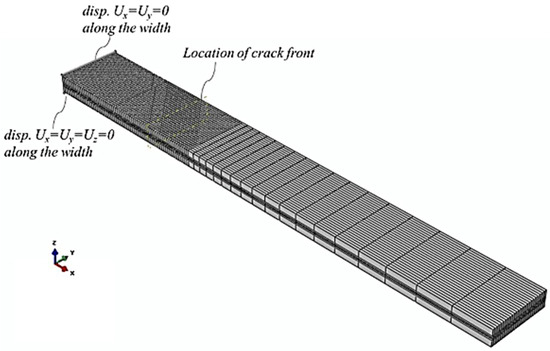
Figure 4.
FE model for DCB specimen showing boundary conditions and element mesh.
Material properties are listed in Table 1. The bottom half of the specimen was fixed, and all the translations were zero (Ux = Uy = Uz = 0). The displacement was applied to the top half of the specimen, which could freely move in the z-direction (Ux = Uy = 0). Each simulation was performed with one displacement rate. The displacement was given at different required displacement rates (5 to 500 mm/min). To verify that size of the mesh does not influence the predicted stresses, a mesh convergence study was performed, and the simulation adhered to its requirements. Normal stress was taken as the governing variable for the mesh convergence study, and the results are shown in Figure 5. The results show that the smallest element size of 0.3 mm edge length will ensure the independence of calculated variables based on element mesh size.
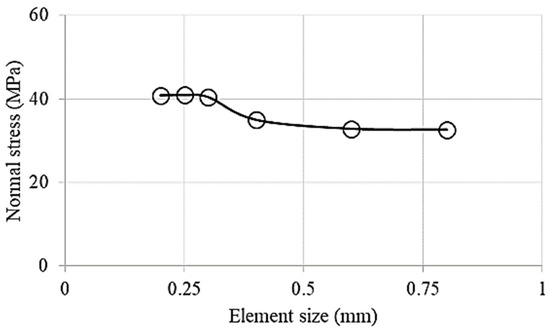
Figure 5.
Mesh convergence study for the adherend/adhesive interface crack tip.
4. Results and Discussion
4.1. Interfacial Fracture Adhesive Joints under Mode I Debonding Loading
Figure 5 shows that the highest load is 85.96 N for a displacement rate of 5 mm/min, 100.07 N for 50 mm/min, and 114.46 N for 500 mm/min. It is noticeable that the reaction load increases at first. Then, the amount of energy that has accumulated continues to rise until it is the same as the energy required to initiate the spread of the fracture. Once the applied load begins to drop, it signifies that a crack is starting to extend.
Azevedo [37] performed a study on three different adhesives: Araldite AV138, Sikaforce 7752, and Araldite 2015. He found that, compared to two other materials, Araldite 2015 is the most flexible adhesive. In preventing cracks from spreading, the ductile adhesive will work better. As demonstrated in Figure 6, the maximum load will be higher when the displacement rate is higher.
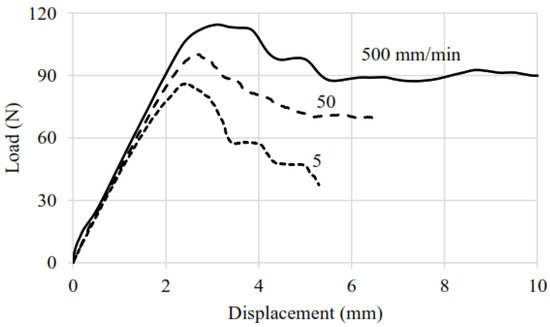
Figure 6.
Load–displacement curves for DCB specimens at different loading rates.
4.2. Loading Rate Effect on Adhesive joint Strain Energy Release Rate
Figure 7 illustrates how the measured Mode I fracture toughness shifts for adhesively bonded joints when the crosshead displacement rate is varied from 5 to 50 to 500 mm/min. The effect of increasing strain rate on fracture energy clearly indicates that the measured fracture energy decreased as the displacement rate increased from 5 mm/min to 50 mm/min. Upon a further increase in the strain rate to 500 mm/min, the fracture energy further decreased to a lower value. This is indicated by the squeezing bilinear traction separation law, which means that the covered area beneath the curve decreases when the strain rate increases. Also, the displacement at the onset and displacement at the fracture , shift to smaller values. This means that with an increasing strain rate, less energy is required to fracture the specimen.
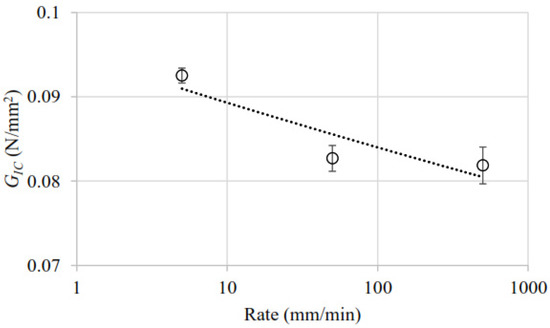
Figure 7.
Effect of loading rates on fracture energy GIC.
4.3. Extraction of CZM Parameters through an Experimental–FE Approach
Figure 8 illustrates the load response of the DCB specimen under the Mode I loading condition when a displacement with the rate of 5 mm/min is applied. It also illustrates that the experimental curve and the simulation curve intersect in the center of the curve. Both the straight line and the experimental curve start to deviate at point A with a 5% arbitrary slope reduction. This load level is hypothesized as corresponding to damage onset in Mode I. The dashed line shows the response of a perfectly bonded interface (assuming no damage). The identical simulation process is used for all displacement rates. In addition, the plot of individual rates of displacement may be employed to determine the location where damage initiates.
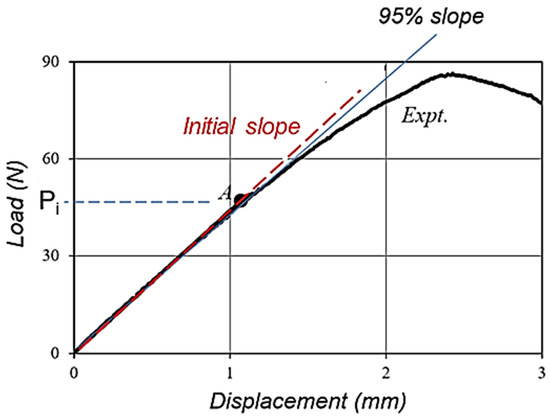
Figure 8.
Measured and FE results for 5 mm/min.
The peeling stress at point A has attained the interface’s tensile strength, N. Higher normal stress at the center of the specimen is predicted as shown in Figure 9. The results of numerical simulations demonstrate that the maximum tensile stress for a 5 mm/min displacement rate has been attained in the middle of the path of the specimen.
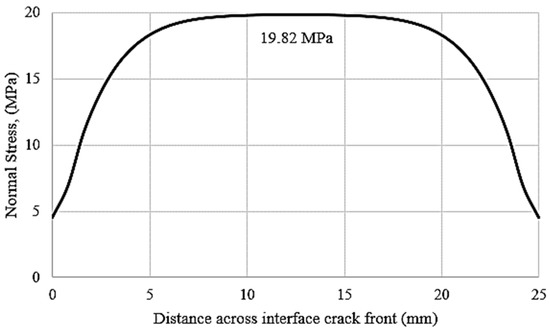
Figure 9.
Predicted stress at the interface crack-front for 5 mm/min case.
The highest amount of tensile stress was 19.82 MPa, known as the tensile strength of the interface. Only a small part of the path of the specimen is affected by the 4.5 Mpa of tensile stress, signifying the traction-free edge effect. During the simulation, the rate of displacement is slowly applied. When the crack propagates, the highest tensile stress occurs in the middle of the specimen. Under Mode I loading, on the other hand, the specified path reached the stable tensile stress at a rate of 5 mm/min, while the maximum tensile stress was seen. The corresponding relative displacement is plotted against normal stress in Figure 10. This shows the normal penalty slope of the interface.
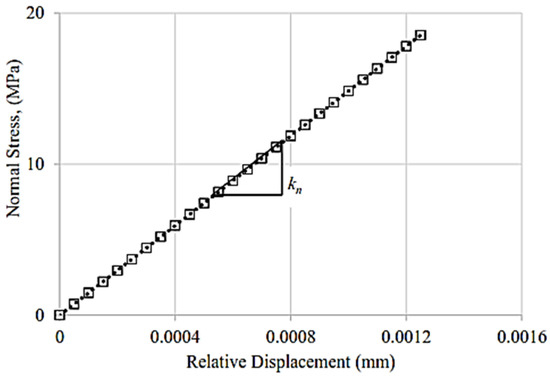
Figure 10.
The slope of the corresponding normal traction relative.
An explanation of a CZM curve that is a bilinear traction separation law is shown in Figure 11. The specimen is loaded to its maximum when the tensile stress and penalty stiffness curves are at their respective highest peaks. The critical energy release rate falls after the peak load.
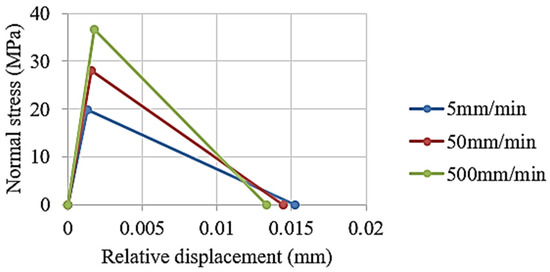
Figure 11.
Normal traction against relative displacement on each displacement rate.
Table 2 summarizes the extracted parameters of the mode I interface. As in the case of fracture energy, with the rising strain rate, the penalty stiffness of the specimen also rises, but the normal strength decreases.
Table 2.
A summary of the Mode I CZM properties that were extracted.
4.4. FE Model Validation for CZM
The same FE model used in previous discussions is demonstrated again to validate the interface properties. Similar methods are practiced for the validation of model and simulation processes in previous works [2,7,10,38]. The reaction of the interface is controlled by the bilinear traction–separation law. This study, through FEA, seeks to determine the impact of a varied displacement rate on adhesive joints. It is established how strain rates influence the deformation of structures. To verify this information, the FE simulation method used a fracture mechanism of the adhesive-bonded interface to demonstrate the internal states’ responses. Figure 12 compares the FE-calculated and experimental results for the displacement rate of 500 mm/min. The good agreement of the results verifies the employed technique and the model parameters.
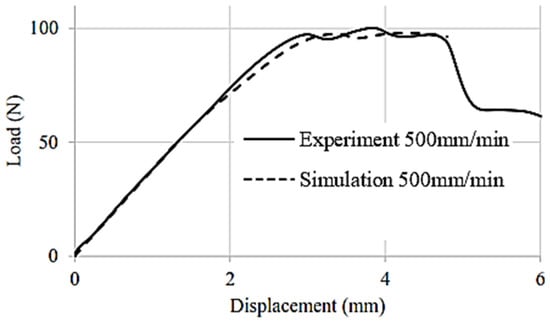
Figure 12.
Experimental and FE-calculated results for load vs. displacement.
As displacement loading increases, the load increases linearly to its maximum and then decreases gradually. The slope changes slightly when the load is approaching its peak value. This implies that a significant amount of stiffness was dissipated in the beam as a result of damage occurring in the short crucial zone of the interface, most likely towards the crack front. There appears to be an extended, stable interface fracture based on the progressive reduction in load.
4.5. Fracture Process of Adhesively Bonded Joints
Damage onset and evolution for a displacement rate of 500 mm/min are shown in Figure 13. The damage variable for initiation develops in a quadratic manner under Equation (1). When the damage variable for initiation approaches unity, the damage variable for evolution will start.
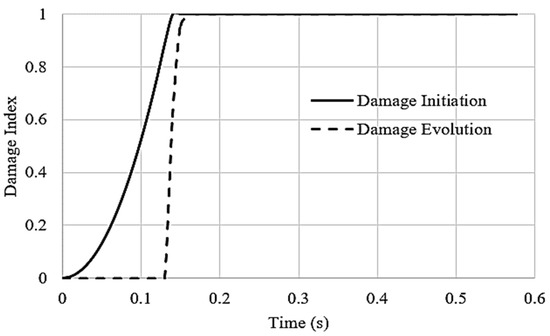
Figure 13.
Distribution of variables for 500 mm/min.
4.6. Interface Damage Accumulation
Figure 14 shows the damage to the interface through the FE-calculated result, which displays the damage initiation variables (QUADSCRT). The damage initiation variable (QUADSCRT) is calculated using Equation (1) by FE software, as shown in Figure 14a. It shows that a value of this damage variable equal to 1 means the damage has been initiated. It has been shown that the mechanism of failure at the interface of DCB specimens is governed by the equivalent tensile stress. Figure 14b shows the damage variable (SDEG) calculated by Equation (2). This variable with a value of 1 shows that the material point is separated, i.e., full fracture energy has been dissipated. The crack advances from the crack front towards the middle. This is because of the traction-free edge effect. As the material separates, the amount of tensile stress gradually goes to zero. The collection of these separated material points shows the progressive damage of the adhesive interface.
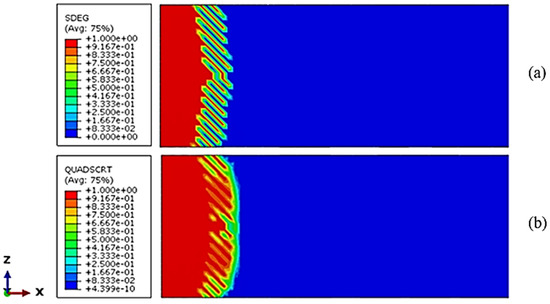
Figure 14.
(a) The contour of QUADSCRT; (b) SDEG of the interface.
The damage evolution variable is illustrated with the DCB specimen at the adhesive joint in Figure 15. The material points where the damage variable (SDEG) has reached 1 are already separated and are shown in red. The damage propagation shows progressive damage of the adhesive interface with an almost straight expanding crack front.
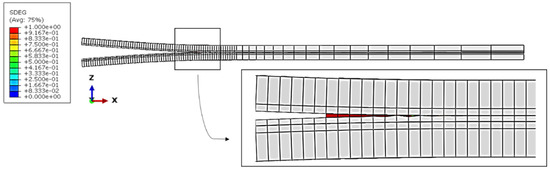
Figure 15.
The damage evolution variable SDEG near the front of the crack, indicates the separated elements.
5. Conclusions
The process of damage and failure of an adhesively bonded joint subjected to Mode I loading has been characterized. To take into account the strain rate effect, a validated FE technique using the extended CZM has been established. The model was evaluated for the DCB specimen with displacement rates of 5, 50, and 500 mm/min. The findings indicate the following:
- ➢
- Adhesively bonded joints under Mode I loads have been studied experimentally and numerically to determine the damage and failure process.
- ➢
- For the DCB test, tensile strength, penalty stiffness, and fracture energy of the CZM interface properties were determined at various displacement rates of 5, 50, and 500 mm/min. It is observed that the tensile strength and penalty stiffness increase and fracture energy decreases with increasing displacement rate.
- ➢
- At displacement rates of 5, 50, and 500 mm/min, an extended CZM-based FE simulation approach for the strain rate of an adhesively bonded joint was evaluated.
- ➢
- The findings show that the interface fracture process is governed by an adhesive failure mechanism and that crack propagation is stable at the loading displacement rate.
Author Contributions
Conceptualization, investigation, methodology, data curation, and writing—original draft preparation: S.A.K., S.S.R.K., W.K.J., M.N.T. and M.J.; validation, visualization, formal analysis, and writing—review and editing: S.A.K., S.S.R.K., W.K.J., N.Y., A.A.M.Y., M.A.F.M.S.J., M.N.T. and M.J.; resources, supervision, project administration, and funding acquisition: S.S.R.K., W.K.J., M.N.T. and M.J. All authors have read and agreed to the published version of the manuscript.
Funding
The Open Access fee for publication of the manuscript is supported by the Universität der Bundeswehr München.
Institutional Review Board Statement
Not applicable.
Informed Consent Statement
Not applicable.
Data Availability Statement
Not applicable.
Acknowledgments
This research is part of a collaborative study between researchers at Universiti Kuala Lumpur, Universiti Teknologi Malaysia, Universiti Putra Malaysia, and Universität der Bundeswehr München. The authors acknowledge financial support from Universität der Bundeswehr München to fully cover the APC of the journal for the publication process.
Conflicts of Interest
The authors declare no conflict of interest.
References
- Ebnesajjad, S.; Landrock, A.H. Adhesives Technology Handbook; William Andrew: Norwich, NY, USA, 2014; ISBN 0-323-35602-8. [Google Scholar]
- Johar, M.; Asasaari, S.F.M.; Tamin, M.N. Strain Rate-Dependent Deformation and Failure Process of Adhesive Joints. In Proceedings of the 36th International Electronics Manufacturing Technology Conference, Johor Bahru, Malaysia, 11–13 November 2014; pp. 1–5. [Google Scholar]
- Lall, P.; Islam, M.N.; Evans, J.; Suhling, J.C.; Shete, T. Damage Mechanics of Electronics on Metal-Backed Substrates in Harsh Environments. IEEE Trans. Comp. Packag. Technol. 2006, 29, 204–212. [Google Scholar] [CrossRef]
- Wang, J.; Kang, Y.L.; Qin, Q.H.; Fu, D.H.; Li, X.Q. Identification of Time-Dependent Interfacial Mechanical Properties of Adhesive by Hybrid/Inverse Method. Comput. Mater. Sci. 2008, 43, 1160–1164. [Google Scholar] [CrossRef]
- Campilho, R.D.S.G.; de Moura, M.F.S.F.; Domingues, J.J.M.S. Modelling Single and Double-Lap Repairs on Composite Materials. Compos. Sci. Technol. 2005, 65, 1948–1958. [Google Scholar] [CrossRef]
- Townsend, B.W.; Ohanehi, D.C.; Dillard, D.A.; Austin, S.R.; Salmon, F.; Gagnon, D.R. Characterizing Acrylic Foam Pressure Sensitive Adhesive Tapes for Structural Glazing Applications—Part I: DMA and Ramp-to-Fail Results. Int. J. Adhes. Adhes. 2011, 31, 639–649. [Google Scholar] [CrossRef]
- Khan, S.A.; Wong, K.J.; Sung, A.N.; Johar, M.; Tamin, M.N. Characterization of Interface Damage of Fiber-Reinforced Polymer Composite Laminates under Mode I Loading. AIP Conf. Proc. 2022, 2676, 050003. [Google Scholar]
- Koloor, S.S.R.; Abdul-Latif, A.; Tamin, M.N. Mechanics of Composite Delamination under Flexural Loading. KEM 2011, 462–463, 726–731. [Google Scholar] [CrossRef]
- Koloor, S.; Tamin, M. Mode-II Interlaminar Fracture and Crack-Jump Phenomenon in CFRP Composite Laminate Materials. Compos. Struct. 2018, 204, 594–606. [Google Scholar] [CrossRef]
- Wong, K.J.; Johar, M.; Koloor, S.S.R.; Petrů, M.; Tamin, M.N. Moisture Absorption Effects on Mode II Delamination of Carbon/Epoxy Composites. Polymers 2020, 12, 2162. [Google Scholar] [CrossRef]
- Borg, R.; Nilsson, L.; Simonsson, K. Simulating DCB, ENF and MMB Experiments Using Shell Elements and a Cohesive Zone Model. Compos. Sci. Technol. 2004, 64, 269–278. [Google Scholar] [CrossRef]
- Wosu, S.N.; Hui, D.; Dutta, P.K. Dynamic Mixed-Mode I/II Delamination Fracture and Energy Release Rate of Unidirectional Graphite/Epoxy Composites. Eng. Fract. Mech. 2005, 72, 1531–1558. [Google Scholar] [CrossRef]
- Marat-Mendes, R.; Freitas, M. DCB, ENF and ECT Tests for Interlaminar Fracture of Glass/Epoxy Unidirectional Laminates. In Proceedings of the 10th Portuguese Conference on Fracture, Guimarles, Portugal, 1 January 2006; pp. 22–24. [Google Scholar]
- Madhukar, M.S.; Drzal, L.T. Fiber-Matrix Adhesion and Its Effect on Composite Mechanical Properties: IV. Mode I and Mode II Fracture Toughness of Graphite/Epoxy Composites. J. Compos. Mater. 1992, 26, 936–968. [Google Scholar] [CrossRef]
- Koloor, S.S.R.; Abdullah, M.A.; Tamin, M.N.; Ayatollahi, M.R. Fatigue Damage of Cohesive Interfaces in Fiber-Reinforced Polymer Composite Laminates. Compos. Sci. Technol. 2019, 183, 107779. [Google Scholar] [CrossRef]
- Wong, K.J. Moisture Absorption Characteristics and Effects on Mechanical Behaviour of Carbon/Epoxy Composite: Application to Bonded Patch Repairs of Composite Structures. Ph.D. Thesis, Université de Bourgogne, Dijon, France, 2013. [Google Scholar]
- Na, J.; Fan, Y.; Tan, W.; Guo, S.; Mu, W. Mechanical Behavior of Polyurethane Adhesive Bonded Joints as a Function of Temperature and Humidity. J. Adhes. Sci. Technol. 2018, 32, 457–472. [Google Scholar] [CrossRef]
- Fernando, M.; Harjoprayitno, W.; Kinloch, A. A Fracture Mechanics Study of the Influence of Moisture on the Fatigue Behaviour of Adhesively Bonded Aluminium-Alloy Joints. Int. J. Adhes. Adhes. 1996, 16, 113–119. [Google Scholar] [CrossRef]
- Bordes, M.; Davies, P.; Cognard, J.-Y.; Sohier, L.; Sauvant-Moynot, V.; Galy, J. Prediction of Long Term Strength of Adhesively Bonded Steel/Epoxy Joints in Sea Water. Int. J. Adhes. Adhes. 2009, 29, 595–608. [Google Scholar] [CrossRef]
- Viana, G.; Costa, M.; Banea, M.; Da Silva, L. Moisture and Temperature Degradation of Double Cantilever Beam Adhesive Joints. J. Adhes. Sci. Technol. 2017, 31, 1824–1838. [Google Scholar] [CrossRef]
- Na, J.; Mu, W.; Qin, G.; Tan, W.; Pu, L. Effect of Temperature on the Mechanical Properties of Adhesively Bonded Basalt FRP-Aluminum Alloy Joints in the Automotive Industry. Int. J. Adhes. Adhes. 2018, 85, 138–148. [Google Scholar] [CrossRef]
- Hayashi, A.; Sekiguchi, Y.; Sato, C. Effect of temperature and loading rate on the mode I fracture energy of structural acrylic adhesives. J. Adv. Join. Process. 2022, 5, 100079. [Google Scholar] [CrossRef]
- Saleh, M.N.; Tomić, N.Z.; Marinković, A.; de Freitas, S.T. The effect of modified tannic acid (TA) eco-epoxy adhesives on mode I fracture toughness of bonded joints. Polym. Test. 2021, 96, 107122. [Google Scholar] [CrossRef]
- Khan, M.S.; Abdul-Latif, A.; Koloor, S.S.R.; Petrů, M.; Tamin, M.N. Representative Cell Analysis for Damage-Based Failure Model of Polymer Hexagonal Honeycomb Structure under the out-of-Plane Loadings. Polymers 2020, 13, 52. [Google Scholar] [CrossRef] [PubMed]
- Bang, H.; Lee, S.; Cho, C.; Cho, J.U. Study on Crack Propagation of Adhesively Bonded DCB for Aluminum Foam Using Energy Release Rate. J. Mech. Sci. Technol. 2015, 29, 45–50. [Google Scholar] [CrossRef]
- Geleta, T.N.; Woo, K.; Cairns, D.S.; Samborsky, D. Failure Behavior of Inclined Thick Adhesive Joints with Manufacturing Defect. J. Mech. Sci. Technol. 2018, 32, 2173–2182. [Google Scholar] [CrossRef]
- Campilho, R.D.S.G.; Banea, M.D.; Neto, J.A.B.P.; da Silva, L.F.M. Modelling Adhesive Joints with Cohesive Zone Models: Effect of the Cohesive Law Shape of the Adhesive Layer. Int. J. Adhes. Adhes. 2013, 44, 48–56. [Google Scholar] [CrossRef]
- Han, X.; Crocombe, A.; Anwar, S.; Hu, P. The Strength Prediction of Adhesive Single Lap Joints Exposed to Long Term Loading in a Hostile Environment. Int. J. Adhes. Adhes. 2014, 55, 1–11. [Google Scholar] [CrossRef]
- Sugiman, S.; Crocombe, A.; Aschroft, I. Modelling the Static Response of Unaged Adhesively Bonded Structures. Eng. Fract. Mech. 2013, 98, 296–314. [Google Scholar] [CrossRef]
- Abdullah, M.A.; Abdul-Latif, A.; Tamin, M.N. Methodology for Extracting Interface Damage Properties of FRP Composite Laminates under Cyclic Shear Loading Conditions. In Proceedings of the 2017 3rd International Conference on Power Generation Systems and Renewable Energy Technologies (PGSRET), Johor Bahru, Malaysia, 4–6 April 2017; pp. 197–201. [Google Scholar]
- Zou, Z.; Reid, S.R.; Li, S. A Continuum Damage Model for Delaminations in Laminated Composites. J. Mech. Phys. Solids 2003, 51, 333–356. [Google Scholar] [CrossRef]
- Barenblatt, G.I. The Mathematical Theory of Equilibrium Cracks in Brittle Fracture. In Advances in Applied Mechanics; Dryden, H.L., von Kármán, T.H., Kuerti, G., van den Dungen, F.H., Howarth, L., Eds.; Elsevier: Amsterdam, The Netherlands, 1962; Volume 7, pp. 55–129. ISBN 0065-2156. [Google Scholar]
- Davila, C.G.; Camanho, P.P. Decohesion Elements Using Two and Three-Parameter Mixed-Mode Criteria. In Proceedings of the American Helicopter Society Conferen, Williamsburg, VA, USA, 29 October–1 November 2001. [Google Scholar]
- Kenane, M.; Benzeggagh, M.L. Mixed-Mode Delamination Fracture Toughness of Unidirectional Glass/Epoxy Composites under Fatigue Loading. Compos. Sci. Technol. 1997, 57, 597–605. [Google Scholar] [CrossRef]
- Campilho, R.D.; Banea, M.; Neto, J.; Da Silva, L. Modelling of Single-Lap Joints Using Cohesive Zone Models: Effect of the Cohesive Parameters on the Output of the Simulations. J. Adhes. 2012, 88, 513–533. [Google Scholar] [CrossRef]
- Jogi, B.; Brahmankar, P.; Nanda, V.; Prasad, R. Some Studies on Fatigue Crack Growth Rate of Aluminum Alloy 6061. J. Mater. Process. Technol. 2008, 201, 380–384. [Google Scholar] [CrossRef]
- Azevedo, J.; Campilho, R.; Da Silva, F.; Faneco, T.; Lopes, R. Cohesive Law Estimation of Adhesive Joints in Mode II Condition. Theor. Appl. Fract. Mech. 2015, 80, 143–154. [Google Scholar] [CrossRef]
- Johar, M.; Wong, K.; Rashidi, S.; Tamin, M. Effect of Strain-Rate and Moisture Content on the Mechanical Properties of Adhesively Bonded Joints. J. Mech. Sci. Technol. 2020, 34, 1837–1845. [Google Scholar] [CrossRef]


Disclaimer/Publisher’s Note: The statements, opinions and data contained in all publications are solely those of the individual author(s) and contributor(s) and not of MDPI and/or the editor(s). MDPI and/or the editor(s) disclaim responsibility for any injury to people or property resulting from any ideas, methods, instructions or products referred to in the content. |
© 2022 by the authors. Licensee MDPI, Basel, Switzerland. This article is an open access article distributed under the terms and conditions of the Creative Commons Attribution (CC BY) license (https://creativecommons.org/licenses/by/4.0/).