Article

ELISA Based Immunoreactivity Reduction of Soy Allergens through Thermal Processing

by
Akshaya Ravindran
and
Hosahalli S. Ramaswamy
*
Department of Food Science, McGill University, Macdonald Campus, 21111 Lakeshore Road, Ste Anne de Bellevue, QC H9X 3V9, Canada
*
Author to whom correspondence should be addressed.
Processes 2023, 11(1), 93; https://doi.org/10.3390/pr11010093
Submission received: 6 December 2022 / Revised: 23 December 2022 / Accepted: 23 December 2022 / Published: 29 December 2022
(This article belongs to the Special Issue Current Trends in Food and Food Byproducts Processing)

Abstract

:
Allergens are proteins and are, therefore, likely to be denatured when subjected to thermal treatment. Traditional cooking has so far been able to reduce allergen sensitivity by around 70–90%. This study was aimed at evaluating the effect of a broad range of thermal treatments on the reduction of soy immunoreactivity (IR) in a 5% slurry using a sandwich ELISA technique. Cooking at 100 °C (10–60 min) and different thermal processing conditions, such as in commercial sterilization (with a process lethality (Fo) between 3 and 5 min) and selected severe thermal processing conditions (Fo > 5 and up to 23 min) were used in the study to evaluate their influence on allergen IR. Based on an IR comparison with an internal soy allergen standard, the allergen concentration in the untreated soy sample was calculated to be equivalent to 333 mg/kg (ppm). Cooking conditions only reduced the IR sensitivity to about 10 mg/kg (~1.5 log reductions), while the thermal processing treatments lowered the allergen IR up to 23 × 10−3 mg/kg (or 23 ppb) (>4 log reductions). FTIR analysis indicated significant changes in protein structure resulting from the thermal processing treatments, with a higher degree of allergen reduction corresponding with a higher value of random coil percentages. The influence of process severity on color and rheological properties was, however, minimal.

1. Introduction

Soybean (Glycine max) and soy products are among the best protein sources that can be included in a diet, especially in a plant-based diet. The total protein content of soybeans ranges between 30 and 52% based on their growth conditions in different parts of the world [1]. Soy is found to be one of the top eight food allergens based on the labeling requirements of the Food Allergen Labeling and Consumer Protection Act, 2004. According to the World Health Organization (WHO) and the International Union of Immunological Societies (IUIS), eight different allergen fractions are found in soybeans, namely, Gly m 1 to Gly m 8 [2,3,4,5,6,7,8,9]. β-Conglycinin (Gly m 5) and Glycinin (Gly m 6) are the major storage proteins that comprise about 65 to 80% of soy protein and are identified as major allergens in soybeans causing food allergies that range from mild gastrointestinal problems to a few reported cases of anaphylaxis [10,11,12,13,14]. Ingestion of soy and soy products is a potential contributor to the eight groups of allergenic foods accountable for 90% of food-allergenic reactions [15]. Allergy caused by soybean is generally IgE-mediated, which mainly interferes with the digestion and absorption of nutrients and can trigger metabolic instability [16,17].
The wide use of soybeans in making a variety of soy products such as soymilk, tofu, fermented soy products and soy-derived products in infant formulas, processed meats, cereals, energy bars and baked goods can result in the escalation of soy-related allergic reactions and hypersensitivity problems [18]. Moreover, the addition of soy proteins as emulsifiers and texturizers in processed food products makes the selection of allergen-free food products difficult for hypersensitive individuals [19].
Several processing methods have been used for the reduction of soy allergens in soy milk [20,21]. Thermal processing has been the most effective and conventional method reported to decrease soy allergens to some extent [21]. Due to the thermostable nature of soy allergens, especially the storage allergens, immunoreactivity (IR) varies with different treatment conditions. At 70 °C, soy immunoreactivity has been reported to decrease when treated for 30 min, but increase slightly when treated at 80 °C [22]. Thermal treatments such as cooking (at 100 °C) for several minutes have also been shown to decrease the IR in soy products [23,24,25].
More recently, Pi et al. [26] evaluated several techniques for the reduction of soy allergens and found thermal processing, enzymatic degradation and fermentation to be effective in reducing the allergenicity of soybean, resulting in the destruction of epitopes and the reduction of allergens mainly induced by protein degradation. Pi et al. [27] assessed the effects of industrialized sterilization (boiling and autoclaving) on proteins’ IR, composition and conformation of soybeans but found less than 90% effectiveness for allergen reduction. In a recent review, Kerezsi et al. [28] recognized that most traditional methods are inefficient for reducing soy allergens and discussed some advanced physical treatments for allergen reduction, such as high-pressure processing, high-pressure homogenization, etc., and only recognized that the allergenicity may increase, decrease or persist unchanged depending on treatment intensity and protein structure.
Published results so far have only achieved a maximum of 90% reduction in allergen levels. Hence, there is a serious need for developing/identifying appropriate processing methods that can curtail soy IR to a much lower level. In the proposed work, it is hypothesized that intense thermal processing using extended commercial canning procedures could result in further reductions in soy allergen levels. While, traditionally, such treatments are performed in the food industry, today, home canning equipment is also available on the market for use at home: Instant Pot (Instant Pot, Ottawa, ON, Canada), All American Pressure Cooker/Canner (All American Canner, Hillsville, VA, USA), Presto (Pressure Cooker Canner Company, Mesa, AZ, USA) and Breville Cookers (Torrance, CA, USA). All these cookers can subject canned or bottled food products to commercial sterilization conditions and beyond, at temperatures between 100 and 120 °C.
Enzyme-linked immunosorbent assay (ELISA) is commonly used in allergen detection and quantification due to its simplicity, sensitivity and accuracy. Commercial ELISA kits are now available to detect allergens in both processed and unprocessed food products for selected foods. Sandwich ELISA kits are widely used in the detection, identification and quantification of storage allergens [29,30]. Some studies have correlated allergen reduction with rheological and other functional properties [31,32,33,34,35], but none have been performed to understand the effect of intense processing on soy slurry.
For understanding the conformation of biological proteins, IR spectroscopy is widely used, selected and accepted. FTIR has been considered advantageous because it does not require additional sample preparation steps [36]. The amide I band (1700–1600 cm−1), which corresponds to C=O stretching vibrations, is considered the backbone and the most sensitive part of the protein when determining the secondary structure [37]. Although thermal treatments help in lowering the IR, the level of reduction achieved and reported so far is insignificant (only in ppm levels), but much lower levels of these allergens can cause allergenic reactions in subjects. No such studies have been carried out with soy slurries.
Therefore, the objective of this study was to evaluate the effects of cooking (100 °C, 10–60 min), commercial thermal processing (Fo = 3–5 min) and moderate to intense thermal processing (Fo > 5 and up to 23 min) at 110–120 °C on soy IR reduction. Since excessive thermal processing was employed, some damage to quality was expected, and hence evaluations were also included to determine if the extended thermal treatments have a detrimental influence on color and rheological properties. The allergen assay was based on the more contemporary ELISA methods sensitive enough to detect soy allergen IR at micro- and nanogram levels and FTIR analysis for conformational analysis.

2. Materials and Methods

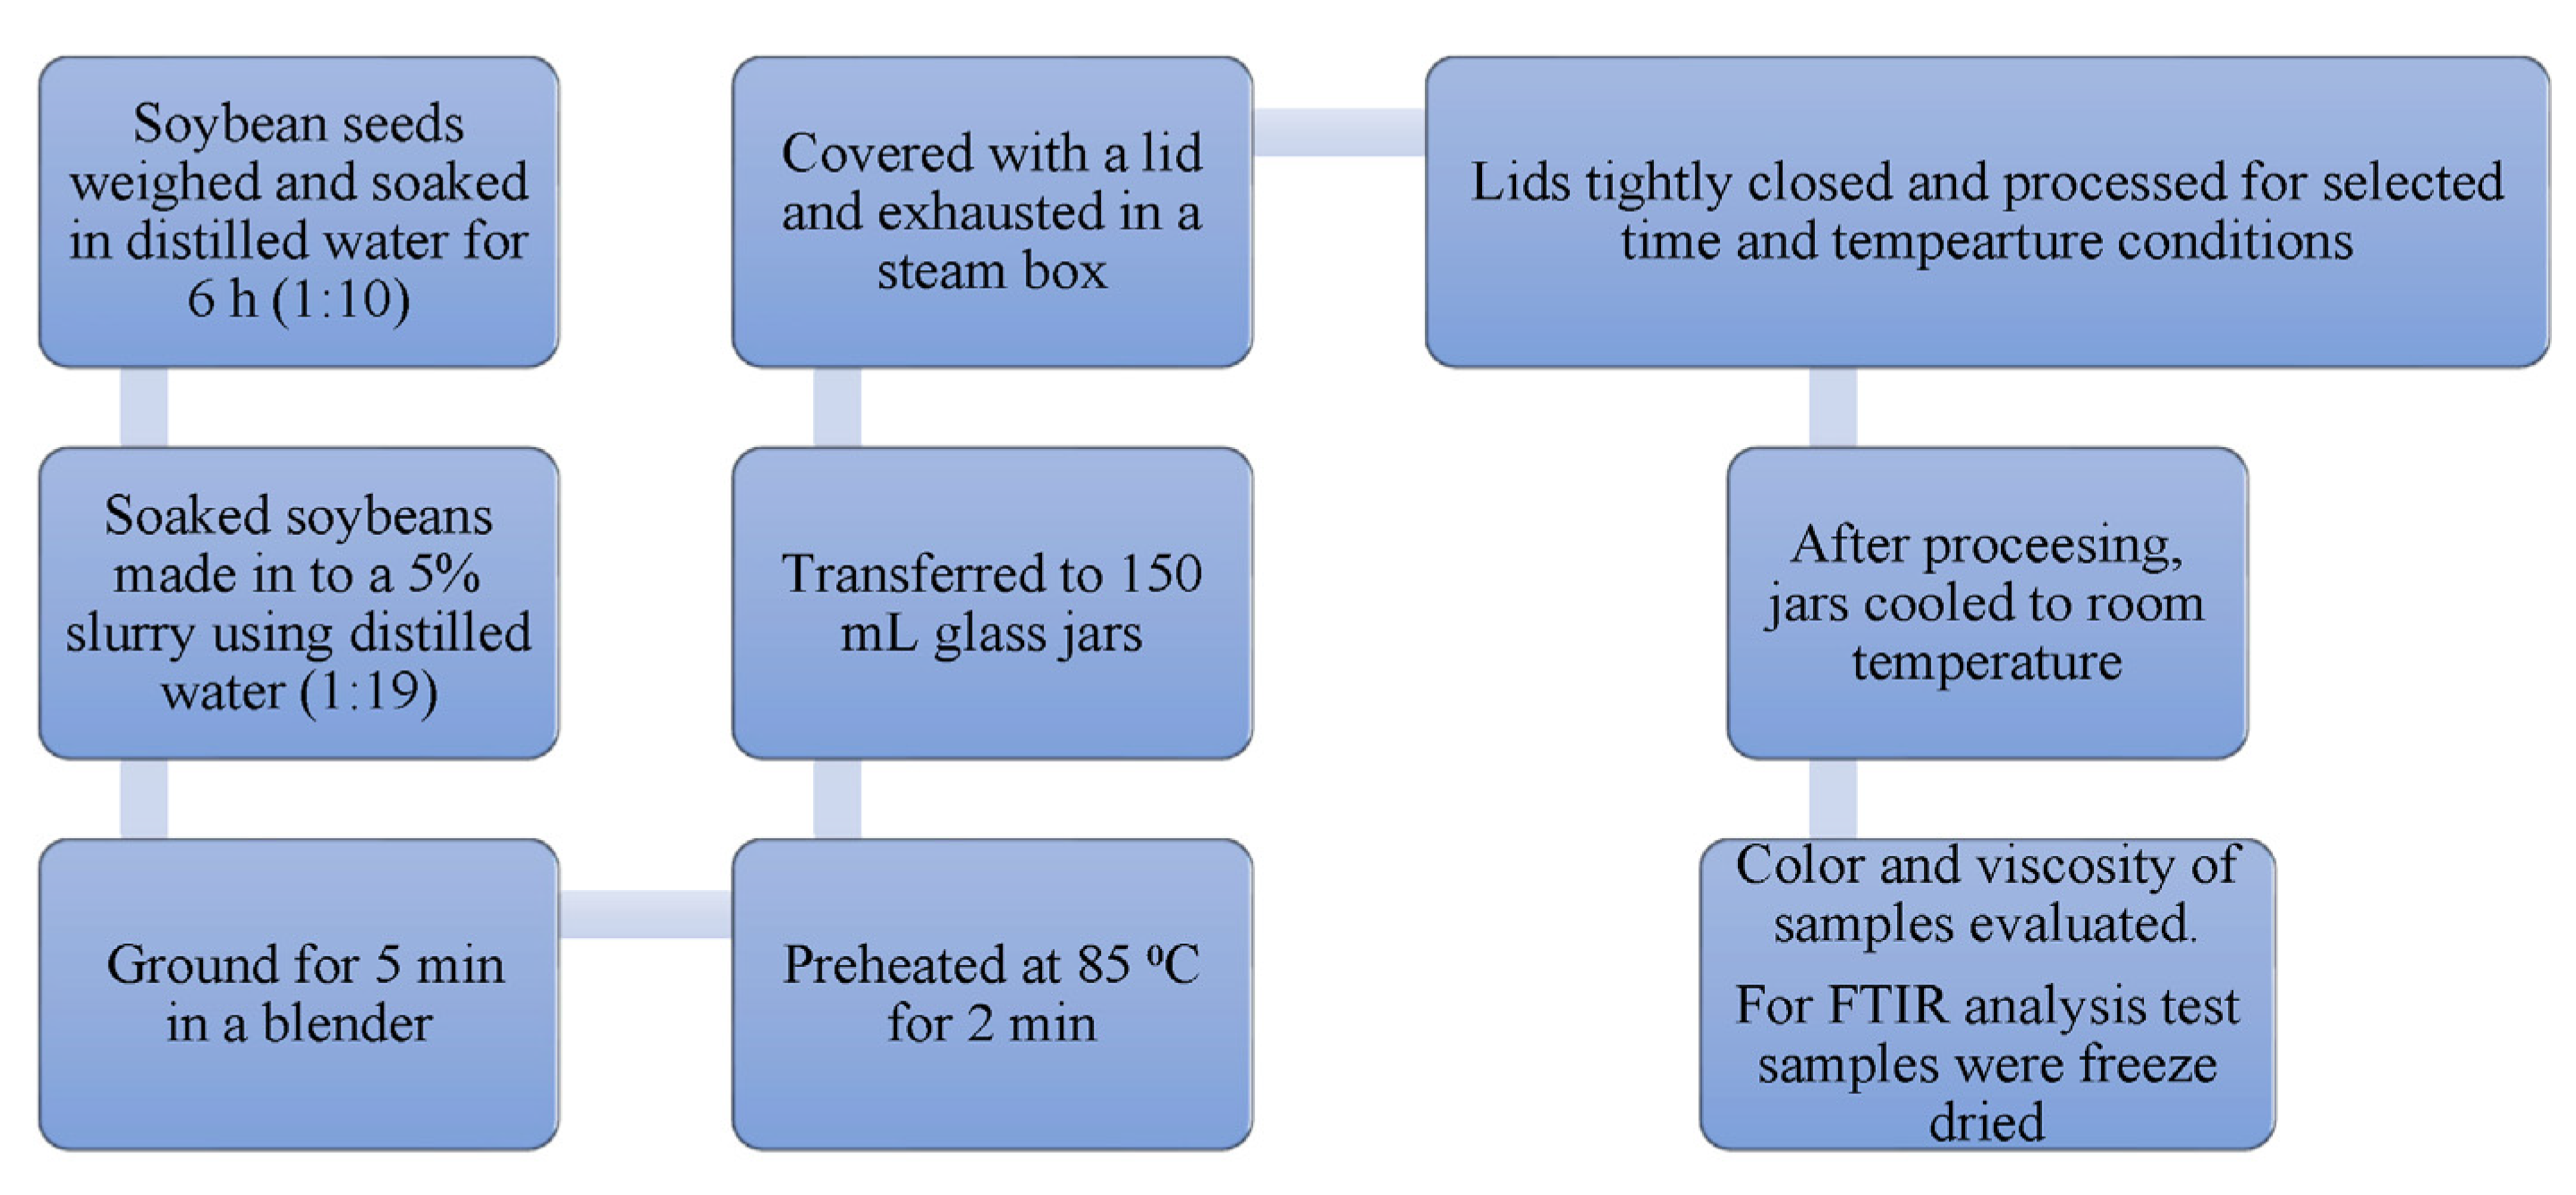
2.1. Soy Slurry Preparation

High protein content (50.5%) raw soybean (Glycine max) variety (RD-714) was procured from a commercial source (SG Ceresco Inc., Saint-Urbain-Premier, QC, Canada). The soy slurry was prepared from soaked soybeans based on the flowchart shown in Figure 1 [38]. Soybeans need to be soaked and drained to remove the anti-nutritional components such as phytate, enzyme inhibitors and lectins. These anti-nutrients normally protect the seed, regulate sprouting of the seed and control the initial growth of the seed when planted, but are harmful to human health. Soaking or fermentation can decrease or remove these components, making the seed healthier. Different procedures are followed for soaking, but water soaking is widely used, although lectins are not efficiently removed [39].

2.2. Cooking of Soy Slurry Samples

In order to compare with home cooking, the same soy slurry samples of 5% concentration were hot-filled into glass jars and heated in boiling water at 100 °C for 10 to 60 min. Sample temperatures were gathered during heating. Because of the hot fill and immediate placement in the boiling water bath, the come-up time to 100 °C was short (less than 2 min) and the product was assumed to be at 100 °C throughout the cooking. Therefore, the nominal cook times were considered equal to the real cook time (minimal error).

2.3. Commercial Thermal Processing

Commercial thermal processing is established with a process lethality (Fo) of 3–5 min. This can be accomplished either by keeping a longer process time at lower temperature (LTLT) or by shorter processing at higher temperature (HTST) while maintaining the process lethality level between 3 and 5 min to achieve commercial sterility. When Fo values much larger than 5 min are used, they constitute intentional over-processing. The processing times at each temperature were set based on some preliminary studies carried out to get process lethality values approximately between 3 min and 23 min at the set point temperatures, and ranged from 60–120 min at 110 °C, 30–90 min at 115 °C and 15–45 min at 120 °C. These conditions provided some commercially sterile LTLT and HTST, as well as some over-processing conditions.
Several glass jars (Travelagn, MODEL-TRAVEL-016, Available online: Amazon.com (accessed on 5 December 2022)) were filled with 150 mL of 5% soy slurry at 85 °C, placed in an exhaust box to remove the headspace air and sealed with the specific lid supplied by the manufacturer. These were then placed inside home canning equipment (Instant Pot Max Programmable Pressure Cooker, 1100 W) and processed to specific time and temperature conditions, as detailed later. The Instant Pot cooker used in the study works similarly to a batch steam vertical retort in operation. Steam is produced by an electrical heating element in contact with a specified amount of water filled up to an indicated level in the cooker, and the glass jars are placed on a rack above. The equipment is fitted with a pressure valve that relieves excess pressure once the desired set point temperature is reached. Depending on the size of the glass jars, four to twelve jars could be processed at a given time. In this study, four soy slurry-filled glass jars were processed with each run. The process was replicated three times.
Time–temperature data were gathered from the test jars using Track Sense Pro, United States Food and Drug Administration-compliant wireless loggers (Track Sense, Ellab Inc., Centennial, CO, USA), inserted through the lid to a location somewhat lower than the geometric center of the sample-filled glass jars, and a second one in the Instant Pot for measuring the medium temperature [40]. The Track Sense Pro logger had a diameter of 25 mm, an operating range of −50 to +150 °C, a resolution of 0.007 °C and was suitably positioned within the jar and in the pot. Time–temperature data were gathered using the data logger at 15 s using an Agilent Data Acquisition System (HP34970A, Hewlett Packard, Loveland, CO, USA).

2.4. Process Lethality and Cook Value

The degree of severity of intense thermal processing was measured by calculating the accumulated process lethality (Fo) and cook value (Co) as outlined in Abbatemarco and Ramaswamy [41] using Equations (1) and (2), respectively.
Process   lethality ,   Fo = 0 t 10 T 121.1 / z ) d t
Cook   value ,   Co = 0 t 10 T 100 / 33 ) d t

2.5. ELISA Analysis

A 96-well Sandwich Soy ELISA kit was purchased from 3M Company, Canada, which is designed to detect both processed and unprocessed soy allergen proteins. The procedure utilized was based on the protocol provided by the manufacturer, and a total of 50 min was required for analysis. All soy slurry test samples processed under the nine different treatment conditions, unprocessed soy slurry, cooked soy samples, soy standards provided in the kit and blank samples were tested in duplicate for allergens [42]. The absorbance values were measured at 450 nm, from which the allergen concentrations were determined. The signal intensities were calculated from the calibration curve of the standard soy protein isolate (SPI) provided in the kit, consisting of five known concentrations [43].

2.6. FTIR Analysis

All samples were analyzed through Fourier-transform infrared spectroscopy to study the conformational change in the secondary structure of proteins. The freeze-dried sample (0.1 g) was added to the diamond crystal sampling area, and an average of 128 scans were recorded for each sample in triplicate at 4 cm−1 resolution in the range of 4000–400 cm−1. The spectral data were obtained using Windows-based OMNIC software (Version 9.2, Thermo Scientific, Toronto, ON, Canada) connected to the FTIR spectrometer (Nicolet™ FTIR Spectrophometer, Thermo Scientific, Toronto, ON, Canada). Quantification and analysis of samples were performed via Fourier self-deconvolution (FSD) using OMNIC v9.2 Spectra Software with a bandwidth of 30 cm−1 and an enhancement factor of 2.5 [33]. For determining the content of the secondary structure of proteins, the amide I region was considered since it directly relates to the protein backbone [44]. Background spectra were taken each run before collecting the sample spectra to avoid the influence of air.

2.7. Quality Analysis

2.7.1. Color

All processed and unprocessed samples of soy slurry were also evaluated for color parameters using a Minolta Colorimeter (Minolta Corporation, Ramsey, NJ, USA). The instrument utilizes a pulse xenon arc lamp providing D65 illumination as the light source. A 10° angle was adjusted for measuring the L *, a * and b * color parameters of the samples, which were recorded through the software (Spectra Magic, Minolta Corporation, Ramsey, NJ, USA) installed in the color measurement system. The total color difference (∆E) was calculated from Equation (3), respectively, for all the samples [45].
∆E = [∆L2 + ∆a2 + ∆b2]

2.7.2. Flow Rheology of Soy Slurry

A steady state shear test was carried out for all processed and unprocessed samples using a controlled stress rheometer (AR 2000, TA Instruments, New Castle, DE, USA) supplied with computer-controlled software (Rheology Advantage Data Analysis Program, TA, New Castle, DE, USA). A 60 mm parallel plate geometry was employed for all flow test runs with a gap of 1 mm. A measured volume of 3 mL of the samples was transferred to the bottom plate of the rheometer, adjusted to a temperature of 25 °C throughout the analysis, and monitored using an efficient Peltier temperature control system included in the software. Samples were equilibrated for 2 min.
Steady-state flow tests with shear rate ramping up and down between 0 and 100 s−1 were selected [46] and tested with a ramp up (5 min), hold (5 min) and ramp down (5 min) process. The results were initially analyzed based on the power law model, which has been found to be appropriate to describe the flow behavior of soy slurry samples. The upward and downward flow viscosities were not very different, and time dependency was not observed; therefore, only the apparent viscosity at the logarithmic mid-shear rate of 10 s−1 during the downward ramp curve was determined to evaluate the effect of processing conditions on rheology and tabulated. This permitted us to obtain the apparent viscosity of samples subjected to pre-shearing (during upward and hold periods).

2.7.3. Statistical Analysis

All data were analyzed using SPSS 27.0 (SPSS Statistical Software, Inc., Chicago, IL, USA) and were expressed as the mean values with standard deviation. One-way analysis followed by post hoc using Tukey method was used with a significance level of p < 0.05.

3. Results and Discussion

3.1. Immunoreactivity of Test Samples

The IR of allergen proteins in the soy slurry samples that were processed with different thermal treatments as well as untreated fresh samples were analyzed via the sandwich ELISA method. This method is one of the most widely used and a current novelty in detecting allergens in food products. The ELISA test is used by the Canadian Food Inspection Agency for routine testing for the presence of allergens and for making decisions related to allergenicity. It provides an accurate and simple procedure for allergen detection, as opposed to the more sophisticated (and perhaps more accurate and expensive) LCMS/MS instrumental techniques. The employed ELISA kit was designed to detect the IR of allergens in both processed and unprocessed samples, and, therefore, the chances of detection of active allergens in raw and processed products were considered to be high.
The concentration of soy allergen was evaluated based on their IR first by setting up a standard curve by spiking soy allergen standards supplied in the test kit within the range of sensitivity permitted. Test samples needed to be appropriately diluted to bring their concentrations within the range equivalent to those established by the standards. A standard curve was established between the concentrations of allergens in the parts per billion (ppb) range (μg/L) on the x-axis and the optical density reading on the y-axis. The sample concentrations were estimated from the standard curve, where the results are in ppb (μg/L) and multiplied by the corresponding dilution factors [47]. The untreated control samples, therefore, had to be diluted 3 × 10 or 4 × 10 (1 mL to 10 mL in each level of dilution) in order to bring their concentrations within the detectable range, while the majority of the thermally processed samples often needed no dilution or at the most 1 × 10. Conventionally cooked samples required 2 × 10 or 3 × 10 dilutions to bring them to a concentration in the low detection range.

3.2. Cooking Treatment

Baseline data were first gathered for allergen IR reduction in soy sauce under conventional cooking conditions. As detailed in the methodology, test samples were hot-filled and held at 100 °C for the different cooking periods, as detailed in Table 1. Since the samples were preheated, the target and delivered cooking times were nearly the same (perhaps a minute or two less). Since under these conditions test samples were held at only 100 °C, the process lethality expected (or targeted) was essentially below 0.5 min of the equivalent heating time at 121 °C (which can be obtained from Equation (1)). The Fo equivalent (which was at 121 °C) of 0.5 min was achieved by heating for ~65 min at 100 °C.
Table 2 shows the values of the soy IR detected in the fresh as well as conventionally cooked samples. The fresh control sample had an allergen concentration of 333 × 103 ppb. The soy slurry samples cooked under stovetop conditions at 100 °C (atmospheric pressure) resulted in a progressive decrease in the IR to 96.3–97.0% of their initial values (1.43 to 1.53 logarithmic cycle reductions) with an equivalent residual allergen content of 12.3 to 9.9 ppm. According to the threshold report published by the FDA in 2005, the lowest observed adverse effect level (LOAEL) of soy is from 55 to 888 ppm [48]. In order to comply with the labeling requirements of soy milk, the US FDA suggested that the allergen concentration be below 10 ppm (color code green) when no precautionary statements are needed, between 10 and 100 ppm (yellow) when a “may be present or may contain” statement is needed and >100 ppm (red) when allergen labeling is required [49]. This reflects the fact that, in order to bring the product to hypoallergenic status, levels far lower than what can be achieved by cooking (10–12 ppm) are needed. This suggests that atmospheric cooking under stovetop home cooking at 100°C for 10 to 60 min is insufficient to reduce the allergen IR to the required low concentration levels.

3.3. Thermal Processing at Different Temperatures

Conventional thermal processing (canning) is based on a sound scientific principle to reduce the probability of the survival of pathogenic Clostridium botulinum strains by a minimum of 12 logarithmic cycle levels (12D process) when low-acid foods are involved. Because of the safety issues involved, such a process needs to be approved by a process authority that will carry out heat penetration testing under commercial processing conditions and ensure a level of heat treatment delivered at the cold point location in the can to accomplish this designated 12D process (which is equivalent to a Fo value of 3 min, equivalent to heating at 121 °C for 3 min). However, since other mesophilic spore-forming bacteria, more resistant than C. botulinum, may be present in the low-acid foods, these are often heated to an equivalent Fo value of at least 5 min (and occasionally longer).
This requires that the heat penetration tests be carried out with temperature devices installed to gather cold spot temperatures during the thermal processing process. These have been described in detail in Section 2.3. Time–temperature data were gathered and integrated to compute the accumulated lethality and cook value levels, which are discussed next.

3.3.1. Thermal Processing Conditions

The processing time and temperature data for the samples to be treated are presented in Table 1. Table 3 summarizes other processing details for the different test runs. The cooking process is initiated automatically by the Instant Pot cooker once the cooking temperature is reached and continues up to the specified process time. The come-up times varied depending on the cooking and room temperature conditions and ranged between 15 and 18 min. During the come-up time and cooking process, the pressure release valve opens as needed to vent out the air present in the cooker prior to establishing saturated steam processing conditions at the target temperatures. The actual cooking times achieved were nearly the same as the original nominal times selected. The cooking time average temperatures as measured during test runs were also nearly the same as the set nominal temperatures, as can be observed from the table.

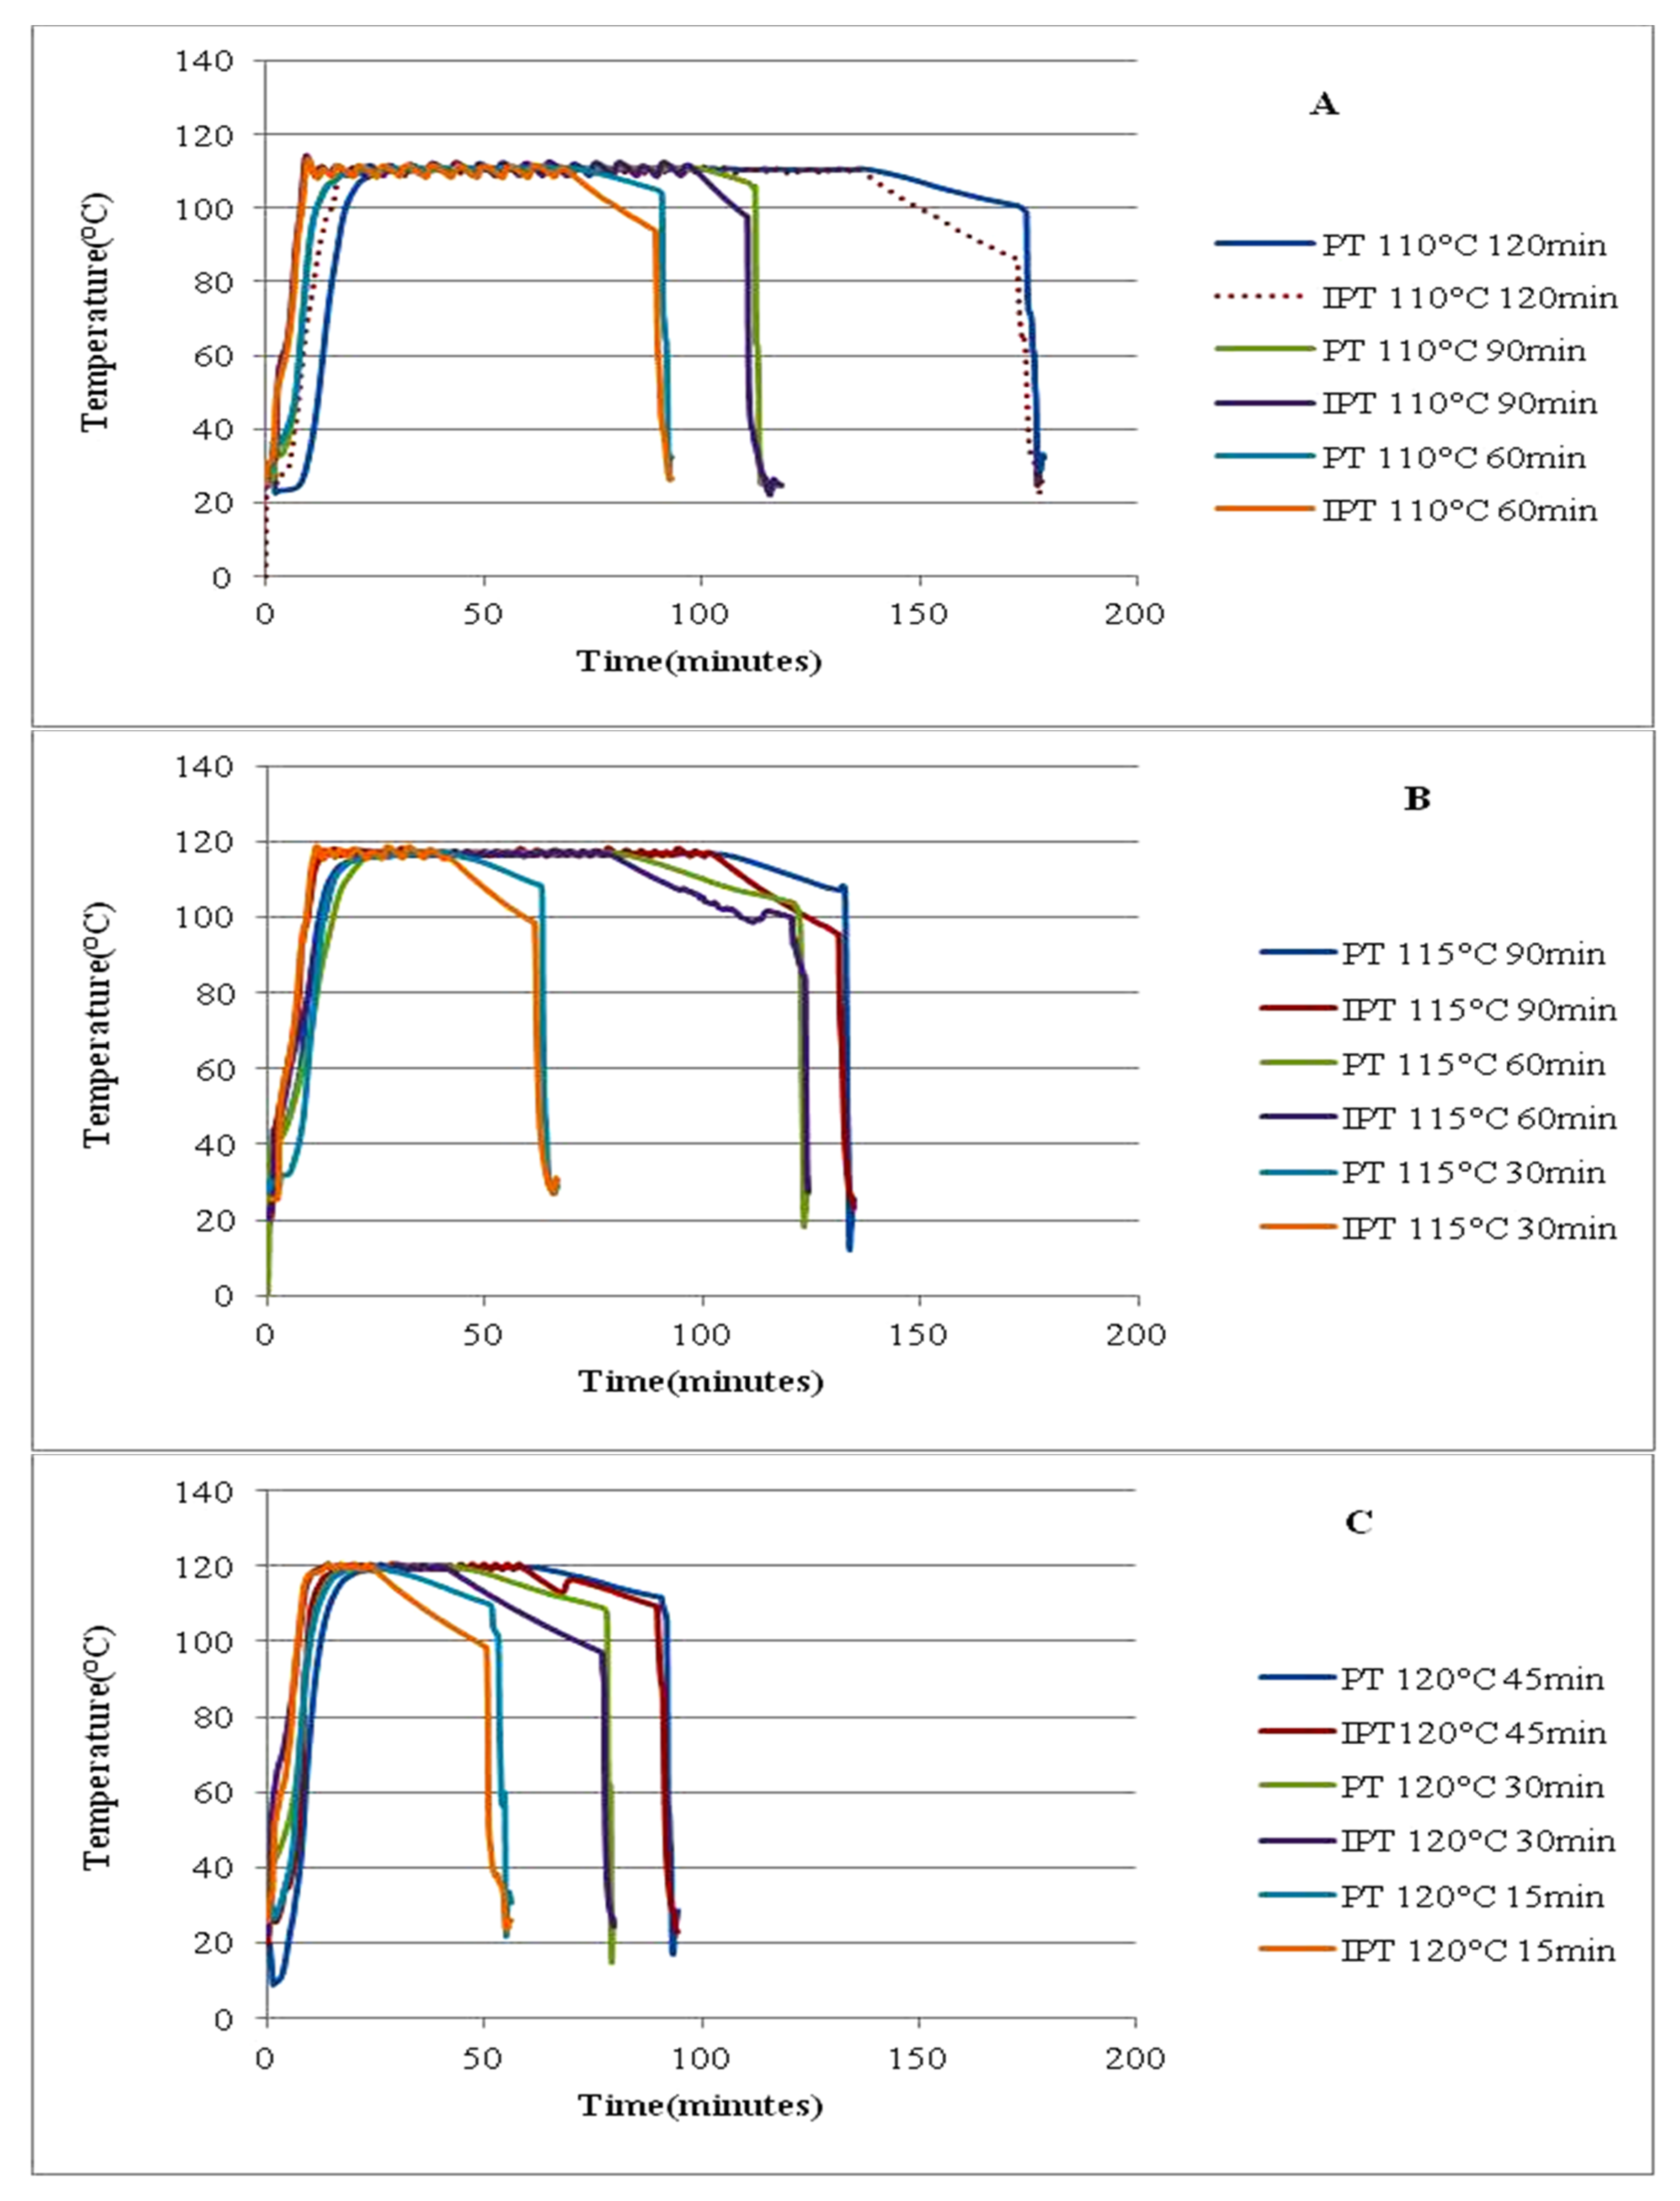
3.3.2. Heat Penetration Profiles

Time–temperature profiles of different test runs are shown in Figure 2, grouped by processing temperatures and times. The curves are characterized by the come-up phase, cooking period and cool-down phase, and the corresponding product temperatures inside the jars as well as in the cooker. As can be clearly visualized, the three temperatures are separated vertically according to their peak temperatures. The three cooking periods at each temperature represent the process times (excluding the come-up) and then a biphasic cooling, the first one representing a slow natural pressure cooling and then a rapid pressure drop with the pressure release. Because of the rapid convection heating of the liquid product, the soy slurry temperature in the jars during cooking almost followed the steam temperature in the pot. The come-up times, cook times and average cook temperatures are given in Table 3.

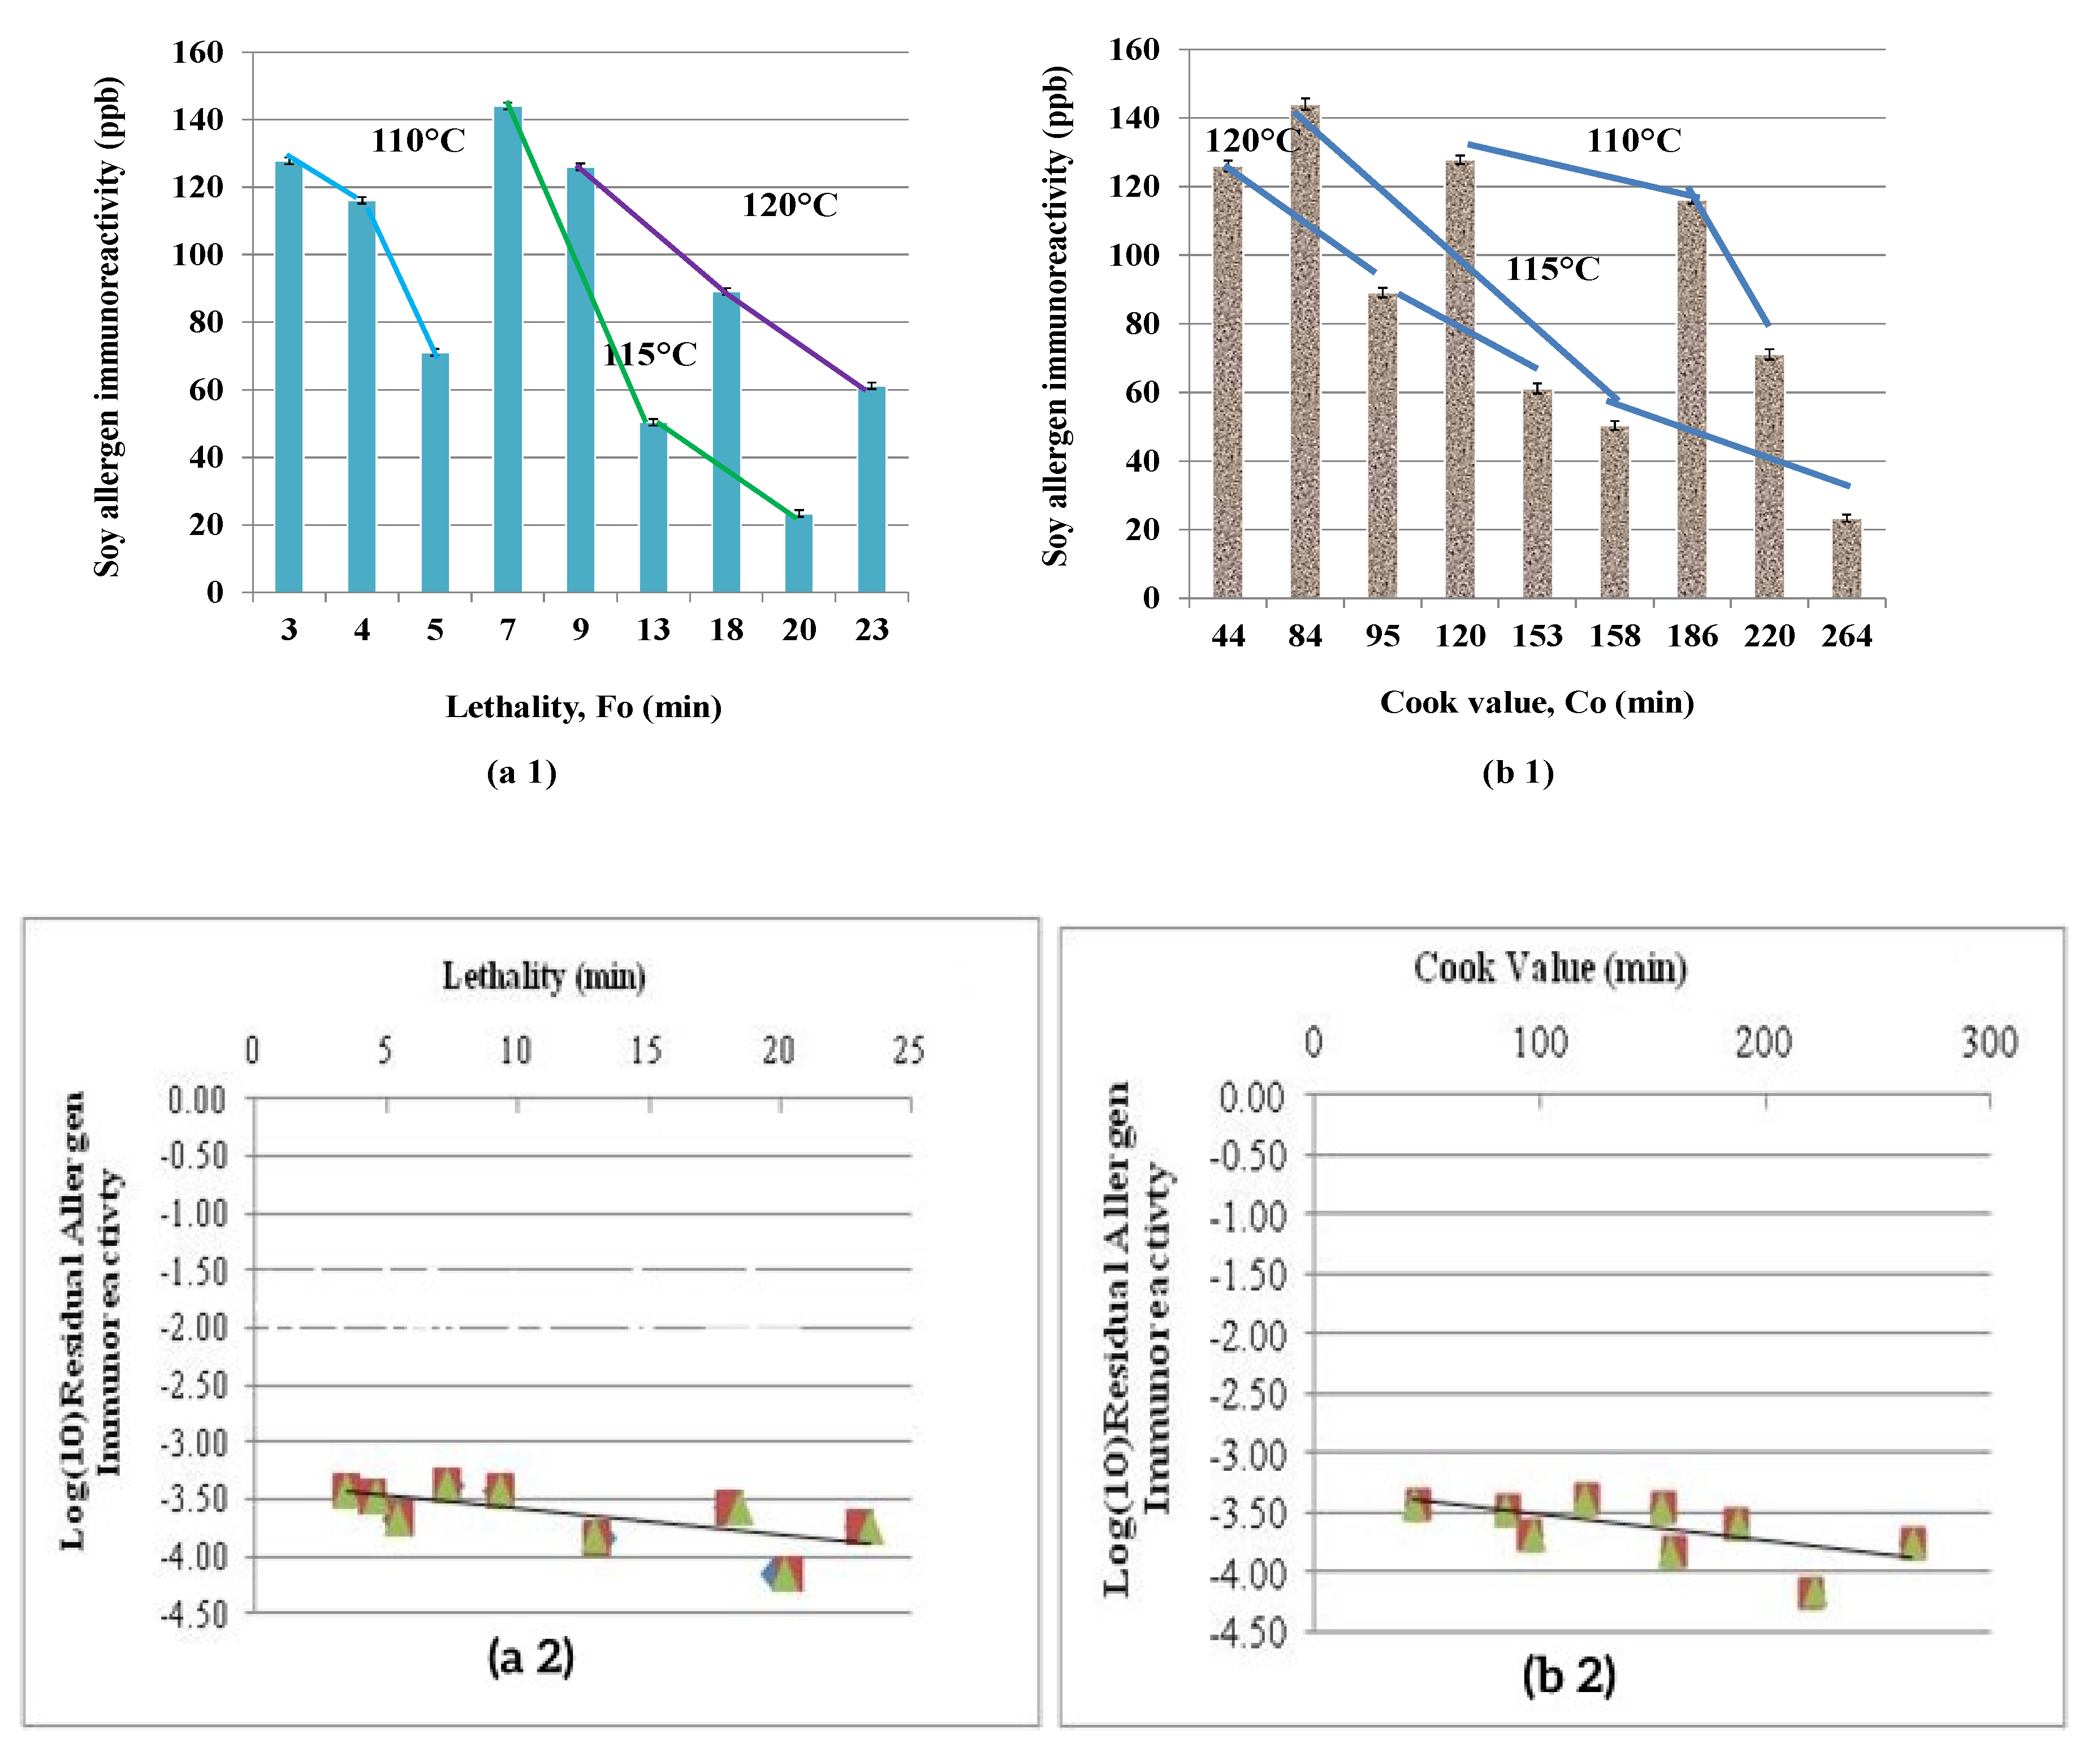
3.3.3. Lethality and Cook Value

The lethality and cook values computed from the gathered time–temperature data are also shown in Table 1. Overall, the lethality values ranged from 3 to 24 min for the different test runs. The lethality shown at 110 °C (60–90 min), which was in the range of 3 min to 4 min, represented the somewhat normal commercial thermal processing conditions, while those at 110 °C (120 min) and 115 °C and 120 °C achieved Fo values from 9–23 min representing moderately severe or intense thermal processing, which is rather unusual for conventional thermal processing. In most cases, these excessive processing conditions are not employed because they are unnecessary and usually result in a higher degradation of quality characteristics, except when the product specifically needed to be given to sensitive populations, such as special diets for children, pregnant women or patients recovering from illness. These were employed in this study mainly to assess their influence on the IR of allergen proteins. It was recognized there could be some severe quality loss, but this was given low importance because, if successful in allergen reductions, the quality deterioration could be minimized later by optimization procedures.
Further, the equivalent cook values were also computed for the different processing conditions based on a z value of 33 °C, as has been employed in earlier studies [41]. The cook values are generally indicative of the cooking severity, with higher numbers generally indicating higher quality loss. Quality parameters have a lower temperature sensitivity than microorganisms and are, therefore, represented by a higher z value (e.g., 33 °C) as compared to that of microbial spores (~10 °C). Proteins are part of the quality group, and allergens are proteins. So, this analysis of lethality (Fo) versus cook value (Co) helps generate information for future quality optimization approaches. The high-temperature short-time (HTST) concept is also based on predicting processing conditions that are conducive to better quality retention without compromising food safety. It can be observed that cook values achieved for thermal processing situations were considerably higher than those employed under stovetop conventional cooking conditions (10–60 min) in most cases, except for the 115 °C temperature process with a 30 min processing time. The equivalency is just for relative comparison, although the heat severity could significantly vary for the same cook value when processed at higher temperatures. Further, as can be seen, high Co values also result in higher Fo values.
In previous studies, the ratio of Co/Fo has been used as an indicator of quality destruction and is minimized to achieve quality optimization [41]. From Table 1, it is clear that the Co/Fo ratio is very high for conventional cooking (minutes at 100 °C, equivalent to a minute at 121.1 °C), ranging between 111 and 138. In the thermal processing situations, this varied between 5 and 40, which is about 5–30% of those under cooking conditions. This means that many of the thermal processing conditions employed are conducive to better quality preservation, especially the condition with a Co/Fo in the 5–9 range.
Table 2 also shows the values of the soy IR detected after the different thermal processing treatments in addition to those following conventional cooking. The fresh control sample had an allergen concentration of 33.3 × 10⁴ ppb. Samples subjected to different thermal processing showed IR reduced to an equivalent value of 23 and 144 ppb. This represented a significant reduction in soy IR, ranging from 99.96–99.99% (3–4 log(10) reductions). The level of allergen reduction at different time–temperature combination processes varied, and, in general, longer cooking times at a given temperature resulted in a greater reduction in consistency with the level of achieved Fo values and Co values. However, there was some overlap between them. The overall reduction in all these samples subjected to moderate and intense thermal processing was more than three logarithmic cycles (>99.9%). As noted before, in order to bring the product to a hypoallergenic status, far lower than what can be achieved by cooking (a reduction to 10–12 ppm) is needed. The different thermal processing reduced the IR level from around 3 × 10⁵ ppb to below the FDA-suggested 50 ppb value [49].
Thermal processing can result in modifications to protein structure, such as denaturation, hydrolysis of peptide bonds and aggregation by disulfide and covalent bonds. These reactions can lead to changes in the epitope integrity of allergens that may either increase or decrease the IR level in the soy slurry samples [20]. Epitopes are protein sites that are recognized by antibodies that can bind to an antigen or an allergen during allergen analysis [50]. Since these thermal treatments can induce changes in their conformations, a change in their binding characteristics can occur, which may result in a lowering of the intensity of their IR.

3.3.4. Effect of Process Time and Temperature on Allergen Reduction

Because of some of the overlaps with respect to the influence of different process variables on the treatment performance, the general trends with respect to the influence of process parameters on soy IR reduction are not clear. These are shown in Figure 3 as a function of process lethality and cook value with allergen IR activity in terms of residual allergen concentration (ppb) and logarithmic reductions. At each temperature, a longer treatment time (i.e., higher Fo and Co) consistently resulted in lowering the IR level. Figure 3 also gives an excellent demonstration of the precision of the measurement method, indicating that the method was sensitive enough to detect differences even at 10–100 ppb levels. The decrease in allergen concentration at higher lethality and cook values can be due to the change in the structural denaturation and breakdown of allergen proteins by the effect of high temperatures and processing times [51]. The general semi-logarithmic change in a reduction in IR of soy allergens with lethality and cook values is clearer. There appears to be considerable spread, but the general trend within the range of values under the treatment conditions shows a log-linear relationship between IR reduction and lethality and cook values.
The lethality and cook values at 115 and 120 °C overlap and crossover depending on the time and temperature combinations. This leads to some common lethality values resulting from two different temperatures, and their sensitivity to the reduction of IR appears to be different. Higher lethality values coming from higher temperatures and shorter times (HTST) did not result in the same level of reduction as from lower temperatures and longer times (LTLT). For example, the reduced IR level was 71 ppb after 5 min lethality at 110 °C, while it was reduced to only 144 ppb after a lethality of 9 min at 115 °C and to 126, 89 and 61 ppb after 9–23 min lethality at 120 °C. Therefore, lethality alone cannot be an absolute indicator of allergen reduction potential.
Similar observations could also be made with cook values. In general, higher cook values at a given temperature resulted in larger reductions in the allergen IR. However, with respect to the cook values, treatments at different temperatures had a higher spread and larger overlap. The processing times were different and obviously contributed to the differences, but the highest temperature (120 °C) resulted in the lowest cook value range of 44 to 153 min, while the lowest temperature of 110 °C had a span of 120 to 220 min and the middle temperature had the longest span of 84 to 264 min. Cook values of 95 min and above resulted in a lowering of the IR level below 100 ppb. Perhaps cooking for over 100 min might have also resulted in a lowering of the IR. This opens up the possibility of opting for more than one combination, which can be combined with other process outputs such as nutrient destruction or sensory quality-related or performance-related outcomes such as acceptability, productivity or efficiency.
Some comparisons can be made with respect to the temperature effect. Each of the three heating times, 30, 60 and 90 min, shared at least two temperatures. Within the time constraint, the higher temperatures resulted in a greater reduction, which has also been confirmed by Dong et al. [33]. A 5 degree increase in temperature from 115 to 120 °C with a 30 min treatment resulted in a 38% greater reduction. However, the same temperature increase between 110 and 115 °C with a 60 min treatment resulted in a 61% reduction, and again, the same 5 degree difference in the same temperature range with a 90 min treatment resulted in an 80% reduction. This tends to indicate again the importance of holding or treatment time in influencing the allergen IR reduction. Some similar conclusions have also been made on the influence of temperature level and treatment time on allergen reduction by [24]. A longer treatment time has a clearly greater influence than a smaller increase in temperature on allergen reduction. All these observations clearly provide opportunities for optimization by choosing an appropriate experimental design for process optimization, such as response surface methodology and a central composite rotatable design (CCRD).

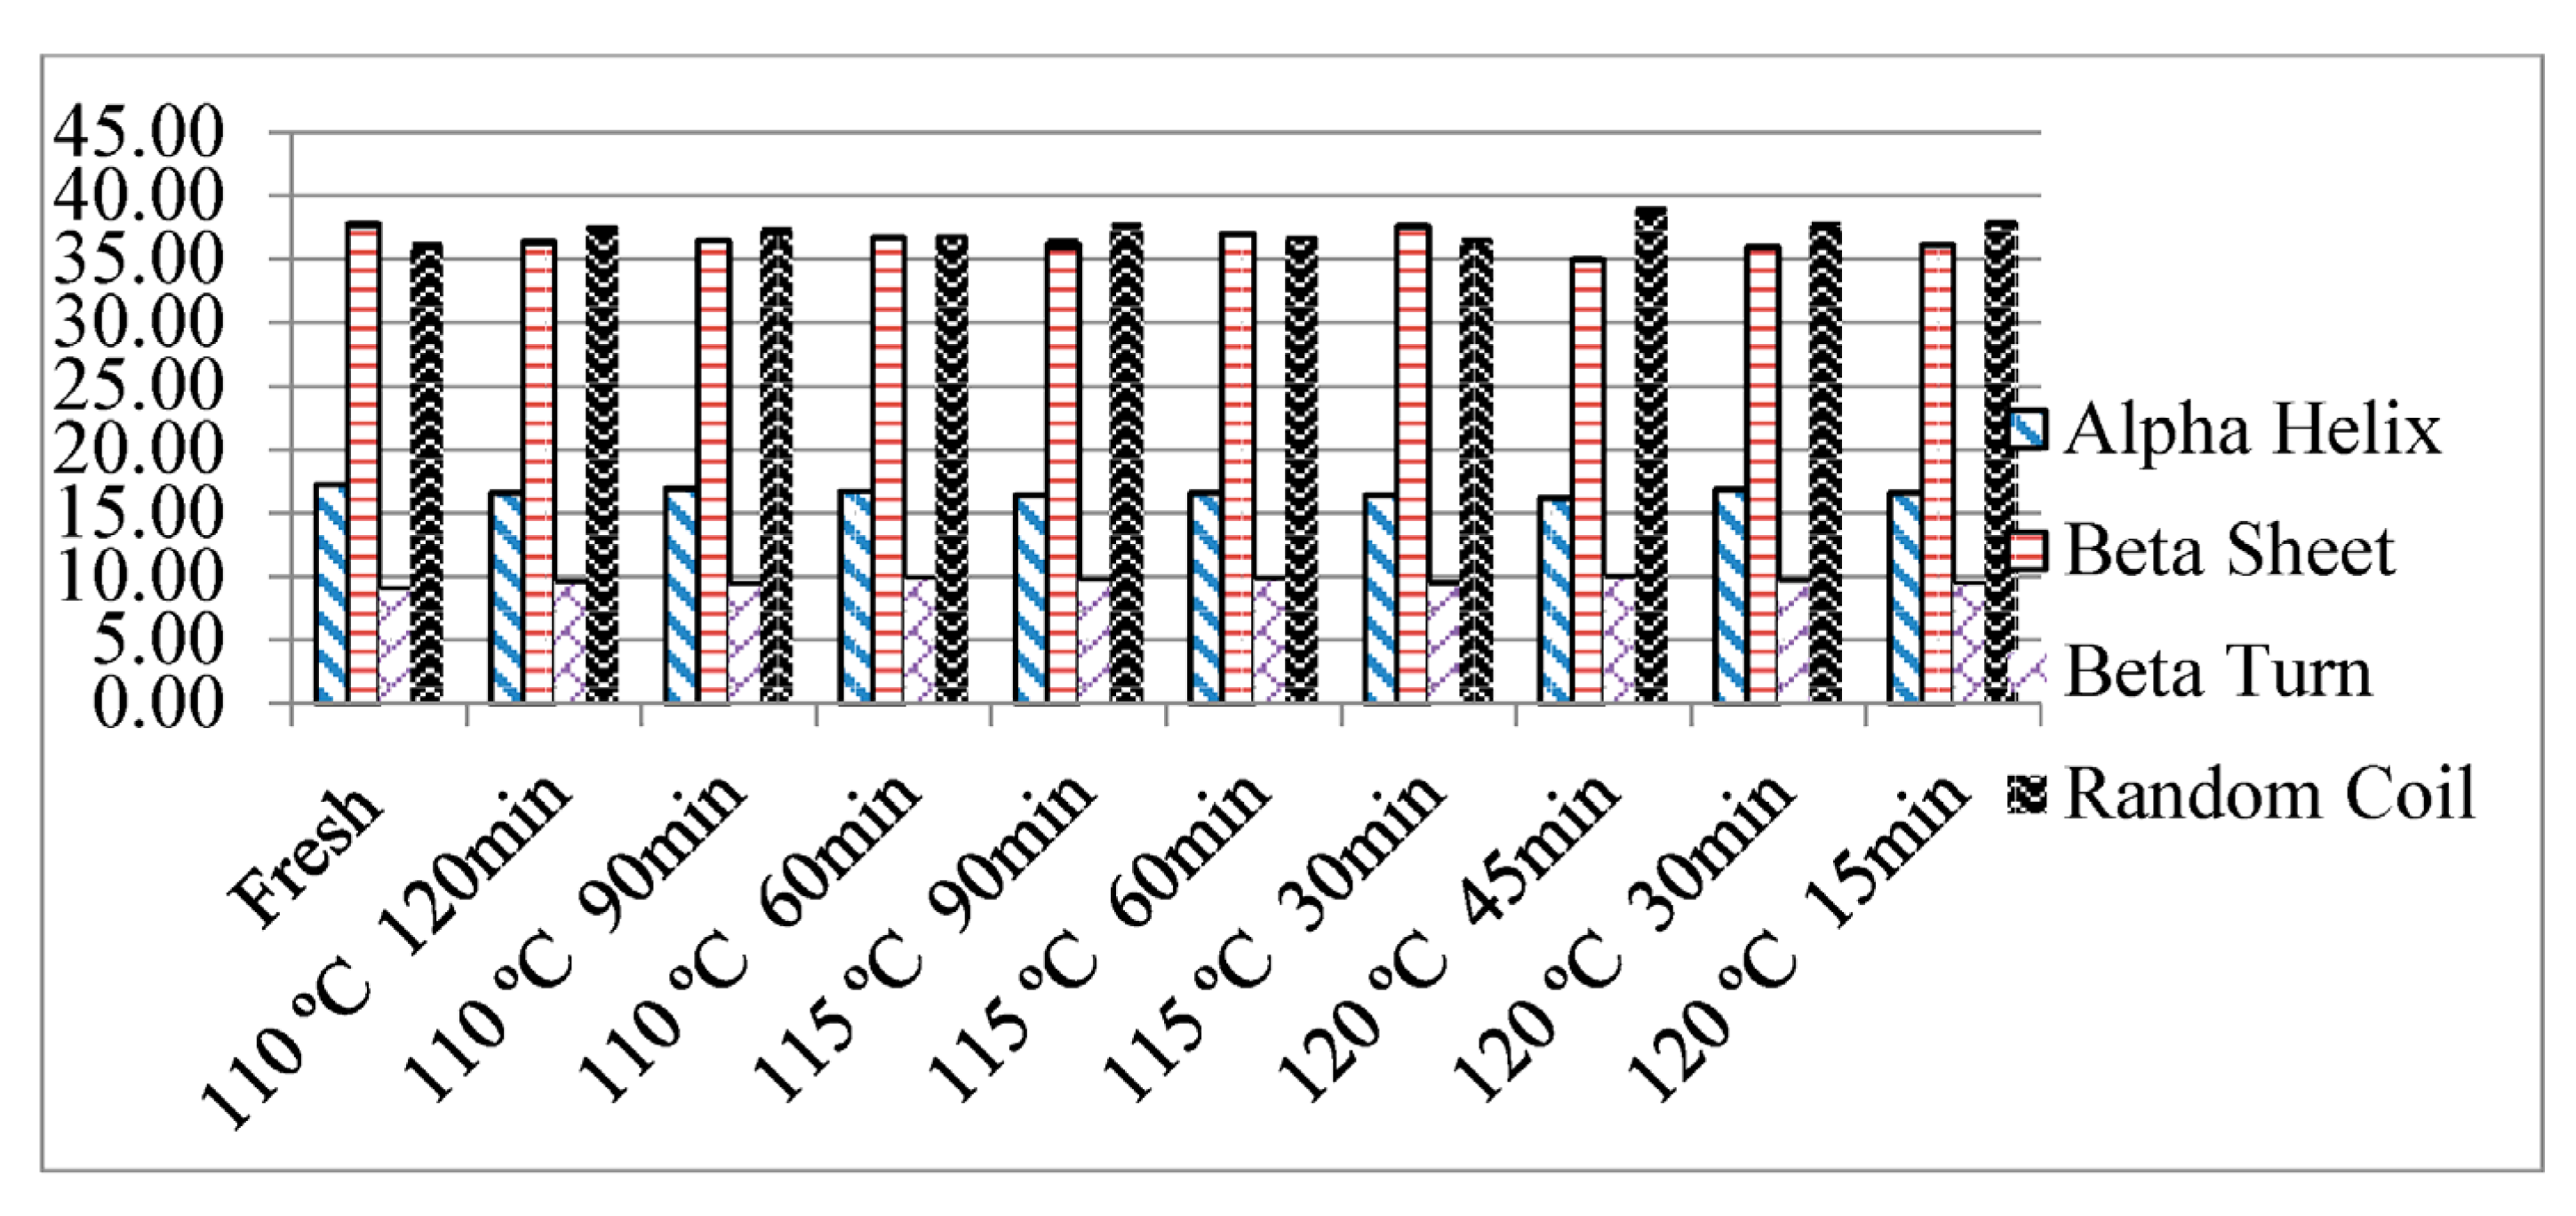
3.4. Effect of Thermal Processing on the Secondary Structure of Proteins

Researchers have shown that the protein–peptide group has nine characteristic absorption bands: amide A (~3300 cm−1), amide B (~3100 cm−1), amide I (~1650 cm−1), amide II (~1550 cm−1), amide III (~1300 cm−1), amide IV (~735 cm−1), amide V (~635 cm−1), amide VI (~600 cm−1) and amide VII (~200 cm−1) [52]. Through the IR spectra of proteins, information about the secondary structure is characterized by the absorption bands of peptide bond vibrations -CO-NH-, whose functional groups are directly involved in the formation of a particular component of the secondary structure. Each type of secondary structure provides different C=O stretching. Comparing the normalized spectra of fresh and thermally processed soy slurry samples, there was a notable difference observed in the intensity and shape of bands near 1050 cm−1 in all samples, which attribute to the covalent bond between carbon and oxygen and two carbon atoms (C–O and C–C) vibration bands of glycosidic bonds and pyranoid ring [53]. These peak intensity variations in the bands indicate that conformational changes occurred in the side chain proteins as a result of intense thermal processing, as shown for three different temperatures in Figure 4. The intensity of the peak at 1050 cm−1, characteristic of the amide IV band, was not dependent on the processing time at 115 °C since the highest was shown in a treatment of 60 min, followed by 30 and 90 min, respectively. On the other hand, when processing at 110 °C and 120 °C, the peak intensity was directly dependent on time, as it decreased according to the reduction in treatment time.
Two mathematical approaches are often used to separate and quantify highly overlapping components of amide I that arise due to the presence of various secondary structural elements, and these are, namely the second derivative and the Fourier self-deconvolution (FSD) method [54]. In this study, FSD is used for its greater convenience compared to second derivative analysis. Fourier self-deconvolution is a mathematical tool for reducing bandwidth so that overlapping bands can be separated from each other. In this method, apodization is used to resolve the overlapping lines, i.e., the truncation of the interferogram, which is used to calculate the spectra in Fourier spectrometers using the Fourier transform. During apodization, the bandwidth is decreased manually so that the true line component profiles are distorted in their resolution.
From Figure 5, it is clear that the main secondary structure of fresh soy slurry (5%) was found to be β-sheet and random coil, followed by α-helix and β-turn. After intense thermal processing, all soy slurry samples showed a decrease in the percentages of α-helix and β-sheet and a marginal increase in β-turn and random coil. By analyzing the content of the secondary structure of samples, there was, moreover, an unusually large value for random coil or disordered (1639–1654 cm−1) than α-helix (1642–1660 cm−1) and β-turn (1653–1691 cm−1) content even in fresh soy slurry.
When determining a relationship between the ELISA and FTIR results, all processing at 110, 115 and 120 °C with longer times (120, 90 and 45 min) gave high levels of random coil values and lower levels of allergen content, i.e., the higher the temperature, the higher the random coil percentage, which indicates destruction of the native structure of proteins and indirectly relates to the reduction in IR of these proteins (Figure 5). However, all the processing at 120 °C (45, 30 and 15 min) showed an increase in the level of the random coil but was lower than what was shown at 45 min, which can be visibly seen in the turbidity of soy slurry samples [55,56]. This may be due to the effect of intense thermal processing which may have changed the β-sheet structure to transform to a more aggregated random coil but may still have the epitope integrity; this may have shown a higher level of allergen content since soy proteins such as 11S Glycinin and other proteins’ IR greatly depend on the conformational structure, as reported previously [57]. Soy proteins are globular in nature and have hydrophobic sites (allergenic) inside the structure, which make them difficult to degrade with short-term thermal processing. Yet, as the temperature increased, these sites may have been exposed and lost their binding ability, which gave the lower value of IR in the ELISA results. Exposure to long-term thermal processing can make the soy proteins denature and make the buried sulfhydryl groups vulnerable, resulting in the unfolding of protein molecules and the loss of IR of antigenic epitopes [51,58].

3.5. Effect of Thermal Processing Treatments on Quality Parameters

3.5.1. Effect on Color

When the samples were treated at temperatures of 110, 115 and 120 °C for different time intervals, the color values significantly changed, depending more on the temperature than the treatment times, as shown in Table 4 (p < 0.05). The L* value, for example, of the untreated sample was 37.6 which changed to about 28–33 at 120 °C, 16–20 at 115 °C and 11–13 at 110 °C. Thus, the treatment at 110 °C, which is equivalent to conventional thermal processing with Fo values in the 3–5 min range, had the highest effect on the L* value, indicating some discoloration, while the most severely treated samples at 120 °C had little effect. This was because of the longer duration at 110°C as compared to shorter ones at 120 °C, in line with the high-temperature short-time concept for better quality retention. Likewise, the a* and b* values increased more at the lower temperature than at the higher one. ∆E represents the total color difference and takes into account the deviations in L, a and b values from the control samples. This represents the changes in an aggregated manner and represents the trend in the majority of cases. It can be seen that the differences in the allergen reduction between the control and processed samples were lowest with samples treated at 120 °C and highest with those treated at 110 °C, confirming the earlier observations with respect to the temperature’s effect.

3.5.2. Effect on Viscosity

The different treatment conditions did not greatly affect the rheological character of the treated products. The viscosity values for the treated products varied from 3.3–8.5 cP, while that of the fresh sample was 4.5 cP, as shown in Table 4. Samples observed no significant difference when processed at 110 °C for 90 and 120 min. Similarly, viscosity values were, moreover, similar for soy slurry when processed at 120 °C for 15 and 45 min but produced a slightly higher value of 4.33 cP at 30 min. The values significantly varied for all samples processed at 115 °C, as they showed higher viscosity values in a range of 4.08 to 8.47 cP (p < 0.05). The aggregation of proteins due to heat treatment was expected to increase the viscosity as they denature at the high-temperature treatment, but it was not clearly observed, possibly because the concentration of soy was low at the 5% level. The denaturation effects may manifest more when higher concentrations are employed. However, at this level, the effect of treatment was insignificant.

4. Conclusions

Different thermal processing treatments at different times and temperatures (100–120 °C, 15–120 min) greatly affected the ELISA-based IR in soy slurry. It was demonstrated using the ELISA technique that nearly four log reductions in IR can be achieved by moderate to intense thermal processing. On the other hand, conventional cooking for up to 60 min failed to reduce the allergen content beyond 97% (<1.5 log) level. This can be the result of the extensive denaturation of proteins, which makes the allergic proteins unavailable to bind with the epitopes. Denaturation led to the loss of secondary and tertiary structures, cleavage and rearrangements of disulfide bonds, and the formation of intra-molecular disulfide bonds, which increased the unordered structure of random coil percentages as analyzed via FTIR. Millard and other chemical reactions can be expected to occur in thermally treated samples as a reaction between the available proteins and carbohydrates in the slurry. These are generally enhanced under high temperatures and longer processing times, which can lead to a reduction in allergens due to engaging the proteins but also can result in significant changes in quality and functionality. Further, the color and viscosity changes associated with processing can be expected to be higher at the higher soy concentration levels employed, but at the 5% concentration level used, their influence was minimal.
It is very encouraging to find a highly significant reduction in IR as found in this study. The study only employed a biochemical method for allergens, and it is hoped that it will also result in a similar reduction in the allergenicity of the treated samples; however, this needs to be confirmed with human trials. The study paves the way for choosing these new treatments for testing in allergenicity trials, and, if found successful, this will provide a great way for allergen control and remediation research. The study also indicates that there are many different ways by which allergen IR could be reduced, and some of these can be adopted in day-to-day domestic cooking methods.

Author Contributions

Conceptualization, H.S.R.; methodology, H.S.R. and A.R.; validation, H.S.R. and A.R.; formal analysis, A.R.; resources, H.S.R.; data curation, A.R.; writing—original draft preparation, A.R.; writing—review and editing, H.S.R.; project administration, H.S.R.; funding acquisition, H.S.R. All authors have read and agreed to the published version of the manuscript.

Funding

This research was funded by the Natural Sciences and Engineering Research Council of Canada Strategic Grant Program.

Data Availability Statement

Data will be shared as needed up on request.

Acknowledgments

The authors acknowledge the funding support from the Natural Sciences and Engineering Research Council of Canada (NSERC).

Conflicts of Interest

The authors declare no conflict of interest.

References

  1. Johnson, L.A.; White, P.J.; Galloway, R. Soybeans-Chemistry, Production Processing, and Utilization; AOCS Press: Urbana, IL, USA, 2008; Volume 2, pp. 441–447. [Google Scholar]
  2. Adachi, M.; Takenaka, Y.; Gidamis, A.B.; Mikami, B.; Utsumi, S. Crystal structure of soybean proglycinin A1aB1b homotrimer. J. Mol. Biol. 2001, 305, 291–305. [Google Scholar] [CrossRef]
  3. Codina, R.; Lockey, R.F.; Fernández-Caldas, E.; Rama, R. Purification and characterization of a soybean hull allergen responsible for the Barcelona asthma outbreaks. II. Purification and sequencing of the Gly m 2 allergen. Clin. Exp. Allergy 1997, 27, 424–430. [Google Scholar] [CrossRef]
  4. Crowell, D.N.; John, M.E.; Russell, D.; Amasino, R.M. Characterization of a stress-induced, developmentally regulated gene family from soybean. Plant Mol. Biol. 1992, 18, 459–466. [Google Scholar] [CrossRef] [PubMed]
  5. González, R.; Zapatero, L.; Caravaca, F.; Carreira, J. Identification of soybean proteins responsible for respiratory allergies. Int. Arch. Allergy Immunol. 1991, 95, 53–57. [Google Scholar] [CrossRef] [PubMed]
  6. Klemans, R.J.; Knol, E.F.; Michelsen-Huisman, A.; Pasmans, S.G.; de Kruijf-Broekman, W.; Bruijnzeel-Koomen, C.A.; van Hoffen, E.; Knulst, A.C. Components in soy allergy diagnostics: Gly m 2S albumin has the best diagnostic value in adults. Allergy 2013, 68, 1396–1402. [Google Scholar] [CrossRef] [PubMed]
  7. Maruyama, N.; Adachi, M.; Takahashi, K.; Yagasaki, K.; Kohno, M.; Takenaka, Y.; Okuda, E.; Nakagawa, S.; Mikami, B.; Utsumi, S. Crystal structures of recombinant and native soybean β-conglycinin β homotrimers. Eur. J. Biochem. 2001, 268, 3595–3604. [Google Scholar] [CrossRef]
  8. Riascos, J.J.; Weissinger, S.M.; Weissinger, A.K.; Kulis, M.; Burks, A.W.; Pons, L. The Seed Biotinylated Protein of Soybean (Glycine max): A Boiling-Resistant New Allergen (Gly m 7) with the Capacity To Induce IgE-Mediated Allergic Responses. J. Agric. Food Chem. 2016, 64, 3890–3900. [Google Scholar] [CrossRef]
  9. Rihs, H.P.; Chen, Z.; Ruëff, F.; Petersen, A.; Rozynek, P.; Heimann, H.; Baur, X. IgE binding of the recombinant allergen soybean profilin (rGly m 3) is mediated by conformational epitopes. J. Allergy Clin. Immunol. 1999, 104, 1293–1301. [Google Scholar] [CrossRef]
  10. Dreau, D.; Lallès, J.P.; Philouze-Rome, V.; Toullec, R.; Salmon, H. Local and systemic immune responses to soybean protein ingestion in early-weaned pigs. J. Anim. Sci. 1994, 72, 2090–2098. [Google Scholar] [CrossRef]
  11. Helm, R.M.; Cockrell, G.; Connaughton, C.; Sampson, H.A.; Bannon, G.A.; Beilinson, V.; Livingstone, D.; Nielsen, N.C.; Burks, A.W. A soybean G2 glycinin allergen. Int. Arch. Allergy Immunol. 2000, 123, 205–212. [Google Scholar] [CrossRef]
  12. Holzhauser, T.; Wackermann, O.; Ballmer-Weber, B.K.; Bindslev-Jensen, C.; Scibilia, J.; Perono-Garoffo, L.; Utsumi, S.; Poulsen, L.K.; Vieths, S. Soybean (Glycine max) allergy in Europe: Gly m 5 (β-conglycinin) and Gly m 6 (glycinin) are potential diagnostic markers for severe allergic reactions to soy. J. Allergy Clin. Immunol. 2009, 123, 452–458.e4. [Google Scholar] [CrossRef] [Green Version]
  13. Krishnan, H.B.; Kim, W.-S.; Jang, S.; Kerley, M.S. All Three Subunits of Soybean β-Conglycinin Are Potential Food Allergens. J. Agric. Food Chem. 2009, 57, 938–943. [Google Scholar] [CrossRef] [PubMed]
  14. Sun, H.; Liu, X.; Wang, Y.-Z.; Liu, J.-X.; Feng, J. Soybean glycinin- and β-conglycinin-induced intestinal immune responses in a murine model of allergy. Food Agric. Immunol. 2013, 24, 357–369. [Google Scholar] [CrossRef]
  15. Costa, J.; Amaral, J.S.; Grazina, L.; Oliveira MB, P.P.; Mafra, I. Matrix-normalised real-time PCR approach to quantify soybean as a potential food allergen as affected by thermal processing. Food Chem. 2017, 221, 1843–1850. [Google Scholar] [CrossRef] [PubMed]
  16. Kattan, J.D.; Cocco, R.R.; Järvinen, K.M. Milk and Soy Allergy. Pediatr. Clin. N. Am. 2011, 58, 407–426. [Google Scholar] [CrossRef] [PubMed]
  17. Zeiger, R.S.; Sampson, H.A.; Bock, S.A.; Burks, A.W., Jr.; Harden, K.; Noone, S.; Martin, D.; Leung, S.; Wilson, G. Soy allergy in infants and children with IgE-associated cow’s milk allergy. J. Pediatr. 1999, 134, 614–622. [Google Scholar] [CrossRef]
  18. Ogawa, T.; Samoto, M.; Takahashi, K. Soybean Allergens and Hypoallergenic Soybean Products. J. Nutr. Sci. Vitaminol. 2000, 46, 271–279. [Google Scholar] [CrossRef] [Green Version]
  19. Lusas, E.W.; Riaz, M.N. Soy protein products: Processing and use. J. Nutr. 1995, 125 (Suppl. S3), 573S–580S. [Google Scholar]
  20. Verhoeckx, K.C.M.; Vissers, Y.M.; Baumert, J.L.; Faludi, R.; Feys, M.; Flanagan, S.; Herouet-Guicheney, C.; Holzhauser, T.; Shimojo, R.; van der Bolt, N.; et al. Food processing and allergenicity. Food Chem. Toxicol. 2015, 80, 223–240. [Google Scholar] [CrossRef]
  21. Wang, T.; Qin, G.X.; Sun, Z.W.; Zhao, Y. Advances of research on glycinin and beta-conglycinin: A review of two major soybean allergenic proteins. Crit. Rev. Food Sci. Nutr. 2014, 54, 850–862. [Google Scholar] [CrossRef]
  22. Shibasaki, M.; Suzuki, S.; Tajima, S.; Nemoto, H.; Kuroume, T. Allergenicity of Major Component Proteins of Soybean. Int. Arch. Allergy Immunol. 1980, 61, 441–448. [Google Scholar] [CrossRef] [PubMed]
  23. Cabanillas, B.; Cuadrado, C.; Rodriguez, J.; Dieguez, M.C.; Crespo, J.F.; Novak, N. Boiling and pressure cooking impact on IgE reactivity of soybean allergens. Int. Arch. Allergy Immunol. 2018, 175, 36–43. [Google Scholar] [CrossRef] [PubMed]
  24. Gomaa, A.; Boye, J.I. Impact of thermal processing time and cookie size on the detection of casein, egg, gluten and soy allergens in food. Food Res. Int. 2013, 52, 483–489. [Google Scholar] [CrossRef]
  25. Gomaa, A.; Ribereau, S.; Boye, J. Detection of allergens in a multiple allergen matrix and study of the impact of thermal processing. J. Nutr. Food Sci. S 2012, 9, 2. [Google Scholar] [CrossRef] [Green Version]
  26. Pi, X.; Sun, Y.; Fu, G. Effect of processing on soybean allergens and their allergenicity. Trends Food Sci. Technol. 2021, 118, 316–327. [Google Scholar] [CrossRef]
  27. Pi, X.; Sun, Y.; Guo, X.; Chen, Q.; Cheng, J. Effects of thermal sterilization on the allergenicity of soybeans. LWT 2022, 15415, 112678. [Google Scholar] [CrossRef]
  28. Kerezsi, A.D.; Jacquet, N.; Blecker, C. Advances on physical treatments for soy allergens reduction—A review. Trends Food Sci. Technol. 2022, 122, 24–39. [Google Scholar] [CrossRef]
  29. Chen, J.; Wang, J.; Song, P.; Ma, X. Determination of glycinin in soybean and soybean products using a sandwich enzyme-linked immunosorbent assay. Food Chem. 2014, 162, 27–33. [Google Scholar] [CrossRef]
  30. Hei, W.; Li, Z.; Ma, X.; He, P. Determination of beta-conglycinin in soybean and soybean products using a sandwich enzyme-linked immunosorbent assay. Anal. Chim. Acta 2012, 734, 62–68. [Google Scholar] [CrossRef]
  31. Alpaslan, M.; Hayta, M. Effect of soymilk substitution on the rheological and sensory properties of salep (traditional Turkish milk beverage). Int. J. Food Prop. 2007, 10, 413–420. [Google Scholar] [CrossRef]
  32. Dong, X.; Wang, J.; Raghavan, V. Effects of high-intensity ultrasound processing on the physiochemical and allergenic properties of shrimp. Innov. Food Sci. Emerg. Technol. 2020, 65, 102441. [Google Scholar] [CrossRef]
  33. Dong, X.; Wang, J.; Raghavan, V. Critical reviews and recent advances of novel non-thermal processing techniques on the modification of food allergens. Crit. Rev. Food Sci. Nutr. 2021, 61, 196–210. [Google Scholar] [CrossRef] [PubMed]
  34. Okwunodulu, I.; Abasiekong, K. Rheological behaviour of fortified soymilk from sprouted soybean for complementary feeding: A response surface analysis. J. Mol. Stud. Med. Res. 2015, 1, 26–33. [Google Scholar] [CrossRef]
  35. Xiang, B.Y.; Simpson, M.V.; Ngadi, M.O.; Simpson, B.K. Effect of pulsed electric field on the rheological and colour properties of soy milk. Int. J. Food Sci. Nutr. 2011, 62, 787–793. [Google Scholar] [CrossRef] [PubMed]
  36. Bandekar, J. Amide modes and protein conformation. Biochim. Biophys. Acta (BBA)-Protein Struct. Mol. Enzymol. 1992, 1120, 123–143. [Google Scholar] [CrossRef]
  37. Baronio, C.M.; Baldassarre, M.; Barth, A. Insight into the internal structure of amyloid-β oligomers by isotope-edited Fourier transform infrared spectroscopy. Phys. Chem. Chem. Phys. 2019, 21, 8587–8597. [Google Scholar] [CrossRef] [Green Version]
  38. Munu, N.; Kigozi, J.; Zziwa, A.; Kambugu, R.; Wasswa, J.; Tumutegyereize, P. Effect of ambient-soaking time on soybean characteristics fortraditional soy milk extraciton. J. Adv. Food Sci. Technol. 2016, 3, 119–128. [Google Scholar]
  39. Shi, L.; Mu, K.; Arntfield, S.D.; Nickerson, M.T. Changes in levels of enzyme inhibitors during soaking and cooking for pulses available in Canada. J. Food Sci. Technol. 2017, 54, 1014–1022. [Google Scholar] [CrossRef] [Green Version]
  40. Dwivedi, M.; Ramaswamy, H.S. Comparative study of wireless versus standard thermocouples for data gathering and analyses in rotary cookers. J. Food Process. Preserv. 2010, 34, 557–574. [Google Scholar] [CrossRef]
  41. Abatemarco, C.A.; Ramaswamy, H.S. Heating behavior and quality factor retention in a canned model food as influenced by thermal processing in a rotary retort. J. Food Qual. 1993, 16, 273–285. [Google Scholar] [CrossRef]
  42. Meinlschmidt, P.; Ueberham, E.; Lehmann, J.; Schweiggert-Weisz, U.; Eisner, P. Immunoreactivity, sensory and physicochemical properties of fermented soy protein isolate. Food Chem. 2016, 205, 229–238. [Google Scholar] [CrossRef] [PubMed]
  43. Dudley, R.; Edwards, P.; Ekins, R.; Finney, D.; McKenzie, I.; Raab, G.; Rodbard, D.; Rodgers, R. Guidelines for immunoassay data processing. Clin. Chem. 1985, 31, 1264–1271. [Google Scholar] [CrossRef] [PubMed]
  44. Gallagher, W. FTIR analysis of protein structure. Course Man. Chem. 2009, 455. [Google Scholar]
  45. Alharaty, G.; Ramaswamy, H.S. The Effect of Sodium Alginate-Calcium Chloride Coating on the Quality Parameters and Shelf Life of Strawberry Cut Fruits. J. Compos. Sci. 2020, 4, 123. [Google Scholar] [CrossRef]
  46. Ramaswamy, H.S.; Gundurao, A. Effect of Soluble Solids and High Pressure Treatment on Rheological Properties of Protein Enriched Mango Puree. FOODS 2019, 8, 39. [Google Scholar] [CrossRef] [PubMed] [Green Version]
  47. Abbott, M.; Hayward, S.; Ross, W.; Godefroy, S.B.; Ulberth, F.; Van Hengel, A.J.; Roberts, J.; Akiyama, H.; Popping, B.; Yeung, J.M. Validation procedures for quantitative food allergen ELISA methods: Community guidance and best practices. J. AOAC Int. 2010, 93, 442–450. [Google Scholar] [CrossRef] [PubMed] [Green Version]
  48. Brooke-Taylor, S. Development of VITAL Allergen Actions Levels Grid Explanatory notes. 2007. Available online: https://www.bezpecnostpotravin.cz/UserFiles/File/Kvasnickova/VITAL_brozura.pdf (accessed on 5 December 2022).
  49. FDA U.S. Food and Drug Administration. In Draft Threshold report Approaches to Establish Thresholds for Major Food Allergens and for Gluten in Food.; 2006. Available online: https://www.fda.gov/files/food/published/Approaches-to-Establish-Thresholds-for-Major-Food-Allergens.pdf (accessed on 5 December 2022).
  50. Mills, E.; Madsen, C.; Shewry, P.; Wichers, H. Food allergens of plant origin—Their molecular and evolutionary relationships. Trends Food Sci. Technol. 2003, 14, 145–156. [Google Scholar] [CrossRef]
  51. Kleber, N.; Maier, S.; Hinrichs, J. Antigenic response of bovine β-lactoglobulin influenced by ultra-high pressure treatment and temperature. Innov. Food Sci. Emerg. Technol. 2007, 8, 39–45. [Google Scholar] [CrossRef]
  52. Krimm, S.; Bandekar, J. Vibrational spectroscopy and conformation of peptides, polypeptides, and proteins. Adv. Protein Chem. 1986, 38, 181–364. [Google Scholar] [CrossRef]
  53. Synytsya, A.; Čopíková, J.; Matějka, P.; Machovič, V. Fourier transform Raman and infrared spectroscopy of pectins. Carbohydr. Polym. 2003, 54, 97–106. [Google Scholar] [CrossRef]
  54. Cameron, D.G.; Moffatt, D.J. A Generalized Approach to Derivative Spectroscopy. Appl. Spectrosc. 1987, 41, 539–544. [Google Scholar] [CrossRef]
  55. Jiménez-Saiz, R.; Benedé, S.; Molina, E.; López-Expósito, I. Effect of processing technologies on the allergenicity of food products. Crit. Rev. Food Sci. Nutr. 2015, 55, 1902–1917. [Google Scholar] [CrossRef] [PubMed] [Green Version]
  56. Molina, E.; Papadopoulou, A.; Ledward, D. Emulsifying properties of high pressure treated soy protein isolate and 7S and 11S globulins. Food Hydrocoll. 2001, 15, 263–269. [Google Scholar] [CrossRef]
  57. L’Hocine, L.; Boye, J.I.; Jouve, S. Ionic strength and pH-induced changes in the immunoreactivity of purified soybean glycinin and its relation to protein molecular structure. J. Agric. Food Chem. 2007, 55, 5819–5826. [Google Scholar] [CrossRef]
  58. Bu, G.; Luo, Y.; Zheng, Z.; Zheng, H. Effect of heat treatment on the antigenicity of bovine α-lactalbumin and β-lactoglobulin in whey protein isolate. Food Agric. Immunol. 2009, 20, 195–206. [Google Scholar] [CrossRef]
Figure 1. Sample preparation flowchart of soy slurry.
Processes 11 00093 g001
Figure 2. Time–temperature profile of thermal processing performed at (A) 110 °C, (B) 115 °C and (C) 120 °C at different time intervals.
Processes 11 00093 g002
Figure 3. Effect of lethality (a1,a2) and cook value (b1,b2) on reduction of soy IR in linear and semi-logarithmic formats.
Processes 11 00093 g003
Figure 4. FTIR normalized spectra (1200–800 cm−1) of soy slurry samples processed at (A) 110 °C, (B) 115 °C and (C) 120 °C.
Processes 11 00093 g004
Figure 5. Percentage content of secondary structure of fresh, unprocessed and thermally treated soy slurry samples.
Processes 11 00093 g005
Table 1. Design of thermal processing and cooking time schedule with targeted and delivered process lethality, the resulting cook values and Co/Fo ratio.
Thermal TreatmentNominal Temperature
(°C)
Time
(min)
Targeted Lethality, Fo
min
Delivered Lethality, Fo
min
Cook Value
min
Co/Fo Ratio
Minimal lethality110603–53.4 ± 0.16120 ± 1.5835.1
110903–54.4 ± 0.12186 ± 1.6142.3
Moderate lethality 1101205–105.4 ± 0.22220 ± 2.8840.7
115305–107.3 ± 0.5744 ± 0.096.0
120155–109.2 ± 0.0684 ± 2.069.1
Severe lethality1156010–2013 ± 0.77158 ± 15612.1
1159010–2020 ± 0.17264 ± 0.6413.2
1203010–2018 ± 0.2195 ± 0.875.2
1204510–2023 ± 0.56153 ± 0.066.7
Cooking
(boiling water bath)
10010<0.50.08 ± 0.01~10125
10020<0.50.15 ± 0.01~20133
10030<0.50.23± 0.03~30130
10040<0.50.31± 0.05~40111
10050<0.50.36± 0.05~50138
10060<0.50.48± 0.08~60120
Table 2. IR of soy samples processed at different intensities and conventional thermal conditions, as determined via ELISA analysis.
Type of ProcessingNominal Temperature
(°C)
Time
(min)
Allergen Concentration Based on IR
(ppb)
Percentage Reduction in soy IR
(%) (Log Reduction)
Unprocessed soy slurry 333 × 103 ± 1.12 a100
Minimal lethality11060123 ± 0.18 c99.96 (3.42 ± 0.01)
11090116 ± 0.16 d99.97 (3.46 ± 0.02)
Moderate lethality11012071.8 ± 0.99 ef99.98 (3.67 ± 0.01)
11530144 ± 0.11 b99.96 (3.36 ± 0.02)
12015124 ± 0.76 cd99.96 (3.42 ± 0.01)
Severe lethality1156050.7 ± 0.52 gh99.98 (3.82 ± 0.02)
1159023.6 ± 0.34 i99.99 (4.15 ± 0.01)
1203089 ± 0.14 e99.97 (3.57 ± 0.02)
1204561.1 ± 0.06 g99.98 (3.74 ± 0.02)
Normal cooking10010123 × 102 ±1.63 A96.30 (1.43 ± 0.01)
20120 × 102 ±2.01 AB96.39 (1.44 ± 0.02)
30112 × 102 ±1.65 C96.63 (1.47 ± 0.01)
40109 × 102 ±1.72 D96.73 (1.48 ± 0.01)
50104 × 102 ±1.23 DE96.88 (1.50 ± 0.02)
60990 × 101 ±1.01 F97.02 (1.53 ± 0.01)
Values are presented in means ± SD (n = 3). Lowercase letters represent samples processed at intense thermal processing conditions. Uppercase letters represent samples processed in normal conventional cooking. Values with different superscripts are significantly different (p < 0.05).
Table 3. Nominal and observed values of processing time and temperatures of soy slurry (5%) and the come-up times associated with different thermal conditions.
Nominal Temperature
(°C)
Nominal Time
(min)
Come-Up Time
(min)
Cook Time
(min)
Cook Temperature
(°C)
1106016.8 ± 2.1959.5 ± 0.28109.6 ± 0.07
9015.9 ± 0.7889.7 ± 0.14109.6 ± 0.14
12016.4 ± 1.48119.7 ± 0.21109.7 ± 0.07
11530182 ± 3.3229.7 ± 0.21114.8 ± 0.07
6016.9 ± 0.5759.2 ± 0.42114.6 ± 0.14
9018.8 ± 1.9889.9 ± 0.07114.8 ± 0.21
1201518.8 ± 2.0514.8 ± 0.14119.7 ± 0.21
3016.4 ± 0.7829.7 ± 0.14119.6 ± 0.14
4515.2 ± 0.7144.7 ± 0.28119.7 ± 0.21
Table 4. L*, a* and b* values of soy slurry samples treated at different processing conditions.
Temperature
(°C)
Time
(min)
L * a * b * ∆EApparent Viscosity
(cP)
Fresh-37.63± 0.250.32 ±0.011.19 ±0.05-4.48 ± 0.01
1106011.65 ±0.21−0.53 ±0.025.18 ±0.1125.1 ± 0.03 bc3.27 ± 0.03 DE
9012.26 ±0.21−0.61 ±0.016.12 ±0.0325.9 ± 0.43 b3.83 ± 0.01 D
12013.15± 0.22−0.65 ±0.016.59 ±0.0526.3 ± 0.04 a3.89 ± 0.01 D
1153020.53± 0.28−0.25 ±0.063.00 ±0.0121.2 ± 0.23 b4.08 ± 0.01 CD
6016.65± 0.21−0.43 ±0.023.19 ±0.0321.1 ± 0.04 b7.18 ± 0.01 B
9016.71 ±0.01−0.34 ±0.034.31 ±0.0317.2 ± 0.03 d8.47 ± 0.03 A
1201533.11± 0.110.21 ±0.021.41 ±0.069.52 ± 0.49 e4.12 ± 0.01 CD
3030.88± 0.080.14 ±0.021.95 ±0.086.80 ± 0.17 ef4.33 ± 0.01 C
4528.27± 0.26−0.32 ±0.022.82 ±0.054.52 ± 0.36 f4.06 ± 0.01 CD
Values are presented in means ± SD (n = 3). Lowercase represents ∆E values. Uppercase represents viscosity values. Values with different superscripts are significantly different (p < 0.05).
Disclaimer/Publisher’s Note: The statements, opinions and data contained in all publications are solely those of the individual author(s) and contributor(s) and not of MDPI and/or the editor(s). MDPI and/or the editor(s) disclaim responsibility for any injury to people or property resulting from any ideas, methods, instructions or products referred to in the content.

