Abstract
In order to find out the root cause of cross bearer welds’ cracks in general-purpose gondola cars, the relationship between asymmetric structure and stress distribution is studied in this paper. Firstly, the concept of asymmetry coefficient and stress distribution cluster is proposed, and the asymmetric coefficients’ calculation methods of independent and dependent variables are given, respectively, in two-dimensional space. Secondly, according to the different positions of side column 1 and side column 2, 30 local models are established, the cross bearer weld stresses are extracted after finite element simulation, and the stress distribution clusters of cross bearer weld stresses are formed. Finally, the asymmetry coefficients of the side columns are calculated, and the correlation between the positions of the side columns and the weld stresses is studied using the methods of Pearson correlation coefficient and complex correlation coefficient. The results show that the correlation between the stress of cross bearer weld 2 and the positions of the side columns is much higher than that between the stress of cross bearer weld 1 and the positions of the side columns. Meanwhile, it shows that the method presented in this paper is feasible and effective for the analysis and research of asymmetric structures. These combined with the calculation method of the correlation coefficient.
1. Introduction
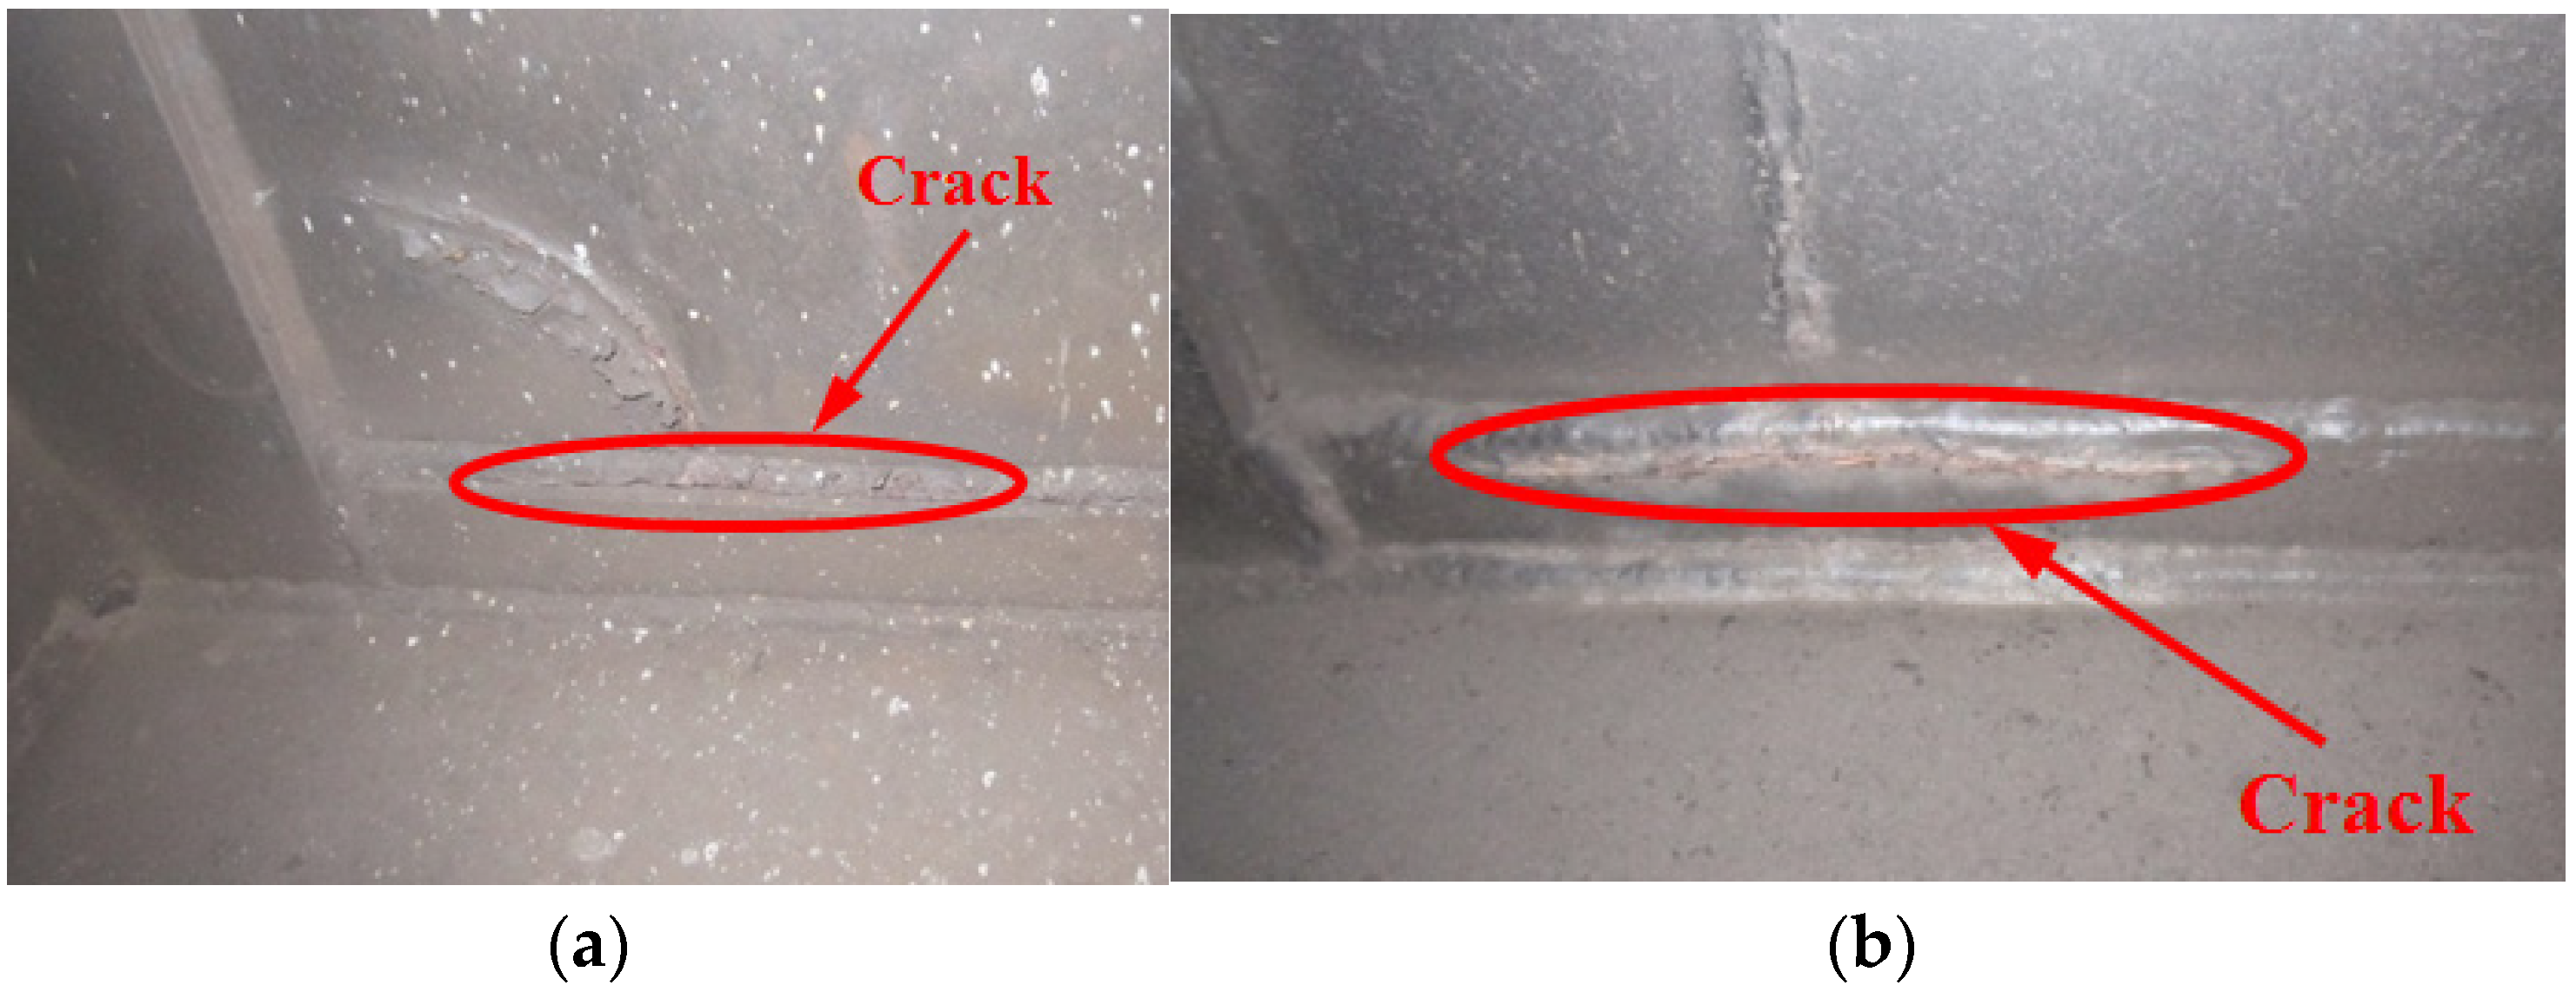
At present, the total number of railway wagons has exceeded 900,000 in China. All types of general-purpose gondola car, which have been an important part of railway transportation equipment, account for more than 46% of the wagons’ total number [1]. Because loading conditions and operating conditions are limited, the local structure of the general-purpose gondola car body is asymmetrical, which leads to stiffness mutations at the local structure. Meanwhile, fatigue cracks always appeared at the position of welded joints with stiffness mutation, and their lives were much shorter than the design life. The most typical example is the cracks that appear on the 70t and 80t general-purpose gondola car body, which is shown in Figure 1. The root cause of the crack here is that the centers of the side column, interior reinforcement and cross bearer cannot be consistent, which leads to high stiffness mutation in the local structure. Therefore, it is necessary to research the correlation between asymmetric structure and stress distribution of key position, which can provide reference for the structural design of wagon body.
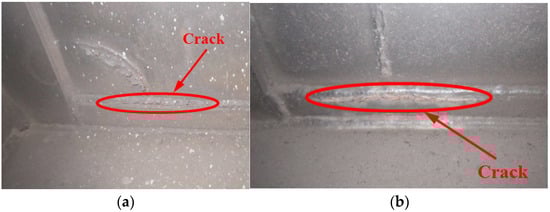
Figure 1.
(a) The crack on cross bearer weld of 70t gondola car body; (b) The crack on cross bearer weld of 80t gondola car body.
At present, scholars have mainly studied the structural asymmetry in the fields of towers, bridges, composite materials, etc. [2,3,4,5], and there are only several scholars who have researched the structural asymmetry of ships, buses, and other mechanical structures [6,7,8]. The methods used in these studies can be mainly summarized as follows: finite element simulation is used to analyze and evaluate the influence of asymmetric structure on the stress, stiffness, frequency, etc. [9,10,11,12,13], and the Pearson correlation coefficient, partial correlation coefficient, and multiple correlation coefficient are often used to measure the correlation of simulation or experimental data [14,15,16,17]. At present, the research on railway wagon bodies mainly focuses on stiffness, strength, stability, fatigue, etc. [18,19,20]. However, the research on the relationship between structural asymmetry and key weld stress distribution of gondola car body is almost blank. On the basis of previous research [21], a comprehensive, systematic and accurate study has been completed in this paper. In addition, an 80t general gondola is currently the most advanced general gondola, and cracks appear at the large cross beam in the process of application, and so it is taken as the research object in this paper.
In this paper, the asymmetric coefficient is systematically studied and given appropriate calculation methods. The cross bearer welds’ stress distribution of 80t gondola car body is analyzed by finite element simulation, and the stresses of the key position are extracted. Finally, the asymmetric coefficients of the side column 1 and the side column 2 are, respectively, calculated, and the correlation between the position of the side columns and the stresses was studied by Pearson correlation coefficient and multiple correlation coefficient.
2. Theoretical Background
2.1. Definition of Asymmetry Coefficient
The asymmetric coefficient calculation method of monotonically increasing or decreasing variables is different from that of variables with multiple extreme values in a fixed interval. In order to be more universal, this study gives the calculation methods of asymmetric coefficient under different conditions.
2.1.1. Asymmetry Coefficient of Independent Variable
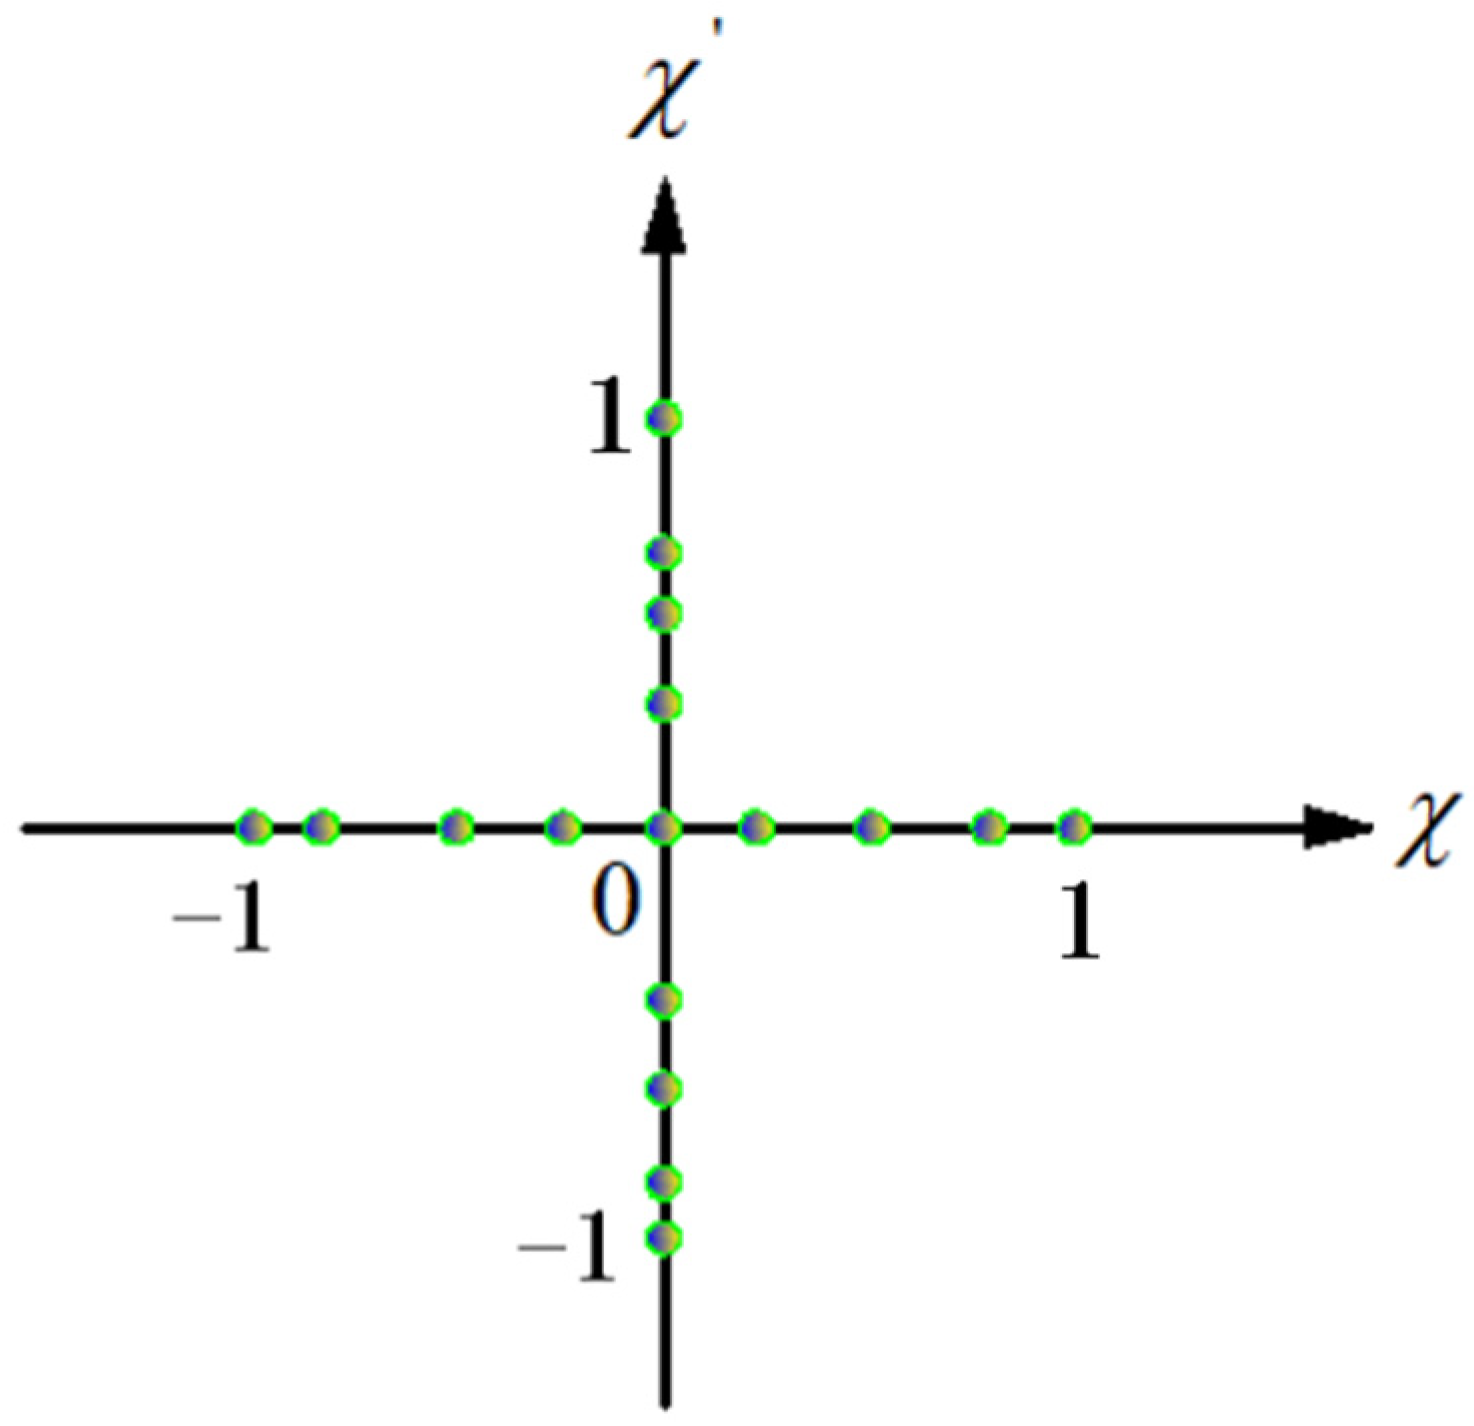
When monotonically increasing or monotonically decreasing independent variables, any point on the coordinate axis can be transformed into values between [−1, 1]. Two-dimensional space can be taken as an example in this paper. In such an instance, the coordinate origin is taken as the symmetry center, and the asymmetry coefficient is used to evaluate the symmetry degree of the independent variable, as shown in Figure 2. The calculation methods of and are similar, and the calculation method of the asymmetry coefficient is as follows:
where is the i-th independent variable; is the center value between and ; is asymmetry coefficient of .

Figure 2.
The schematic diagrams of independent variables distribution on the coordinate axis.
This method can be applied to calculate the asymmetry coefficient of independent variables such as distance, length and volume, etc. In special cases, researchers can specify the center of symmetry.
2.1.2. Asymmetry Coefficient of Dependent Variable
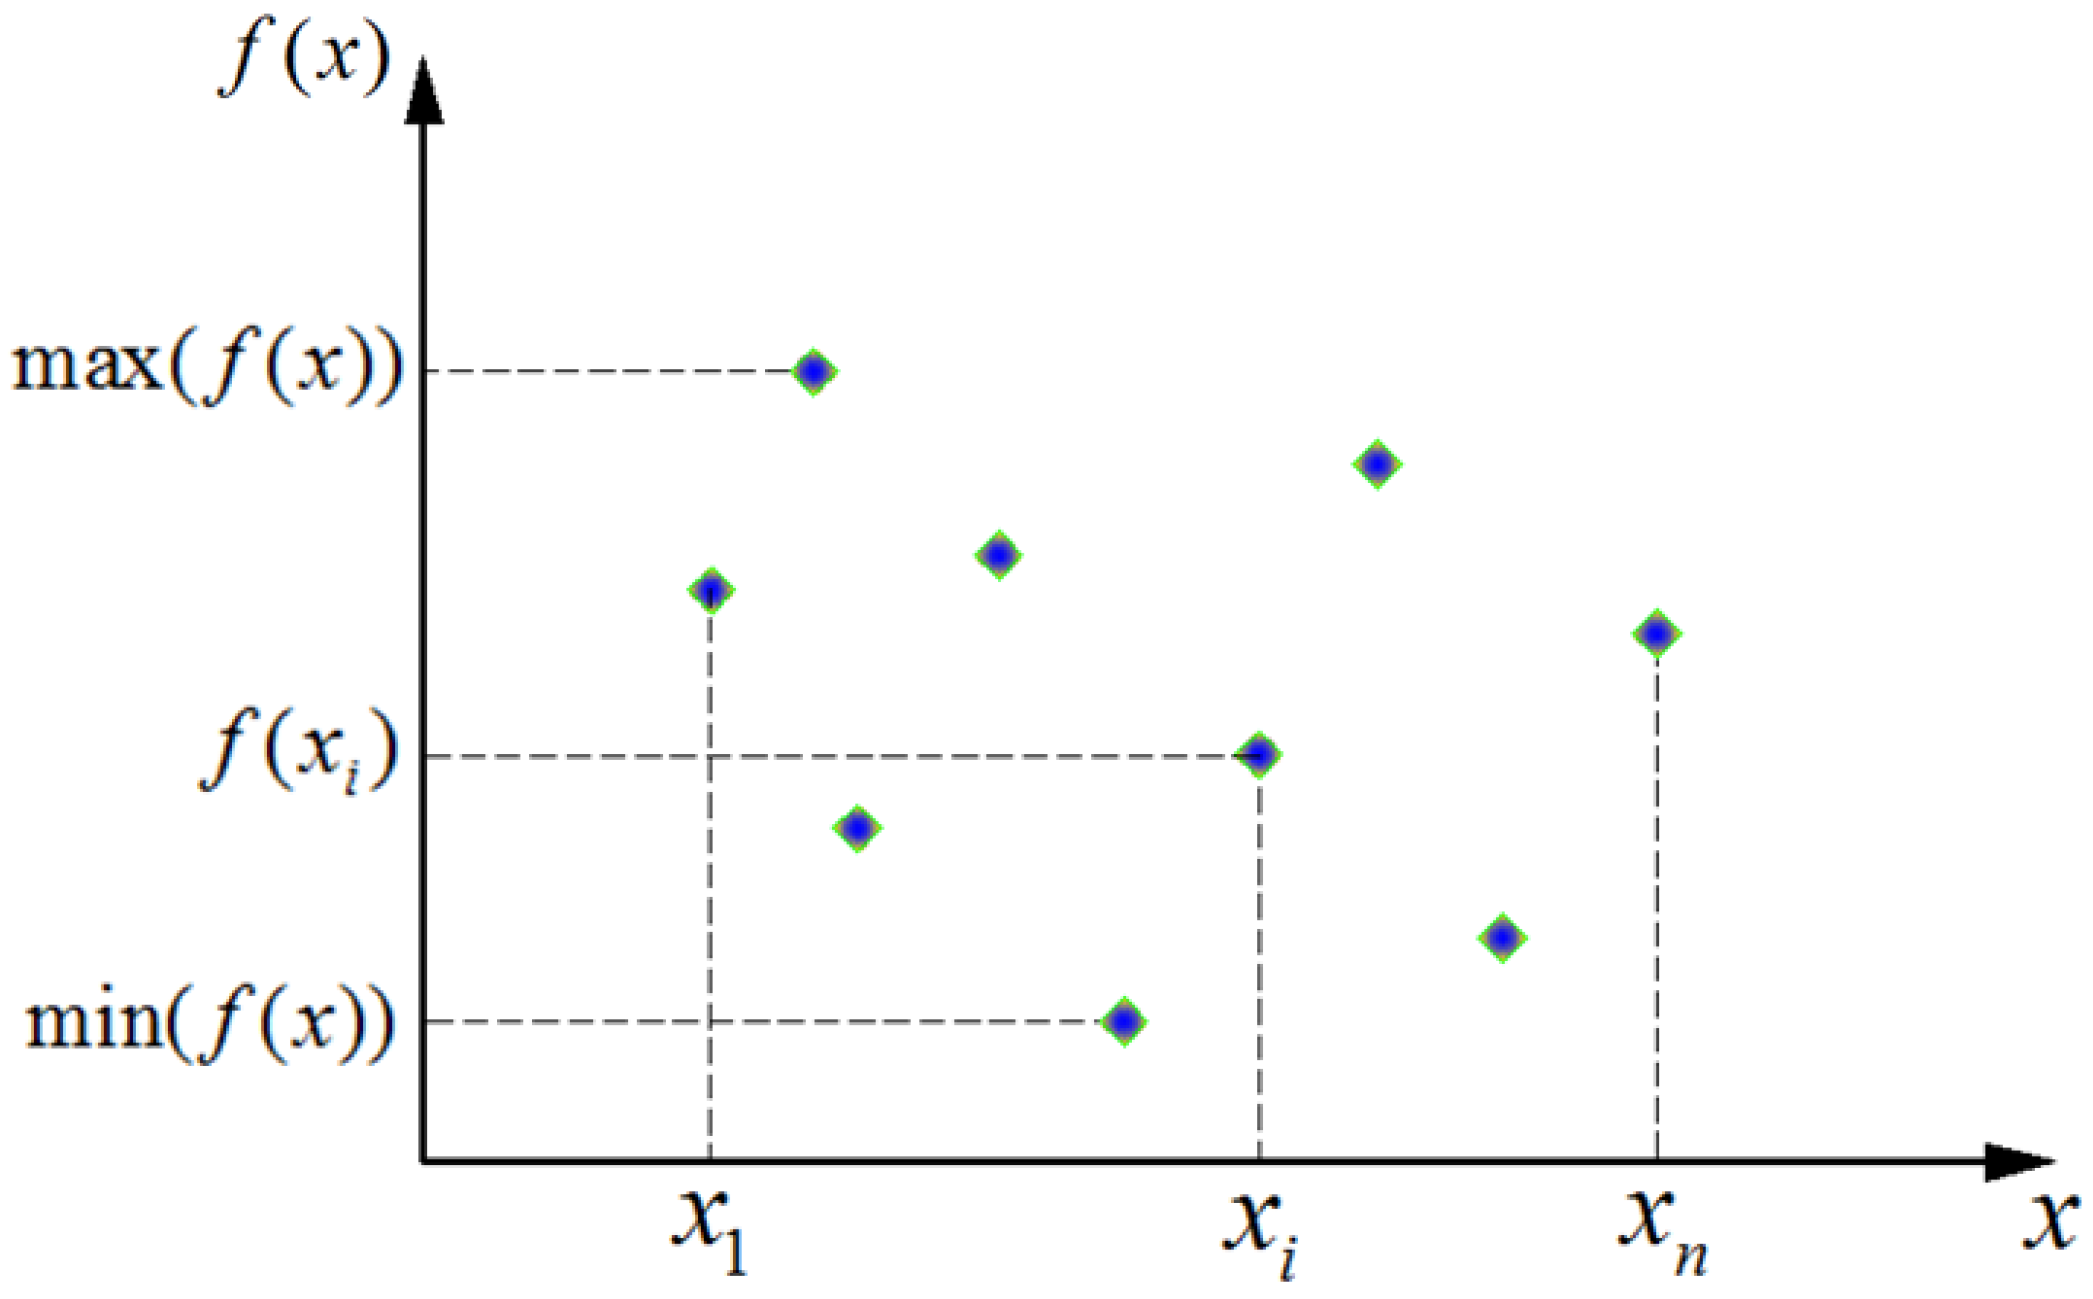
Generally speaking, for the dependent variable or random function, the value of each function is not completely distributed on the coordinate axis in the space. With the two-dimensional space taken as an example, the schematic diagrams of dependent variables distribution is shown in Figure 3.
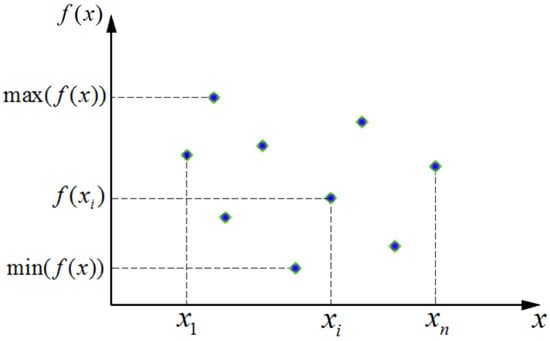
Figure 3.
The schematic diagrams of dependent variables distribution in two-dimensional space.
The calculation formula for the central value of the dependent variable is:
where is i-th dependent variable.
The calculation method of the asymmetry coefficient is as follows:
This method can be applied to calculate the asymmetry coefficient of dependent variables such as stress, stiffness and energy, etc. In special cases, researchers can also specify the center of symmetry.
2.2. Pearson Correlation Coefficient
Pearson correlation coefficient is suitable for measuring the correlation between two numerical variables [22]. Assuming that the two random variables are Y and V, then the correlation coefficient of the two variables is:
where is the covariance of the two variables; and are the variances of Y and V, respectively.
In fact, the population correlation coefficient is generally unknown and needs to be estimated with the sample correlation coefficient. Meanwhile, it can be stated statistically that the sample correlation coefficient is a consistent estimator of the population correlation coefficient. Assuming that and are the samples of Y and V, then the sample correlation coefficient is:
where and are the mean of the two samples, respectively; n is the number of samples.
In general, when explaining the degree of correlation between variables, according to the correlation coefficient, the degree of correlation can be divided into four classifications, as shown in Table 1.

Table 1.
The classification table of correlation degree.
2.3. Multiple Correlation Coefficient
The multiple correlation coefficient is suitable for measuring the correlation between variable z and a set of variables [23], and the calculation process is as follows.
Step 1: is subjected to linear regression, and the regression equation can be written as
where , and are constants, and m is the number of variables.
Step 2: According to the calculation method of Pearson correlation coefficient, the calculation formula of the multiple correlation coefficient is
3. Finite Element Analysis of 80t Gondola Car Body
3.1. The Structure of Car Body
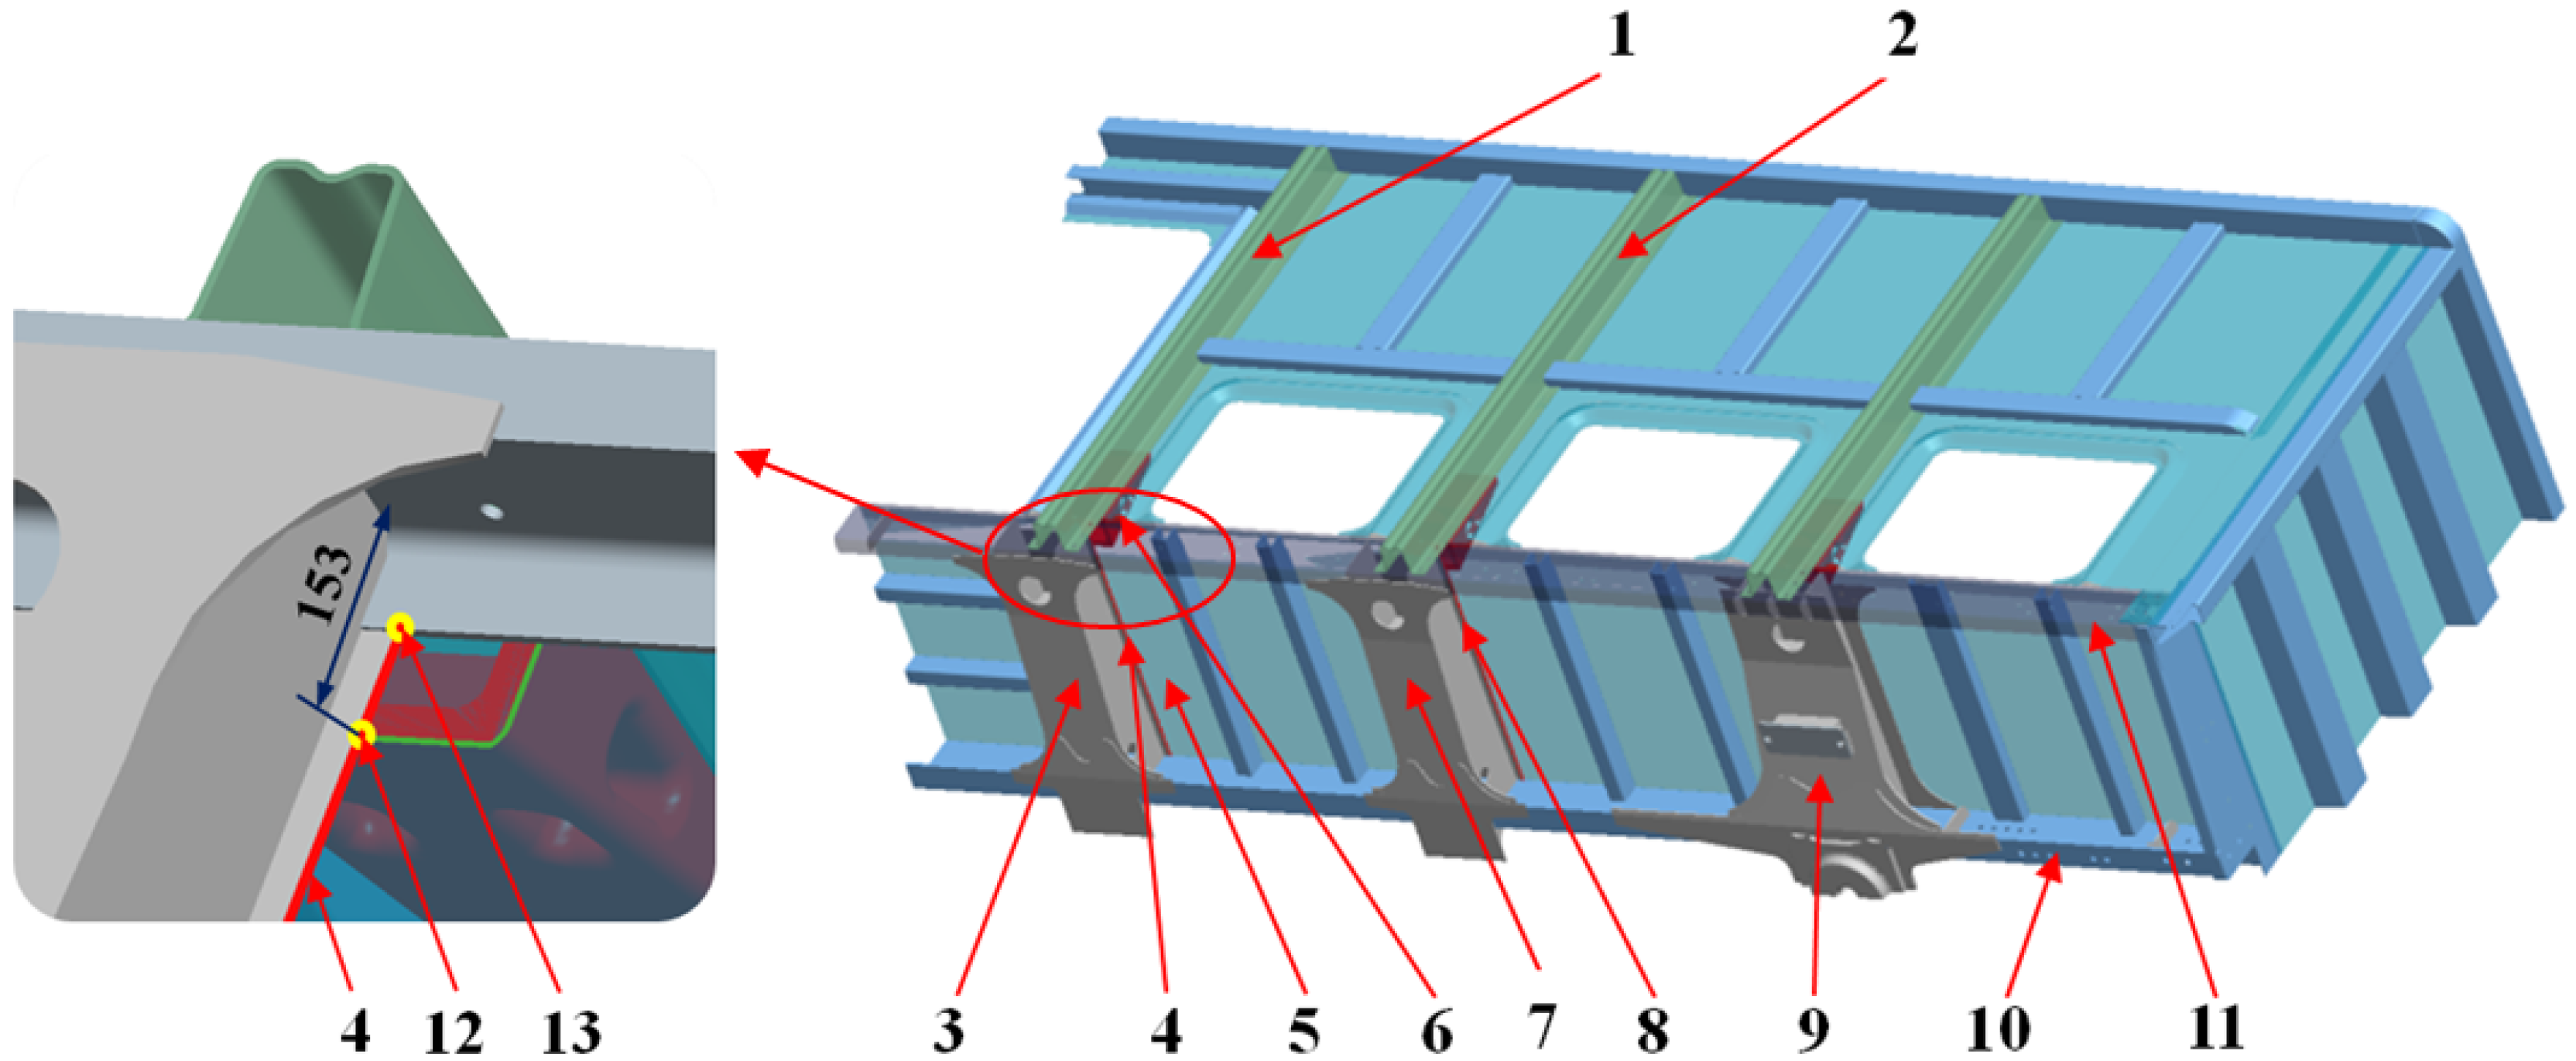
The 80t gondola car body is an all-steel welded structure, which is shown in Figure 4, and the literature [24] gives an introduction to its structure in detail. In order to facilitate the description, cross bearer 1 and side column 1 are defined, and these are associated with cross bearer weld 1. Then, cross bearer 2 and side column 2 are defined, which are associated with cross bearer weld 2. For ease of expression, “cross bearer weld 1” is abbreviated as “weld 1”; “cross bearer weld 2” is abbreviated as “weld 2”.
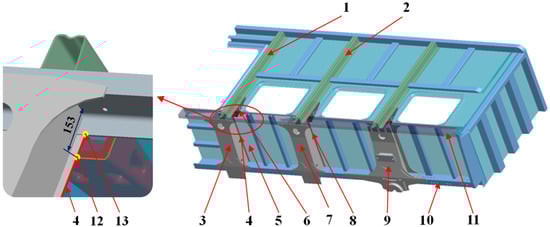
Figure 4.
The structure of 80t gondola car body: 1. side column 1; 2. side column 2; 3. cross bearer 1; 4. cross bearer weld 1; 5. floor; 6. interior reinforcement; 7. cross bearer 2; 8. cross bearer weld 2; 9. bolster beam; 10. center sill; 11. side sill; 12. intersection point between cross bearer weld 1 and interior reinforcement (The distance between the intersection point and the side sill is 153 mm); 13. starting point of cross bearer weld 1.
3.2. Finite Element Model and Loading Method
The 80t gondola car body belongs to the thin plate structure, and the shell element can be used for finite element simulation. The mesh model is refined on the local structure that connects with two cross bearer welds. The mesh model includes 1,191,025 nodes and 1,202,561 units. In addition, symmetrical constraints are imposed on the transverse and longitudinal central planes. The load and loading method can refer to TB/T1335-1996 [25]. The vertical force of the 80t gondola car body is 1053.5 kN. The longitudinal load includes stretch load and compression load. The car body is, respectively, loaded with the stretch force of 1780 kN and compression force of 1920 kN.
3.3. Simulation Result Analysis
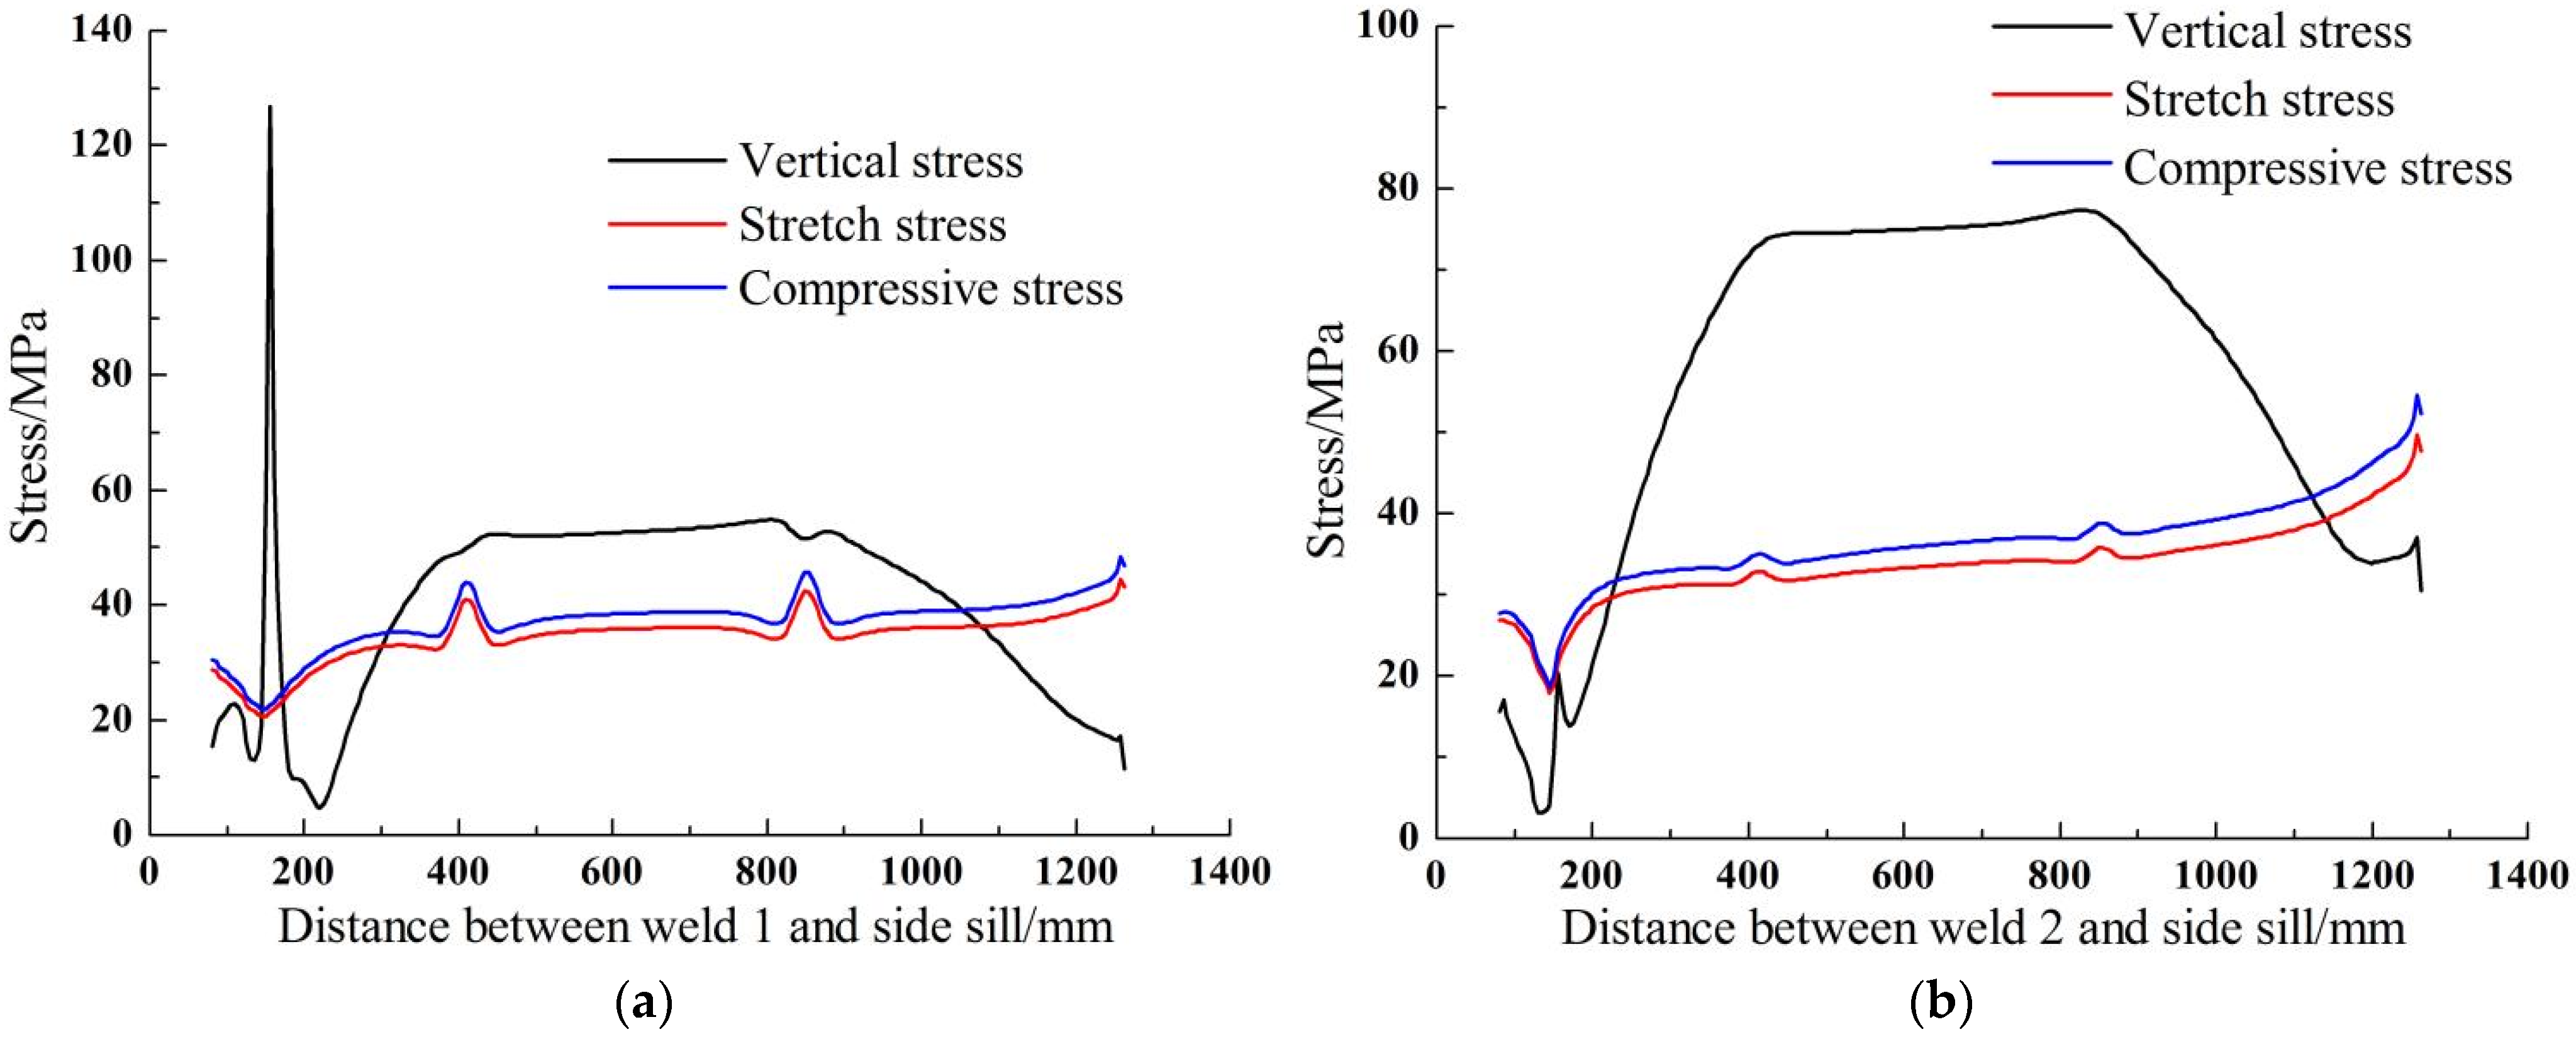
According to the simulation results, the stresses of the cross bearer welds are extracted, which start from intersection points. The stress distribution of welds under each condition is shown in Figure 5.
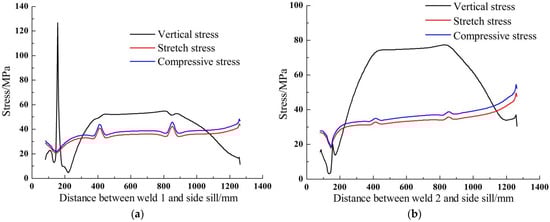
Figure 5.
The stress distributions of cross bearer welds under different load. (a) weld 1, (b) weld 2.
According to Figure 5a [24], as a whole, the stress under the vertical load is highest, and the stress gradient changes greatly. This especially appears to be the case at a pulse mutation of 153 mm. The primary cause of this phenomenon is that this position is where the inner reinforcement, floor, and cross bearer weld connect, and the structure leads to severe stiffness mutation. Under the conditions of stretch load and compressive load, the stress change trend is a gentle and upward trend, and the stress slightly fluctuates at the positions of the two partitions.
According to Figure 5b, under the vertical load, the stress is also higher than at other conditions, the stress distribution is basically symmetrical about the center of the two partitions, and the stress change trend on the outer side of the two partitions is steeper. Under the conditions of stretch load and compressive load, the stress change trend is relatively gentle and basically shows an upward direction.
4. The Stress Distribution Analysis of Cross Bearer Welds
4.1. The Definition of the Stress Distribution Curves
The positions of the cross bearers are mainly restricted by the door opening and the load condition, and their positions are generally fixed. Therefore, the influence of the local structural asymmetry of the car body on the stress distribution of the cross bearer welds is studied, which focuses on adjusting the position of the side column.
The cross bearer 1 and the side column 1 are, respectively, 930 mm and 1080 mm from the center of the car body, and the distance between the two parts is 150 mm. The cross bearer 2 and the side column 2 are, respectively, 2675 mm and 2795 mm from the center of the car body, and the distance between the two parts is 120 mm.
In this paper, the distance between the side column 1 and the side column 2 from the center of the car body is defined as d1, d2. Then the finite element models of the car body are established with 30 mm intervals of d1 and d2, and the finite element simulation is performed on each model. Meanwhile, () is defined as the stress distribution curve of the weld 1 in each model, which is shown in Table 2, and are replaced with , which are the stress distribution curve of the weld 2 in each model.
Table 2.
Definition of stress distribution curve at weld 1 in each model.
4.2. Selection of Car Body Local Model
According to Table 2, 30 finite element models of car bodies need to be established and the calculation quantity is quite large. Therefore, in order to improve the calculation efficiency, the local model of the car body is selected for correlation research. The rigidity and strength of the car body at the bolster beam are relatively large, and the structure between the bolster beam and the end wall has little effect on the stress of the cross bearer welds. Meanwhile, in order to ensure the consistency of constraints and loads, the local model of the car body is the structure between the center of bolster beam and the center of the car body, which is shown in Figure 6.
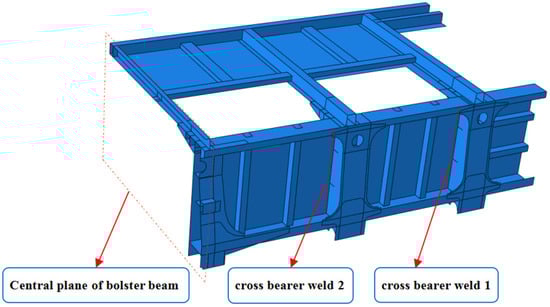
Figure 6.
The local modal of car body.
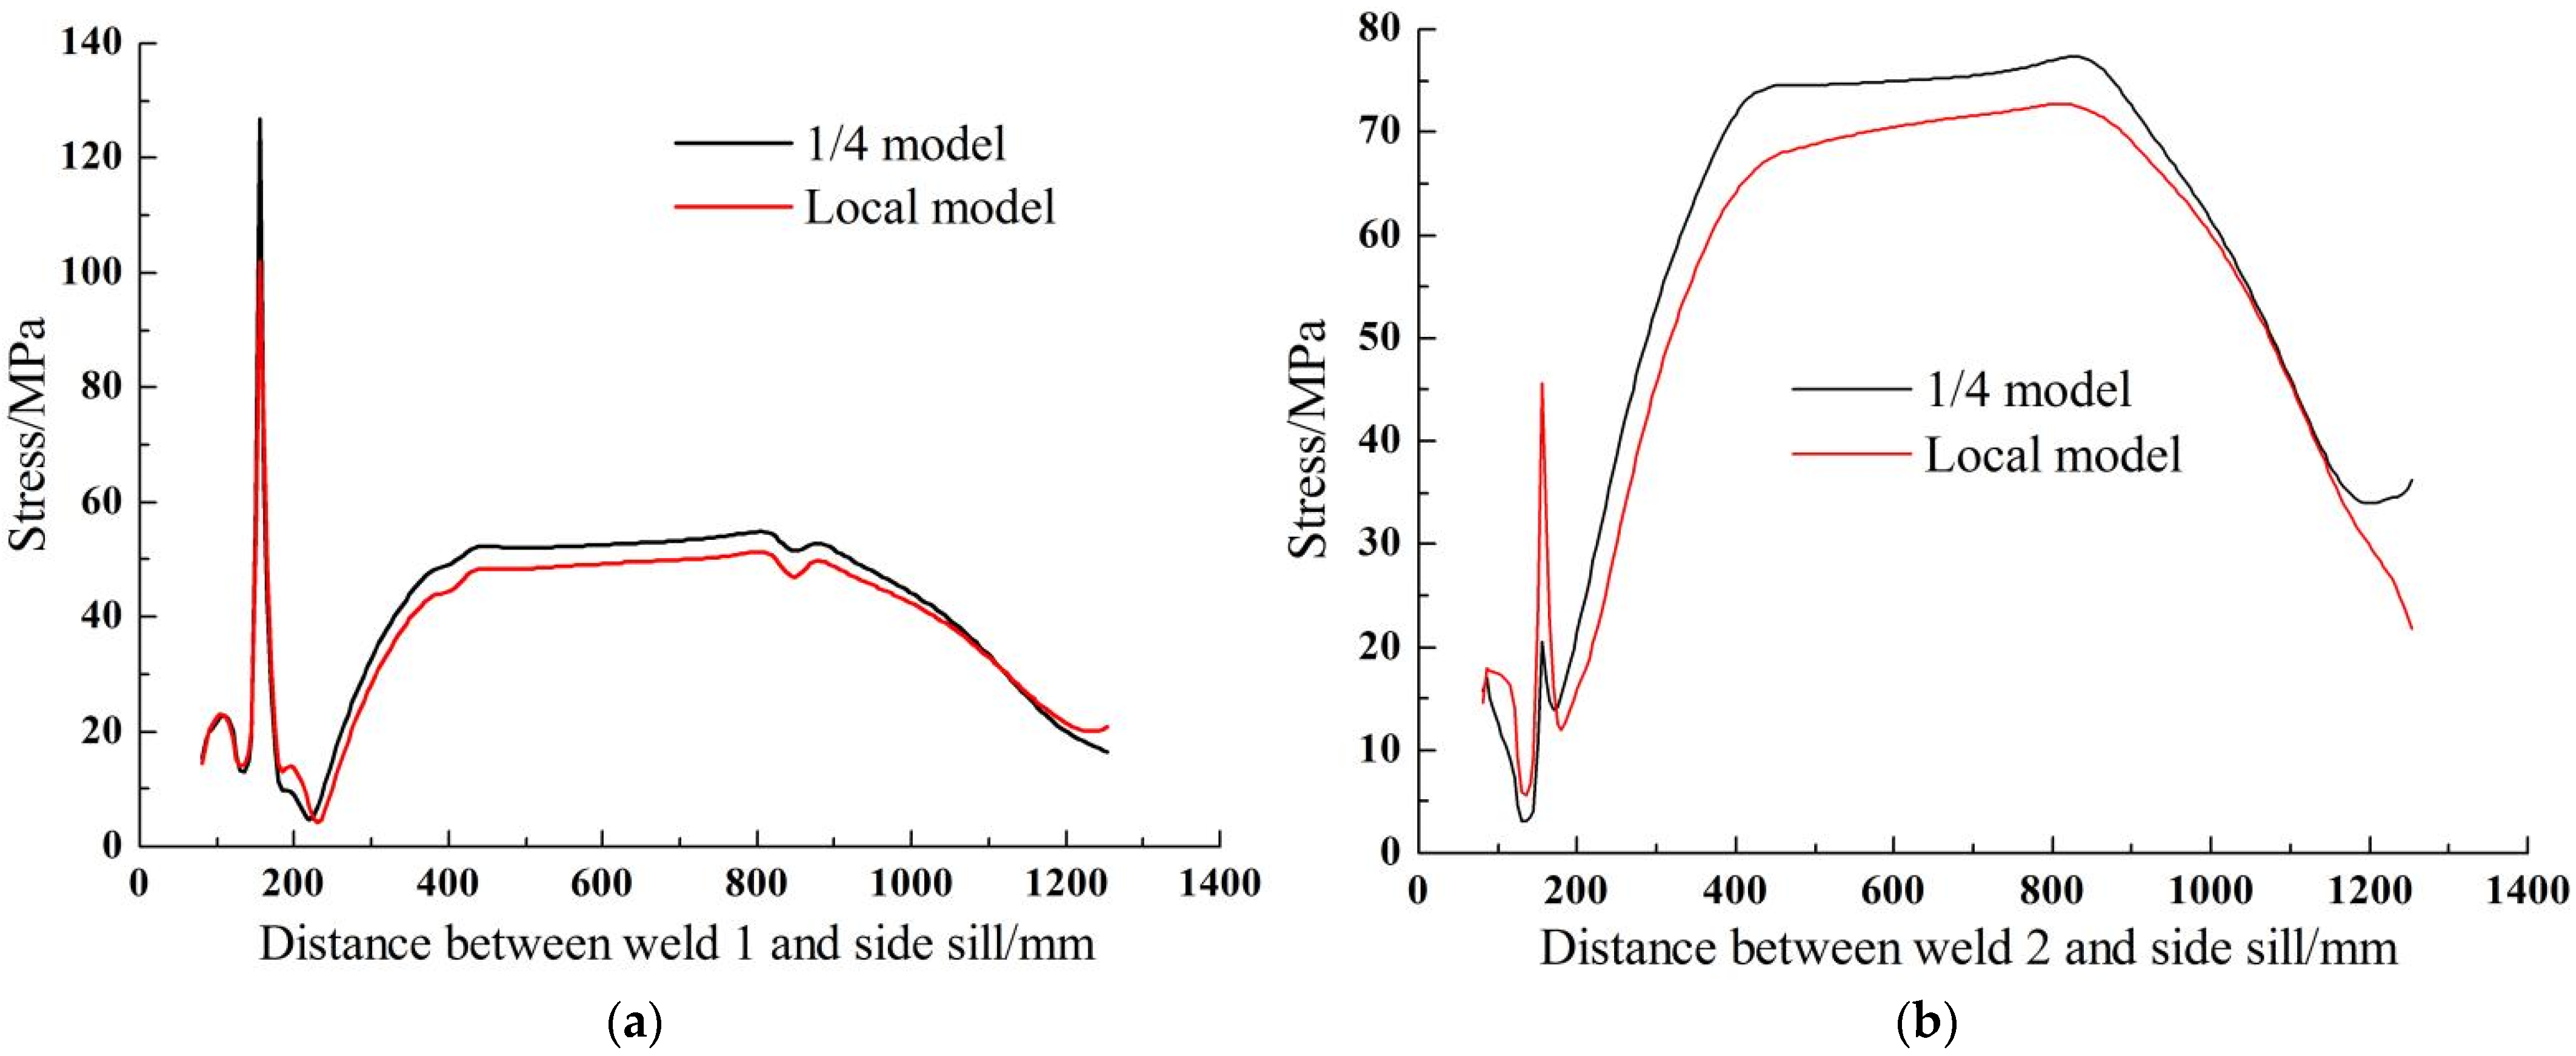
The stress distribution of the cross bearer welds in the car model and the local car model is extracted, respectively, as shown in Figure 7. On the whole, the stress change trends of the welds in the two models are basically consistent, and the stress of cross bearer welds is slightly different at 153 mm. This paper focuses on the study of the correlation between the stress of the cross bearer welds and the local structure. Compared with the stress value, it pays more attention to whether the stress distribution trend of the welds in the two models is consistent. Therefore, the local model of the car body is more reasonable and can be used for correlation analysis.
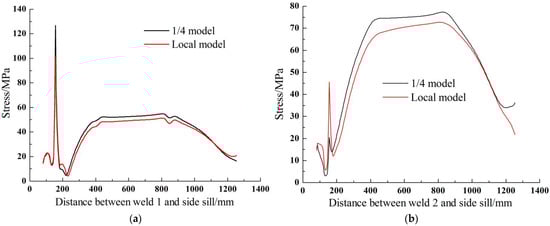
Figure 7.
Contrast graphics of stress distribution between local model and 1/4 model. (a) weld 1, (b) weld 2.
4.3. Study on Stress Distribution Clusters
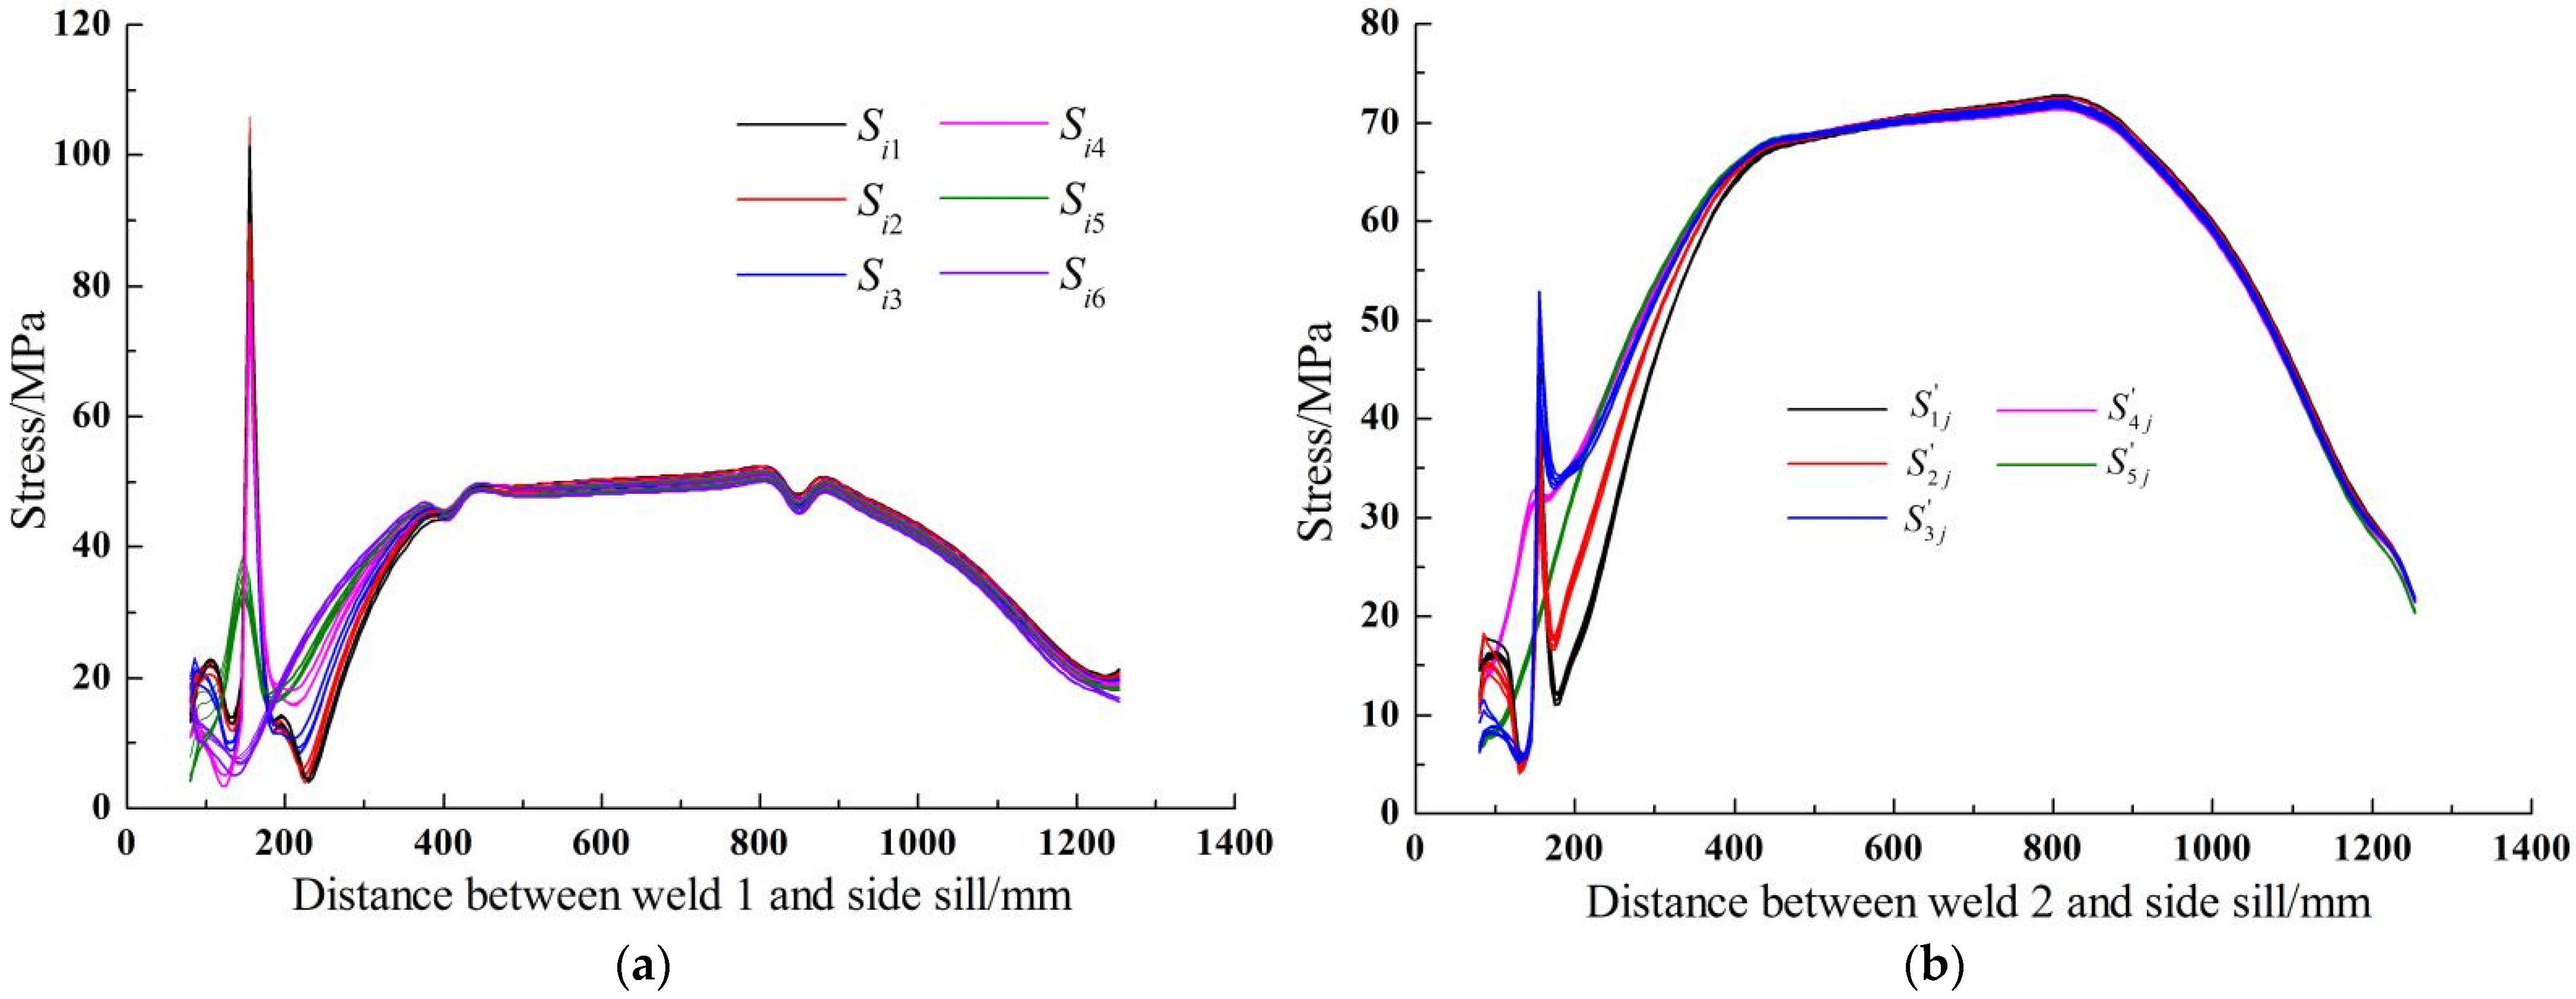
According to Table 1, 30 car body finite element models have been established and simulated. According to their finite element simulation results, 30 ()-curves are extracted; these are defined as the stress distribution clusters of weld 1(2), and are shown in Figure 8.
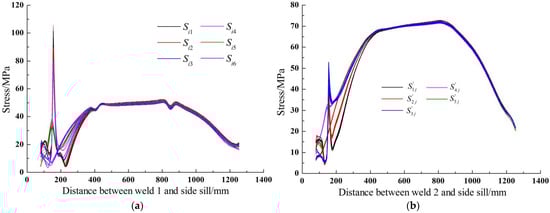
Figure 8.
The stress distribution clusters of cross bearer welds. (a) weld 1, (b) weld 2.
- (1)
- On the whole, the stress distribution clusters reflect the three stiffness mutation points, which reflect the actual structural characteristics. Meanwhile, the closer to the side sill, the greater the stress dispersion. It is shown that the position of the side column mainly affects the stress distribution of the weld near the side sill.
- (2)
- According to Figure 8a, stress mutation points of welds 1 are mainly concentrated around 150 mm from the side sill. The reasons for this phenomenon are as follows:
- (a)
- The centers of side column, interior reinforcement and cross bearer are not consistent.
- (b)
- The interior reinforcement is made of cast steel, the rigidity of the connection among the interior reinforcement, cross bearer and the floor is abruptly changed, and the distance between the outer edge of the reinforcement and the side sill is 149 mm.
- (c)
- The weld 1 is close to the center of the car body, and the side wall has a large free area at the position of the side opening door, which causes greater stress mutation.
- (3)
- According to Figure 8b, compared with the stress distribution cluster of weld 1, the stress of weld 2 is high between 400 mm and 850 mm, and it is relatively small at 153 mm. Compared with weld 1, there are two main reasons for this phenomenon: the center difference of side column, interior reinforcement and cross bearer is small; the weld 2 is far away from the center of the car body.
4.4. Stress Extraction
According to Figure 8, the adjustment of the side column position has a great impact on the weld stress distribution close to the side sill, and has little impact on the weld stress when the distance is greater than 410 mm. Meanwhile, the weld stress in each model has the largest stress mutation at the intersection point (which is 153 mm from the side sill), and the stress dispersion is also large. Therefore, this paper focuses on extracting the stress value at 153 mm from the side sill, and analyzing the influence of local structural asymmetry on the stress at this point. The extracted stress is shown in Table 3.
Table 3.
The stress value at intersection point (MPa).
4.5. Stress Analysis at Intersection Point
According to Table 3, the following conclusions can be drawn:
- (1)
- The maximum stress of weld 1 is 105.90 MPa, the minimum is only 7.85 MPa, and the difference is about 98 MPa; the maximum stress of weld 2 is 52.92 MPa, the minimum is 19.49 MPa, and the difference is about 33 MPa. It can be seen that the minimum stresses of welds appear when the interior reinforcement, side column, and cross bearer are completely symmetrical, which shows that the structural symmetry has a great influence on the stress.
- (2)
- In order to further study the distribution law of weld 1 at the intersection point, according to the data of weld 1 in Table 3, taking d1 as the x axis, d2 as the y axis, and the stress as the z axis, drawing a three-dimensional diagram of the stress distribution of equal height, which is shown in Figure 9a. It can be seen that d1 has a greater influence on the stress, and d2 has a smaller influence on the stress. Therefore, d2 can be used as the horizontal axis, and the stress value can be used as the vertical axis, to draw Figure 9b.
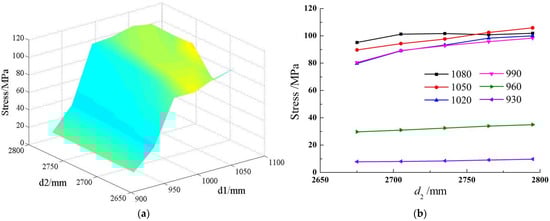 Figure 9. The interior reinforcement nodal stress graphics of weld 1. (a) Three-dimensional graphic, (b) Two-dimensional graphic.
According to Figure 9b, when d1 is 930 mm and 960 mm, the stress is significantly lower, especially at 930 mm. The reason is that when the centers of the interior reinforcement, side column 1 and cross bearer 1 are completely consistent, there is no intersection between the interior reinforcement and weld 1, which is the fundamental reason for the minimum stress. However, when d1 is 990 mm, 1020 mm, 1050 mm and 1080 mm, the stresses under the four conditions are similar and larger. The reason is that the four conditions have caused stiffness mutations due to the intersection of the interior reinforcement and weld 1. This shows that whether the interior reinforcement intersects with the weld is the fundamental reason for affecting the stress.
The stress analysis of weld 2 refers to the weld 1, according to the data of weld 2 in Table 3, taking d1 as the x axis, d2 as the y axis, and the stress as the z axis, drawing a three-dimensional diagram of the stress distribution of equal height, which is shown in Figure 10a. It can be seen that d1 has a smaller influence on the stress, and d2 has a greater influence on the stress. Therefore, d1 can be used as the horizontal axis, and the stress value can be used as the vertical axis, to make Figure 10b.
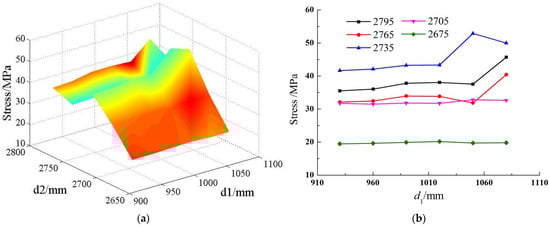
Figure 10.
The interior reinforcement nodal stress graphics of weld 2. (a) Three-dimensional graphic; (b) Two-dimensional graphic.
According to Figure 10b, when d2 is 2675 mm, the stress is significantly lower. The reason for this is that the centers of the interior reinforcement, side column 2 and cross bearer 2 are completely consistent. However, the maximum stress does not occur at 2795 mm, but at 2735 mm. The reason for this is that the difference between the weld 2 and the elevation of inner reinforcement is only 10 mm, which leads to a large stiffness mutation at the position.
5. Study on the Correlation between Cross Bearer Welds and Stress
5.1. Asymmetry Coefficient Calculation
According to the data of Table 3, the d1 and d2 are converted into asymmetric coefficient χij by Equation (1), respectively; the stresses are converted into asymmetric coefficient γij by Equation (3). Then the data in Table 3 can be represented by the parameters in Table 4.
Table 4.
Definition of stress distribution curve at weld 1 in each model.
Due to the position of cross bearers and the limitation of the space structure of the side door, when calculating the asymmetry coefficient, 930 mm is used as the center of side column 1, and 2675 mm is used as the center of side column 2. Therefore, χij is greater than zero, and the asymmetry coefficient values are shown in Table 5.
Table 5.
The correlation of side column 1.
5.2. Correlation Analysis Based on Pearson Correlation Coefficient
According to the data in Table 5, the correlations between the weld stress and the position of the side column 1 and side column 2 were calculated using the Pearson correlation coefficient calculation method, and the results are shown in Table 5 and Table 6. The conclusions of that can be summarized as following:
Table 6.
The correlation of side column 2.
- (1)
- On the whole, the stress of the weld 1 has a better correlation with the positions of the two side columns. Meanwhile, according to the stress distribution cluster of weld 1, weld 1 has a pulsed stress mutation at the interior reinforcement, which leads to a greatly reduced fatigue life of the weld 1 at this location. Therefore, when designing the car body structure, we must pay attention to the placement of the two side columns.
- (2)
- According to the data in Table 5, when the side column 2 is at different positions, the position of the side column 1 shows good correlation with the stresses of two welds. Most of the correlation coefficients are greater than 0.8, which is highly correlated.
- (3)
- According to the data in Table 6, when the side column 1 is at different positions, the position of the side column 2 shows excellent correlation with the stresses of two weld 1, the correlation coefficient is basically above 0.9, which is highly correlated. However, the correlation between the position of the side column 2 and the stress of the weld 2 is slightly worse.
5.3. Correlation Analysis Based on Multiple Correlation Coefficient
χ1 and χ2 in Table 5 are used as a set of variables, and stress is used as a variable y. This is substituted into Formula (7), from which it can be obtained that the multiple correlation coefficient between the stress of weld 1 and the position of side column 1 and side column 2 is 0.89. Similarly, according to the data of Table 6, the multiple correlation coefficient of the stress of weld 2 and the position of side column 1 and side column 2 is 0.66. This calculation result can show that the stress of weld 1 has a high correlation with the position of the side columns, while the stress of weld 2 has a slightly worse correlation with the position of the side columns.
6. Conclusions
- (a)
- In this paper, two concepts and one calculation method are proposed. The two concepts are asymmetric coefficient and stress distribution cluster. The one calculation method is the asymmetric coefficient calculation method. When the parameters are monotonically increasing or monotonically decreasing on the coordinate axis, asymmetry coefficient of independent variable has been given; when the parameters are in two-dimensional space, asymmetry coefficient of dependent variable is been systematically given.
- (b)
- 30 local models of vehicle body are established through the adjustment of the positions of side column 1 and side column 2. According to the finite element analysis results, the stress distribution clusters of weld 1 and weld 2 are formed, respectively. It can be clearly seen that the adjustment of the position of side column 1 and side column 2 has little effect on the position of the maximum stress point of the weld. The maximum stress basically occurs in three positions: interior reinforcement, partition1 and partition 2.
- (c)
- The correlations between the asymmetry coefficient of weld stress and the asymmetry coefficient of side column position are analyzed by the Pearson correlation coefficient and complex correlation coefficient, respectively. It can be seen from the analysis results that the stress of weld 1 is highly correlated with the position of two side columns 1 and 2, and that the stress of inner reinforcement seat node of weld 2 is moderately correlated with the position of side column 1 and side column 2.
- (d)
- This study can not only provide an important basis for the structural optimization of 80t gondola car body, but it also provides an effective analytical method for asymmetric structure design and optimization.
Author Contributions
Conceptualization, all authors; Software, X.P.; Data curation, Z.G.; Writing—original draft, W.L.; Writing—review & editing, L.Z. and C.B. All authors have read and agreed to the published version of the manuscript.
Funding
This research has been sponsored by the public technology application research of Zhejiang province, China (Grant No. LGG22E050014).
Data Availability Statement
Not applicable.
Conflicts of Interest
The authors declare no conflict of interest.
References
- Liu, W.F. Research on Fatigue Strength Evaluation and Structure Optimization of Heavy Haul General Purpose Gondola Car Body. Ph.D. Thesis, Beijing Jiaotong University, Beijing, China, 2019. [Google Scholar]
- Maurizio, G. Beams with an intermediate pier: Spectral properties, asymmetry and stability. Math. Eng. 2021, 3, 1–21. [Google Scholar]
- Wu, Z.H.; Sun, B.G.; Lou, W.J. Dynamic analysis of an asymmetry double-tower connecting building. J. Zhejiang Univ. (Eng. Sci.) 2003, 37, 560–565. [Google Scholar]
- Karayannis, C.G.; Naoum, M.C. Torsional behavior of multistory RC frame structures due to asymmetric seismic interaction. Eng. Struct. 2018, 163, 93–111. [Google Scholar] [CrossRef]
- Zaitseva, J.; Oswald, C.; Jumpertz, T.; Jenewein, S.; Wiedenmann, A.; Holland, I.B.; Schmitt, L. A structural analysis of asymmetry required for catalytic activity of an ABC-ATPase domain dimer. EMBO J. 2006, 25, 3432–3443. [Google Scholar] [CrossRef] [PubMed]
- Xie, H.; Liu, F.; Tang, H.Y.; Liu, X. Numerical study on the dynamic response of a truncated ship-hull structure under asymmetrical slamming. Mar. Struct. 2020, 72, 102767. [Google Scholar] [CrossRef]
- Li, Z.; Dou, H.S.; Lin, P.; Wei, Y.; Chen, Y.; Lin, L.; Ye, X. Design for a squirrel cage fan with double arc blade. J. Appl. Fluid Mech. 2020, 13, 881–891. [Google Scholar] [CrossRef]
- Li, T.T. Research on Asymmetric Body Understructure of Integral Bus. Master’s Thesis, Jilin University, Jilin, China, 2015. [Google Scholar]
- Wei, Z.; Cai, C.S.; Fang, P. Finite element modeling of bridges with equivalent orthotropic material method for multi-scale dynamic loads. Eng. Struct. 2013, 54, 82–93. [Google Scholar]
- Pustovoytov, D.; Pesin, A.; Biryukova, O. Finite element analysis of strain gradients in aluminium alloy sheets processed by asymmetric rolling. Procedia Manuf. 2018, 15, 129–136. [Google Scholar] [CrossRef]
- Chakraborty, A.; Mahapatra, D.R.; Gopalakrishnan, S. Finite element analysis of free vibration and wave propagation in asymmetric composite beams with structural discontinuities. Compos. Struct. 2002, 55, 23–36. [Google Scholar] [CrossRef]
- Zolochevsky, A.; Martynenko, A.; Kuehhorn, A. Structural benchmark creep and creep damage testing for finite element analysis with material tension-compression asymmetry and symmetry. Comput. Struct. 2012, 100, 27–38. [Google Scholar] [CrossRef]
- Suryawanshi, J.; Singh, G.; Msolli, S.; Jhon, M.H.; Ramamurty, U. Tension-compression asymmetry and shear strength of titanium alloys. Acta Mater. 2021, 221, 117392. [Google Scholar] [CrossRef]
- Erdem, O.; Ceyhan, E.; Varli, Y. A new correlation for bivariate time-series data. Phys. A 2014, 414, 274–284. [Google Scholar] [CrossRef]
- Mu, Y.S.; Liu, X.D.; Wang, L.D. A Pearson’s correlation coefficient based decision tree and its parallel imple-mentation. Inf. Sci. 2018, 435, 40–58. [Google Scholar] [CrossRef]
- Wu, R.L.; Wang, J.Z.; Yuan, K.H. Monte carb simulation of polychoric correlation and pearson correlation coefficient. J. Beijing Univ. Aeronaut. Astronaut. 2009, 35, 1507–1515. [Google Scholar]
- Jaeho, S.; Sungchul, Y. A new approach to machine learning model development for prediction of concrete fatigue life under uniaxial compression. Appl. Sci. 2022, 12, 9766. [Google Scholar]
- Liu, W.F.; Zhang, Y.J.; Li, N.; Wang, L. Research on stress intensity factor and fatigue crack propagation rate of the general-purpose gondola car body. Trans. Can. Soc. Mech. Eng. 2021, 45, 297–307. [Google Scholar] [CrossRef]
- Yang, G.X.; Li, S.; Fu, D. Fatigue properties of AL/AL-MG alloy laminated materials for the applications to railway tank cars. Int. J. Fatigue 2019, 122, 173–183. [Google Scholar] [CrossRef]
- Zhao, F.W. Study on Load Spectrum Test and Fatigue Strength Evaluation of Railway Freight Car Body. Ph.D. Thesis, Beijing Jiaotong University, Beijing, China, 2015. [Google Scholar]
- Liu, W.F.; Liu, Z.M.; Lin, L.; Xue, L. Study on the correlation between local asymmetric structure of C80E body and stress distribution of critical weld. J. Beijing Jiaotong Univ. 2018, 42, 83–90. [Google Scholar]
- Tang, J.Y.; He, P.; Chen, C.S. Reliability Analysis Method for Mechanical Systems Involving Failure Correlations; National Defense Industry Press: Beijing, China, 2014. [Google Scholar]
- Najarzadeh, D. A simple test for zero multiple correlation coefficient in high-dimensional normal data using random projection. Comput. Stat. Data Anal. 2020, 148, 106955. [Google Scholar] [CrossRef]
- Liu, W.F.; Zhang, Y.J.; Liu, Q.T.; Zhang, B.; Fu, Q. Structural optimization of the heavy haul wagon body based on MPSO-BP algorithm. Trans. Can. Soc. Mech. Eng. 2021, 45, 461–472. [Google Scholar] [CrossRef]
- TB/T1335; Code for Strength Design and Test Appraisal of Railway Vehicles. Chinese Standard: Beijing, China, 1996.


Disclaimer/Publisher’s Note: The statements, opinions and data contained in all publications are solely those of the individual author(s) and contributor(s) and not of MDPI and/or the editor(s). MDPI and/or the editor(s) disclaim responsibility for any injury to people or property resulting from any ideas, methods, instructions or products referred to in the content. |
© 2022 by the authors. Licensee MDPI, Basel, Switzerland. This article is an open access article distributed under the terms and conditions of the Creative Commons Attribution (CC BY) license (https://creativecommons.org/licenses/by/4.0/).