1. Introduction
When liquid flows through the valve port, the pressure difference between the two ends of the valve port increases rapidly, the flow rate accelerates sharply, and the pressure at the contraction surface of the valve port is lower than its saturated vapor pressure, causing cavitation [
1]. As bubbles move from a low-pressure location to a high-pressure area, they compress and burst, and the energy released when the bubbles burst creates noise and vibration [
2,
3,
4,
5]. Hydraulic system noise is classified as fluid noise, cavitation noise, and mechanical noise [
6], of which cavitation phenomenon generates cavitation noise [
7]. Because of its high sound level and high radiation efficiency, noise generated by cavitation bubble collapse is a key noise source for hydraulic valves [
8], and its noise creation is strongly tied to the cavitation phenomena. At the same time, because the hydraulic valve’s flow channel is tiny, the high operating differential pressure and high flow rate at the valve ports make cavitation at the valve ports inescapable. The visual observation and noise of cavitation at valve ports is currently an essential problem for deeper understanding in the field of hydraulic control [
9,
10].
Many researchers have dedicated themselves to the experimental investigation of cavitation phenomena in flow fields, i.e., the imaging of cavitation morphology [
11]. The methods used to identify cavitation presence were [
12]: Vibration measurement—the presence of cavitation in the system causes vibration of the system at frequencies of approximately 103 Hz [
13]; High-speed photography recording—researchers can photograph the evolution of cavitation morphology over time and gain numerous details about the changes in cavitation morphology over time; PIV (Particle Image Velocimetry)—inject 10~300 micron tracer particles into the flow field to calculate fluid velocity via the particles (particles in the liquid may deform the cavitation region); Tomography—tomography is a technique for recreating three-dimensional images using “projection” data obtained by monitoring the flow field from numerous angles, mostly used for three-dimensional flow field structure analysis. In the initial stages, the observation experiments of cavitation were mostly constrained by the constraints of experimental technology. Consequently, the focus was predominantly on conducting research and qualitative analysis of the macroscopic morphology of cavitation. However, when high-speed photography technology matured, researchers were able to capture the full process of cavitation’s morphological changes. The distinction between high-speed photography and other experimental approaches is that it can gather information on the full physical phenomenon of the flow field. Fu et al. [
14] used high-speed photography, noise spectral analysis, and other means of analyzing the flow field and flow phenomena at a typical valve port orifice throttling to study the vortex cavitation mechanism in the high-speed flow at the valve port and its relationship with the noise characteristics. Ji et al. [
15] suggested a planar observation method for cavitation flow in hydraulic valves and used a high-magnification microscope to capture crisp images of cavitation flow in the valves. Li [
16] and colleagues investigated the transient cavitation distribution characteristics of the flow field in the front stage of a nozzle baffle servo valve and performed experimental observations of the actual flow field distribution using high-speed photography to verify the simulation’s correctness. Cui [
17] and colleagues used high-speed photography to capture microscopic details of the dynamic changes of the vacuole from the spatio-temporal multi-dimensional perspective, laying the groundwork for future research on the time–frequency characteristics of the propeller vacuole-induced vibration noise and the uncertainty analysis of the vacuole observation. Cui and Chen [
18] used CFX software to numerically simulate the transient cavitation flow in a high-speed centrifugal pump with an induced wheel, using high-speed photography to visualize the cavitation flow evolution in the induced wheel. The numerical simulation’s cavitation characteristic curves are essentially consistent with the experimental results. Liu et al. [
19] employed high-speed photography to observe the flow field features of a bi-directional pump across varying levels of cavitation. Additionally, they evaluated the alterations in the flow field induced by cavitation by utilizing a pressure pulsation sensor. Duan et al. [
20] designed a visualized experimental setup for the cavitation phenomenon in the throttle section of a pressure-reducing valve and used high-speed photography to record the process of cavitation change with time in the throttle section under different cavitation numbers σ, providing a good experimental reference for the cavitation phenomenon. Although high-speed photography allows researchers to investigate air pockets in a new way, it also introduces new issues. In order to enhance the distinction of air pocket morphology, it is generally necessary to increase the shooting rate. However, this increase in shooting rate may lead to a decrease in image resolution and the occurrence of blurring. Because of the small amount of light, it is difficult for the lens to collect enough light in a limited time when observing the local air cavity area, and the detailed characteristics at the edge of the air cavity cannot be recorded well.
There has been a lot of research done on the noise problem with hydraulic valves. Ji et al. [
21] studied the influence of internal runner form on cavitation noise in relief valves and discovered that the main spool structure with annular grooves can effectively suppress cavitation and cavitation noise. Gao et al. [
22] investigated the cavitation flow field in ball valves and discovered that the cavitation phenomenon increases the noise level of ball valves. Du et al. [
23] investigated the cavitation noise properties of several throttle slots. Huang et al. [
24] investigated the properties of propeller vacuoles and noise, as well as the interaction between vacuoles and noise at various stages of the propeller. Jablonska et al. [
25] used experimental approaches to conduct a spectral characterization of cavitation noise. Park et al. [
26] created a theoretical model, which is an important addition to the cavitation noise theory. Kim et al. [
27] used a numerical method to investigate the problem of cavitation noise. Wu et al. [
28] offered an overview of approaches for assessing cavitation noise intensity and proposed integrating the genuine cavitation noise spectrum over the entire frequency domain to estimate total cavitation noise intensity. Jeong et al. [
29] investigated the cavitation noise for various cavitation numbers and the noise generation trend in each scenario. Park et al. [
30] used an experimental method to investigate the effect of the number of initial bubbles on the cavitation noise scale. Kang et al. [
31] investigated the noise signal properties of incipient cavitation. In general, there has been a progressive deepening of earlier research on the phenomena and mechanism of cavitation noise, encompassing theoretical investigations, practical applications, numerical simulations, and experimental analyses. In comparison to general hydrodynamic noise, cavitation flow in the throttling part is the most serious noise source in the cone valve, and there are currently relatively few research results aimed specifically at the cavitation noise generated by the rectangular throttling groove spool.
The radiation of cavitation noise in a liquid is related to the flow condition of the liquid and the volume change of cavitation bubbles, with cavitation bubble volume change directly affecting the morphology of the cavitation bubbles. The size of cavitation bubbles can thus theoretically be used to determine the trend of change in cavitation noise [
32]. Hence, there is significance in conducting experimental investigations to examine the correlation between cavitation morphology and cavitation noise.
In this paper, using comprehensive methods such as high-speed photography technology and noise spectrum analysis, the rectangular throttling groove spool internal flow field is deeply observed, giving different inlet pressure and back pressure conditions under the change rule of cavitation morphology, to understand the characteristics of the rectangular throttle groove spool cavitation noise, and the noise of the time–frequency characteristics of the relationship is revealed. This study is very useful for noise control in rectangular throttling groove spools.
2. Materials and Methods
The present study constructs a piece of experimental equipment, as depicted in
Figure 1, in order to investigate the cavitation phenomenon occurring in the rectangular throttling groove spool and its correlation with noise characteristics.
Figure 2 depicts the experimental setup, which comprises a hydraulic pump station and a visual operational platform. The hydraulic pump station provides changeable-pressure oil to the system. The visual operating platform is used to record noise levels, spectrum, and changes in cavitation morphology. The electromagnetic relief valve 4 is responsible for regulating the pressure within the system. The pilot proportional pressure-reducing valve 5 adjusts the inlet pressure of the test valve 10 to lessen pressure fluctuation at the test valve’s inlet. The hydraulic pump 2 supplies pressured oil to the system; the pressure/temperature sensors 8/9 are utilized to detect the pressure and temperature at the input of the test valve. The proportional relief valve 13 is responsible for regulating the back pressure of the system; the flow meter 6 measures the system’s flow rate; the noise meter 11 is affixed to a tripod and positioned at the same vertical level as the valve body being tested. The distance between the surface of the tested valve body and the microphone of the noise meter is 40 mm, allowing for the recording of both the noise level and spectrum. The morphological alteration of cavitation is determined through the utilization of high-speed photography. During the experiment, the high-speed camera utilized was the Revealer X213M. The high-speed photography shooting speed was configured to capture 13,600 frames per second while maintaining a resolution of 1280 × 1024. Additionally, it utilizes a microscopic magnifying lens with a magnification capacity of 14 times. Backlighting is used for the photography. To capture the instantaneous form of cavitation and avoid hazy photos, the shooting rate must be increased, necessitating high-intensity lighting. Therefore, the light source uses high-power LEDs. The test valve is composed of a substance known as polymethyl methacrylate (PMMA), which is commonly referred to as organic glass. The primary component of the experimental apparatus used for the production and examination of cavitation clouds is the transparent test valve. The structure is seen in
Figure 3a. The utilization of hydraulic pump station vibration isolation and noise reduction treatment, as seen in
Figure 3b, is implemented due to the significant noise generated by the hydraulic pump station during operation. This noise has the potential to adversely affect the precision of the test valve noise measurement.
When pure tones of equal intensity possess varying frequencies, they are subjectively regarded as having variable levels of loudness. When analyzing the loudness of a sound, taking into consideration the subjective variances in the loudness of people’s feelings, measuring devices are designed using the frequency weighting approach, and the decibel number measured by frequency weighting is referred to as the weighted sound level. In environmental noise control, one commonly employs the A-weighted sound level as an approximate measure of the effect of noise on people [
33]. The A-weighted sound level better reflects the subjective experience of the human ear on the strength of noise and is a superior evaluation method for a continuous stable noise source. As a result, the A-weighted sound level is used for noise intensity analysis in this research. The noise frequency information is not reflected in the sound level, thus noise with the same sound level but different frequencies produces diverse experiences. The human ear can detect sound frequencies ranging from 20 Hz to 20 kHz. This interval is separated into distinct frequency bands, and the noise strength of each band can be quantified to obtain the noise spectrum. The noise spectrum is measured using 1/3 octave spectrum analysis (1/3 OCT) in this article. When not powered, the piloted proportional reducing valve 5 is a normally closed valve with a closed spool. The background noise in the following measurements is taken at an inlet pressure of 3–5 MPa with the valve deactivated. This is the noise produced by the hydraulic pump station at various inlet pressures.
3. Results
Figure 4 is the cavitation phenomenon in the valve port which is recorded by high-speed photography while the inlet pressure is 4 MPa and the back pressure is 0.6 MPa. In the backlight illuminated
Figure 4, the light beam is blocked by the vapor phase; thus, the black regions represent the cavity area, while the white regions are the liquid phase. It can be seen that a noticeable cavitation phenomenon appears in the rectangular throttling groove spool.
According to the cavitation flow characteristics, the transparent area on the top of the rectangular throttling groove spool and the location of the fixed cavitation are taken as bounds. The cavitation area could be divided into three regions in
Figure 4, the nascent zone, developed zone, and collapsed zone [
11]. Cavitation originates in the center of the throttling groove, cavitation bubbles develop and increase gradually along the flow direction, and there is no visible cavitation occurrence on either edge of the nascent zone. The bubble flow positions in the nascent zone and development zones are largely consistent, but the length of the development zone is related to the back pressure. When they were formed, the fixed cavitation on the solid side wall on the right side of the throttle groove and the cavitation in the center part of the throttle groove already overlapped, causing the development zone to move to the right. Fixed cavitation is a type of unstable cavitation that appears to be stationary but is continually changing. This is because the solid sidewall pressure is close to the hydraulic fluid’s saturation vapor pressure, and cavitation is easily formed. The collapse zone swings violently, displaying a fine mist puffing state, and the volume rapidly grows. Typically, the cessation of cavitation bubbles and subsequent restoration of pressure give rise to a high-velocity jet flow, which in turn causes erosion and surface damage to hydraulic components [
34]. The noise in the valve is caused by the collapse of a large number of bubbles.
Figure 5 depicts the cavitation morphology at an inlet pressure of 3 MPa and a back pressure of 0.6–1.0 MPa. The dash line circles in the image represent the regions of “fixed cavitation”. It shows that there is no cavitation phenomenon at an inlet pressure of 3 MPa and back pressure of 1.0 MPa. The cavitation pattern at 0.9 MPa was flaky, the shaded portion became darker, and the distribution area became larger as the pressure difference increased. This indicates that as the pressure difference increases, the thickness of the cloudy cavities increases, and the number of bubbles generated increases as well; the cavities’ morphology gradually develops from flaky to cloudy, and the intensity of the cavities is enhanced as the pressure difference increases. When combined with
Figure 6a, the noise value steadily increases as the cavitation morphology changes from flaky to cloudy, indicating that noise in the rectangular throttling groove spool is closely related to cavitation. Although the cavitation morphology varies considerably with back pressure, cavitation noise varies relatively little quantitatively, with a maximum difference of only 2.4 dB. The difference in frequency between the test environment background noise and cavitation noise is more obvious in
Figure 6b, especially in the high-frequency band; they have completely different frequency characteristics, so the cavitation noise can be used to detect the cavitation state and monitor the cavitation process.
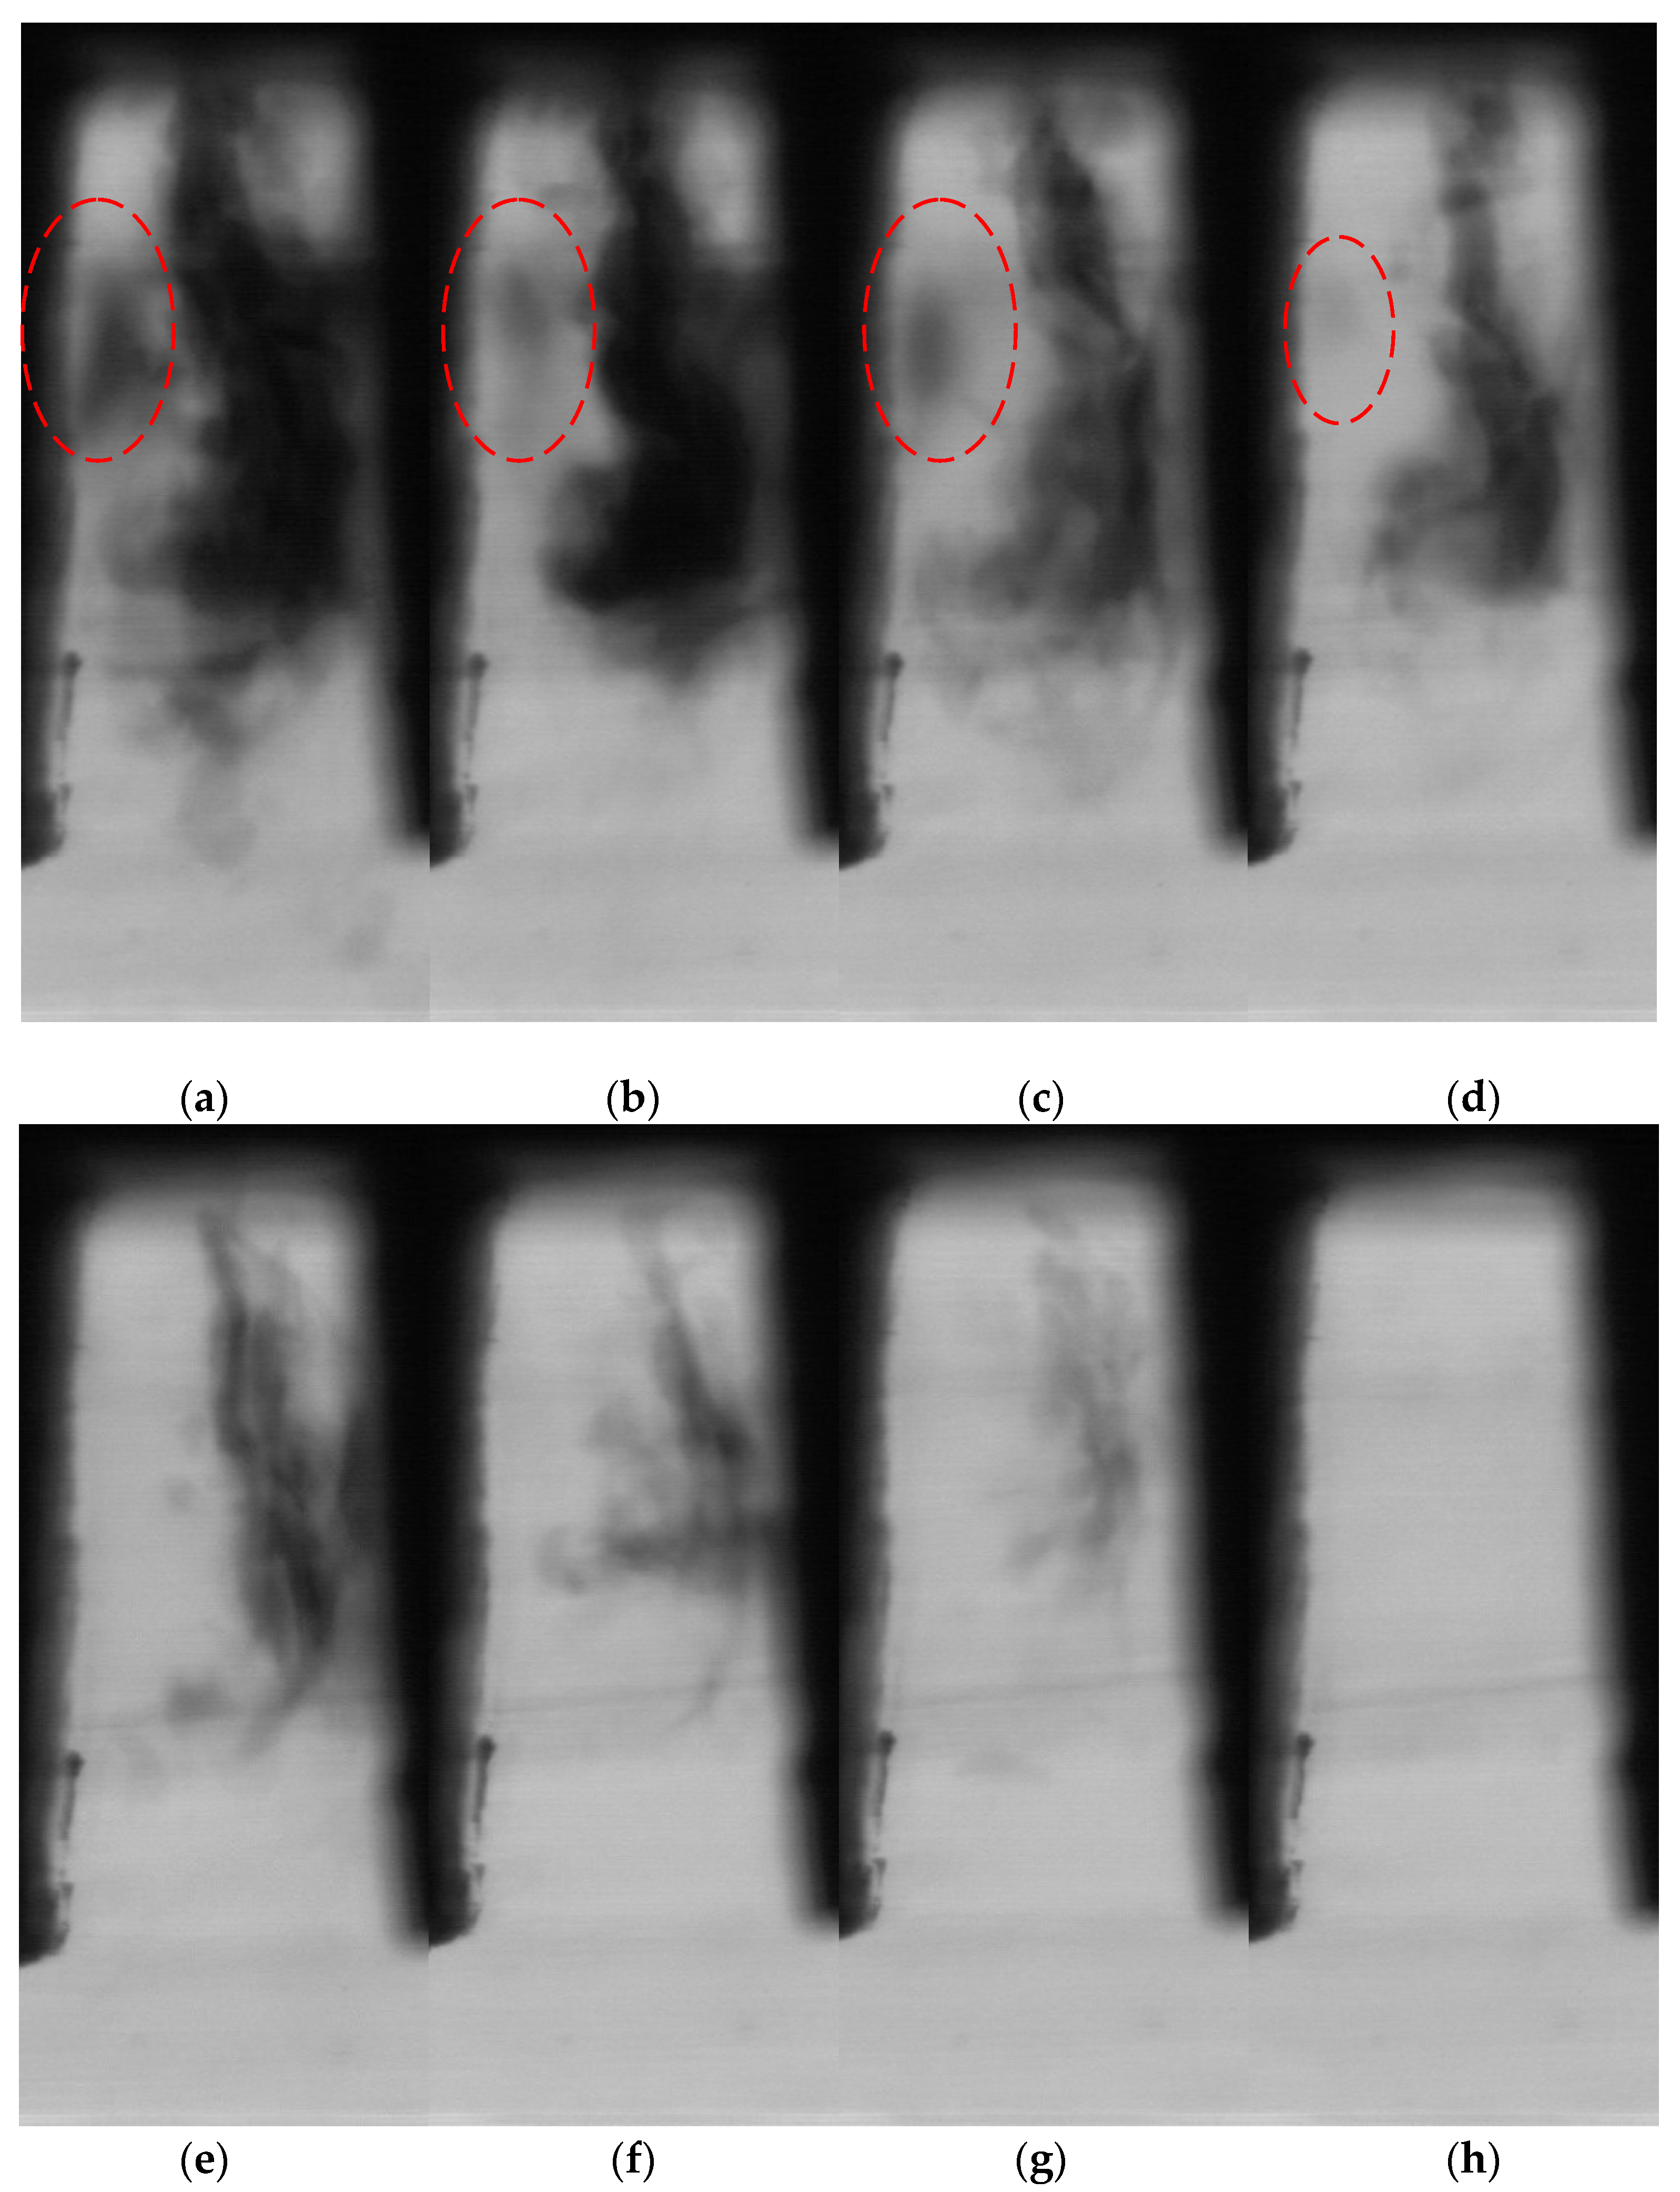
Figure 7 shows the cavitation morphology at 4 MPa inlet pressure and 0.6–1.3 MPa back pressure. The dashed line circles in the image represent the regions of “fixed cavitation”. As one can see, the variation rule of cavitation strength with back pressure is the same as that of inlet pressure at 3 MPa, indicating that increasing the pressure differential improves cavitation strength. Fixed cavitation forms on the solid side wall on the left side of the throttle groove as the inlet pressure rises from 3 MPa to 4 MPa. As illustrated in
Figure 8b, the noise frequency is delineated by 3 kHz, the noise value below 3 kHz does not change much, and there are considerable fluctuations in the noise value in the frequency range of 3–13 kHz, with the higher the frequency, the bigger the difference in the noise value. At a central frequency of 16 kHz, the noise value drops abruptly and varies around 35 dB. The noise spectrum shows that there is a significant difference between the background noise and the cavitation noise at frequencies greater than 8 kHz, indicating that the cavitation noise in the rectangular throttle slot spool belongs to the high-frequency noise, and the higher the frequency, the greater the difference in the noise value. It should be noted that the noise value at back pressure 1.2 MPa is 0.2 dB higher than at back pressure 1.1 MPa. The explanation for this is that, of the 30 frequency bands detected by 1/3OCT, 13 have a higher decibel value at back pressure 1.2 MPa than at back pressure 1.1 MPa, and they are all at low frequencies below 3150 Hz.
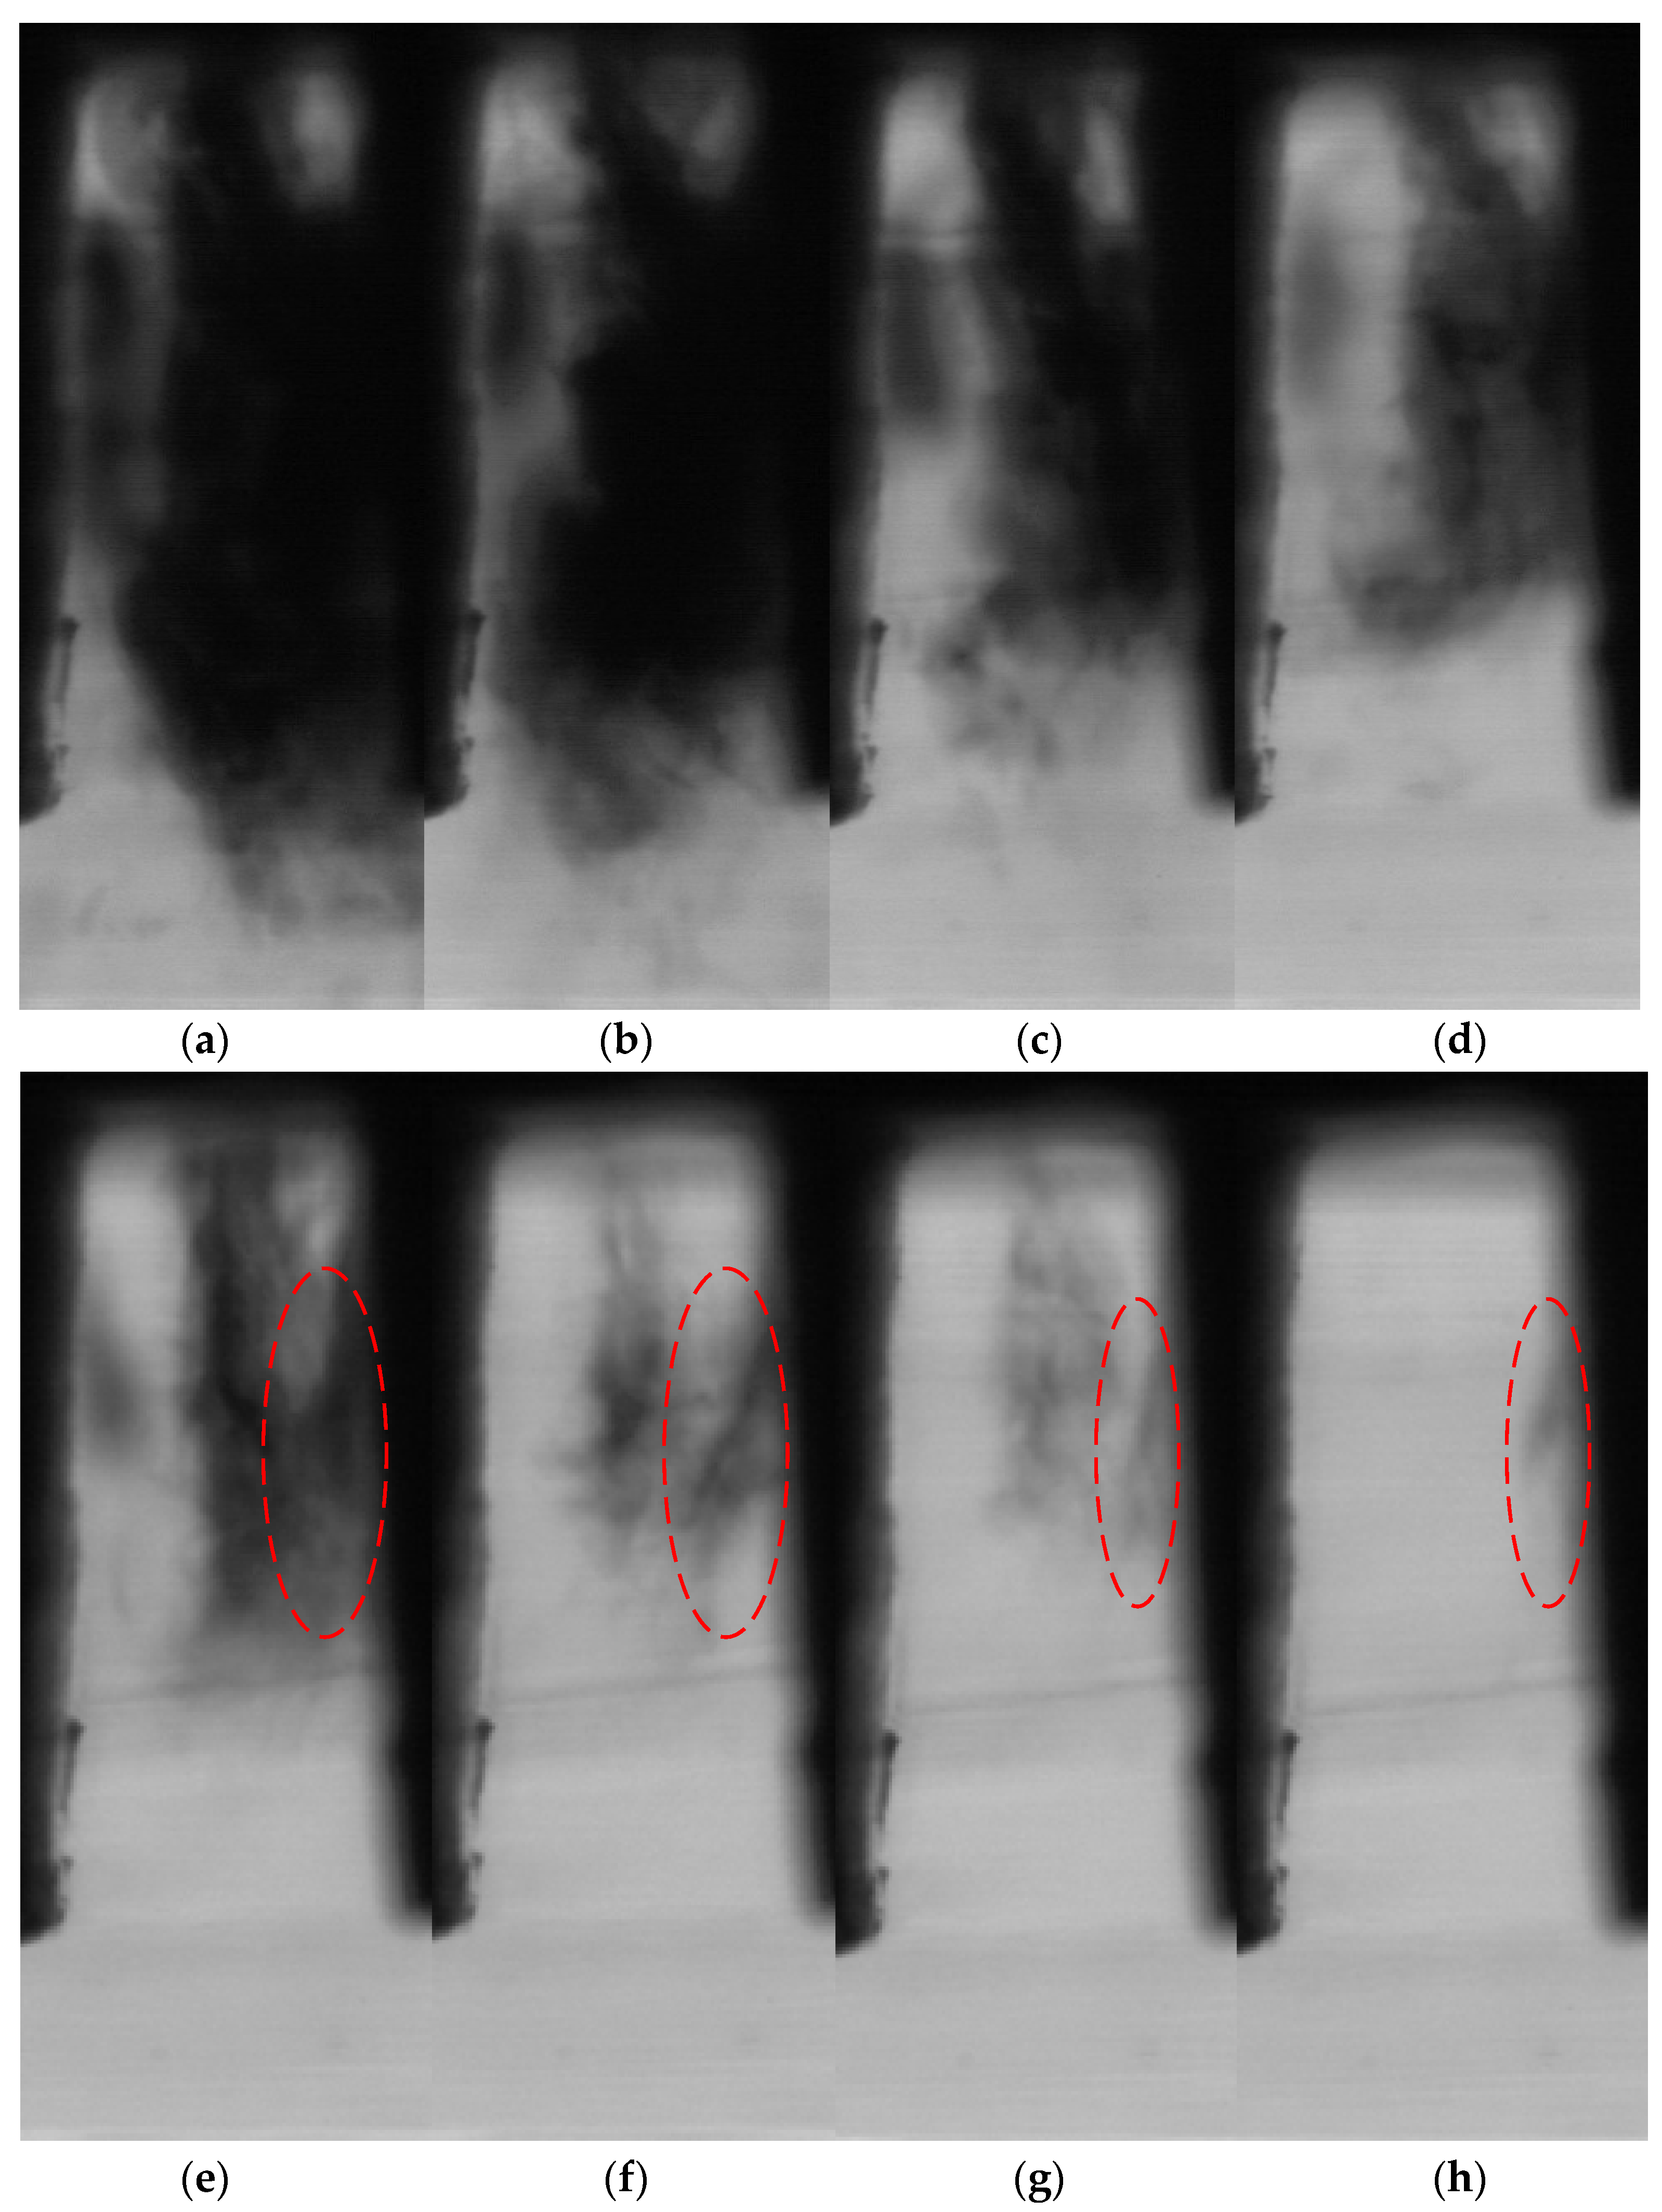
Figure 9 depicts the cavitation size at 5 MPa inlet pressure and 0.6–1.8 MPa back pressure. The dashed line circles in the image represent the regions of “fixed cavitation”. As the pressure difference increases, fixed cavitation forms on the solid side wall on the right side of the throttle groove, followed by flaky cavitation in the middle of the throttle groove; the distribution area of the cavitation increases as the pressure difference increases. When the back pressure is less than 1.4 MPa, fixed cavitation begins to form on the left side wall of the throttle slot and is independent of the main cavitation section. As demonstrated in
Figure 10, the numerical variation of cavitation noise in the rectangular throttling groove spool is very minimal, with a difference of just 4 dB between noise values for 1.8 MPa and 0.6 MPa. However, the difference in cavitation noise frequency, particularly between 8 kHz and 16 kHz, is highly noticeable, and the difference grows as inlet pressure increases.
Center frequencies are 3.15 kHz, 4 kHz, 5 kHz, 6.3 kHz, 8 kHz, 10 kHz, 12.5 kHz, and 16 kHz. Noise levels differ by 0.1 dB, 2.9 dB, 4.1 dB, 4.9 dB, 6.3 dB,16.8 dB, 17.9 dB, and 18.4 dB for back pressures of 0.6 MPa and 1.8 MPa, respectively. The cavitation noise displays a clear discipline; that is, the difference between the noise values at the center frequency grows as the central frequency increases. It is most noticeable above 8 KHz in the high-frequency spectrum. As a result, it is suggested that the frequency of cavitation noise be used to detect the cavitation condition and monitor the cavitation process.
When noise has many frequency components, the sound level is calculated by balancing the different frequency components. The frequency component with the highest sound level determines the overall effective sound level, hence the component with the highest sound level in the spectrogram defines the total effective sound level. As a result, the principal features of the spectrum are the component or components with the highest sound level in the spectrogram. It is referred to as the primary frequency of noise. The sound intensity corresponding to the 12.5 kHz frequency band is much higher in the high-frequency band than other frequency components, and there are significant spikes on the spectrogram that appear as howling noise. The primary frequency of the noise remains unchanged as the back pressure increases, while the sound level of the main frequency of the noise varies from large to tiny.

