

Cavitation Observation and Noise Characteristics in Rectangular Throttling Groove Spool

Abstract
:1. Introduction
2. Materials and Methods
3. Results
4. Conclusions
- (1)
- The magnitude of the alterations in noise intensity is minimal. The noise values exhibit slight variations of 2.3 dB, 4 dB, and 4.3 dB under varying back pressure circumstances of 3 MPa, 4 MPa, and 5 MPa inlet pressure, respectively. It is recommended to use the frequency of cavitation noise to detect the cavitation state and monitor the cavitation process.
- (2)
- A discernible disparity in occurrence can be observed between background noise and cavitation noise. The acoustic emissions resulting from cavitation in the rectangular throttle valve core exhibit minimal variation at low frequencies. Once the center frequency surpasses 3.15 kHz, a discernible distinction emerges, with the magnitude of the discrepancy in noise value increasing as the frequency rises. In other words, the cavitation cloud does not pulsate at one single frequency, but rather in a range of relatively high frequencies (more than 3.15 kHz).
- (3)
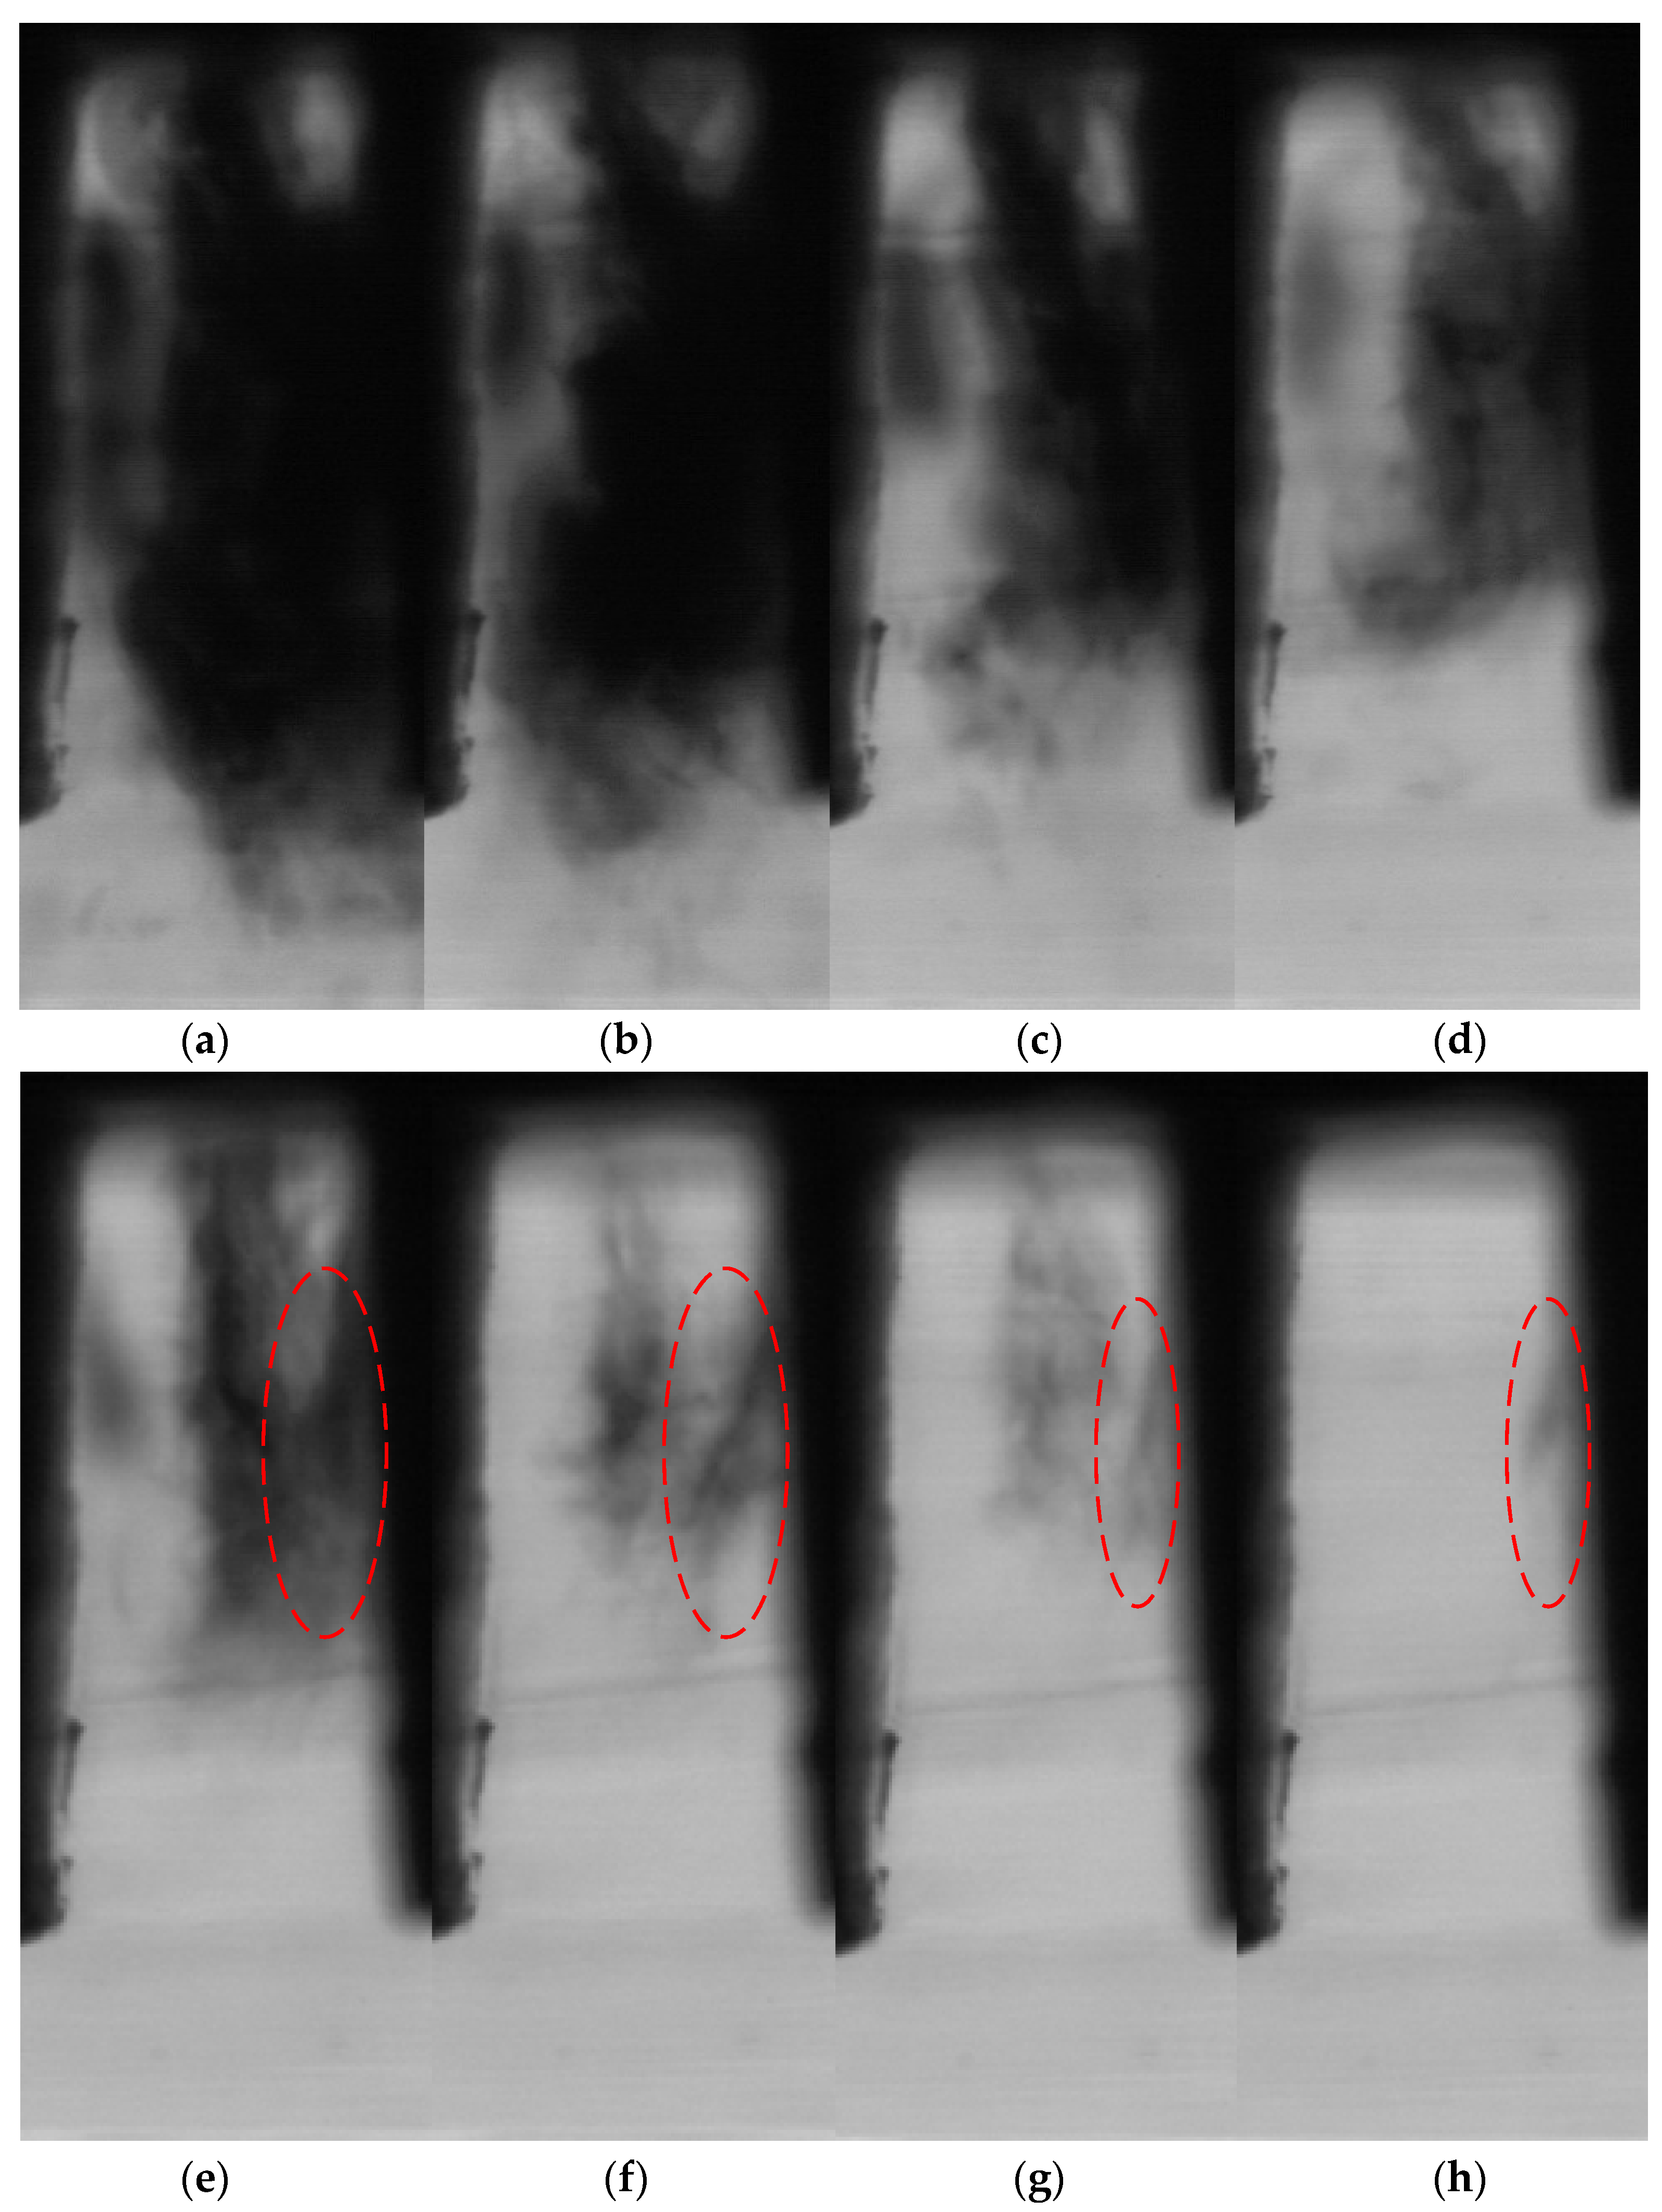
- Back pressure has the most visible influence on cavitation and flow separation, followed by the influence of intake pressure on cavitation size and noise. As the back pressure falls, the cavitation size gradually changes from sheet to cloud, and the cavitation intensity, distribution area, and noise level increase.
- (4)
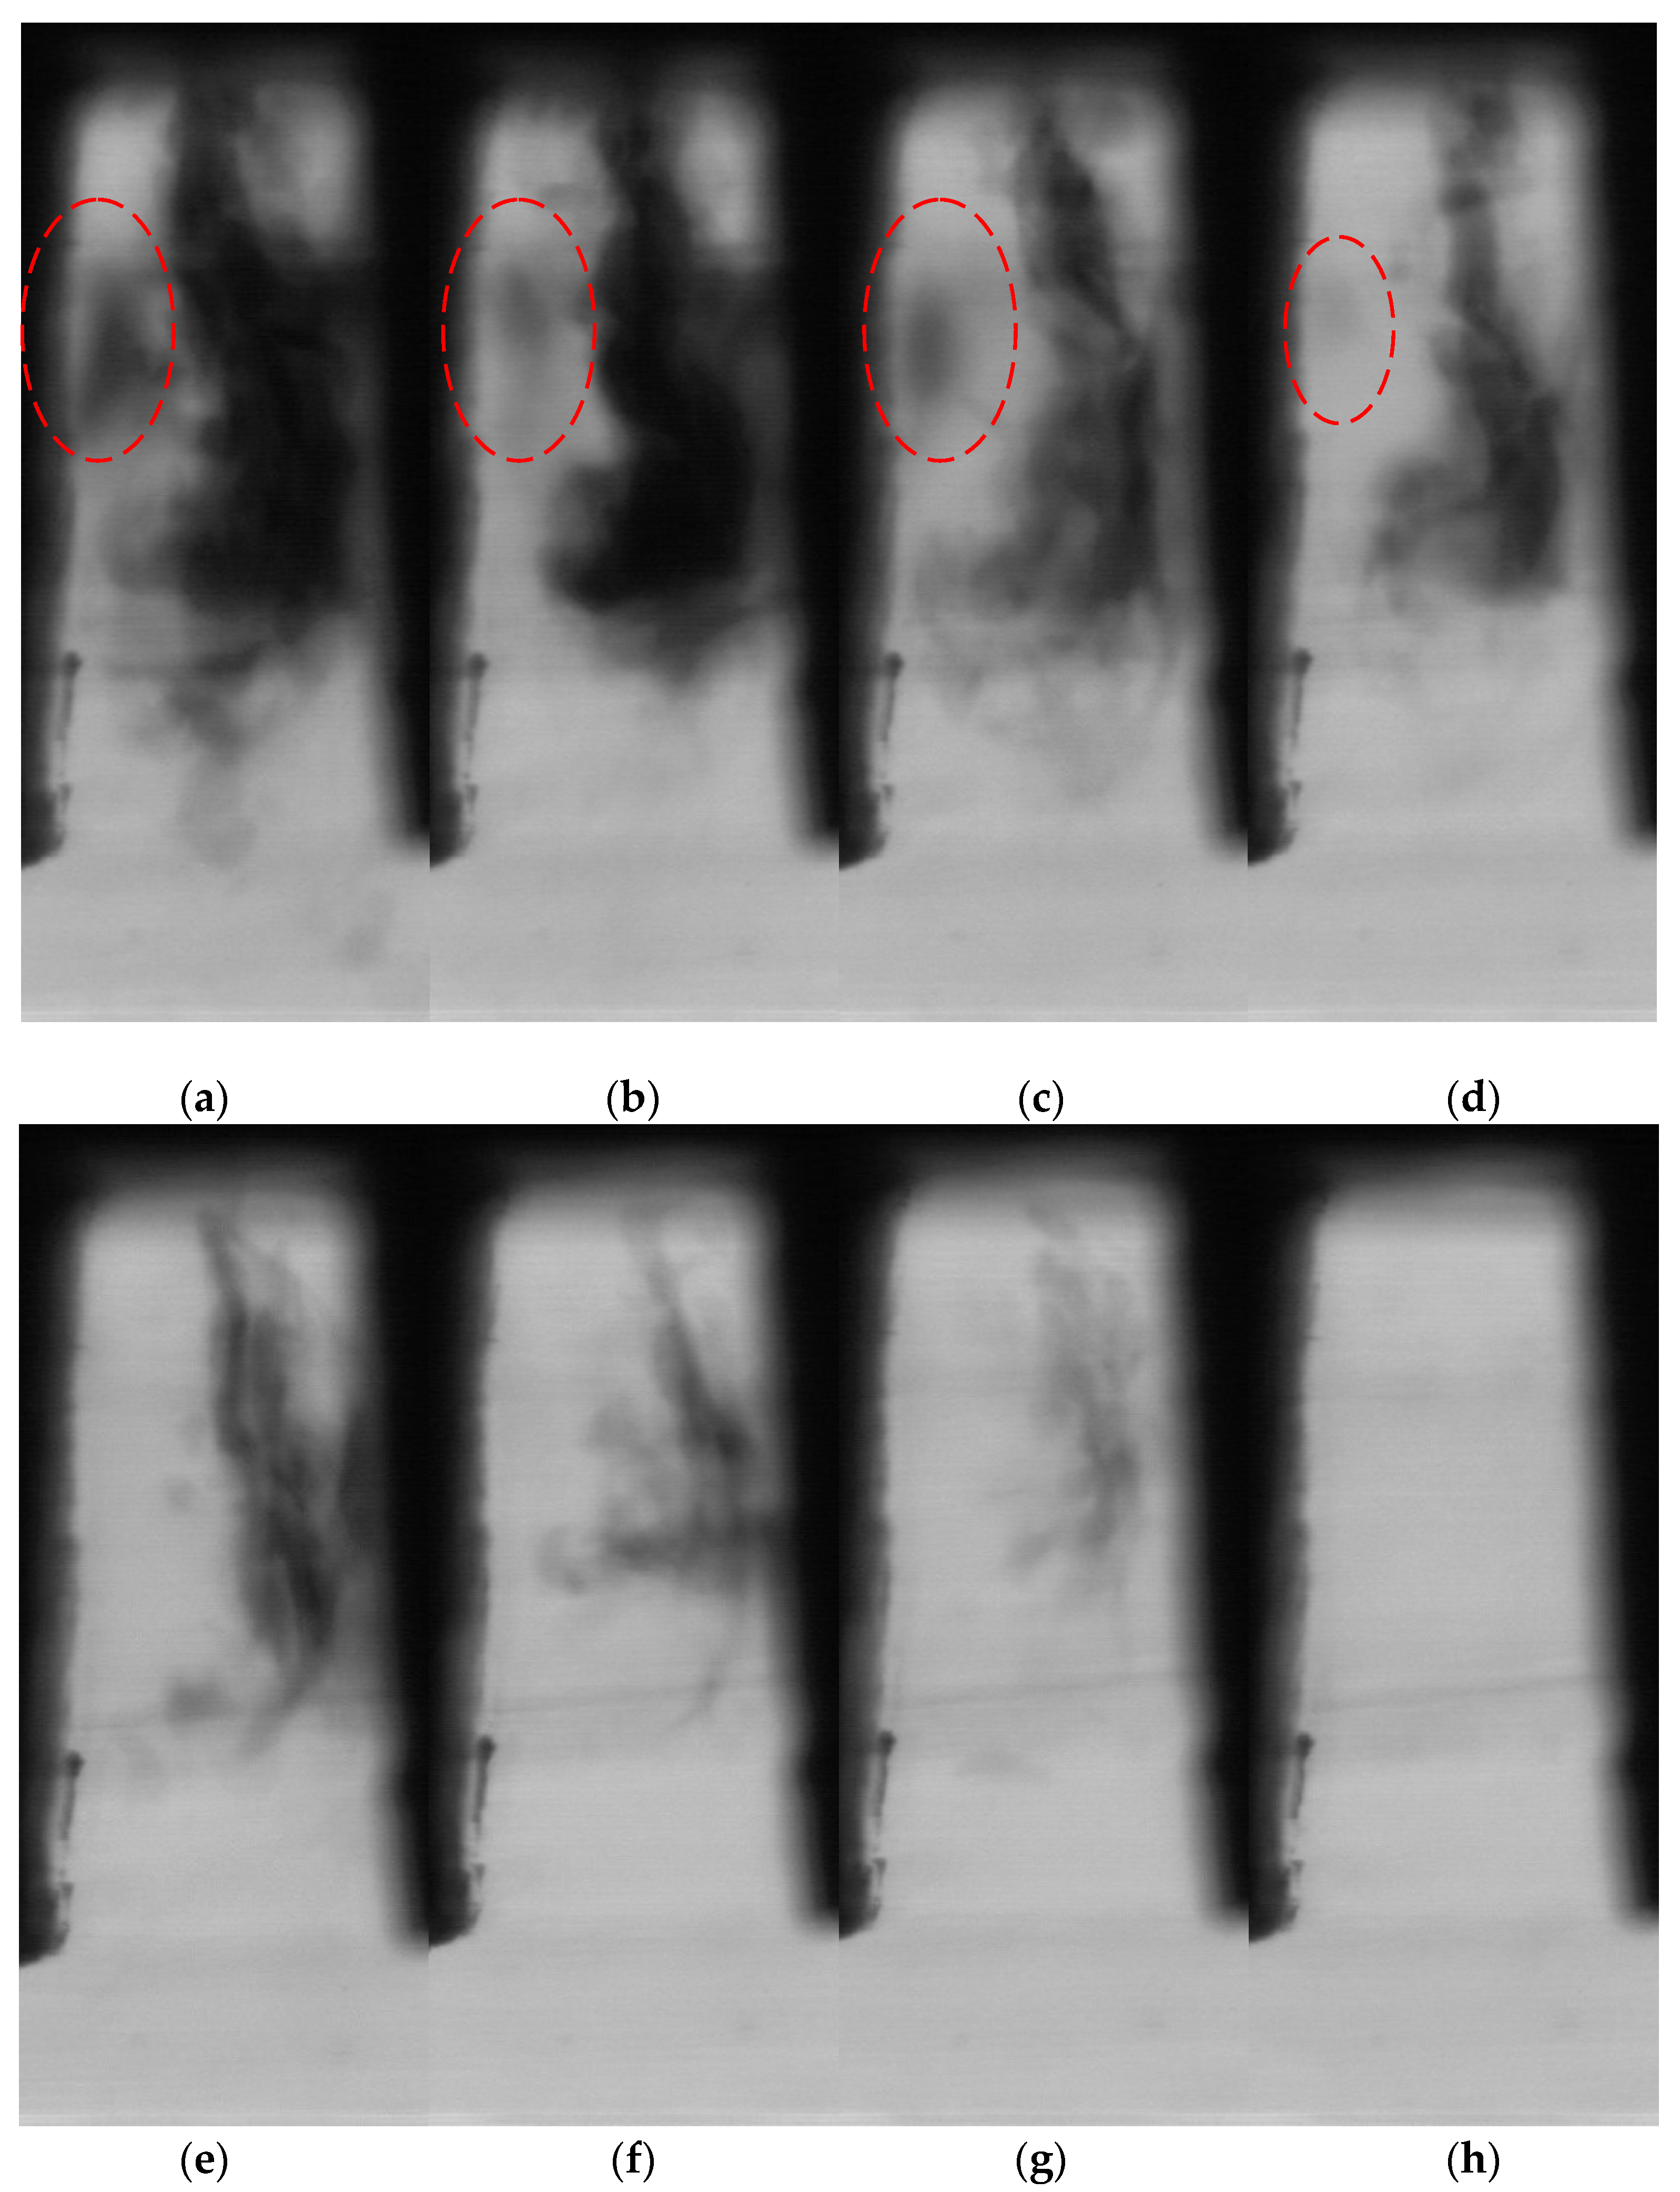
- Cavitation originates in the center of the throttling groove, cavitation bubbles develop and increase gradually along the flow direction, and there is no visible cavitation occurrence on either edge of the nascent zone. The bubble flow positions in the nascent zone and development zones are largely consistent, but the length of the development zone is related to the back pressure. When they were formed, the fixed cavitation on the solid side wall on the right side of the throttle groove and the cavitation in the center part of the throttle groove already overlapped, causing the development zone to move to the right. The collapse zone swings violently, displaying a fine mist puffing state, and the volume rapidly grows. The noise in the valve is caused by the collapse of a large number of bubbles.
Author Contributions
Funding
Data Availability Statement
Conflicts of Interest
References
- Zhang, J. Cavitation luminescence in a hydraulic cone throttle valve: Simulation and experiments. Forsch. Ingenieurwesen 2020, 84, 151–160. [Google Scholar] [CrossRef]
- Wu, W.R.; Qiu, B.H.; Tian, G.T.; Liao, X.N.; Wang, T. CFD-Based Cavitation Research and Structure Optimization of Relief Valve for Noise Reduction. IEEE Access 2022, 10, 66356–66373. [Google Scholar] [CrossRef]
- Berg, A.; Iben, U.; Meister, A.; Schmidt, J. Modeling and simulation of cavitation in hydraulic pipelines based on the thermodynamic and caloric properties of liquid and steam. Shock Waves 2005, 14, 111–121. [Google Scholar] [CrossRef]
- Li, J.Y.; Gao, Z.X.; Wu, H.; Jin, Z.J. Numerical Investigation of Methodologies for Cavitation Suppression Inside Globe Valves. Appl. Sci. 2020, 10, 5541. [Google Scholar] [CrossRef]
- Ge, M.M.; Petkovsek, M.; Zhang, G.J.; Jacobs, D.; Coutier-Delgosha, O. Cavitation dynamics and thermodynamic effects at elevated temperatures in a small Venturi channel. Int. J. Heat Mass Transf. 2021, 170, 120970. [Google Scholar] [CrossRef]
- Zhang, G.; Wu, Z.Y.; Wu, K.X.; Ou, Y.Q.; Kim, H.D.; Lin, Z. Effect of the opening of a butterfly valve on the dynamic evolution of cavitation. J. Mech. Sci. Technol. 2022, 36, 3457–3467. [Google Scholar] [CrossRef]
- Danes, L.; Vacca, A. A Tandem Axial-Piston Unit Based Strategy for the Reduction of Noise Sources in Hydraulic Systems. Energies 2020, 13, 5377. [Google Scholar] [CrossRef]
- Zhang, J.; Luo, T.T. Experimental study on the effect of pressure and flow rate on cavitation in a poppet throttle valve. Ind. Lubr. Tribol. 2020, 72, 629–636. [Google Scholar] [CrossRef]
- Li, M.X.; Yang, G.L.; Wu, G.G.; Li, X.Q. Oxidative Deterioration Effect of Cavitation Heat Generation on Hydraulic Oil. IEEE Access 2020, 8, 119720–119727. [Google Scholar] [CrossRef]
- Liu, J.B.; Liu, Z.M.; Wu, J.C.; Gu, X.L. Numerical Study on Cavitation Flow Characteristics in Diesel Fuel Injector Control Valve. Int. J. Automot. Technol. 2022, 23, 881–897. [Google Scholar] [CrossRef]
- He, J.; Li, B.B.; Liu, X.M. Investigation of flow characteristics in the U-sized throttle valve. Adv. Mech. Eng. 2019, 11, 1–10. [Google Scholar] [CrossRef]
- Jablonska, J.; Kozubkova, M.; Himr, D.; Weisz, M. Methods of Experimental Investigation of Cavitation in a Convergent—Divergent Nozzle of Rectangular Cross Section. Meas. Sci. Rev. 2016, 16, 197–204. [Google Scholar] [CrossRef]
- Yan, Z.L.; Liu, J.; Chen, B.; Cheng, X.B.; Yang, J. Fluid cavitation detection method with phase demodulation of ultrasonic signal. Appl. Acoust. 2015, 87, 198–204. [Google Scholar] [CrossRef]
- Fu, X.; Du, X.W.; Zou, J. Cavitation and noise characteristics of high-speed gap flow. Chin. J. Mech. Eng. 2007, 4, 98–102. [Google Scholar] [CrossRef]
- Ji, H.; Li, Y.; Zhang, J.H.; Wang, J.L.; Ding, D.L. Planar observation method of cavitating flow near hydraulic valve orifices. J. Lanzhou Univ. Technol. 2010, 36, 51–54. [Google Scholar]
- Li, S.J.; Lv, X.B. Fluid-structure Interaction in the Pilot Stage of Flapper-nozzle Hydraulic Servo Valve. Chin. Hydraul. Pneum. 2017, 6, 1–6. [Google Scholar]
- Cui, J.; Wu, R.; Sun, S.; Liu, H. Research of experimental technique on propeller cavitation observation. Chin. J. Hydrodyn. 2020, 35, 553–558. [Google Scholar]
- Cui, B.L.; Chen, J. Visual experiment and numerical simulation of cavitation instability in a high-speed inducer. Proc. Inst. Mech. Eng. Part A J. Power Energy 2020, 234, 470–480. [Google Scholar] [CrossRef]
- Liu, H.Y.; Tang, F.P.; Shi, L.J.; Dai, L.; Shen, J.; Liu, J. The Analysis of Cavitation Flow and Pressure Pulsation of Bi-Directional Pump. J. Mar. Sci. Eng. 2023, 11, 268. [Google Scholar] [CrossRef]
- Duan, A.; Wang, C.; Xu, J.; Gao, S.; Liu, X.; Jin, H.; Ou, G. Experiment and numerical simulation investigation on cavitation evolution and damage in the throttling section of pressure reducing valve. Energy Sci. Eng. 2022, 10, 2348–2366. [Google Scholar] [CrossRef]
- Ji, H.; Fu, X.; Yang, H.Y. Effects of internal structure on cavitating noise of hydraulic relief valve. Chin. J. Mech. Eng. 2002, 8, 19–22. [Google Scholar] [CrossRef]
- Gao, H.; Fu, X.; Yang, H.Y.; Zhu, D.C.H. Numerical Simulation and Visualization Study of Cavitating Flow in Hydraulic Ball Valve. Trans. Chin. Soc. Agric. Mach. 2003, 3, 45–48. [Google Scholar]
- Du, X.W.; Zou, J.; Fu, X.; Ji, H.; Yang, H.Y. Effect of throttling grooves structure on cavitation noise. J. Zhejiang Univ. (Eng. Sci.) 2007, 3, 456–460. [Google Scholar]
- Huang, L.; Chen, Y.H.; Song, M.T. Experimental Study on Characteristics of Marine Propeller Cavitation and Noise. J. Ship Mech. 2021, 25, 681–688. [Google Scholar]
- Jablonska, J.; Mahdal, M.; Kozubkova, M. Spectral Analysis of Pressure, Noise and Vibration Velocity Measurement in Cavitation. Meas. Sci. Rev. 2017, 17, 250–256. [Google Scholar] [CrossRef]
- Park, J.; Seong, W. Novel scaling law for estimating propeller tip vortex cavitation noise from model experiment. J. Hydrodyn. 2017, 29, 962–971. [Google Scholar] [CrossRef]
- Kim, S.; Cheong, C.; Park, W.G. Numerical investigation on cavitation flow of hydrofoil and its flow noise with emphasis on turbulence models. Aip. Adv. 2017, 7, 065114. [Google Scholar] [CrossRef]
- Wu, P.F.; Wang, X.M.; Lin, W.J.; Bai, L.X. Acoustic characterization of cavitation intensity: A review. Ultrason. Sonochem. 2022, 82, 105878. [Google Scholar] [CrossRef]
- Jeong, S.J.; Hong, S.Y.; Song, J.H.; Kwon, H.W.; Seol, H.S. Establishment of cavitation inception speed judgment criteria by cavitation noise analysis for underwater vehicles. Proc. Inst. Mech. Eng. Part M J. Eng. Marit. Environ. 2021, 235, 546–557. [Google Scholar] [CrossRef]
- Park, J.; Seong, W. Experimental Study on the Effect of Number of Bubble Occurrences on Tip Vortex Cavitation Noise Scaling Law. J. Fluids Eng. -Trans. Asme 2017, 139, 061303. [Google Scholar] [CrossRef]
- Kang, Z.Y.; Feng, C.; Liu, Z.L.; Cang, Y.; Gao, S. Analysis of the incipient cavitation noise signal characteristics of hydro turbine. Appl. Acoust. 2017, 127, 118–125. [Google Scholar] [CrossRef]
- He, Y.; Liu, Y. Experimental research into time–frequency characteristics of cavitation noise using wavelet scalogram. Appl. Acoust. 2011, 72, 721–731. [Google Scholar] [CrossRef]
- Salomons, E.M.; Janssen, S.A. Practical Ranges of Loudness Levels of Various Types of Environmental Noise, Including Traffic Noise, Aircraft Noise, and Industrial Noise. Int. J. Environ. Res. Public Health 2011, 8, 1847–1864. [Google Scholar] [CrossRef] [PubMed]
- Ge, M.M.; Manikkam, P.; Ghossein, J.; Subramanian, R.K.; Coutier-Delgosha, O.; Zhang, G.J. Dynamic mode decomposition to classify cavitating flow regimes induced by thermodynamic effects. Energy 2022, 254, 124426. [Google Scholar] [CrossRef]


Disclaimer/Publisher’s Note: The statements, opinions and data contained in all publications are solely those of the individual author(s) and contributor(s) and not of MDPI and/or the editor(s). MDPI and/or the editor(s) disclaim responsibility for any injury to people or property resulting from any ideas, methods, instructions or products referred to in the content. |
© 2023 by the authors. Licensee MDPI, Basel, Switzerland. This article is an open access article distributed under the terms and conditions of the Creative Commons Attribution (CC BY) license (https://creativecommons.org/licenses/by/4.0/).
Share and Cite
Zhang, J.; Fu, J.; Zhang, X.; Zhang, T.; Wang, Y. Cavitation Observation and Noise Characteristics in Rectangular Throttling Groove Spool. Processes 2023, 11, 2814. https://doi.org/10.3390/pr11102814
Zhang J, Fu J, Zhang X, Zhang T, Wang Y. Cavitation Observation and Noise Characteristics in Rectangular Throttling Groove Spool. Processes. 2023; 11(10):2814. https://doi.org/10.3390/pr11102814
Chicago/Turabian StyleZhang, Jian, Jifeng Fu, Xinyang Zhang, Tao Zhang, and Yuhang Wang. 2023. "Cavitation Observation and Noise Characteristics in Rectangular Throttling Groove Spool" Processes 11, no. 10: 2814. https://doi.org/10.3390/pr11102814
APA StyleZhang, J., Fu, J., Zhang, X., Zhang, T., & Wang, Y. (2023). Cavitation Observation and Noise Characteristics in Rectangular Throttling Groove Spool. Processes, 11(10), 2814. https://doi.org/10.3390/pr11102814