Abstract
A two-dimensional mathematical model was developed to simulate naphtha reforming in a series of three industrial continuous catalytic regeneration (CCR) reactors. Discretization of the resulting partial differential equations (PDEs) in the vertical direction and a coordinate transformation in the radial direction were performed to make the model solvable using Aspen Custom Modeler. A sensitivity-based parameter subset selection method was employed to identify the most influential parameters within the model. Tuning of 8 out of 180 parameters was used to ensure that model predictions match experimental data from one steady-state run. The updated parameter values improved the model fit to the data, reducing the weighted least-squares objective function for parameter estimation by 73%. The proposed model was used to predict reactor temperatures, catalyst coke weight fraction at the exit of the third reactor, and benzene flowrate from the outlet of the third reactor. The simulation results demonstrated a good agreement between the simulated values and the industrial measurements. Finally, the reactor model was utilized to explore the effects of changes in inlet temperatures and inlet level of catalyst deactivation, providing valuable insights for identifying desirable operational conditions that will improve the overall efficiency of the CCR process.
1. Introduction
Catalytic naphtha reforming is one of the most important processes in petroleum refining with the aim of high-octane gasoline production. It also can produce aromatics and hydrogen, which are valuable feedstocks for petrochemical processes [1,2,3]. Catalytic naphtha reforming units can be mainly classified into three types: semi-regenerative catalytic reformers (SRR), cyclic catalytic reformers, and continuous catalytic regeneration reformers (CCR). The most modern type of catalytic naphtha reforming is CCR. In this process, the coked catalyst is continuously removed from the final reactor in a series of three or four reactors and is sent to a catalyst regenerator [2,4,5]. As shown in Figure 1, the catalyst flows vertically in each reactor due to gravity and the gaseous feed flows radially through the catalyst bed of the reactor, thus a cross-flow pattern is established [6,7]. The two other types of naphtha reformers use a fixed catalyst bed [8,9]. In SRR and cyclic processes, the activity of the catalyst in the bed decreases over time due to coke deposition, which leads to changes in product quality. After the catalyst becomes too deactivated, SSRs are shut down to regenerate the catalyst. In cyclic catalytic reformer units, an extra spare or swing reactor is used while another reactor is being regenerated, which results in continuous operation of the overall reforming process [7].
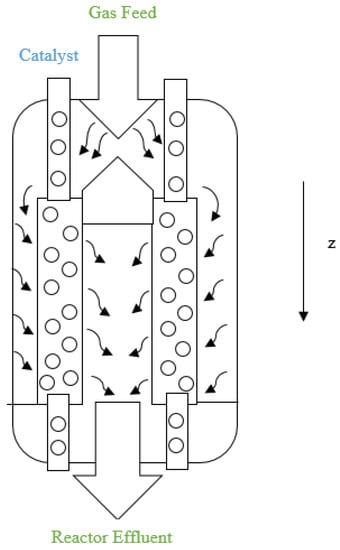
Figure 1.
Structure of reforming reactor in CCR process.
A schematic diagram for the industrial CCR process modeled in the current study is shown in Figure 2 [10]. The first reactor is always smaller than the other reactors and the last reactor is always the largest [6]. The naphtha feed typically contains different families of hydrocarbons such as paraffins, naphthenes and aromatics with 6–12 carbon atoms. The most important reactions during the catalytic reforming are hydrocracking of paraffins, cyclization of straight-chain alkanes, dehydrogenation and hydrogenation of naphthenes and aromatics, hydrodealkylation of aromatics and hydrocracking [11].
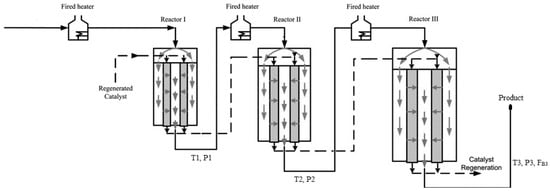
Figure 2.
Schematic diagram for the CCR process, adapted from [10].
Due to the wide variety of chemical species and their corresponding reactions, kinetic models for naphtha reforming are complex [12,13]. As shown in Table 1, a variety of lumped models for naphtha reforming have been developed wherein chemical species are classified into several pseudocomponents or lumps to reduce the number of material balances and chemical reactions that are considered [14]. The earliest model considered only a few lumps (paraffins, naphthenes and aromatics) and four reactions [15]. Recent models contain up to 44 lumps and up to 132 reactions, which leads to a large number of kinetic parameters [16,17]. Each of the models summarized in Table 1 relies on a different reaction network with different parameter values.

Table 1.
Summary of reaction networks in fundamental models for catalytic naphtha reforming units.
The models summarized in Table 1 correspond to a variety of different catalysts (e.g., Pt-Sn/Al2O3 [2,6,16], Pt/Al2O3 [53], Pt-Re/Al2O3 [36,55]). Different catalysts lead to different reaction mechanisms and rate constants. Additionally, different models are concerned with different reactor configurations and different operating modes, which result in differences in model equations. For example, Iranshahi et al. have simulated an industrial CCR configuration involving four reactors in series [6], which leads to a system of nonlinear partial differential equations (PDEs) in radial and vertical directions. By contrast, Al-Shathr et al. and Yusuf et al. have modeled industrial SRR configurations (four reactors) [37,53], which lead to nonlinear ordinary differential equations (ODEs) in the vertical direction in their steady state models [37,53] and partial differential equations in their dynamic model [37]. Also, some researchers have modeled other novel reactor configurations, e.g., thermally coupled reactors in CCR pilot plants [4,47] and a membrane moving-bed reactor [10].
When developing models for naphtha reforming systems it is important to obtain appropriate values for the model parameters. Three of the studies shown in Table 1 describe how the model parameters were estimated [16,17,51]. Babagi et al. [51] used industrial CCR plant data (the molar flow rate of the components from the actual plant) and particle swarm optimization to estimate 440 kinetic parameters (i.e., 110 kinetic parameters including frequency factors and activation energies for each of the four reactors) in their reforming system. Shakor et al. [17] also used particle swarm optimization to estimate 150 parameters for their heavy naphtha reforming system (132 pre-exponential factors, nine activation energies, and nine pressure effect parameters). They used compositions and temperature measurements for the reactor effluents in their objective function. Jiang et al. [16] used sequential quadratic programming and a weighted least squares objective function (containing measured molar flow rates of components, temperature and coke deposition on the catalyst at the outlet of the first reactor) to estimate 147 kinetic parameters (i.e., 70 pre-exponential factors, 70 activation energies and seven kinetic parameters in the catalyst deactivation model). Because of the large number of parameters, the limited number of data points and the limited operating range for these three studies, it seems unlikely that accurate and reliable parameter estimates were obtained for all of the parameters. It is not clear how the parameter values provided in the other studies in Table 1 were obtained.
Our goal in the current study is to provide an appropriate mathematical model for a series of three CCR reactors so that the company that provided us with data can use it to perform simulations that will help them to improve their naphtha reforming process efficiency, realize strategic economic benefits and increase refinery profit. It is important to choose a proper kinetic scheme for the CCR reactions, so that reliable predictions of effluent composition and catalyst deactivation rate can be obtained. We have selected the reaction network model of Iranshahi et al. as the starting point, because it involves a similar CCR process and catalyst compared to the industrial plant of interest [6]. Modifications were made to Iranshahi’s PDE model so that the resulting equations can be solved using ASPEN custom modeler (ACM) software. This ACM model can then be incorporated in an overall ASPEN plus refinery model at the company. Unfortunately, the parameter values provided by Iranshahi et al. do not result in an adequate match to the limited industrial data. As a result, a secondary goal of the current study is to use a systematic method to determine which parameter should be tuned using the plant data.
A variety of sensitivity-based parameter ranking and subset selection methods have been developed to aid parameter estimation and prevent overfitting in fundamental models [56,57,58]. For example, Yao et al. developed a parameter estimability ranking technique and used it to assess which model parameters in a gas-phase ethylene copolymerization model were estimable from existing experimental data [59]. This methodology was improved by Thompson et al. [60] to better account for uncertainties in experimental data. Thompson’s method has been used to guide parameter subset selection in a wide variety of chemical engineering models when there is insufficient data to estimate all of the parameters reliably [57,61,62]. This methodology will be used to aid parameter tuning in the current naphtha reformer modeling study.
The remainder of this paper is organized as follows. First, we explain the reaction scheme used to build the mathematical model. Next we describe the industrial CCR system and available data. Model development and solution using ACM are then described. Parameter estimation and simulation result are presented. After assessing the fit of the model to the data, additional simulation is performed to explore the influence of reactor inlet temperatures and inlet catalyst deactivation on process behavior. We believe that the resulting model will help our industrial contacts to improve the operation of their CCR system. The methods used for model development and parameter tuning will be helpful for other companies with complex reactor systems.
2. Reaction Scheme
The current model relies on the reaction scheme developed by Iranshahi et al., which is shown in Table S1 in the Supplementary Materials. This scheme involves 19 individual species (e.g., hydrogen, benzene, toluene, methane and cyclohexane) and 13 lumped species (e.g., alkylcylcohexanes with eight carbons, ACH8). Details about the lumped species are provided elsewhere [6]. The first seven reactions in Table S3 in the Supplementary Materials are dehydrogenation reactions. Reactions 8–25 involve dehydrocyclization of paraffins to naphthenes. Reactions 26–39 involve dehydrocyclization of paraffins to aromatics. Reactions 40–49 are isomerization reactions for naphthenes and paraffins. Reactions 50–55 are isomerization reactions for aromatics and reactions 56 and 57 are transalkylation reactions. Reactions 58–80 are hydrocracking reactions for paraffins and naphthenes. Reactions 81–85 are hydrodealkylation reactions [6,31]. Table S3 provides values of Iranshahi’s rate constants at Tref = 467 °C for the 85 forward reactions, along with the corresponding activation energies. Equilibrium constants and reaction enthalpies, which are used to obtain the reverse rate constants, are provided elsewhere [6].
In addition, undesirable side reactions occur that result in coke deposition on the catalyst, which contributes to deactivation of catalyst sites [30,63]. Auxiliary equations and parameters related to coke formation and catalyst deactivation are shown in Table S2 in the Supplementary Materials [6].
3. Process Description and Available Data
The hydrotreated naphtha used as a feedstock to the catalytic reformer is combined with a recycle gas stream containing 60–90 mol% hydrogen. The feed is heated to approximately 515 °C before entering each reactor in the series of three reactors. Catalytic reforming is an endothermic process overall, hence, heating is required between the reactors. The CCR process consists of a catalyst regeneration unit in addition to the adiabatic cross-flow reactors shown in Figure 1 and Figure 2. The catalyst flows vertically down through an annular portion of each reactor, while the gaseous feed flows radially through the annular catalyst bed as shown in Figure 1 [64]. Catalyst particles leaving the third reactor are sent to the regeneration unit. The regenerated catalyst is fed to the top of the first reactor. The CCR process performs at low pressure (~5 bar) and produces a high-octane product [64]. Process information used for model development is provided in Table 2. Information about the feed concentrations is provided in Table S6 in the Supplementary Materials.
Table 2.
Operating conditions and process characteristics for industrial CCR system of interest.
Available Data for Model Parameter Tuning
Industrial data provided by the Persian Gulf Star Oil Company are currently available for only one steady-state operating condition. In future, the company may decide to switch to different conditions, which will produce additional data. As such, only eight measured data values are available for model tuning. They are the temperature of the gas leaving each reactor (T1m = 515 °C, T2m = 515 °C, T3m = 515 °C), the outlet pressure of each reactor (P1m = 5.4 bar, P2m = 4.9 bar, P3m = 4.5 bar), the flow rate of benzene from the third reactor (FB3m = 40.42 mol h−1) and coke weight fraction on the catalyst from the outlet of the third reactor ( kg kg−1). Our purpose is to tune a subset of the model parameters to obtain more-reliable process simulations. These simulations will be used to select alternative operating conditions that should lead to improved efficiency and profit of the refinery.
4. Model Development and Implementation
Iranshahi et al. used the assumptions in Table 3 to develop the CCR model equations for a single reactor, which are shown in Table 4. Equation (4.1) is a balance on the jth species in the gas phase, where j = 1, 2, …, 32.
Table 3.
Assumptions for model development.
Table 4.
Iranshahi’s PDE model.
This equation describes the changing concentration of species j (in mol m−3) due to chemical reactions and changes in temperature T and pressure P in the radial direction. Equation (4.1) accounts for changes in reaction rates due to catalyst deactivation as the catalyst moves down through the bed, using activity factors ai. Equation (4.2) is a balance on the coke that forms on the metallic catalyst sites as the catalyst flows downward through the bed. Similarly, Equation (4.3) is a balance on the coke that forms on acidic catalyst sites. The activity factors ai are obtained from auxiliary equations provided in Table S2, based on the amounts of coke deposited on metallic and acidic sites. Equation (4.4) is an energy balance used to predict the gas-phase temperature, which is assumed to be the same as the catalyst temperature (assumption 9 in Table 3). Equation (4.5) is an overall mass balance and Equation (4.6) is the Ergun equation. The model in Table 4 is a PDE model because it contains derivatives with respect to the radial coordinate r and the axial coordinate z. All of the symbols that appear in Table 4 are defined in the Nomenclature at the end of the paper. Auxiliary algebraic equations required to solved ODEs are also provided in the Supplementary Materials.
One goal of the current study is to adapt Iranshahi’s model so it can be implemented using ACM. Unfortunately, ACM cannot solve PDEs. To convert the PDEs in Table 4 into ODEs, we discretized the model equations in the vertical direction, resulting in a steady-state system of ODEs in r rather than PDEs in r and z. Each PDE in Table 4 was converted into nine ODEs (See Table S1 in the Supplementary Materials), which provides accurate numerical results while keeping the number of ODEs reasonable for solution using ACM.
It is not possible to solve the ODEs in Table S1 using ACM because ACM requires that the independent variable must increase from its initial value as the ODEs are solved. As shown in Figure 1 and Table 2, the gas feed to the first reactor enters the bed at position Ro = 1.275 m and exits the bed at position Ri = 0.73 m. To address this, issue a new coordinate defined as so that and starts at zero at the outer edge of the bed and becomes 0.545 m at the inner edge. Applying this coordinate change to the ODEs in Table S1 results in the proposed model equations in Table 5. These model equations can be readily solved using ACM along with the feed conditions and reactor geometry. When three reactors in series are simulated, the output mole fractions from the first reactor are used to compute the inlet concentrations for the second reactor. Similarly, initial concentrations for the species in the third reactor are obtained from predicted species mole fractions at the exit of second reactor.
Table 5.
Proposed model equations.
5. Result and Discussion
5.1. Parameter Subset Selection and Parameter Estimation
The CCR model in Table 5 involves 180 parameters that are considered for tuning (i.e., 85 rate constants for forward reactions and 85 activation energies whose initial guesses are provided in Table S3, along with the void fraction ɛ and nine parameters influencing the coke formation rate, whose initial guesses are provided in Table S4). There are also some thermodynamic parameters in the reaction rate equations, such as equilibrium constants at the reference temperature and enthalpies of reaction. These thermodynamic parameters obtained from the study of Iranshahi et al. (see Table S5) are not considered for parameter tuning, because they may have less uncertainty than the kinetic parameters in Table S3. Currently, there are only eight industrial data values available for parameter tuning, so it is impossible to re-estimate all of the parameters in this complicated model uniquely from the available data. As such, our goal is to pick a small number of influential parameters for tuning so that a better match to the data can be obtained. Therefore, a sensitivity-based parameter ranking method was used to determine which of the 180 parameters can and should be re-estimated based on the eight available data values. It is not clear how accurate Iranshahi’s parameter values are and under what operational situations they were obtained. Although our industrial catalyst is similar to Iranshahi’s catalyst, it may have some different behaviors.
Parameter ranking and selection tools were applied to determine which parameters should be tuned, based on the model structure, the available data, uncertainty ranges for the initial parameters and the uncertainties in the measurements [57,60,61,62]. Upper and lower bounds for activation energies were set at ±10% of Iranshahi’s initial values. Bounds for rate constants at the reference temperature, bed void fraction and other parameters used to predict the rate of coke formation were set at ±30% of Iranshahi’s values. These tight bounds were used to prevent the tuned parameters from moving to physically unrealistic values. Measurement uncertainties used for parameter ranking are provided in Table 6. After ranking the parameters, the most influential parameters appear at the top of the list, while the less influential parameters are ranked nearer the bottom of the list.
Table 6.
Variable measurement uncertainties.
As a result of the parameter ranking, the top seven parameters were selected for tuning using the eight available data values. These parameters are, in order, the void fraction ɛ, the activation energies of reactions 34, 56, 63 and 27, parameter n1 used to compute the coke formation rate, and the activation energy of reaction 7. It is not surprising that these parameters were selected as influential. The void fraction has an important influence when predicting pressure drops across the reactors. Parameter E34 is the activation energy when an iso-paraffin with seven carbons (IP7) dehydrocyclizes to produce toluene, which is an endothermic reaction [6]. Since the toluene produced by reaction 34 subsequently influences benzene production via reaction 56, parameter E34 also influences the predicted benzene outflow rate. Parameter E56 influences the predicted reactor temperatures and the benzene outflow rate. Parameters E63 and E27 are important because they influence the rate of NP7 consumption to produce small molecules and toluene. Reaction 63 is an exothermic reaction and reaction 27 is endothermic. Parameter n1 is influential for computing the coke formation rate and parameter E7 is the activation energy for a highly endothermic reaction [6,30,63].
After the seven parameters were selected, a weighted-least-squares objective function was used to estimate the parameters:
where T1, T2 and T3 are predicted outlet temperatures of three reactors, T1m, T2m and T3m are the outlet measured temperatures of three reactors, P1, P2 and P3 are predicted outlet pressures of three reactors, P1m, P2m and P3m are measured outlet pressures of three reactors and FB3, FB3m, ST, SP, Scoke and Sbenzene are predicted outlet benzene flowrate from the third reactor, measured outlet benzene flowrate from the third reactor, and measurement standard deviations for temperature, pressure, coke concentration and benzene molar flowrate, respectively.
Notice that the seventh term in the objective function penalizes the difference between the total measured amount of coke (CCm in kgcoke/kgcatalyst) and the sum of the predicted coke on metallic and acidic sites, because only the overall amount of coke is measured. During parameter estimation, using the steepest descent method, parameter E56 reached its upper bound. At this point, parameter E56 was set at the bound and parameter ranking was performed again with E56 held constant. Parameter E37 was identified as an influential parameter that should be considered during the second stage of estimation (along with ɛ, E34, E63, E27, n1 and E7). E37 is the activation energy of IP8 dehydrocyclization to para-xylene, which is an important endothermic reaction that ultimately influences the predicted benzene flow rate. Steepest descent optimization continued until the parameters converged to the values shown in Table 7.
Table 7.
Kinetic Parameter Initial Guesses, Lower/Upper Bounds and Final Estimates.
5.2. Parameter Estimation and Simulation Results
The objective function value improved from J = 152.3 prior to parameter tuning to J = 40.8 using the values in Table 7. Simulation results using the old and new parameter values are compared with the measured data in Figure 3. As shown in Figure 3a, the model does a good job of matching the temperatures for all three reactors. Parameter tuning noticeably improved the predicted temperatures for reactors 1 and 3. The temperature prediction for reactor 2 remained nearly unchanged because the initial prediction was already close to the data. A comparison between simulation results and available data for pressure drops is shown in Figure 3b. Notice that the pressure drop predictions before and after tuning are nearly the same. The model also under-predicts the pressure drop in reactor 2 and over-predicts the pressure drop in reactor 3. Void fraction ɛ is the most influential parameter in the model, when predicting the pressure drops. Note that the same void fraction is assumed for all three reactors, which may not be true in practice, due to different reactor dimensions, catalyst flow patterns and coke build up. When more data are available in future, estimating different values for ɛ in each reactor may be helpful for obtaining good model predictions. Also, it may be appropriate to use Kozeny Carman and Burke Plummer parameters that better account for the shape of catalyst particles (see assumption 3 in Table 3). As shown in Figure 3c, there is a meaningful improvement in the predicted coke weight fraction on the catalyst after parameter tuning. Figure 3d compares the predicted benzene flow rate before and after parameter tuning. Notice that there is a substantial improvement in the predicted benzene flow rate due to parameter tuning, which is an important outcome of the tuning exercise. Before tuning, the largest term in the objection function in Equation (1) was the final term related to benzene flow rate, which was equal to 98.8. After estimation, this term decreased to only 1.3. Predicted overall PNA (paraffin, naphthenic, aromatic) mole fractions from the outlet of the third reactor (before and after parameter tuning) are shown in Figure S1 in the Supplementary Materials. The parameter tuning had very little influence on these overall predictions.
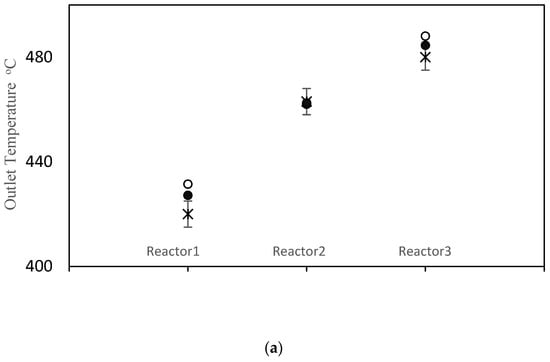
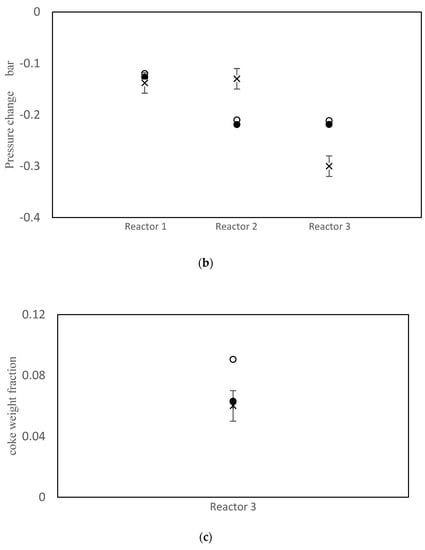
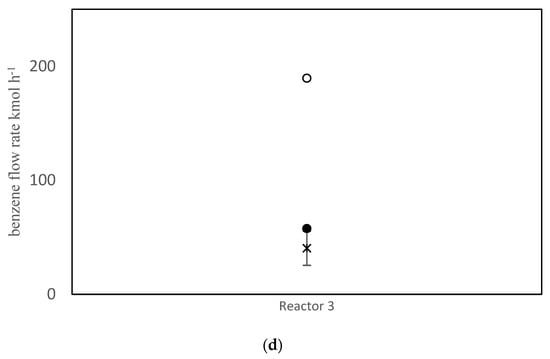
Figure 3.
(a) Reactor Outlet Temperatures; (b) Pressure change across each reactor; (c) Coke weight fraction on the catalyst from outlet of the third reactor; (d) Flow rate of benzene from the third reactor; × measured, ○ predicted with old parameter values, ● predicted with tuned parameter values.
5.3. Simulation Results for Different Operating Conditions
Companies are interested in applying the appropriate reactor inlet temperatures to improve the efficiency of CCR processes. They are also interested in gaining a better understanding of the influence of catalyst deactivation. Catalyst regeneration is not perfect, so the quality of the inlet catalyst tends to degrade over time. In this simulation study, we consider an inlet catalyst with 10% lower activity than the base-case catalyst simulated in Figure 3. We investigated the impact of changing inlet gas temperature (ranging from 510 to 530 °C) when this partially deactivated catalyst is used. Figure 4a shows the effect of inlet temperature on the PNA analysis at the outlet of the third reactor. It can be observed that an increase in inlet temperature leads to an increase in the mole fraction of paraffins and a decrease in the mole fraction of aromatics. Figure 4b shows the corresponding temperature drops across the three reactors. It is evident that raising the inlet temperature enhances the temperature drop in the first reactor, while reducing the temperature drops in the second and third reactors. This results can be attributed to highly endothermic naphthenic dehydrogenation reactions that produce aromatics, which primarily occur in the first reactor. The higher temperature drop across reactor R1 indicates that overall conversion is higher in R1, so it is not surprising that the remaining overall conversion and corresponding temperature drops are lower in reactors R2 and R3. Additionally, highly exothermic and irreversible hydrocracking reactions in the third reactor are favored at high temperatures, contributing to the predicted decrease in temperature drop in R3 with increasing inlet temperature. These simulation results are consistent with the predictions of Sa’idi et al., who observed that increasing the inlet temperatures for the first two reactors in a CCR process increased overall conversion in these two reactors, but not in subsequent reactors in the series [66]. Figure 4c shows the predicted benzene mole fraction at the outlet of the third reactor for different inlet temperatures. It can be observed that increasing the inlet temperature leads to an increase in the benzene mole fraction. Figure 4d shows the predicted weight fraction of coke on the catalyst at the outlets of the three reactors. It is not surprising that increasing the inlet temperatures results in an increase in the coke weight fraction on the catalyst.
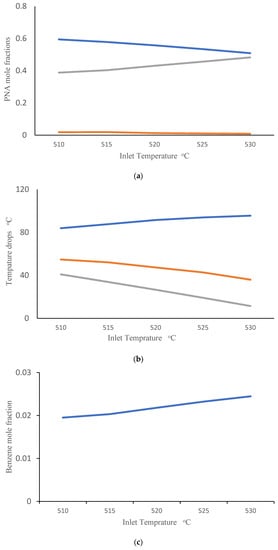
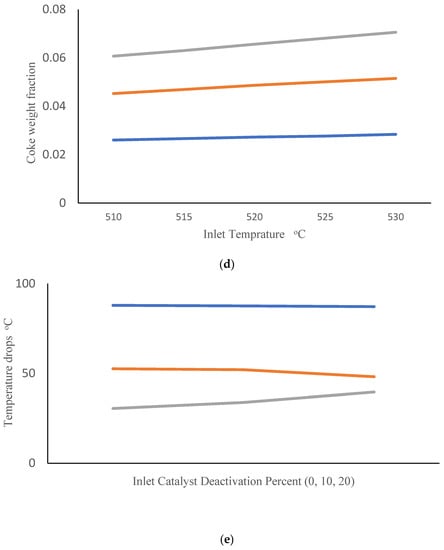
Figure 4.
(a) PNA (— Paraffin, — Naphthenic, — Aromatic) mole fractions from the third reactor outlet obtained using different inlet temperatures after 10% catalyst deactivation. (b) Temperature drops across reactors (— R1, — R2, — R3) obtained using different inlet temperatures after 10% catalyst deactivation. (c) Benzene mole fraction exiting the third reactor obtained using different inlet temperatures after 10% catalyst deactivation. (d) Coke weight fraction on the catalyst from the three reactor outlets (— R1, — R2, — R3) obtained using different inlet temperatures after 10% catalyst deactivation. (e) Temperature drops across reactors (— R1, — R2, — R3) at different levels of catalyst deactivation and inlet temperature of 515 °C.
Finally, Figure 4e shows the predicted temperature drops across R1, R2 and R3 when inlet temperatures are held constant at 515 °C and catalysts with different levels of deactivation are fed to the first reactor. Small decreases in temperature drop are predicted for R1 and R2 as inlet catalyst deactivation increases. It is interesting that increases in temperature drop are predicted for R3, indicating that a greater portion of overall conversion is occurring in R3 due to lower catalyst availability in R1 and R2. The predicted effects of catalyst deactivation on overall PNA mole fractions and benzene mole fraction at the exit of R3 are shown in Figures S2 and S3 in the Supplementary section.
6. Conclusions
A two-dimensional steady-state model for continuous catalytic reforming of naphtha in a series of three industrial reactors was developed using the kinetic scheme of Iranshahi et al. To make the mathematical model solvable using Aspen Custom Modeler, discretization was applied in the vertical direction, followed by a transformation of coordinates in the radial direction. Due to the limited availability of data (only eight values from a single steady-state operating condition), it was not possible to estimate all 180 kinetic parameters. Therefore, a sensitivity-based parameter subset selection method was employed to determine the most estimable parameters so they could be tuned using the data. The model parameters selected for estimation included the void fraction (ɛ), n1, a parameter used to calculate the coke formation rate and activation energies for key dehydrocyclization, transalkylation, hydrocracking, and dehydrogenation reactions. Subsequently, parameter tuning was conducted, resulting in a 73% improvement in the weighted least- squares objective function. After parameter tuning, the model demonstrated a good agreement with temperature, coke and benzene data. However, it was observed that the predicted pressure drop deviated noticeably from the measured pressure drop, with an over-prediction in the second reactor and an under-prediction in the third reactor. To address this issue, we recommend considering different void fractions for each reactor once more data become available in the future. Simulations were performed to explore the impact of varying the inlet gas temperature and deactivation level of the catalyst, providing valuable insights for enhancing the efficiency of the CCR process.
Supplementary Materials
The following supporting information can be downloaded at: https://www.mdpi.com/article/10.3390/pr11102838/s1, Figure S1: PNA (Paraffin, Naphthenic, Aromatic) mole fraction from the third reactor outlet before and after parameter tuning; Figure S2: PNA (Paraffin, Naphthenic, Aromatic) mole fraction from the third reactor outlet obtained using different levels of catalyst deactivation and inlet temperatures of 515 °C; Figure S3: Benzene mole fraction from the third reactor outlet obtained using different levels of catalyst deactivation and inlet temperatures of 515 °C; Table S1: Iranshahi’s model equations; Table S2: Auxiliary equations; Table S3: Kinetic parameters; Table S4: Required constants to calculate catalyst deactivation rate; Table S5: Thermodynamic parameters; Table S6: Feed composition for industrial reactor system [67,68,69,70,71,72,73,74,75].
Author Contributions
Conceptualization, A.S. and K.B.M.; methodology, M.A. and K.B.M.; software, M.A.; validation, M.A., K.B.M. and A.S.; formal analysis, M.A. and K.B.M.; investigation, M.A.; resources, M.A. and K.B.M.; data curation, M.A.; writing—original draft preparation, M.A.; writing—review and editing, K.B.M. and A.S.; visualization, M.A.; supervision, K.B.M. and A.S.; project administration, A.S.; funding acquisition, M.A. and K.B.M. All authors have read and agreed to the published version of the manuscript.
Funding
This work was supported by the ministry of science, research and technology (MSRT) of Iran, so that Mahmud Atarianshandiz could be a visiting research student at Queen’s University. Financial support was also provided by a grant (RGPIN-2020-03901) from the Natural Sciences and Engineering Research Council of Canada.
Data Availability Statement
The data presented in this study are available in the supplementary material.
Acknowledgments
The authors thank Reza Balouchi and Sajad Allahyari from Persian Gulf Star Oil Company for providing the industrial data.
Conflicts of Interest
The authors declare no conflict of interest.
Nomenclature
| Symbol | Definition |
| rate of coke formation on the metal function of fresh catalyst, kg kgcat−1 h−1 | |
| rate of coke formation on the acid function of fresh catalyst, kg kgcat−1 h−1 | |
| EC | coke formation activation energy, J mol−1 |
| CACP | alkylcyclopentane concentration, kmol m−3 |
| P | pressure, bar |
| H2/HC | hydrogen over hydrocarbon mole ratio |
| coke weight fraction on metallic function of catalyst, kg kg−1 | |
| coke weight fraction on acidic function of catalyst, kg kg−1 | |
| constant of deactivation equation for metallic function, kg kg−1 kPan1 m1.5 kmol−1.5 | |
| constant of deactivation equation for acidic function, kg kg−1 kPan1 m1.5 kmol−1.5 | |
| aA | acidic function activity |
| aM | metallic function activity |
| acidic function activity for coke formation | |
| metallic function activity for coke formation | |
| rate of ith reaction, kmol kgcat−1 h−1 | |
| rate of ith reaction on the fresh catalyst, kmol kgcat−1 h−1 | |
| constant of deactivation, m3 kmol−1 | |
| constant of deactivation, m3 kmol−1 | |
| constant of deactivation, m3 kmol−1 | |
| constant of deactivation, m3 kmol−1 | |
| constant of deactivation equation | |
| constant of deactivation equation | |
| Cj | component concentration of component j, kmol m−3 |
| r | radius, m |
| ur | radial velocity, m h−1 |
| stoichiometric coefficient of component j in reaction i | |
| uz | catalyst velocity, m h−1 |
| i | numerator for reaction |
| j | numerator for component |
| CT | total concentration, kmol m−3 |
| CP | specific heat capacity at constant pressure, kJ kmol−1 K−1 |
| dp | particle diameter, m |
| sphericity | |
| void fraction of catalyst bed | |
| reactor bulk density, kg m−3 | |
| heat of reaction, kJ mol−1 | |
| control volume thickness in radial direction, m | |
| control volume length, m | |
| T | temperature, °C |
| Pm | measured pressure, bar |
| Tm | measured temperature, °C |
| measured coke weight fraction on metallic function of catalyst, kg kg−1 | |
| measured coke weight fraction on acidic function of catalyst, kg kg−1 | |
| coordinated change variable | |
| ST | temperature measurement error, °C |
| SP | pressure measurement error, bar |
| Scoke | coke weight fraction measurement error, kg kg−1 |
| SBenzene | benzene molar flowrate measurement error, kmol h−1 |
References
- Antos, G.J.; Aitani, A.M. Catalytic Naphtha Reforming, Revised and Expanded; CRC Press: Boca Raton, FL, USA, 2004. [Google Scholar]
- Hongjun, Z.; Mingliang, S.; Huixin, W.; Zeji, L.; Hongbo, J. Modeling and simulation of moving bed reactor for catalytic naphtha reforming. Pet. Sci. Technol. 2010, 28, 667–676. [Google Scholar] [CrossRef]
- Lapinski, M.P.; Metro, S.; Pujado, P.R.; Moser, M. Catalytic reforming in petroleum processing. In Handbook of Petroleum Processing; Springer: Berlin/Heidelberg, Germany, 2015; pp. 229–260. [Google Scholar]
- Iranshahi, D.; Rafiei, R.; Jafari, M.; Amiri, S.; Karimi, M.; Rahimpour, M.R. Applying new kinetic and deactivation models in simulation of a novel thermally coupled reactor in continuous catalytic regenerative naphtha process. Chem. Eng. J. 2013, 229, 153–176. [Google Scholar] [CrossRef]
- Donald, M. Catalytic Reforming; Penn Well Publishing Company: Tulsa, OK, USA, 1985. [Google Scholar]
- Iranshahi, D.; Karimi, M.; Amiri, S.; Jafari, M.; Rafiei, R.; Rahimpour, M.R. Modeling of naphtha reforming unit applying detailed description of kinetic in continuous catalytic regeneration process. Chem. Eng. Res. Des. 2014, 92, 1704–1727. [Google Scholar] [CrossRef]
- Rahimpour, M.R.; Jafari, M.; Iranshahi, D. Progress in catalytic naphtha reforming process: A review. Appl. Energy 2013, 109, 79–93. [Google Scholar] [CrossRef]
- Stijepovic, M.Z.; Linke, P.; Kijevcanin, M. Optimization approach for continuous catalytic regenerative reformer processes. Energy Fuels 2010, 24, 1908–1916. [Google Scholar] [CrossRef]
- Gyngazova, M.S.; Kravtsov, A.V.; Ivanchina, E.D.; Korolenko, M.V.; Chekantsev, N.V. Reactor modeling and simulation of moving-bed catalytic reforming process. Chem. Eng. J. 2011, 176, 134–143. [Google Scholar] [CrossRef]
- Stijepovic, V.; Linke, P.; Alnouri, S.; Kijevcanin, M.; Grujic, A.; Stijepovic, M. Toward enhanced hydrogen production in a catalytic naphtha reforming process. Int. J. Hydrogen Energy 2012, 37, 11772–11784. [Google Scholar] [CrossRef]
- Antos, G.; Moser, M.; Lapinski, M. The new generation of commercial catalytic naphtha-reforming catalysts. In Catalytic Naphtha Reforming, Revised and Expanded; CRC Press: Boca Raton, FL, USA, 2004; pp. 326–342. [Google Scholar] [CrossRef]
- Marin, G.; Froment, G.; Lerou, J.J.; De Backer, W. Simulation of a catalytic naphtha reforming unit W. Eur. Fed. Chem. Eng. 1983, 2, 1–7. [Google Scholar]
- Marin, G.; Froment, G. Reforming of C6 hydrocarbons on a PtAl2O3 catalyst. Chem. Eng. Sci. 1982, 37, 759–773. [Google Scholar] [CrossRef]
- Rodríguez, M.A.; Ancheyta, J. Detailed description of kinetic and reactor modeling for naphtha catalytic reforming. Fuel 2011, 90, 3492–3508. [Google Scholar] [CrossRef]
- Smith, R. Kinetic analysis of naphtha reforming with platinum catalyst. Chem. Eng. Prog. 1959, 55, 76–80. [Google Scholar]
- Jiang, H.; Sun, Y.; Jiang, S.; Li, Z.; Tian, J. Reactor model of counter-current continuous catalyst-regenerative reforming process toward real time optimization. Energy Fuels 2021, 35, 10770–10785. [Google Scholar] [CrossRef]
- Shakor, Z.M.; AbdulRazak, A.A.; Sukkar, K.A. A detailed reaction kinetic model of heavy naphtha reforming. Arab. J. Sci. Eng. 2020, 45, 7361–7370. [Google Scholar] [CrossRef]
- Iranshahi, D.; Bahmanpour, A.; Paymooni, K.; Rahimpour, M.; Shariati, A. Simultaneous hydrogen and aromatics enhancement by obtaining optimum temperature profile and hydrogen removal in naphtha reforming process; a novel theoretical study. Int. J. Hydrogen Energy 2011, 36, 8316–8326. [Google Scholar] [CrossRef]
- Mohaddeci, S.; Sadighi, S.; Zahedi, S.; Bonyad, H. Reactor modeling and simulation of catalytic reforming process. Pet. Coal 2006, 48, 28–35. [Google Scholar]
- Rahimpour, M.R.; Iranshahi, D.; Pourazadi, E.; Bahmanpour, A.M. Boosting the gasoline octane number in thermally coupled naphtha reforming heat exchanger reactor using de optimization technique. Fuel 2012, 97, 109–118. [Google Scholar] [CrossRef]
- Talaghat, M.R.; Roosta, A.A.; Khosrozadeh, I. A novel study of upgrading catalytic reforming unit by improving catalyst regeneration process to enhance aromatic compounds, hydrogen production, and hydrogen purity. J. Chem. Pet. Eng. 2017, 51, 81–94. [Google Scholar] [CrossRef]
- Askari, A.; Karimi, H.; Rahimi, M.R.; Ghanbari, M. Simulation and modeling of catalytic reforming process. Pet. Coal 2012, 54, 76–84. [Google Scholar]
- Boukezoula, T.F.; Bencheikh, L.; Belkhiat, D.E.C. A heterogeneous model for a cylindrical fixed bed axial flow reactors applied to a naphtha reforming process with a non-uniform catalyst distribution in the pellet. React. Kinet. Catal. Lett. 2020, 131, 335–351. [Google Scholar] [CrossRef]
- Lid, T.; Skogestad, S. Data reconciliation and optimal operation of a catalytic naphtha reformer. J. Process. Control 2008, 18, 320–331. [Google Scholar] [CrossRef]
- Otaraku, I.J.; Egun, I.L. Optimization of hydrogen production from nigerian crude oil samples through Continuous Catalyst Regeneration (CCR) reforming process using aspen hysys. Am. J. Appl. Chem. 2017, 5, 69–72. [Google Scholar] [CrossRef][Green Version]
- Jenkins, J.H.; Stephens, T.W. Kinetics of cat reforming. J. Hyd. Proc. 1980, 163–167. [Google Scholar]
- Ramage, M.P.; Graziani, K.R.; Krambeck, F. 6 Development of mobil’s kinetic reforming model. Chem. Eng. Sci. 1980, 35, 41–48. [Google Scholar] [CrossRef]
- Froment, G. The kinetics of complex catalytic reactions. Chem. Eng. Sci. 1987, 42, 1073–1087. [Google Scholar] [CrossRef]
- Weng, H.; Sun, S.; Jiang, H. Lumped model for catalytic reforming (I) establishment of the model. J. Chem. Ind. Eng.-China 1994, 45, 407. [Google Scholar]
- Taskar, U.; Riggs, J.B. Modeling and optimization of a semiregenerative catalytic naphtha reformer. AIChE J. 1997, 43, 740–753. [Google Scholar] [CrossRef]
- Vathi, G.P.; Chaudhuri, K.K. Modelling and simulation of commercial catalytic naphtha reformers. Can. J. Chem. Eng. 1997, 75, 930–937. [Google Scholar] [CrossRef]
- Taghavi, B.; Fatemi, S. Modeling and application of response surface methodology in optimization of a commercial continuous catalytic reforming process. Chem. Eng. Commun. 2014, 201, 171–190. [Google Scholar] [CrossRef]
- Mahdavian, M.; Fatemi, S.; Fazeli, A. Modeling and simulation of industrial continuous naphtha catalytic reformer ac-companied with delumping the naphtha feed. Int. J. Chem. React. Eng. 2010, 8. [Google Scholar] [CrossRef]
- Ancheyta-Juárez, J.; Villafuerte-Macías, E. Kinetic modeling of naphtha catalytic reforming reactions. Energy Fuels 2000, 14, 1032–1037. [Google Scholar] [CrossRef]
- Krane, H.; Groh, A.; Schulman, B.; Sinfelt, J. Reactions in catalytic reforming of naphthas. In Proceedings of the 5th World Petroleum Congress, 1959; OnePetro: Richardson, TX, USA, 1959. [Google Scholar]
- Ancheyta-Juarez, J.; Villafuerte-Macias, E.; Diaz-Garcia, L.; Gonzalez-Arredondo, E. Modeling and simulation of four catalytic reactors in series for naphtha reforming. Energy Fuels 2001, 15, 887–893. [Google Scholar] [CrossRef]
- Yusuf, A.Z.; Aderemi, B.O.; Patel, R.; Mujtaba, I.M. Study of industrial naphtha catalytic reforming reactions via modelling and simulation. Processes 2019, 7, 192. [Google Scholar] [CrossRef]
- Elizalde, I.; Ancheyta, J. Dynamic modeling and simulation of a naphtha catalytic reforming reactor. Appl. Math. Model. 2015, 39, 764–775. [Google Scholar] [CrossRef]
- Hu, S.; Zhu, X.X. Molecular modeling and optimization for catalytic reforming. Chem. Eng. Commun. 2004, 191, 500–512. [Google Scholar] [CrossRef]
- Hou, W.; Su, H.; Hu, Y.; Chu, J. Lumped kinetics model and its on-line application to commercial catalytic naphtha reforming process. J. Chem. Ind. Eng. -China 2006, 57, 1605. [Google Scholar]
- Weifeng, H.; Hongye, S.; Shengjing, M.; Jian, C. Multiobjective optimization of the industrial naphtha catalytic reforming process. Chin. J. Chem. Eng. 2007, 15, 75–80. [Google Scholar] [CrossRef]
- Arani, H.M.; Shirvani, M.; Safdarian, K.; Dorostkar, E. Lumping procedure for a kinetic model of catalytic naphtha reforming. Braz. J. Chem. Eng. 2009, 26, 723–732. [Google Scholar] [CrossRef]
- Fazeli, A.; Fatemi, S.; Mahdavian, M.; Ghaee, A. Mathematical modeling of an industrial naphtha reformer with three adiabatic reactors in series. Iran. J. Chem. Eng. 2009, 28, 97–102. [Google Scholar] [CrossRef]
- Dong, X.-J.; He, Y.-J.; Shen, J.-N.; Ma, Z.-F. Multi-zone parallel-series plug flow reactor model with catalyst deactivation effect for continuous catalytic reforming process. Chem. Eng. Sci. 2018, 175, 306–319. [Google Scholar] [CrossRef]
- Wang, L.; Zhang, Q.; Liang, C. 38-lumped kinetic model for reforming reaction and its application in continuous catalytic reforming. CIESC J. 2012, 63, 1076–1082. [Google Scholar]
- Iranshahi, D.; Jafari, M.; Rafiei, R.; Karimi, M.; Amiri, S.; Rahimpour, M.R. Optimal design of a radial-flow membrane reactor as a novel configuration for continuous catalytic regenerative naphtha reforming process considering a detailed kinetic model. Int. J. Hydrogen Energy 2013, 38, 8384–8399. [Google Scholar] [CrossRef]
- Jafari, M.; Rafiei, R.; Amiri, S.; Karimi, M.; Iranshahi, D.; Rahimpour, M.R.; Mahdiyar, H. Combining continuous catalytic regenerative naphtha reformer with thermally coupled concept for improving the process yield. Int. J. Hydrogen Energy 2013, 38, 10327–10344. [Google Scholar] [CrossRef]
- Saeedi, R.; Iranshahi, D. Multi-objective optimization of thermally coupled reactor of CCR naphtha reforming in presence of SO2 oxidation to boost the gasoline octane number and hydrogen. Fuel 2017, 206, 580–592. [Google Scholar] [CrossRef]
- Saeedi, R.; Iranshahi, D. Hydrogen and aromatic production by means of a novel membrane integrated cross flow CCR naphtha reforming process. Int. J. Hydrogen Energy 2017, 42, 7957–7973. [Google Scholar] [CrossRef]
- Zagoruiko, A.N.; Belyi, A.S.; Smolikov, M.D.; Noskov, A.S. Unsteady-state kinetic simulation of naphtha reforming and coke combustion processes in the fixed and moving catalyst beds. Catal. Today 2014, 220, 168–177. [Google Scholar] [CrossRef]
- Babaqi, B.S.; Takriff, M.S.; Kamarudin, S.K.; Othman, N.T.A. Mathematical modeling, simulation, and analysis for predicting improvement opportunities in the continuous catalytic regeneration reforming process. Chem. Eng. Res. Des. 2018, 132, 235–251. [Google Scholar] [CrossRef]
- Babaqi, B.S.; Takriff, M.S.; Othman, N.T.A.; Kamarudin, S.K. Yield and energy optimization of the continuous catalytic regeneration reforming process based particle swarm optimization. Energy 2020, 206, 118098. [Google Scholar] [CrossRef]
- Al-Shathr, A.; Shakor, Z.M.; Majdi, H.S.; AbdulRazak, A.A.; Albayati, T.M. Comparison between artificial neural network and rigorous mathematical model in simulation of industrial heavy naphtha reforming process. Catalysts 2021, 11, 1034. [Google Scholar] [CrossRef]
- Ivanchina, E.; Chernyakova, E.; Pchelintseva, I.; Poluboyartsev, D. Mathematical modeling and optimization of semi-regenerative catalytic reforming of naphtha. Oil Gas Sci. Technol. Rev. d’IFP Energies Nouv. 2021, 76, 64. [Google Scholar] [CrossRef]
- Mohaddecy, S.R.S.; Sadighi, S.; Bahmani, M. Optimization of catalyst distribution in the catalytic naphtha reformer of Tehran Refinery. Pet. Coal 2008, 50, 60–68. [Google Scholar]
- Chen, W.; Biegler, L.T. Reduced Hessian based parameter selection and estimation with simultaneous collocation approach. AIChE J. 2020, 66, e16242. [Google Scholar] [CrossRef]
- McLean, K.A.P.; McAuley, K.B. Mathematical modelling of chemical processes-obtaining the best model predictions and parameter estimates using identifiability and estimability procedures. Can. J. Chem. Eng. 2012, 90, 351–366. [Google Scholar] [CrossRef]
- McLean, K.A.P.; Wu, S.; McAuley, K.B. Mean-squared-error methods for selecting optimal parameter subsets for estimation. Ind. Eng. Chem. Res. 2012, 51, 6105–6115. [Google Scholar] [CrossRef]
- Yao, K.Z.; Shaw, B.M.; Kou, B.; McAuley, K.B.; Bacon, D.W. Modeling ethylene/butene copolymerization with multi-site catalysts: Parameter estimability and experimental design. Polym. React. Eng. 2003, 11, 563–588. [Google Scholar] [CrossRef]
- Thompson, D.E.; McAuley, K.B.; McLellan, P.J. Parameter Estimation in a simplified MWD model for HDPE produced by a ziegler-natta catalyst. Macromol. React. Eng. 2009, 3, 160–177. [Google Scholar] [CrossRef]
- Aiello, J.P.; Jiang, Y.; Moebus, J.A.; Greenhalgh, B.R.; McAuley, K.B. Predicting polyethylene molecular weight and composition distributions obtained using a multi-site catalyst in a gas-phase lab-scale Reactor. Macromol. Theory Simul. 2021, 30, 2000079. [Google Scholar] [CrossRef]
- Cui, W.J.; McAuley, K.B.; Whitney, R.A.; Spence, R.E.; Xie, T. Mathematical model of polyether production from 1,3-propanediol. Macromol. React. Eng. 2013, 7, 237–253. [Google Scholar] [CrossRef]
- Antos, G.J.; Aitani, A.M.; Parera, J.M. Catalytic Naphtha Reforming: Science and Technology; Marcel Dekker Inc.: New York, NY, USA, 1995. [Google Scholar]
- Lee, S. Encyclopedia of Chemical Processing; Taylor & Francis US: New York, NY, USA, 2006. [Google Scholar]
- Charpentier, J. Hydrodynamic of two-phase ow in packed beds. J. Powder Bulk Solid Technol. 1978, 2, 53–60. [Google Scholar]
- Sa, M.; Mostoufi, N.; Sotudeh-Gharebagh, R. Modeling and simulation of continuous catalytic regeneration (CCR) process. Int. J. Appl. Eng. Res. 2011, 2, 115. [Google Scholar]
- Benitez, V.M.; Pieck, C.L. Influence of Indium Content on the Properties of Pt–Re/Al2O3 Naphtha Reforming Catalysts. Catal. Lett. 2009, 136, 45–51. [Google Scholar] [CrossRef]
- Mazzieri, V.; Pieck, C.; Vera, C.; Yori, J.; Grau, J. Effect of Ge content on the metal and acid properties of Pt-Re-Ge/Al2O3-Cl catalysts for naphtha reforming. Appl. Catal. A Gen. 2009, 353, 93–100. [Google Scholar] [CrossRef]
- Samoila, P.; Boutzeloit, M.; Benitez, V.; D’ippolito, S.A.; Especel, C.; Epron, F.; Vera, C.R.; Marécot, P.; Pieck, C.L. Influence of the pretreatment method on the properties of trimetallic Pt–Ir–Ge/Al2O3 prepared by catalytic reduction. Appl. Catal. A Gen. 2007, 332, 37–45. [Google Scholar] [CrossRef]
- Ren, X.-H.; Bertmer, M.; Stapf, S.; Demco, D.; Blümich, B.; Kern, C.; Jess, A. Deactivation and regeneration of a naphtha reforming catalyst. Appl. Catal. A Gen. 2002, 228, 39–52. [Google Scholar] [CrossRef]
- González-Marcos, M.; Iñarra, B.; Guil, J.; Gutiérrez-Ortiz, M. Development of an industrial characterisation method for naphtha reforming bimetallic Pt-Sn/Al2O3 catalysts through n-heptane reforming test reactions. Catal. Today 2005, 107–108, 685–692. [Google Scholar] [CrossRef]
- Hill, J.M.; Cortright, R.D.; Dumesic, J.A. Silica-and L-zeolite-supported Pt, Pt/Sn and Pt/Sn/K catalysts for isobutane dehydrogenation. Appl. Catal. A Gen. 1998, 168, 9–21. [Google Scholar] [CrossRef]
- Liu, K.; Fung, S.C.; Ho, T.C.; Rumschitzki, D.S. Kinetics of catalyst coking in heptane reforming over Pt−Re/Al2O3. Ind. Eng. Chem. Res. 1997, 36, 3264–3274. [Google Scholar] [CrossRef]
- Tailleur, R.G.; Davila, Y. Optimal Hydrogen Production through Revamping a Naphtha-Reforming Unit: Catalyst Deactivation. Energy Fuels 2008, 22, 2892–2901. [Google Scholar] [CrossRef]
- Liu, K.; Fung, S.C.; Ho, T.C.; Rumschitzki, D.S. Heptane reforming over Pt–Re/Al2O3: Reaction network, kinetics, and apparent selective catalyst deactivation. J. Catal. 2002, 206, 188–201. [Google Scholar] [CrossRef]


Disclaimer/Publisher’s Note: The statements, opinions and data contained in all publications are solely those of the individual author(s) and contributor(s) and not of MDPI and/or the editor(s). MDPI and/or the editor(s) disclaim responsibility for any injury to people or property resulting from any ideas, methods, instructions or products referred to in the content. |
© 2023 by the authors. Licensee MDPI, Basel, Switzerland. This article is an open access article distributed under the terms and conditions of the Creative Commons Attribution (CC BY) license (https://creativecommons.org/licenses/by/4.0/).