Abstract
To address the challenges of poor fluidity and low uniformity in conventional sugarcane fertilizer applicators, a novel dual-directional spiral fertilizer applicator has been developed. The working principle of the applicator is explained, and, after analyzing the agronomic requirements for sugarcane, the parameter range for key components of the applicator is determined. The spiral blade’s diameter, pitch, and rotational velocity are chosen as the experimental factors, with the average fertilizer discharge uniformity as the evaluation criterion. Virtual simulation experiments are conducted using the discrete element method and a quadratic regression orthogonal rotating combined design. Regression models for the evaluation criterion and various experimental factors are obtained. Additionally, a dataset created from these experiments was then used to construct an artificial neural network (ANN) prediction model. Response surface methodology (RSM) and the ANN were both used to analyze and predict the outcomes. The results indicate that the artificial neural network outperforms response surface methodology in terms of better fitting capability and higher prediction accuracy. The determination coefficient, mean squared error, and root mean square error are 0.99629, 0.99163, 0.07763, 0.17498, 0.27862, and 0.41831, respectively. When comparing the two models, the optimal parameter combination is determined to be a diameter of 90.1669 mm, a pitch of 59.7407 mm, and a rotational speed of 53.8944 r/min, resulting in an average fertilizer discharge uniformity of 92.0670%. An experiment with these parameters confirmed the simulated findings, revealing a maximum discrepancy of 2.4%. This study offers valuable insights into optimizing spiral fertilizer applicators.
1. Introduction
Sugarcane, which holds significant importance as a cash crop in China, is mainly cultivated in the provinces of Yunnan, Guangxi, and Guangdong. China is ranked as the third largest producer in the world, trailing behind Brazil and India [1,2]. The yield and quality of sugarcane have a direct impact on the economic income of farmers and the country’s overall economic interests [3,4]. Notably, the fertilization of sugarcane, a crucial aspect of its production, profoundly affects its growth and yield [5,6]. However, current traditional methods for sugarcane fertilization present several issues, such as uneven distribution of fertilizers, inadequate or excessive use of chemical fertilizers, and improper timing of fertilization. These challenges lead to high production costs, significantly hinder yield, and cause ecological pollution [7,8,9]. Consequently, it is crucial to investigate methods and techniques for precise fertilization to promote the green and healthy growth of sugarcane.
In recent studies, scholars around the world have delved into refining the design and assessing the efficacy of fertilizer discharger mechanisms. Kemoh Bangura et al. [10] designed a spiral groove wheel fertilizer discharger and compared its fertilization performance with that of traditional structures using discrete element methodologies. It was found through experiments that the improved structure exhibited better fertilizer discharge performance compared to the traditional structure, providing theoretical guidance for the improvement of fertilizer applicators. Zha et al. [11] presented a unique blocking wheel-type screw distribution system. Utilizing the EDEM software, they executed single-variable tests and orthogonal simulations. Upon determining the optimal parameters at low speeds, these findings were corroborated with physical bench tests. Zhan et al. [12] designed a dual-spiral ditching system tailored for tea plantations. Optimization techniques, such as quadratic regression orthogonal rotation testing, were employed, resulting in the development of a model outlining the rate of fertilizer application and its variation coefficient. Experimental results demonstrated that the applicator successfully met the fertilization requirements in tea gardens. Sun et al. [13] delved into the dynamics of particle velocity and force during the fertilizer discharge phase using discrete element simulation software. By examining particles under varied helix angles, they pinpointed the most favorable parameters. The results from both the simulation and experimental studies demonstrated minimal errors, thereby indicating the practical engineering application value of this research. Yang et al. [14] analyzed the impact of different parameters of the fertilizer discharge outlet in a spiral fertilizer discharger on its fertilizer discharge performance using the discrete element method and bench experiments. To achieve precise fertilizer discharge and enhance discharge uniformity, Dun et al. [15] researched the movement patterns of fertilizers and the underlying mechanics during release. They optimized the traditional fertilizer discharger structure and performed simulation experiments using EDEM. They discerned that their enhanced structure surpassed its traditional counterpart in ensuring even fertilizer spread. It is clear that the discrete element method has carved its niche as an invaluable tool in advancing agricultural engineering designs for fertilizer mechanisms [16].
An artificial neural network (ANN) operates as a computational system, reflecting the complexities of biological neural networks through a multitude of interconnected simulated neurons [17]. By modulating the connection weights among these neurons, ANNs discern critical features and patterns from raw data, rendering them essential for prediction and classification purposes. ANNs are distinguished by their exceptional predictive accuracy and capacity to process extensive, complex datasets. Moreover, they exhibit robustness to minor perturbations, adapting seamlessly to input variations and noise [18]. Currently, artificial neural network models are mainly used for the optimization of food and bioprocess parameters and have not been widely used in the optimization of structural parameters [19,20], but there are a few studies on the prediction of fertilizer discharge performance of fertilizer applicator [21,22]. Bu et al. [23] used EDEM simulation software to investigate how the rotational velocity and aperture degree of the fertilizer discharge wheel affect fertilizer application performance. The simulation considered various parameter combinations to model the fertilizer discharge process, and a neural network model was developed to predict fertilizer discharge. Additionally, an optimization model for controlling the sequence of fertilizer discharge was established using the differential evolution algorithm. The experimental results demonstrated that the fertilizer discharge consistently met the production requirements with accuracy and uniformity. This study aims to compare RSM and the ANN in evaluating the operational efficiency of the fertilizer applicator and identifying optimal parameter combinations for its essential components.
In this paper, a bidirectional spiral fertilizer applicator is designed, incorporating an analysis of the agronomic requirements for establishing the parameter range for key components of the fertilizer applicator and the factors affecting the fertilizer discharge performance are analyzed for the movement process of fertilizer particles. Using the EDEM software, a virtual simulation experiment was conducted by considering the diameter, pitch, and rotation speed of the spiral blades as experimental factors. Based on the experimental results, an artificial neural network model was developed. The predictive capability and accuracy of the two models in estimating the average uniformity of the fertilizer discharge were compared and analyzed. By identifying the optimal parameter combination, the parameters of the fertilizer discharger were optimized. Subsequently, 3D printing technology was employed to fabricate the optimized parameters of the fertilizer discharger, which were then subjected to experimental validation with the aim of enhancing the uniformity of the fertilizer discharge from the fertilizer applicator.
2. Materials and Methods
2.1. General Structure and Operational Principle
The bidirectional spiral fertilizer applicator comprises several components: a fertilizer tank, a servo motor, a servo reducer, bearings, a fertilizer discharge port, a fertilizer discharge box, and a spiral blade. The structure of the applicator is illustrated in Figure 1, with the spiral blades playing a crucial role in the fertilizer applicator during the fertilization process.
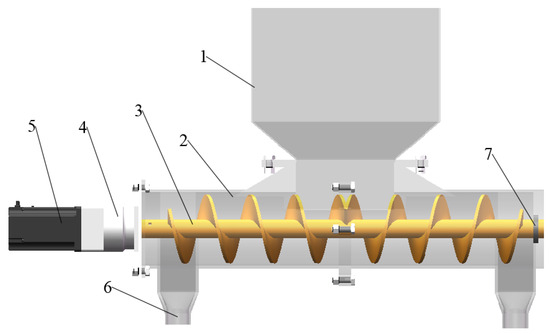
Figure 1.
Schematic representation of the spiral fertilizer applicator’s structure: 1. fertilizer tank, 2. fertilizer discharge box, 3. spiral blades, 4. speed reducer, 5. servo motor, 6. fertilizer outlet, 7. bearing.
During operation, the fertilizer particles descend from the fertilizer tank into the fertilizer discharge box under the influence of gravity. The spiral blades within the fertilizer discharge box are rotated by a servo motor, and their velocity is precisely adjusted through a computerized control system. As the fertilizer particles move, they overcome the gravitational force and surface resistance and are uniformly guided toward the dispersal end by the spiral blade, thereby ensuring a consistent and controlled release.
2.2. Analysis of the Agronomic Requirements for Sugarcane
Sugarcane, a crop known for its long growth cycle and tall plants, has a significant demand for essential nutrients, such as nitrogen, phosphorus, and potassium. The successful growth of sugarcane heavily relies on favorable soil and climate conditions, with optimal temperatures between 20 °C and 35 °C. Higher temperatures coupled with ample sunlight play a vital role in promoting photosynthesis in sugarcane. Moreover, sugarcane necessitates deep soil layers enriched with nutrients to thrive. However, the nutrient content of the soil itself often falls short of meeting the growth requirements of sugarcane and lacks essential trace elements [24]. Therefore, in the later stages of fertilization, it is necessary to supplement nutrient elements by applying additional fertilizer. According to the literature, it is recommended to apply urea at a rate from 450 kg/hm to 600 kg/hm for sugarcane cultivation and fertilization. Additionally, potassium chloride or potassium sulfate can be applied at a rate from 450 kg/hm to 525 kg/hm. Alternatively, a specialized compound fertilizer can be used at a rate of 1500 kg/hm, along with soil cultivation and mulching. This study focuses on urea particles and designs a fertilizer applicator based on the agronomic requirements during plowing, soil cultivation, and the fertilization period.
2.3. Design of Structural Parameters of Fertilizer Applicator
A primary metric to assess the capability of a fertilizer applicator lies in its discharge quantity. The spiral blade is a crucial component in the fertilizer discharge process. In order to calculate its parameters, the volume of fertilizer discharge from this applicator should align with the fertilizer discharge volume required for sugarcane agronomy. The amount of fertilizer discharge from the spiral fertilizer applicator can be calculated using Equation (2) [25]. According to the literature [26], Equation (1) describes the relation from which the agronomic requirement for the fertilizer discharge amount during field operations is computed.
where Q represents the desired fertilizer application rate, kg/hm; q is the fertilizer application rate per unit time of a single fertilizer applicator, g/min; N denotes the number of fertilizer applicators; v represents the operational velocity of the fertilizer applicator, km/h; and B is the distance between working rows, m.
where Q signifies the quantity of fertilizer applied by the fertilizer applicator, t/h; D denotes the dimension of the spiral blade’s diameter, mm; n represents the rotational speed of the fertilizer discharge shaft, r/min; S signifies the pitch of the spiral blade, mm; is the density of the granular fertilizer, t/m; is the conveying coefficient; and represents the filling coefficient.
The diameter of the spiral blade is a crucial factor in determining the discharge amount of the fertilizer applicator. It is typically determined based on various factors, including the fertilizer applicator’s structure, the physical properties of the particles, and the desired discharge capacity [25]. The ensuing equation delineates how to ascertain the diameter of the helical blade:
where Q represents the fertilizer discharge rate, t/h; D denotes the dimension of the spiral blade’s diameter, mm; represents the ratio of pitch to diameter; A represents the comprehensive characteristics of the fertilizer coefficients, where A = 28; represents the bulk density of the fertilizer, t/m; represents the inclined conveying coefficient, typically set to = 1 for horizontal installation; and represents the filling factor, using = 3.
Based on the calculation formula, the diameter is determined to be 78–96 mm.
The magnitude of the pitch plays a vital role in determining the fertilizer discharge capacity. When the conveying capacity and the diameter of the spiral blade remain constant, changing the pitch will impact the slipping surface of the fertilizer particles. Additionally, the pitch size also influences the velocity distribution. Increasing the pitch leads to an increase in the axial velocity of the spiral axis, but it may result in an uneven tangential velocity distribution. Conversely, decreasing the pitch promotes a more uniform distribution of the velocity components but reduces the axial velocity of the spiral blade [27]. Formula (6) can be used to calculate the pitch, and it is recommended to use a pitch range of 40–60 mm.
where represents the proportional relationship between the pitch and the diameter of the spiral blades. In the case of a horizontally positioned fertilizer applicator, is typically from 0.5 to 0.9; D denotes the dimension of the spiral blade’s diameter, mm.
The conveying capacity of the fertilizer applicator is heavily impacted by the rotational speed of the spiral blade. Generally, an increase in rotational speed corresponds to a higher discharge rate of fertilizer, while a decrease in rotational speed corresponds to a lower discharge rate. However, the rotational speed should not be too high. When the rotational speed reaches a certain limit, the centrifugal force acting on the fertilizer particles will be large, causing them to be ejected outward, which hinders the proper functioning of the fertilizer applicator. Therefore, it is necessary to limit the rotational speed of the discharge blade [22]. By using the empirical Formula (7), the maximum rotational speed is determined to be 100.26 r/min.
where is the maximum rotational speed of the spiral blade, r/min; A is the integrated characteristic coefficient of the fertilizer; and D denotes the dimension of the spiral blade’s diameter, mm.
2.4. Analysis of the Motion of Fertilizer Particles
Within the power propulsion mechanism, the left flank of the fertilizer applicator houses a motor, assigned to instigate the rotation of the spiral blade. As this blade engages with the fertilizer granules, it undergoes the synergistic influence of both the blade’s inherent thrust, denoted as , and the frictional force, , arising from the interface between the blade and the granules [25,28]. Such interactions instigate a helical trajectory counter to the blade’s rotation, implying a dual-motion pattern in the fertilizer particles. They not only undergo a circumferential trajectory synchronously with the spiral blade but also shift rightward along the rotational axis, adopting an axial pathway, a phenomenon captured in Figure 2.
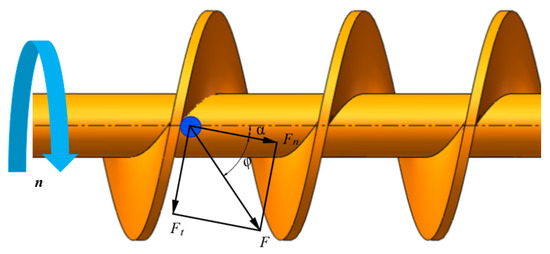
Figure 2.
Diagram of force analysis for fertilizer particles. is the angle of the helix of the blade, while is the angle of friction between the particles and the blade.
Under the collective action of force F, the fertilizer particles undergo compound motion on the spiral blade, with a tangential velocity and an axial velocity . The resultant velocity V is depicted in Figure 3. When the spiral blade rotates at a speed of n, vector in Figure 3 represents the tangential velocity of the fertilizer particles. This relationship can be deduced from the geometry of the triangle OAB:
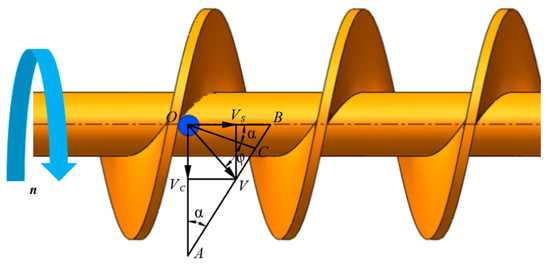
Figure 3.
Diagram of fertilizer particle velocity decomposition.
The spiral angle of ascent = arctan() and the coefficient of friction between the blade = tan are inserted into the formula to derive the resulting equation:
The formula above shows that the tangential velocity and axial velocity of the fertilizer particles on the spiral blade depend on factors such as rotational speed, pitch, friction coefficient , and radius R. Therefore, by selecting the appropriate structural parameters of the spiral blade, it is possible to effectively enhance the working efficiency of the fertilizer applicator.
2.5. Test Method
2.5.1. Simulation Model and Parameter Setting
For a comprehensive understanding of how the main components of the fertilizer applicator influence its functionality, we conceived a full-scale model of the bidirectional spiral applicator. Streamlining the model for efficient simulation, it was formatted as an STL file in the Solidworks environment. This refined model was later transitioned into the EDEM2018 platform for further analysis. Positioned above the storage area for fertilizers, we established a particle factory to oversee the downward motion of fertilizer granules at a consistent velocity of 3 m/s. The experiment employed commonly available urea granules. We captured their tri-dimensional size distribution through meticulous measurements, finalizing the urea granule model dimensions at 4.00 mm × 3.30 mm × 3.30 mm. During the simulations, the generation of urea granules adhered to a normal distribution pattern with a variance of 0.05 in its standard deviation. Figure 4 illustrates the established model of the urea particles, alongside the actual particle model.
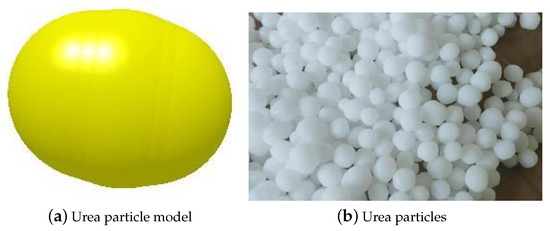
Figure 4.
Modeling of the fertilizer particles.
In our simulations, we employed the Hertz–Mindlin (no slip) optimal contact model to effectively capture interactions: both between urea entities and also between these granules and the applicator’s housing [29,30]. The shell of the applicator utilizes ABS plastic as its material, in contrast to the fertilizer box, which is crafted from stainless steel. The simulation parameters, including material properties and contact mechanics parameters, are listed in Table 1 based on the relevant literature [31,32,33]. The time increment is defined as 20% of the Rayleigh Time Step, with data being recorded at 0.05 s intervals. Additionally, the mesh dimensions are twice those of the minimum spherical element.

Table 1.
Configuration of the simulation parameters.
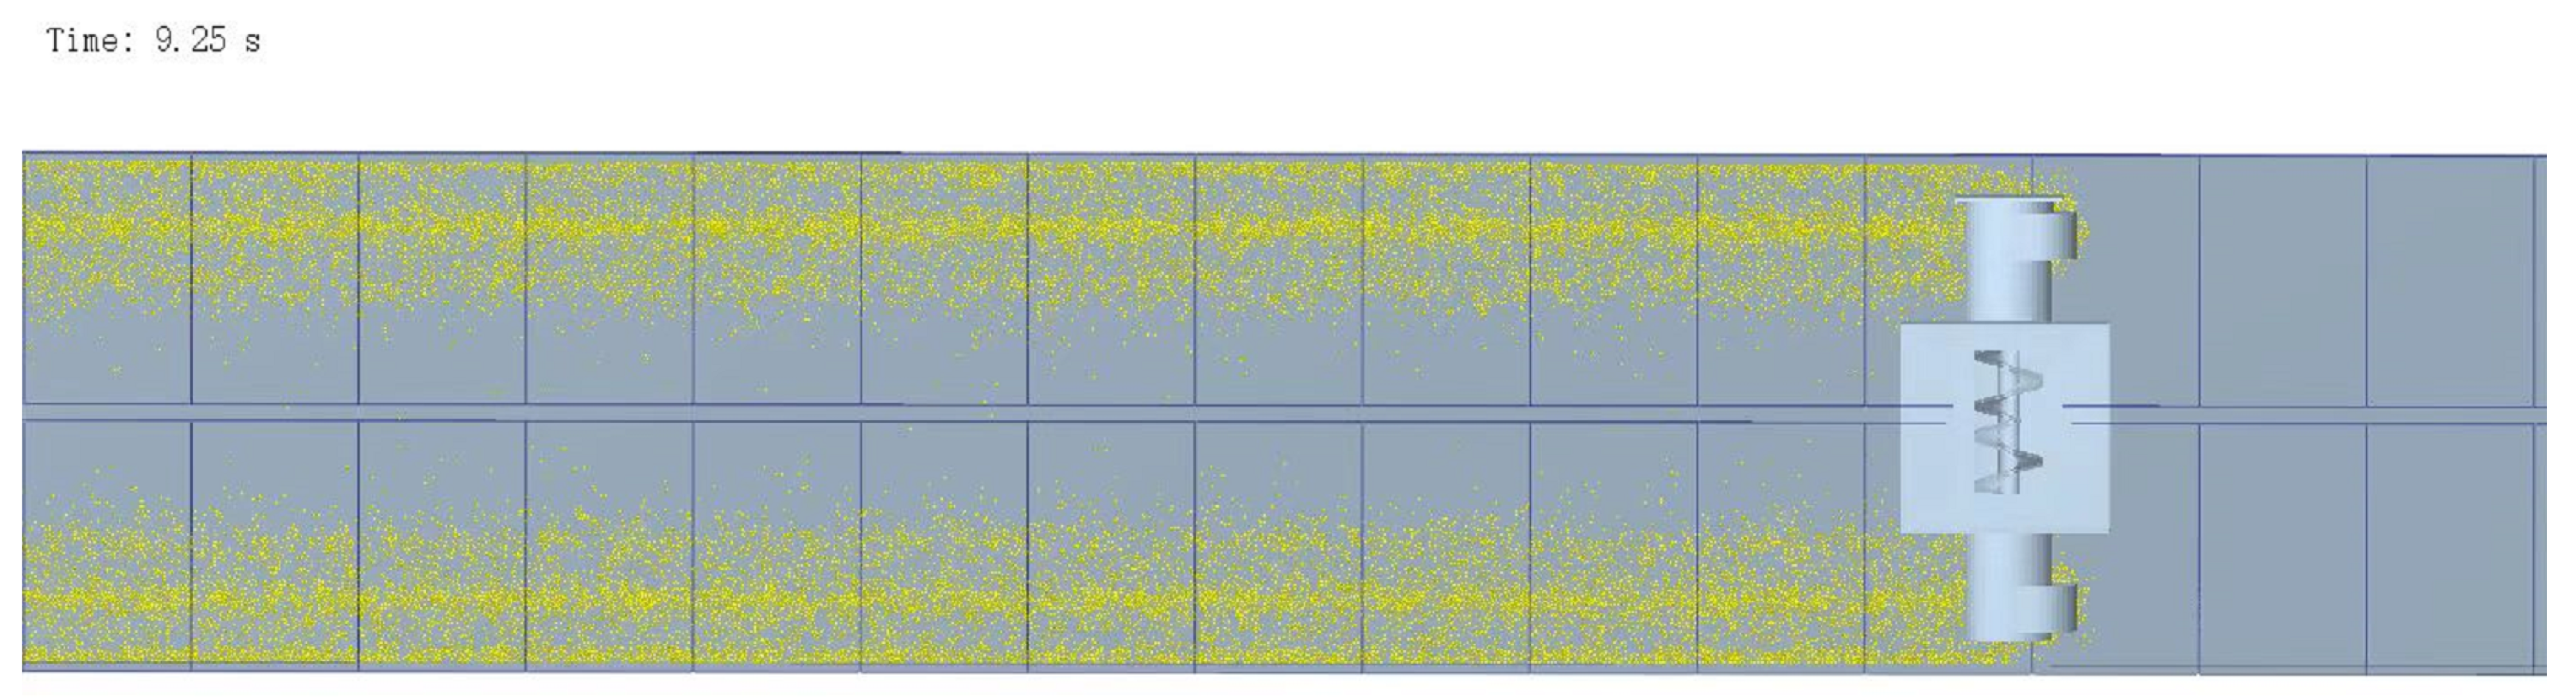
To investigate dynamic fertilizer discharge performance and discharge uniformity, the fertilizer applicator was imported into the EDEM 2018 software as a simplified model in the STL file format. A virtual pellet factory was constructed above the fertilizer applicator, generating fertilizer pellets at a rate of 40,000 pellets per second, resulting in a total of 80,000 pellets. The process of pellet generation lasted for 2 s, during which the spiral blades started rotating at 2 s. Directly below the fertilizer applicator, a fertilizer collection tank measuring 9000 mm in length and 620 mm in width was positioned at a 100 mm distance to collect the fertilizer. Two data collection zones were placed on the collection tank, with one below each fertilizer outlet. Each data collection zone was divided into three sections; each section was at least 2 m long. These sections were further divided into small segments of 20 cm. Within each statistical area, a total of 30 grids measuring 200 mm in length and 300 mm in width were established [34]. These grids were used for collecting quality statistics and simulating the operation of the fertilizer applicator. The forward speed of the fertilizer applicator was set to 1 m/s to replicate normal operational speed. The entire simulation lasted for 13 s, with the first two seconds representing the period when the fertilizer particles were generated. After 2 s, the spiral blade started moving uniformly in a linear motion along the collection tank due to its rotational speed. Following the simulation, EDEM post-processing was employed to analyze and record fertilizer quality data in each grid using the Grid Bin Group method. The simulation process is illustrated in Figure 5.
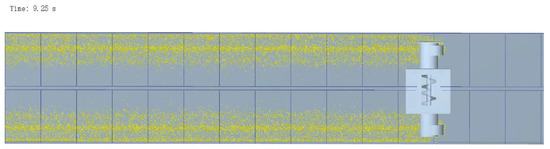
Figure 5.
Simulation process.
2.5.2. Evaluation Index
For a precise assessment of the performance of the fertilizer applicator in terms of dispensing, we utilize the average discharge uniformity of the fertilizer as a key evaluation metric [34]. Within the confines of the simulated experiment, fertilizer quality in the observed region undergoes a statistical review based on predefined detection benchmarks. For every set of observational zones, parameters such as the mean mass of discharged fertilizer, the standard deviation, the coefficient depicting variation in the uniformity of the discharge, and the overall discharge uniformity are deduced. A superior discharge performance is indicated by an elevated uniformity value, whereas a diminished value suggests the contrary. Such an evaluative metric is of paramount importance in the realm of agricultural production oversight and in enhancing the efficacy of fertilizer use. The computation for the average discharge uniformity of the fertilizer is represented through the ensuing equation:
where represents the average mass of fertilizer within each interval, g; n represents the number of predefined statistical areas, with a value of 30 for this paper; S denotes the standard deviation of the total mass of fertilizer particles; denotes the coefficient of variation; and U is the fertilizer discharge uniformity.
2.5.3. Design of Single-Factor Tests
The uniformity of the fertilizer discharge, which is a crucial metric for assessing the performance of a fertilizer applicator, is often influenced by its working parameters. To delve into the influence exerted by these parameters on our evaluation metrics, our experimental design focused on three primary variables: the spiral blade’s diameter, pitch, and rotational speed. We considered the uniformity of the fertilizer discharge as the primary outcome measure. To capture a comprehensive spectrum of outcomes, five distinct levels for each parameter were established based on the calculated ranges of these crucial components [35]. In the single-factor experiment, one factor varied within its five-level range, while the remaining two elements remained unchanged at their respective intermediate values. The insights from these trials are consolidated in Table 2.
Table 2.
Result of single-factor tests.
2.5.4. Design of Response Surface Test
In order to investigate the influence of key component parameters and the interaction effects among factors on the evaluation metrics, we focused on the experimental factors A (diameter of the spiral blade), B (pitch), and C (rotational speed) in the context of a spiral fertilizer applicator. The evaluation index was the average uniformity of the fertilizer discharge. The Box–Behnken experimental design method, implemented via the Design-Expert 13 software, was utilized to establish a factorial design with three factors and three levels [36]. Simulation experiments were performed using simulation software to replicate the operational process of the fertilizer applicator under diverse parameter combinations. The objective was to investigate the optimal combination of operational parameters for the fertilizer applicator. A detailed factor coding for our simulation trials can be gleaned from Table 3.
Table 3.
Coding of factors.
2.5.5. Design of an Artificial Neural Network Model
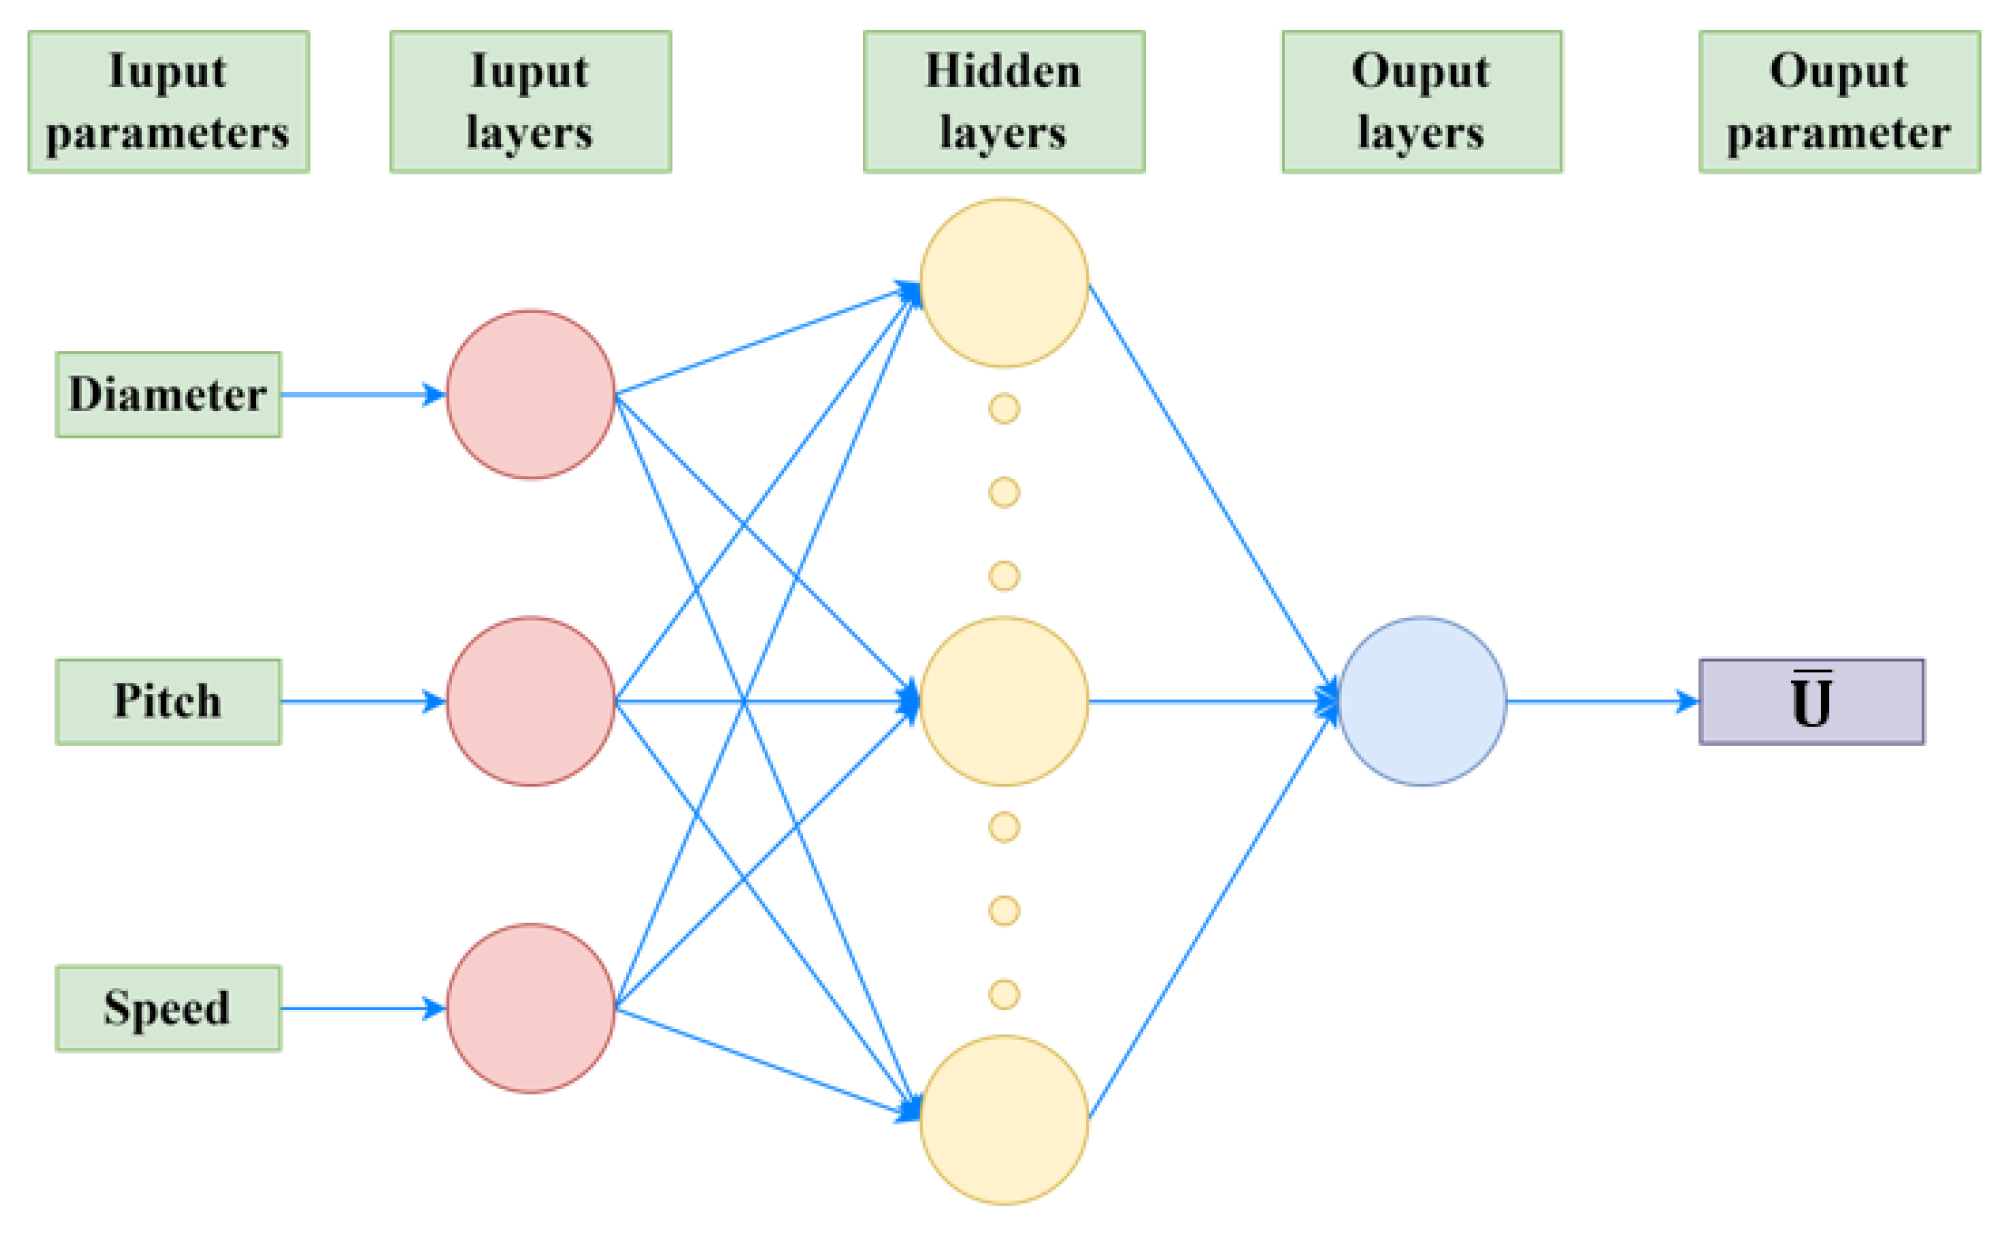
The present study employed a 3-layer feedforward backpropagation neural network built on Matlab (2021b) software. The network architecture comprises an input layer, a hidden layer, and an output layer, as depicted in Figure 6. The input layer encompasses spiral blade diameter, pitch, and rotational speed as input neurons, while the average fertilizer discharge uniformity is the output layer. The TANSIG and PURELIN transfer functions are applied for modeling the hidden layer and output layer neurons, respectively. The Levenberg–Marquardt algorithm is utilized for training the topology structure of the artificial neural network (ANN) [37]. The artificial neural network (ANN) is subjected to 1000 training cycles, employing a learning rate of 0.01 and a training error target of 0.001. The experimental results obtained from the response surface analysis serve as the dataset for constructing the ANN model. However, due to the limited number of samples, the learning capability and accuracy of the ANN model may be compromised, resulting in overfitting [38]. To enhance the performance of the ANN model, virtual samples are generated by incorporating factors such as machining process tolerances, experimental errors, and motor control parameter errors. These factors introduce fluctuations in the independent variables while keeping the output values constant. In this study, an error margin of ±0.1% is set. A three-factor three-level orthogonal test table is utilized to generate four virtual samples for each actual sample. Consequently, a total of 85 ANN experimental samples is obtained, with 70% randomly selected for network training, 15% for testing, and 15% for validation [39].
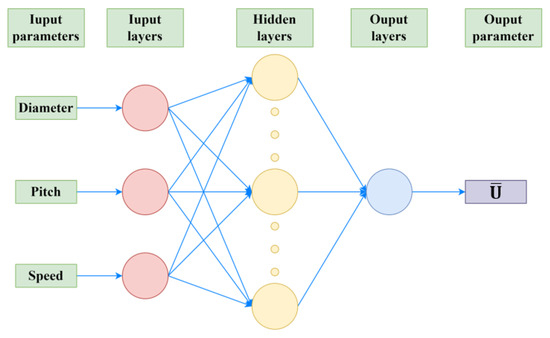
Figure 6.
Schematic diagram of the ANN model of this study.
3. Results
3.1. Analysis of Single-Factor Test Results
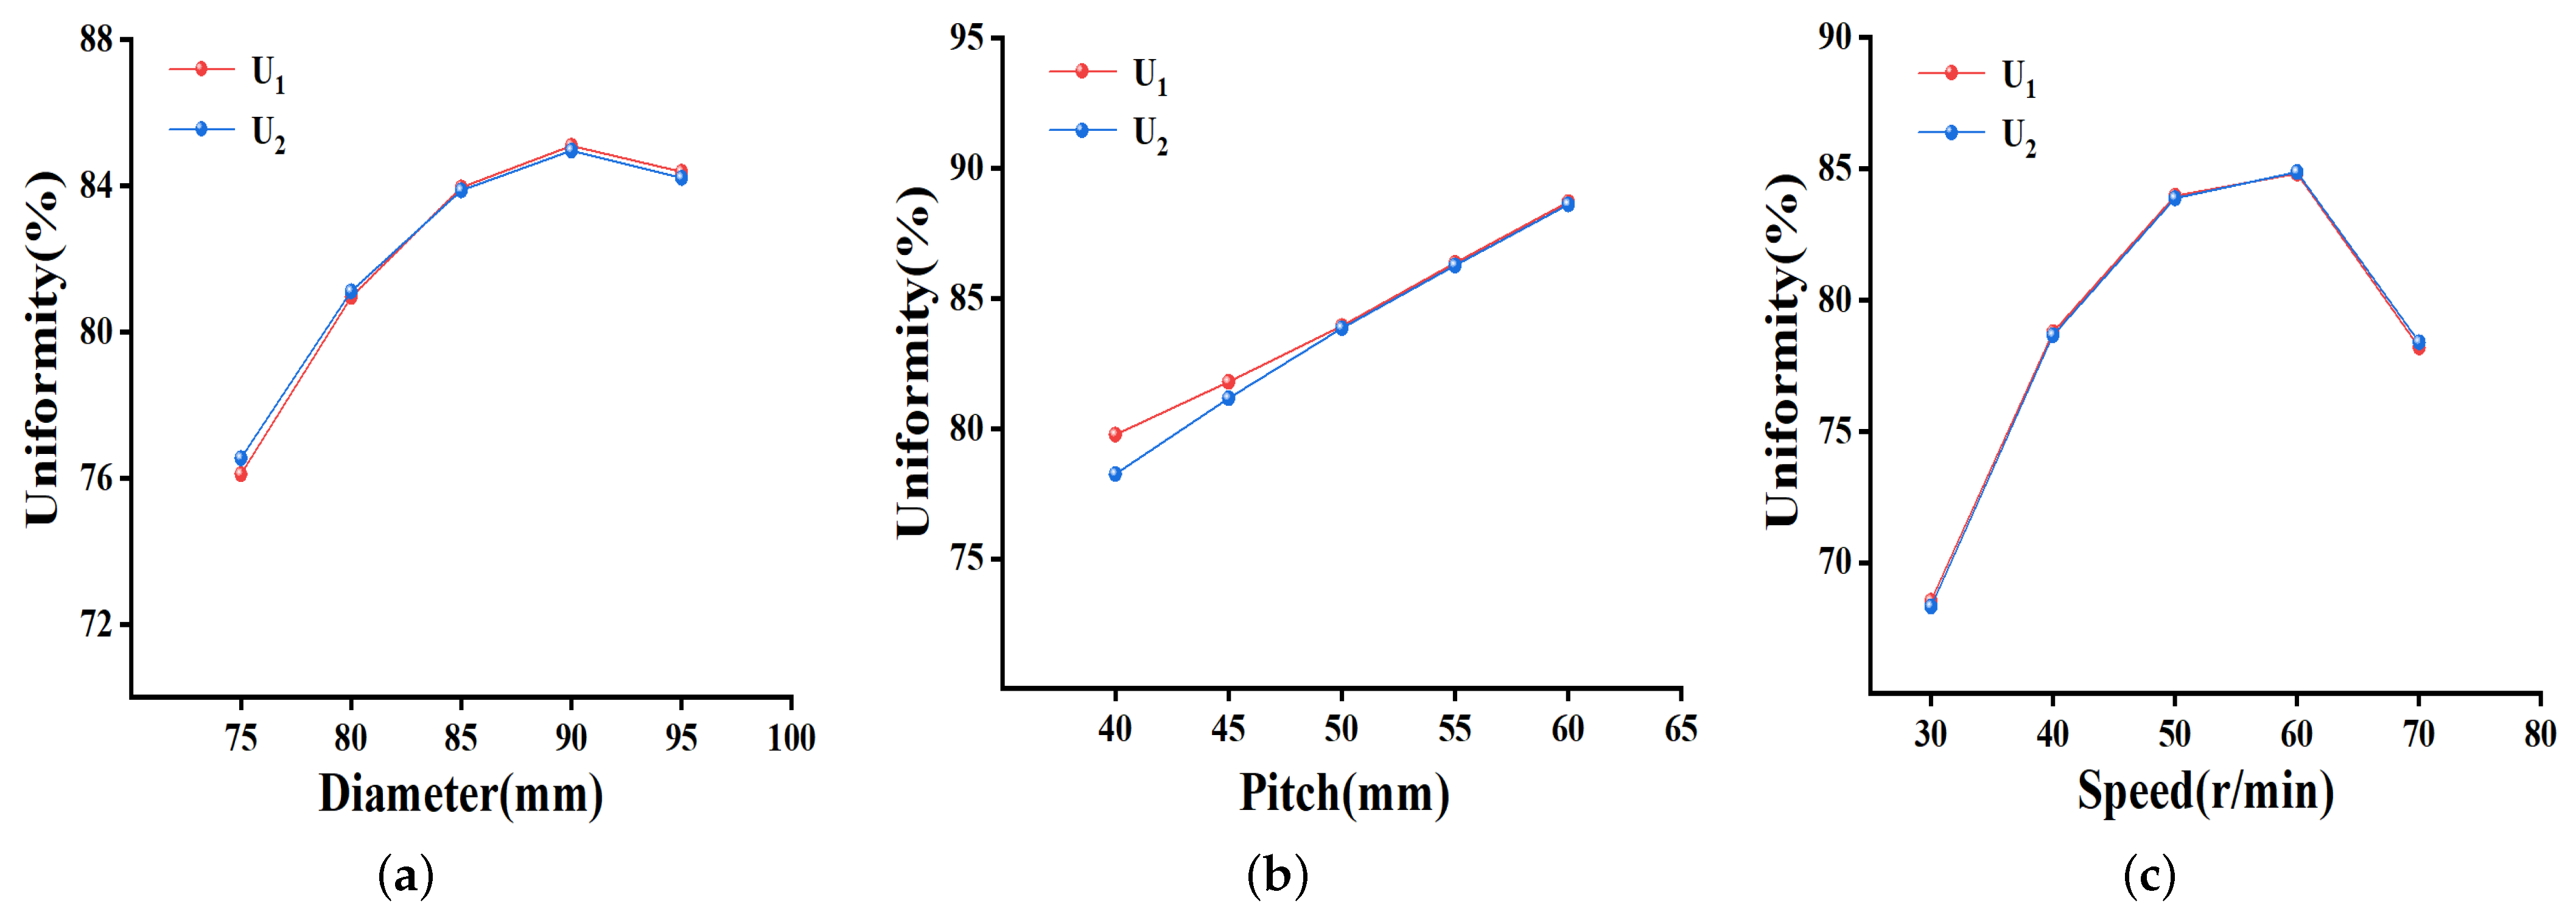
Figure 7 presents the results from the single-factor experiments. With constant parameters, a spiral blade pitch of 50 mm, and a rotational speed of 50 r/min, this study examined the impact of varying spiral blade diameters (from 75 mm to 95 mm) on the uniformity of the fertilizer discharge. As depicted in Figure 7a, there is an initial increase in the uniformity of the fertilizer discharge as the blade diameter expands, but this subsequently plateaus. The peak uniformity is observed when the blade diameter approaches 90 mm. This pattern might correlate with the augmentation of the fertilizer’s filling coefficient as the blade diameter enlarges. However, surpassing certain diameter thresholds can induce non-uniform fertilizer distribution in specific discharge areas.
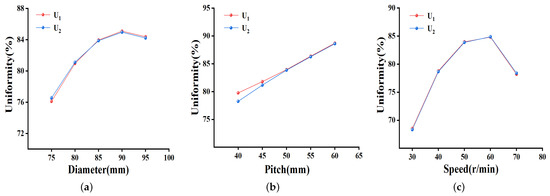
Figure 7.
The impact of different factors: (a) effect of diameter on uniformity of fertilizer discharge; (b) effect of pitch on uniformity of fertilizer discharge; (c) effect of rotational speed on uniformity of fertilizer discharge.
By fixing the spiral blade diameter to 85 mm and the rotational speed to 50 r/min, the impact of the different pitches of the spiral blade (40 mm, 45 mm, 50 mm, 55 mm, and 60 mm) on the fertilizer discharge uniformity was investigated. Figure 7b illustrates that as the pitch of the helical blades increases, there is a gradual improvement in the uniformity of the fertilizer discharge. This can be attributed to the fact that larger pitches allow for greater fertilizer capacity within each blade revolution. Consequently, a higher degree of stability in the amount of discharged fertilizer during each revolution is achieved, resulting in enhanced uniformity of the fertilizer discharge under specific parameter combinations.
By maintaining a spiral blade diameter of 85 mm and a pitch of 50 mm, the impact of various rotational speeds of the spiral blade (30 r/min, 40 r/min, 50 r/min, 60 r/min, and 70 r/min) on fertilizer discharge uniformity was investigated. The outcomes, as depicted in Figure 7c, reveal a gradual enhancement in the uniformity of the fertilizer discharge with the increasing rotational speed of the spiral blade. However, within the range of 60–70 r/min, a decrease in uniformity is observed. This can be attributed to the fact that higher rotational speeds result in a greater quantity of fertilizer being distributed within a single revolution, thus promoting greater stability in the fertilizer discharge within a specific area. However, surpassing a certain threshold of rotational speed may lead to excessive or insufficient fertilizer distribution within a specific area, resulting in a decline in the uniformity of the fertilizer discharge.
3.2. Analysis of Response Surface Test Results
Table 4 provides an in-depth overview of the experimental methodology and the corresponding results. From the experiments, it can be concluded that the average uniformity of the fertilizer discharge varies under different parameter combinations. Based on the data samples in Table 4, a quadratic regression mathematical model between the average uniformity of the fertilizer discharge and the experimental factors can be established as follows:
Table 4.
The scheme and results of the simulation test.
Table 5 exhibits the analysis of variance for the model, which reveals an value of 0.9916. The p-value of the regression model is found to be less than 0.0001, indicating its high degree of significance. Moreover, the lack-of-fit test displays a p-value greater than 0.05, signifying that the lack-of-fit observed in the model is not significant, therefore indicating its strong fit for the regression analysis. Further examination of the p-values associated with spiral blade diameter, pitch, and rotational speed suggest that spiral blade pitch and rotational speed exert a highly significant impact on the average uniformity of the fertilizer discharge, whereas the spiral blade diameter significantly influences the average uniformity of the fertilizer discharge. Among the quadratic terms, does not have a significant effect on the average uniformity of the fertilizer discharge, whereas and have a highly significant impact. Regarding the interaction terms, AC and BC do not significantly affect the average uniformity of the fertilizer discharge, while AB has a significant influence. According to the F-values of the linear terms, the factors that have the greatest impact on the average uniformity of the fertilizer discharge, in decreasing order, are the spiral blade rotational speed, pitch, and diameter. This finding provides theoretical support for optimizing the mechanism of the fertilizer applicator.
Table 5.
The analysis of variance for the regression model.
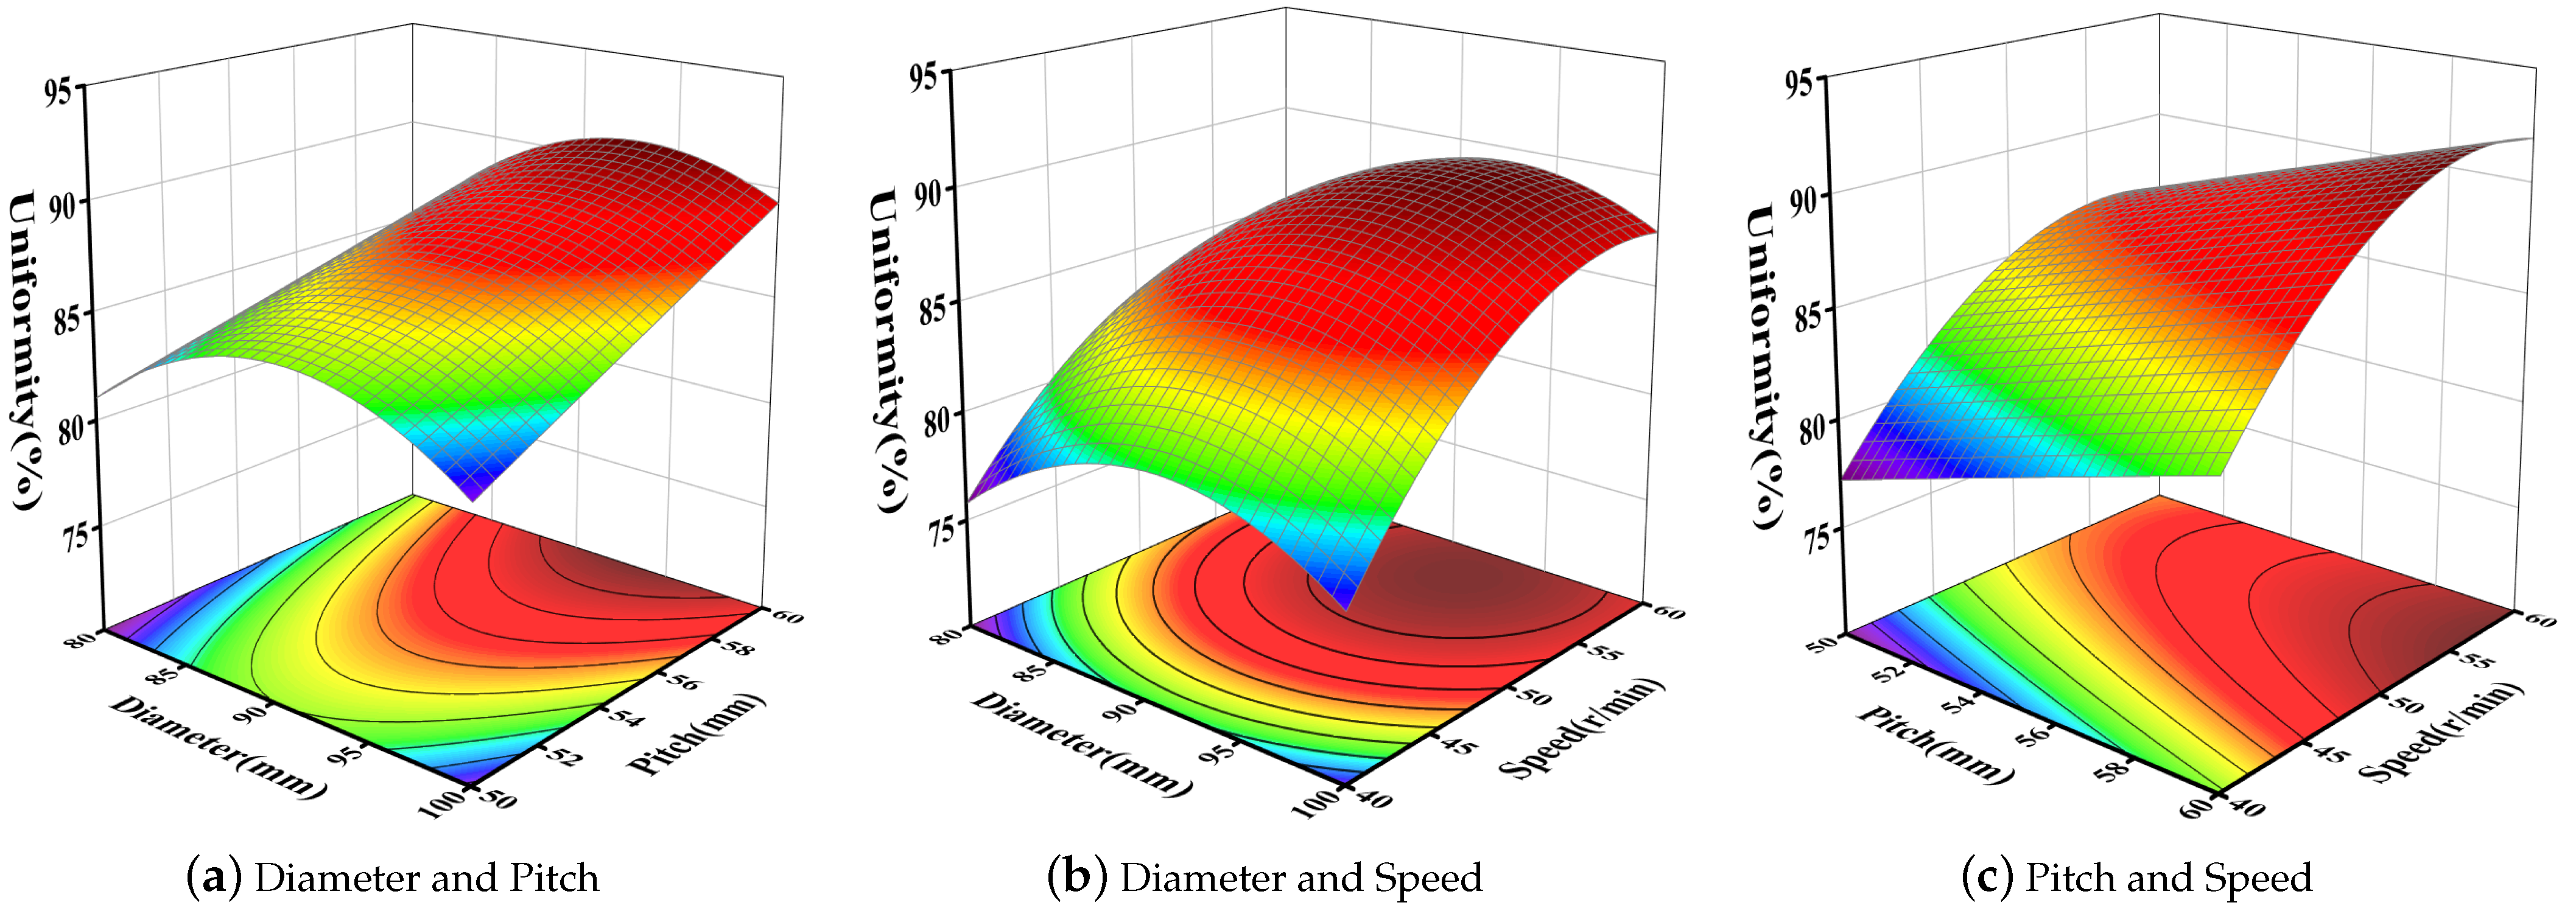
To gain a visual insight into the interplay of different experimental parameters, response surface representations were formulated through regression outcomes in the Origin2019 software framework. Figure 8a illustrates this interaction, particularly between the spiral blade’s diameter and its pitch, set at a 50 r/min rotational pace. It is evident from the data that there is an initial surge in the average fertilizer discharge uniformity as the blade diameter elevates under specific pitch conditions. This is then followed by a diminishing trend. Simultaneously, when assessing the same blade diameter, an extended pitch corresponds to a superior average discharge uniformity. The ratio between pitch and diameter stands out as a substantial determinant of discharge uniformity. Peak average fertilizer discharge uniformity is discernible when the blade diameter is between 90 and 95 mm, and the pitch ranges from 55 to 60 mm.

Figure 8.
Effects of interaction factors on average uniformity of fertilizer discharge.
Figure 8b presents the response surface plot illustrating the interaction between spiral blade diameter and rotational speed, with the spiral blade pitch set at zero level (55 mm). The average fertilizer discharge uniformity exhibits a trend of increasing followed by a subsequent decrease with the increase in blade diameter under certain conditions of spiral blade rotational speed. Similarly, for a constant blade diameter, the average fertilizer discharge uniformity initially increases and then slightly decreases as the rotational speed increases. Notably, a higher average fertilizer discharge uniformity is observed at a diameter of 90–95 mm and a rotational speed of 55–60 r/min.
The response surface plot in Figure 8c illustrates the interaction between spiral blade pitch and rotational speed when the spiral blade diameter is set to zero level (90 mm). It is observed that, under specific conditions of spiral blade rotational speed, there is a consistent increase in average fertilizer discharge uniformity as the blade pitch increases. Moreover, within the context of a specific blade pitch, the average uniformity of the fertilizer discharge demonstrates an initial upward trend and subsequently experiences a marginal decline as the blade diameter increases. It is worth noting that the impact of rotational speed in relation to pitch on the average fertilizer discharge uniformity is more significant. The maximum value of average fertilizer discharge uniformity is observed at a pitch of 58–60 mm and a rotational speed of 55–60 r/min.
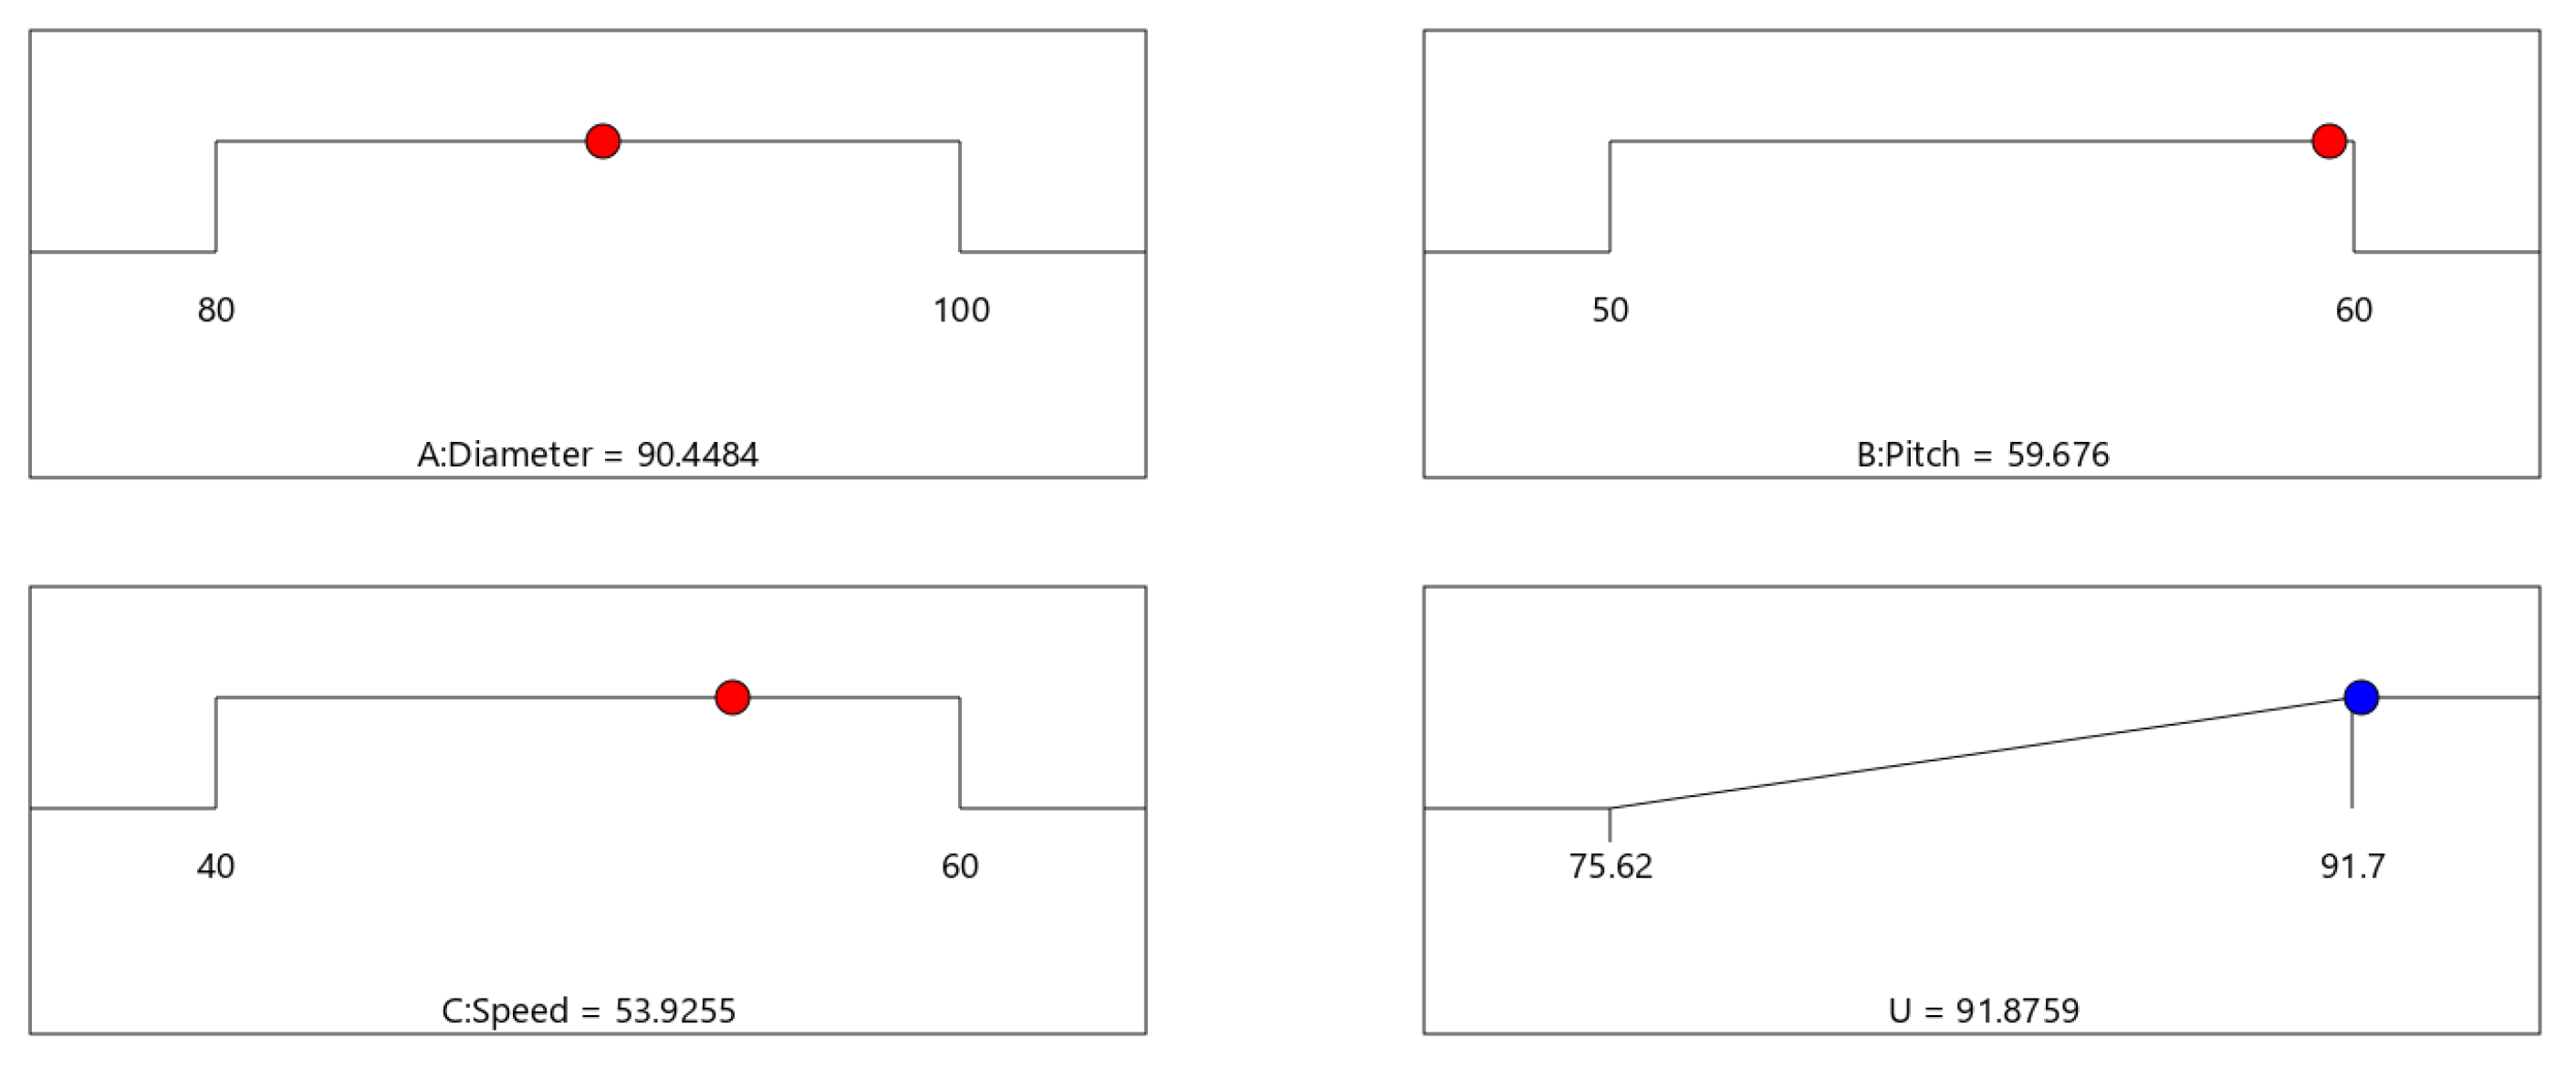
By utilizing the numerical optimization capabilities of the Design-Expert software, the optimal values for three parameters, namely spiral blade diameter (A), pitch (B), and rotational speed (C), can be determined. The optimization module within Design-Expert is utilized to explore the optimal combination of factor levels. Figure 9 illustrates the results obtained from the predicted regression model, indicating that the optimal values for achieving maximum average fertilizer discharge uniformity are as follows: a spiral blade diameter of 90.4484 mm, a pitch of 59.676 mm, and a rotational speed of 53.9255 r/min. Implementation of these values leads to an average fertilizer discharge uniformity of 91.8759%.
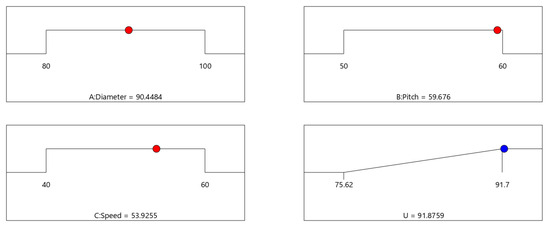
Figure 9.
Optimized process condition using RSM modeling.
3.3. Analysis of Artificial Neural Network Model
According to the research, a robust artificial neural network (ANN) model should have a low mean squared error and root mean square error, as well as a high R-squared () and correlation coefficient (R) [40]. The architecture of the artificial neural network (ANN) is configured as 3-X-1, where X denotes the optimal number of neurons in the hidden layer. Since the determination of the number of hidden layer neurons lacks specific calculation rules, an initial empirical formula is adopted to establish a range of potential values. Subsequently, a trial-and-error methodology is employed to identify the optimal number of neurons [41]. The empirical formula used for this purpose is provided as follows:
where L represents the number of nodes in the hidden layer; m represents the number of nodes in the input layer; n represents the number of nodes in the output layer; and c denotes a constant value within the range from 1 to 10.
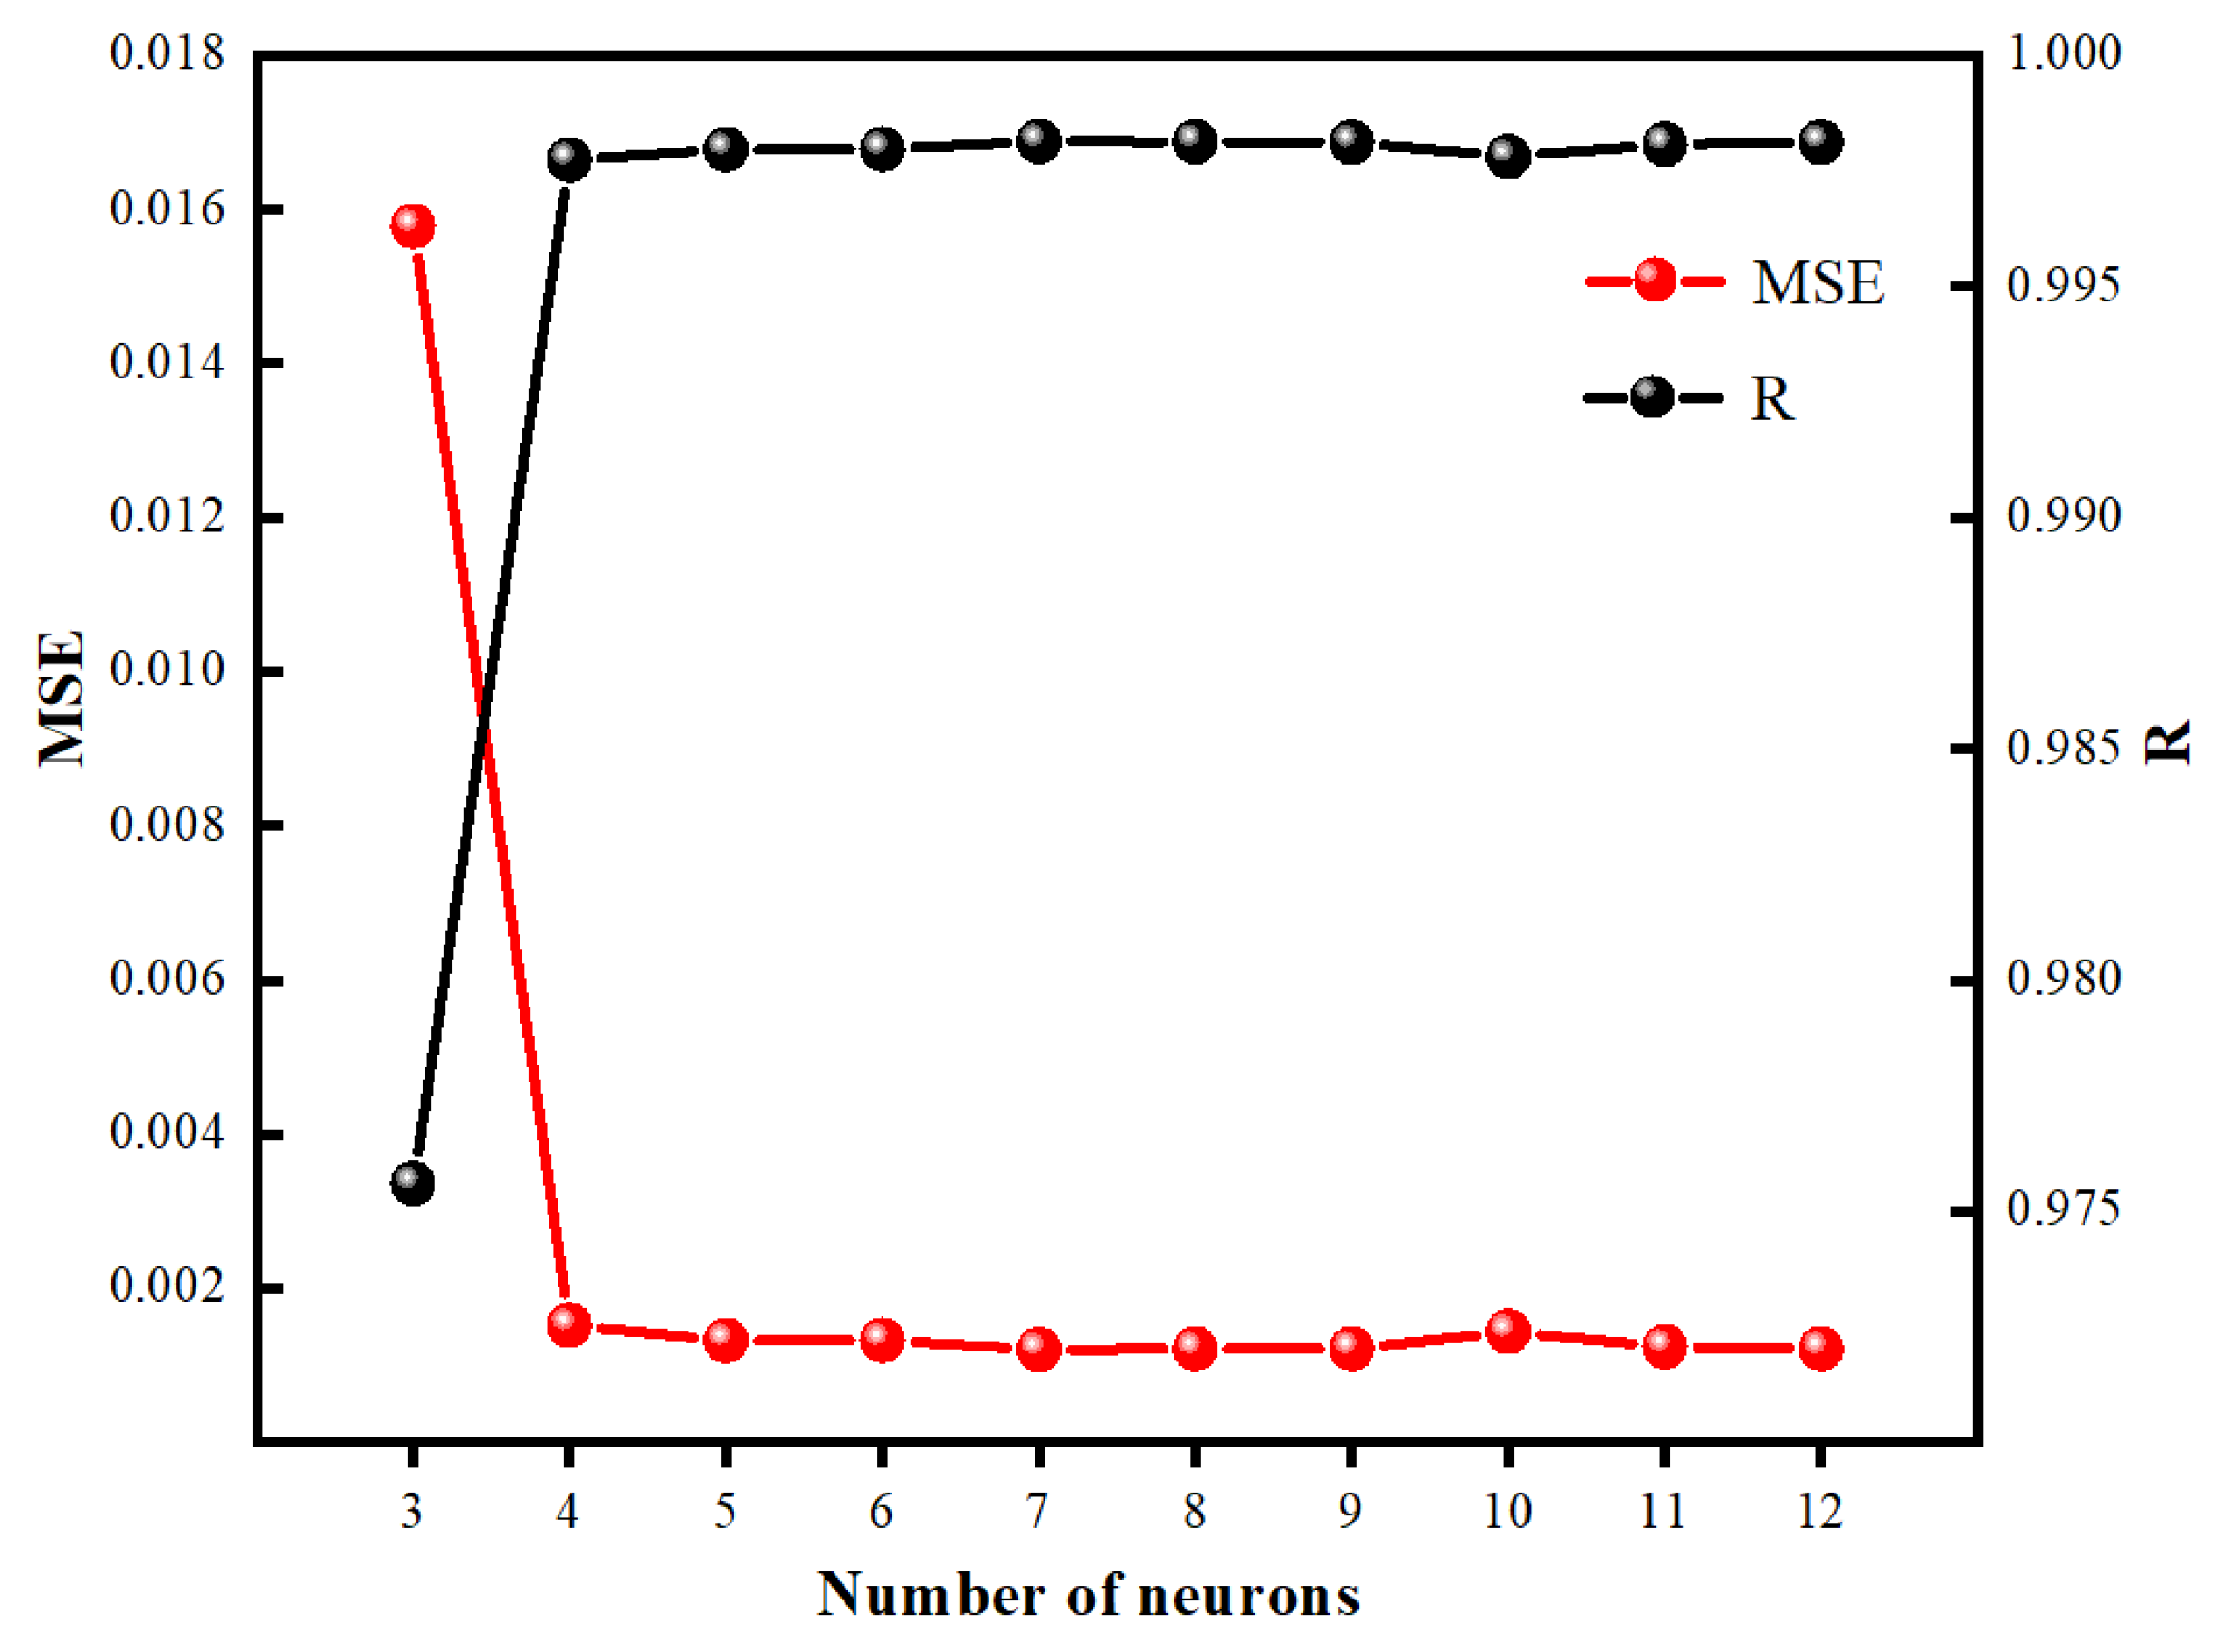
As delineated in this paper, m is valued at three, while n stands at one. This specification facilitates the estimation of the neuron count within the hidden layer, spanning between 3 and 12. Striking an optimal balance in this neuron count proves pivotal; it prevents overfitting while ensuring robust training efficacy. An insufficient neuron count might give rise to overfitting and compromise the training outcome. Conversely, an excessive neuron count can trigger resource inefficiencies and superfluous memory allocation. To pinpoint the most adept artificial neural network (ANN) configuration, an array of models, each with a distinct neuron count in their hidden layer, were assessed, drawing upon their mean squared errors (MSEs) and R metrics within the training set context. Figure 10 portrays the apex performance of the ANN, when the neuron count was set to seven, which registered an MSE of 0.001204 and an R measure of 0.998138. The trajectory of the ANN’s training is depicted in Figure 11, showcasing a brisk and consistent convergence, culminating in peak validation efficacy after 40 iterations. Figure 12 offers insights into the alignment between the target and output values stemming from a 3-7-1 ANN structure, notably in the realm of average fertilizer discharge uniformity evaluation. An R-value inching closer to one signifies the model’s augmented and dependable predictive prowess [42]. The graphical representation underscores R-values across the training, validation, and test datasets, as well as cumulatively; all exceed 0.99. This is indicative of the robustness and precision of the ANN model derived via the stated methodologies, aptly capturing the nexus between the experimental parameters and the average fertilizer discharge uniformity.
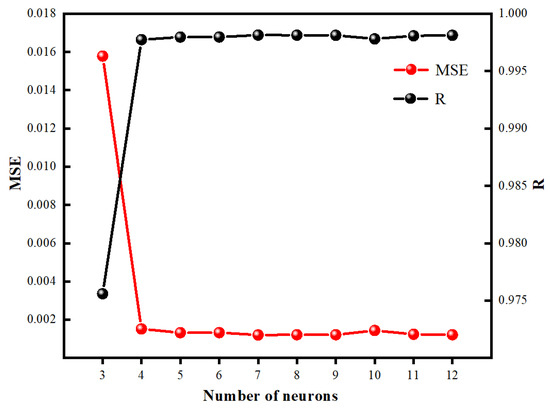
Figure 10.
The influence of the number of hidden layers on the performance of the ANN model.
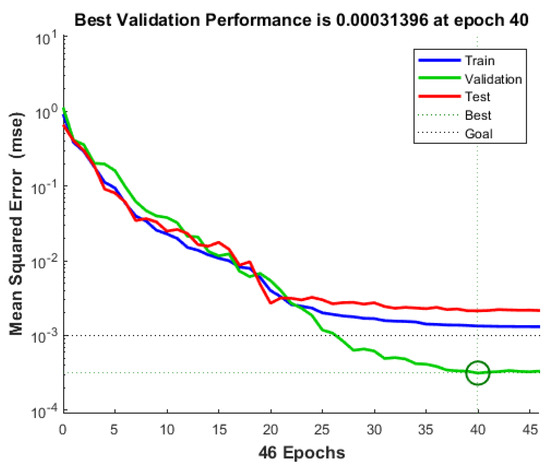
Figure 11.
The ANN model training process.
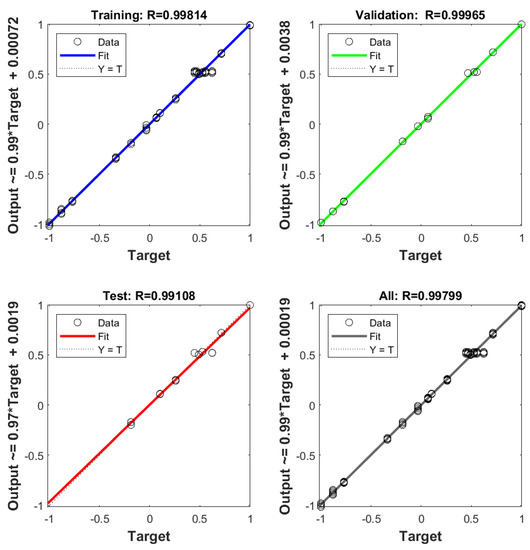
Figure 12.
Fitting of target and output values for training, testing, validation, and overall set in ANN model.
Based on the trained artificial neural network (ANN) model, a genetic algorithm is employed to optimize the optimal process parameters [43,44]. The trained topological model is utilized as the fitness function for the genetic algorithm with the aim of maximizing the evaluation metric. The genetic parameters are set as follows: the number of iterations is 100, the population size is 30, the crossover rate is 0.75, and the mutation rate is 0.2. The three input parameters act as chromosomes in the genetic algorithm optimization process. A population of 30 individuals is randomly generated as the initial generation based on the specified parameters. The fitness function is utilized to calculate the fitness of each individual. The chromosome with the best performance is selected from the initial population for replication, followed by crossover and mutation to obtain a new generation of chromosomes. This iterative process continues until an optimal parameter combination is achieved. During the run, the best fitness value curve of each generation of the population is obtained, as shown in Figure 13. It can be observed that the best fitness value of the population stabilizes around the 50th generation. By applying the genetic algorithm, the optimal conditions for the ANN model are determined as follows: a diameter of 90.1669 mm, a pitch of 59.7407 mm, a rotational speed of 53.8944 r/min, and an average fertilizer discharge uniformity of 92.0670%.
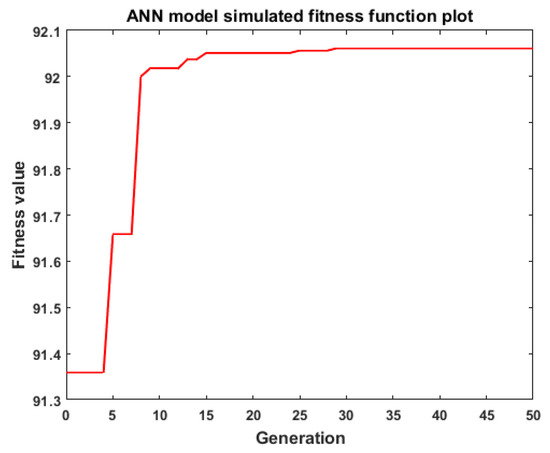
Figure 13.
ANN model simulated fitness function plot.
3.4. A Comparative Analysis between ANN and RSM
Table 6 provides an in-depth comparison of the forecasted outputs from both response surface methodology (RSM) and the artificial neural network (ANN). A noteworthy observation from this table indicates that the ANN’s forecasted deviations are markedly less than those derived from RSM. To enhance clarity, a graphical representation juxtaposing the predictions from both RSM and the ANN with actual data was contrived. As depicted in Figure 14, the ANN’s predictions closely mirror the simulated data points. This distribution implies a more precise alignment from the ANN framework as opposed to the response surface approach. Further, a meticulous analysis of the evaluative metrics for both forecasting tools, encompassing the mean squared error (MSE), root mean square error (RMSE), and coefficient of determination (), was undertaken. Indicators of higher model precision manifest as lower MSE and RMSE scores, coupled with an nearing unity. Table 7 presents these metrics for the duo. A discernment from the table reveals RSM scores of 0.17498, 0.41831, and 0.99163 for the MSE, RMSE, and , respectively. In contrast, the ANN registers 0.07763 and 0.27862 for the MSE and RMSE, respectively, indicating a closer approximation to the ideal. Furthermore, its stands at 0.99629. By juxtaposing the evaluative metrics from both methodologies, the superior precision and alignment of the ANN become evident. Lastly, when the optimal conditions derived from both frameworks are examined, the ANN’s predictions surpass those from RSM, as detailed in Table 8.
Table 6.
The comparative analysis between the RSM and the ANN model.
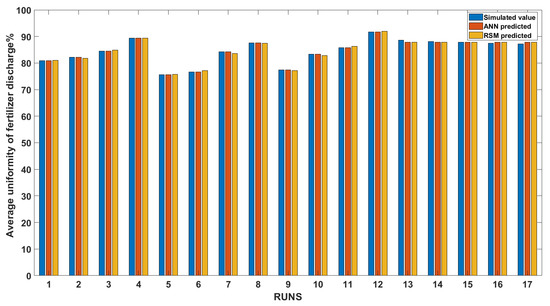
Figure 14.
The comparative evaluation of the predicted outcomes between the ANN and RSM.
Table 7.
Comparison of predictive capacity of RSM and ANN.
Table 8.
Solutions to optimal condition for RSM and ANN.
In conclusion, each optimization method exhibits unique advantages and constraints. The approach based on response surface modeling is notable for its efficacy, specifically in reducing the number of experiments, thereby conserving significant time [45]. This efficiency becomes more evident when compared to the ANN framework. However, the outstanding data fitting and forecasting accuracy of the ANN must not be overlooked. Its primary limitation is the inability to elucidate complex interrelations among the experimental variables [46]. Regarding applicability and practical implications, the optimal parameters have been identified: a diameter near 90 mm, a pitch around 60 mm, and a rotational velocity of approximately 54 r/min.
4. Experiment Verification
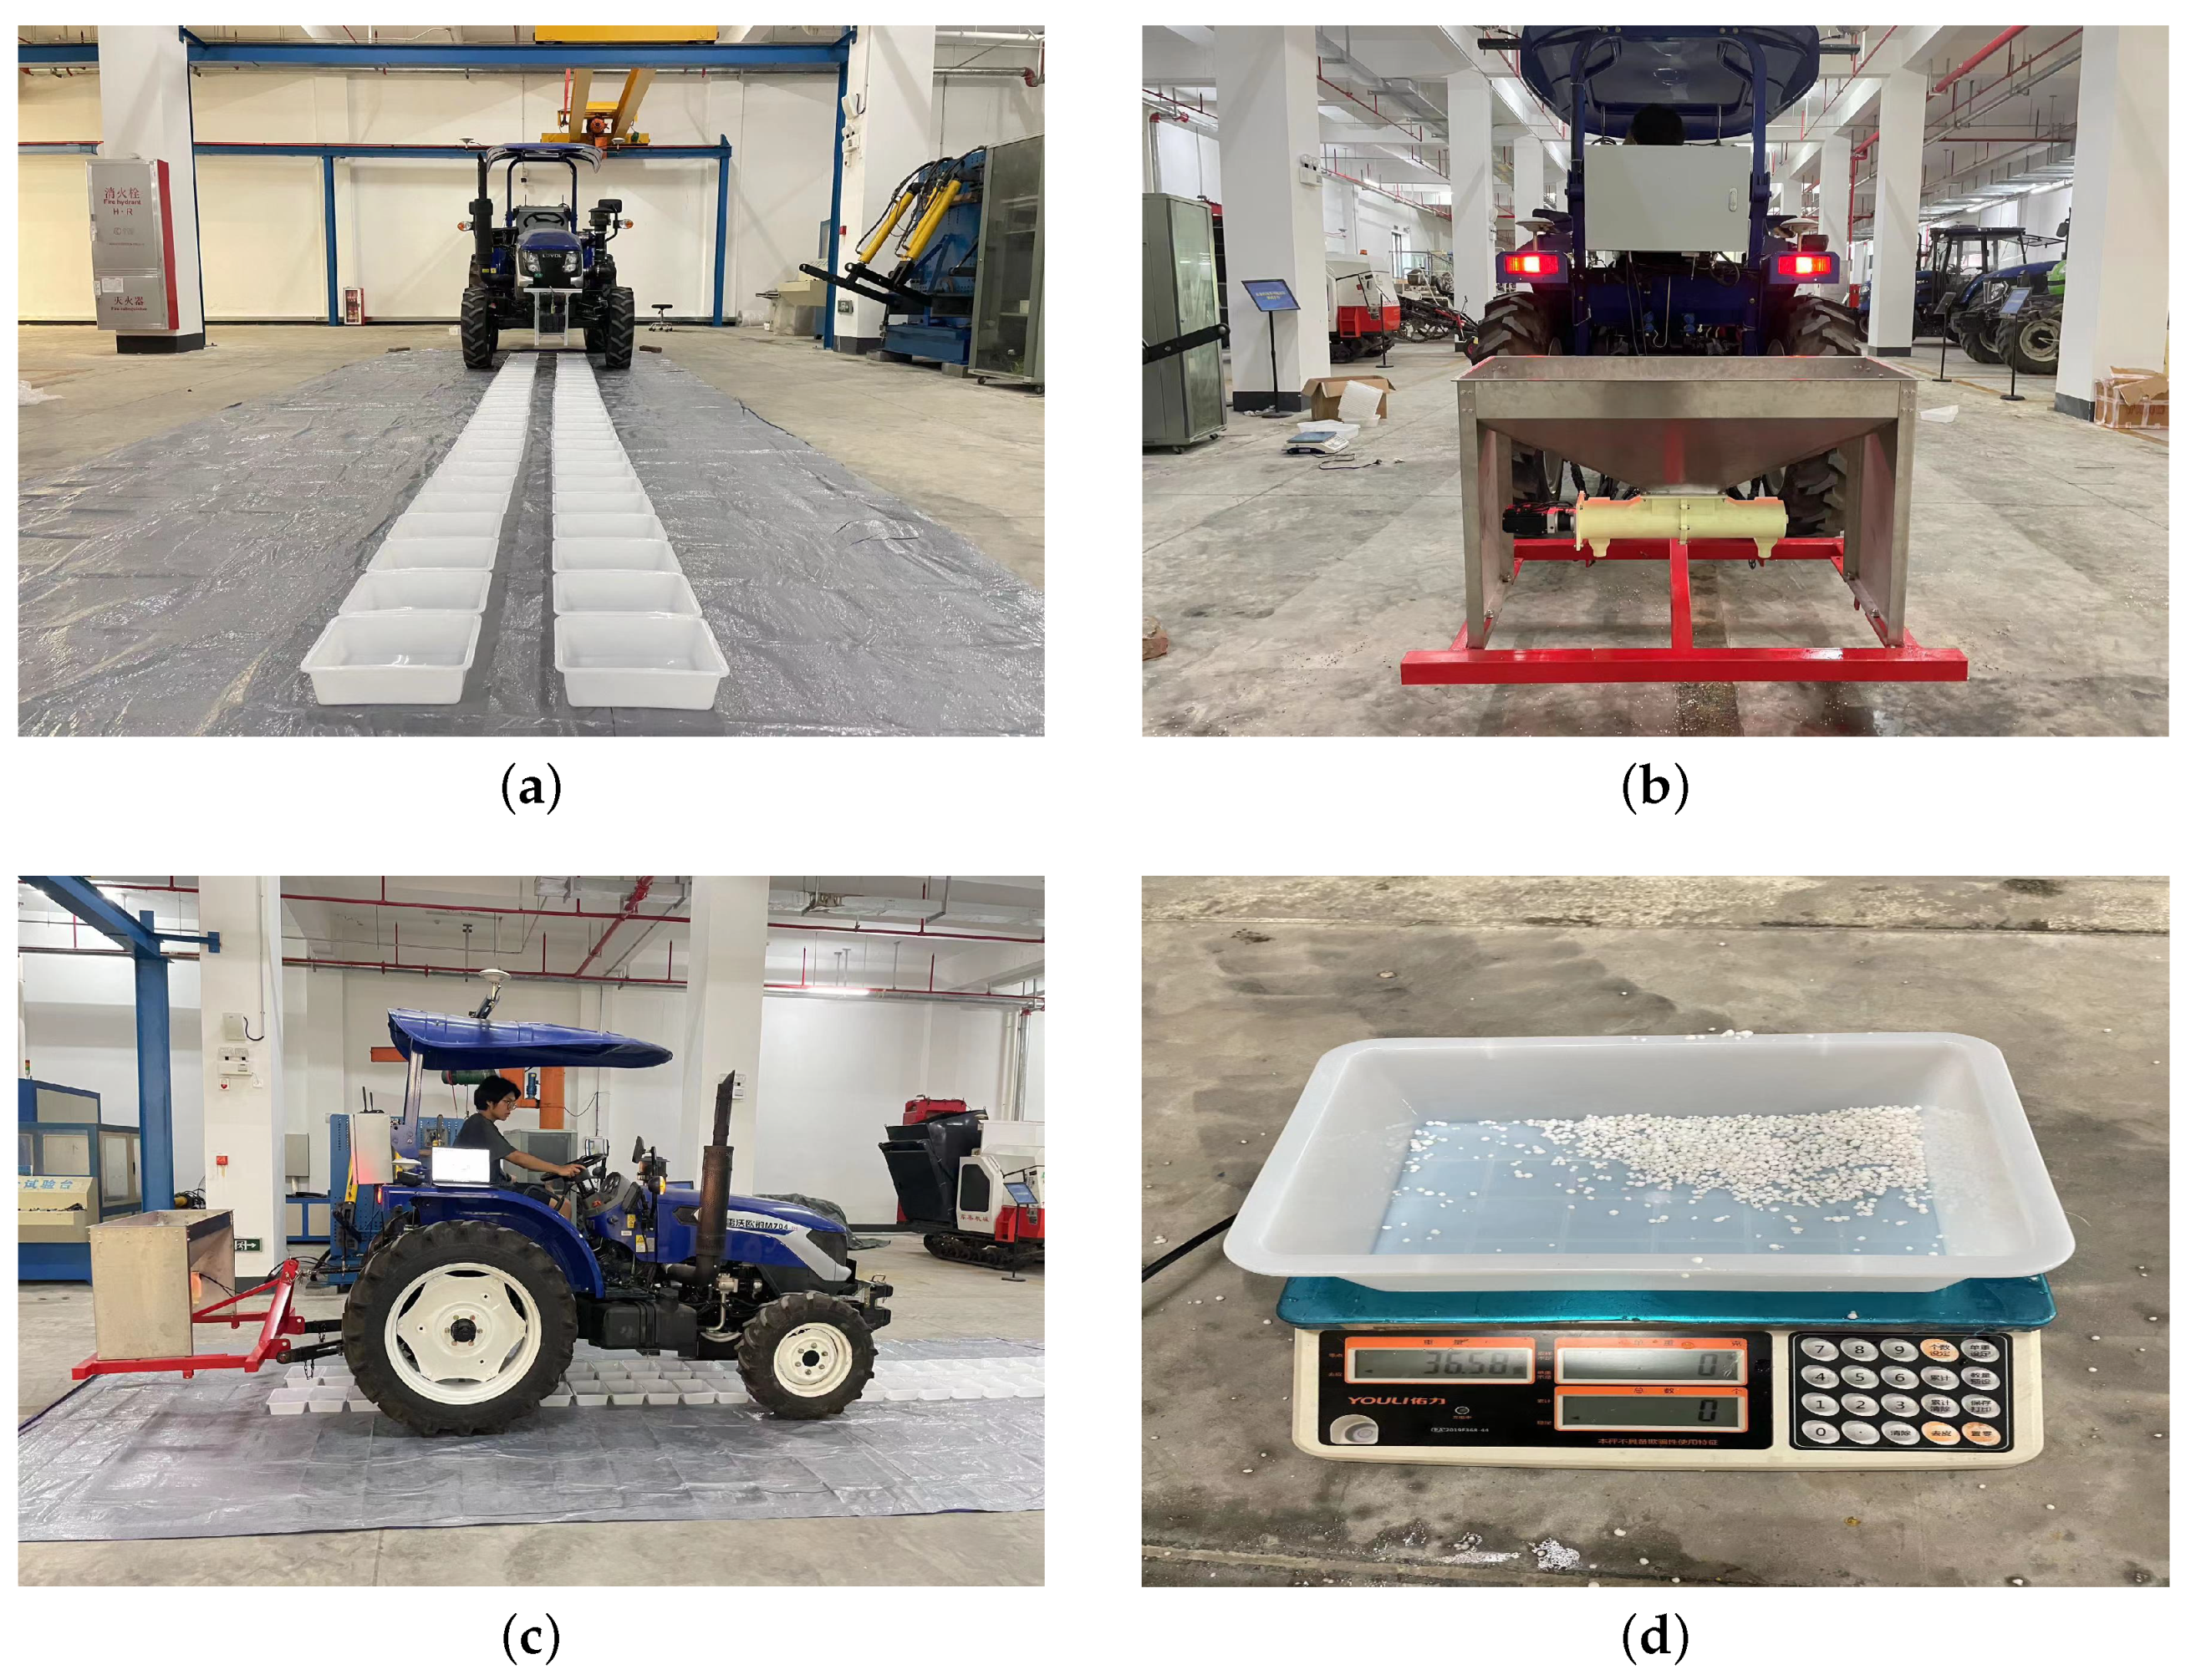
To corroborate the validity and precision of the simulation outcomes, validation tests were performed on the optimized spiral fertilizer applicator. These tests were conducted in the Agricultural Engineering Building’s garage of South China Agricultural University in June 2023. The experiment simulated the division of grid regions. Within a 10 m long test area, two rows of fertilizer collection areas were established. Each row consisted of 30 fertilizer collection boxes measuring 20 mm in length and 27 mm in width. The experimental process is depicted in Figure 15. The testing equipment consists of a Levo M704 tractor, a spiral fertilizer applicator, a measuring tape, and a high-precision electronic scale. The experimental fertilizer used consists of commonly available large urea particles. The optimized parameters were fabricated through 3D printing, and the tractor’s forward speed was set to 1 m/s. Before each experiment, it was ensured that the fertilizer boxes contained no less than two-thirds of their volume. Following each experimental trial, the precise mass of fertilizer contained within each collection box was measured using a high-accuracy electronic scale for the purpose of statistical analysis. The experiment was replicated five times, and the resulting data from each trial were recorded to evaluate the uniformity of the fertilizer discharge for each row and determine the average uniformity of the fertilizer discharge. The tabulated outcomes can be found in Table 9.
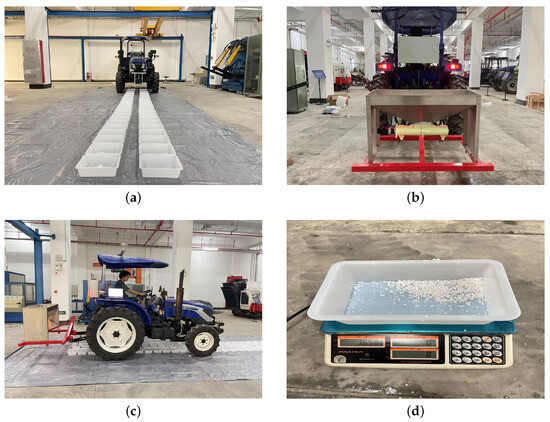
Figure 15.
Experimental procedure: (a) experimental site arrangement, (b) testing device, (c) experimental process, (d) weighing process.
Table 9.
Test results.
The results indicate that the spiral fertilizer applicator successfully completed the fertilizer discharge operations. Across the quintet of trials, the apex discrepancy between the computational predictions and the real-world experimental outcomes was 2.4%, whereas the nadir was 2.1%. The simulated and optimized results showed consistent trends. The discrepancies may be attributed to the differences between the simulated fertilizer particles and the actual particles, as well as variations in the dropping of fertilizer particles during the actual experimental process compared to the simulation. Overall, the fertilizer applicator performed well under the optimal parameter combination, demonstrating stable performance during operation.
5. Conclusions
- (1)
- In our investigation, we designed a dual-direction spiral fertilizer applicator. By examining agronomy associated with sugarcane production, we delineated the potential range of structural parameters for the spiral blades. We further scrutinized the movement of the fertilizer particles, pinpointing crucial factors, such as the blades’ rotational velocity, pitch, and diameter, as determinants of the discharger’s efficiency.
- (2)
- We employed SolidWorks for modeling the discharger, subsequently setting up a discrete element simulation for our experimental purposes. Probing the impacts of blade diameter, pitch, and rotational velocity on the discharge uniformity, single-factor and response surface experiments were implemented. Using the average uniformity as our benchmark, we utilized DesignExpert 13 for regression modeling, revealing how our selected factors interacted with this index. To enhance the precision of the model, virtual data were incorporated to construct an ANN prediction model. This study innovatively applies response surface methodology (RSM) and artificial neural network (ANN) techniques to optimize the operational parameters of the fertilizer applicator, while also conducting a comparative analysis.The respective , MSE, and RMSE values for the ANN and RSM models were 0.99629, 0.99163, 0.07763, 0.17498, 0.27862, and 0.41831. Evidently, the ANN surpassed RSM in predictive finesse and fit quality. Post-model optimization of the ANN via a genetic algorithm yielded superior parameters than those of the response surface approach. The climax parameters were a diameter of 90.1669 mm, pitch of 59.7407 mm, rotational velocity of 53.8944 r/min, and an average fertilizer discharge uniformity of 92.0670%.
- (3)
- Experiments, aligned with the best parameter settings, were executed to validate our findings. The empirical data echoed our simulations, with the average discharge uniformity deviating by a maximum of 2.4% and a minimum of 2.1% from the optimized benchmarks. This underscores the pragmatic and dependable nature of our empirical outcomes. However, this study only utilized specific topological structures. In future research, it is advisable to explore more complex topological structures and investigate a fusion method of response surface methodology (RSM) and artificial neural networks (ANNs) to further enhance the model’s fitting and predictive capabilities.
Author Contributions
Conceptualization, Z.Z. and W.Z.; methodology, M.P.; software, W.L. and J.Z.; validation, M.P., H.H., X.W. and G.Z.; formal analysis, M.P.; investigation, M.P. and X.W.; resources, M.P.; data curation, M.P.; writing—original draft preparation, M.P.; writing—review and editing, M.P., Z.Z. and W.Z.; visualization, H.H.; supervision, Z.Z. and W.Z.; project administration, Z.Z. and W.Z.; funding acquisition, Z.Z. All authors have read and agreed to the published version of the manuscript.
Funding
This research was funded by the Modern Agricultural Industry Technology System of China, grant number CARS-170405; the National Key Research and Development Program of China, grant number 2022YFD200160103; the Key Research and Development Plan of Shandong Province, grant number 2022SFGC0202; and the Single Longitudinal Axial Flow Multifunctional Grain Combine Harvester Project, grant number 2022SGC0406.
Institutional Review Board Statement
Not applicable.
Informed Consent Statement
Not applicable.
Data Availability Statement
Not applicable.
Conflicts of Interest
The authors declare no conflict of interest.
References
- Li, Y.-R.; Yang, L.-T. Sugarcane Agriculture and Sugar Industry in China. Sugar. Tech. Int. J. Sugar Crop. Relat. Ind. 2015, 17, 1–8. [Google Scholar] [CrossRef]
- Li, Y.-R.; Song, X.-P.; Wu, J.-M.; Li, C.-N.; Liang, Q.; Liu, X.-H.; Wang, W.-Z.; Tan, H.-W. Sugar Industry and Improved Sugarcane Farming Technologies in China. Sugar. Tech. Int. J. Sugar Crop. Relat. Ind. 2016, 18, 603–611. [Google Scholar] [CrossRef]
- Wu, W.; Fu, W.; Alatalo, J.M.; Ma, Z.; Bai, Y. Effects of coupling water and fertilizer on agronomic traits, sugar content and yield of sugarcane in guangxi, China. Agronomy 2022, 12, 321. [Google Scholar] [CrossRef]
- Zhao, Y.; Cao, J.; Wang, Z.; Liu, L.; Yan, M.; Zhong, N.; Zhao, P. Enhancing Sugarcane Growth and Improving Soil Quality by Using a Network-Structured Fertilizer Synergist. Sustainability 2023, 15, 1428. [Google Scholar] [CrossRef]
- Guo, H.; Li, Y.; Wang, X.; Ruan, H.; Abegunrin, T.P.; Wei, L.; Huang, Z.; Are, K.S.; Awe, G.O. Characteristics of Nitrogen Output during Typical Rainfall in Different Sugarcane Growth Stages in a Southern Subtropical Watershed. Agriculture 2023, 13, 1613. [Google Scholar] [CrossRef]
- Li, X.; Wei, B.; Xu, X.; Zhou, J. Effect of deep vertical rotary tillage on soil properties and sugarcane biomass in rainfed dry-land regions of southern china. Sustainability 2020, 12, 10199. [Google Scholar] [CrossRef]
- Lin, H. Current situation of fertilizer application in China’s sugarcane production and countermeasures to improve fertilizer utilization. South China Agric. 2017, 11, 117–118. [Google Scholar]
- Wang, Y.; Li, R.; Yang, S.; Ai, J.; Feng, L.; Dao, J.; Deng, J. Research Progress of Sugarcane Fertilization Technology at Home and Abroad. Sugar Crop. China 2023, 45. [Google Scholar]
- Shang, H.G.; Li, L.; Wang, K.J.; Tan, H.W.; Lan, Z.B.; Yang, B.P.; Peng, L.S.; Leng, Y. Research Progress on Chemical Fertilizer and Pesticide Application Reduction and Efficiency Enhancement Technologies of Sugarcane Production. Southwest China J. Agric. Sci. 2020, 33, 211–216. [Google Scholar]
- Bangura, K.; Gong, H.; Deng, R.; Tao, M.; Liu, C.; Cai, Y.; Liao, K.; Liu, J.; Qi, L. Simulation analysis of fertilizer discharge process using the Discrete Element Method (DEM). PLoS ONE 2020, 15, e0235872. [Google Scholar] [CrossRef]
- Zha, X.; Zhang, G.; Han, Y.; Salem, A.E.; Fu, J.; Zhou, Y. Structural optimization and performance evaluation of blocking wheel-type screw fertilizer distributor. Agriculture 2021, 11, 248. [Google Scholar] [CrossRef]
- Zhan, C.; Ding, W.; Han, Y.; Jiang, Q.; Zhao, Y.; Zhao, L.; Song, Z. Design and experiments of an automatic depth-adjusting double screw trencher and fertiliserning. PLoS ONE 2022, 17, e0277824. [Google Scholar] [CrossRef] [PubMed]
- Sun, J.; Chen, H.; Duan, J.; Liu, Z.; Zhu, Q. Mechanical properties of the grooved-wheel drilling particles under multivariate interaction influenced based on 3D printing and EDEM simulation. Comput. Electron. Agric. 2020, 172, 105329. [Google Scholar] [CrossRef]
- Yang, W.W.; Fang, L.Y.; Luo, X.W.; Li, H.; Ye, Y.Q.; Liang, Z.H. Experimental study of the effects of discharge port parameters on the fertilizing performance for fertilizer distribution apparatus with screw. Trans. Chin. Soc. Agric. Eng. 2020, 36, 1–8. [Google Scholar]
- Dun, G.; Wu, X.; Ji, X.; Ji, W.; Ma, H. Optimization Design and Experiment of Oblique Opening Spiral Precision Control Fertilizer Apparatus. Trans. Chin. Soc. Agric. Mach. 2023, 54, 167–174. [Google Scholar]
- Zeng, Z.; Ma, X.; Cao, X.; Li, Z.; Wang, X. Critical Review of Applications of Discrete Element Method in Agricultural Engineering. Trans. Chin. Soc. Agric. Mach. 2021, 52, 1–20. [Google Scholar]
- Baş, D.; Boyacı, İ.H. Modeling and optimization II: Comparison of estimation capabilities of response surface methodology with artificial neural networks in a biochemical reaction. J. Food Eng. 2007, 78, 846–854. [Google Scholar] [CrossRef]
- Bonini Neto, A.; Alves, D.A.; Minussi, C.R. Artificial neural networks: Multilayer perceptron and radial basis to obtain post-contingency loading margin in electrical power systems. Energies 2022, 15, 7939. [Google Scholar] [CrossRef]
- Betiku, E.; Taiwo, A.E. Modeling and optimization of bioethanol production from breadfruit starch hydrolyzate vis-à-vis response surface methodology and artificial neural network. Renew. Energy 2015, 74, 87–94. [Google Scholar] [CrossRef]
- Rebollo-Hernanz, M.; Cañas, S.; Taladrid, D.; Segovia, Á.; Bartolomé, B.; Aguilera, Y.; Martín-Cabrejas, M.A. Extraction of phenolic compounds from cocoa shell: Modeling using response surface methodology and artificial neural networks. Sep. Purif. Technol. 2021, 270, 118779. [Google Scholar] [CrossRef]
- Dang, Y.; Yang, G.; Wang, J.; Zhou, Z.; Xu, Z. A Decision-Making Capability Optimization Scheme of Control Combination and PID Controller Parameters for Bivariate Fertilizer Applicator Improved by Using EDEM. Agriculture 2022, 12, 2100. [Google Scholar] [CrossRef]
- Zhang, M.; Tang, Y.; Zhang, H.; Lan, H.; Niu, H. Parameter optimization of spiral fertilizer applicator based on artificial neural network. Sustainability 2023, 15, 1744. [Google Scholar] [CrossRef]
- Bu, H.; Yu, S.; Dong, W.; Zhang, L.; Xia, Y. Analysis of the Effect of Bivariate Fertilizer Discharger Control Sequence on Fertilizer Discharge Performance. Agriculture 2022, 12, 1927. [Google Scholar] [CrossRef]
- Ma, Z.; Wu, W.; Alatalo, J.M.; Fu, W.; Bai, Y. Optimal Water-Fertilizer Combinations for Efficient Nitrogen Fixation by Sugarcane at Different Stages of Growth. Water 2021, 13, 2895. [Google Scholar] [CrossRef]
- Xue, Z.; Zhao, L.; Wang, F.; Wang, S.; Song, G.; Wang, G. Study on the Performance of Spiral Fertilizer Distributor Based on EDEM. J. Agric. Mech. Res. 2020, 42, 87r95. [Google Scholar]
- Zhang, J.; Liu, G.; Hu, H.; Huang, J. Development of bivariate fertilizer control system via independent control of fertilizing unit. Trans. Chin. Soc. Agric. Eng. 2021, 37, 38–45. [Google Scholar]
- Wei, G.; Qi, B.; Jiao, W.; Shi, S.; Jian, S. Design and Experiment of Mechanical Forced Fertilizing Device for Paddy Field. Trans. Chin. Soc. Agric. Mach. 2020, 51, 11. [Google Scholar]
- Han, S.; Li, Y.; Zhou, X.; Kan, Z.; Meng, H.; Qi, J. DEM Simulation and Experimental Validation of the Performance of an Orchard Deep Applicator for Manure. Appl. Sci. 2023, 13, 3709. [Google Scholar] [CrossRef]
- Liu, Z.; Wang, Q.; Li, H.; He, J.; Lu, C.; Yu, C. Fertilizer injecting route analysis and test for air-blowing seed-fertilizer hole-applicator via CFD-DEM coupling. Trans. CSAE 2019, 35, 18–25. [Google Scholar]
- Yinyan, S.; Man, C.; Xiaochan, W.; Odhiambo, M.O.; Weimin, D. Numerical simulation of spreading performance and distribution pattern of centrifugal variable-rate fertilizer applicator based on DEM software. Comput. Electron. Agric. 2018, 144, 249–259. [Google Scholar] [CrossRef]
- Sun, C.; Cao, L.; Shi, Z.; Chen, X.; Huang, S. Analysis on fertilizer performance of fertilizer machine based on discrete element method. J. Chin. Agric. Mech. 2019, 40, 44. [Google Scholar]
- Xue, Z.; Zhao, L.; Wang, F.; Wang, S.; Wang, G.; Pan, R. Performance simulation test of the spiral fertilizer distributor based on discrete element method. J. Hunan Agric. Univ. 2019, 45, 548–553. [Google Scholar]
- Wen, X.; Yuan, H.; Wang, G.; Jia, H. Calibration Method of Friction Coefficient of Granular Fertilizer by Discrete Element Simulation. Trans. Chin. Soc. Agric. Mach. 2020, 51, 115–122. [Google Scholar]
- Li, M.; Zhang, T.; Dong, X.; Wang, C.; Niu, Z.; Ge, C.; Wei, L. Parameter optimization on scraper fertilizer feed unit of 3ZSP-2 type sugarcane intertillage fertilizer applicator-cum-hiller. Trans. Chin. Soc. Agric. Eng. 2016, 32, 36–42. [Google Scholar]
- Dun, G.; Mao, N.; Ji, X.; Zhang, F.; Ji, W. Optimal Design and Experiment of Corn-Overlapped Strip Fertilizer Spreader. Appl. Sci. 2023, 13, 2559. [Google Scholar] [CrossRef]
- Song, X.; Dai, F.; Zhang, X.; Gao, W.; Li, X.; Zhang, F.; Zhao, W. Simulation and Experiment of Fertilizer Discharge Characteristics of Spiral Grooved Wheel with Different Working Parameters. Sustainability 2023, 15, 11309. [Google Scholar] [CrossRef]
- Buasri, A.; Sirikoom, P.; Pattane, S.; Buachum, O.; Loryuenyong, V. Process Optimization of Biodiesel from Used Cooking Oil in a Microwave Reactor: A Case of Machine Learning and Box–Behnken Design. ChemEngineering 2023, 7, 65. [Google Scholar] [CrossRef]
- Zheng, F.; Dai, Z.; Yin, X.; Cui, Y. Optimization of Fish Oil Decolorization Process Based on Response Surface Methodology and Artificial Neural Network Models. J. Chin. Inst. Food Sci. Technol. 2023, 23. [Google Scholar] [CrossRef]
- Garg, A.; Jain, S. Process parameter optimization of biodiesel production from algal oil by response surface methodology and artificial neural networks. Fuel 2020, 277, 118254. [Google Scholar] [CrossRef]
- Zhang, L.; Liu, J.; Shen, X.; Li, S.; Li, W.; Xiao, X. Response Surfaces Method and Artificial Intelligence Approaches for Modeling the Effects of Environmental Factors on Chlorophyll a in Isochrysis galbana. Microorganisms 2023, 11, 1875. [Google Scholar] [CrossRef]
- Bu, X.; Xu, Y.; Zhao, M.; Li, D.; Yang, Y. Simultaneous extraction of polysaccharides and polyphenols from blackcurrant fruits: Comparison between response surface methodology and artificial neural networks. Ind. Crop. Prod. 2021, 170, 113682. [Google Scholar] [CrossRef]
- Adizue, U.; Nwanya, S.C.; Ozor, P. Artificial Neural Network application to a process time planning problem for palm oil production. Eng. Appl. Sci. Res. 2020, 47, 161–169. [Google Scholar]
- Yu, Z.X.; Zhang, Y.Y.; Zhao, X.X.; Yu, L.; Chen, X.B.; Wan, H.T.; He, Y.; Jin, W.F. Simultaneous optimization of ultrasonic-assisted extraction of Danshen for maximal tanshinone IIA and salvianolic acid B yields and antioxidant activity: A comparative study of the response surface methodology and artificial neural network. Ind. Crop. Prod. 2021, 161, 113199. [Google Scholar] [CrossRef]
- Zhang, X.; Zhang, Q.; Li, Y.; Zhang, H. Modeling and optimization of photo-fermentation biohydrogen production from co-substrates basing on response surface methodology and artificial neural network integrated genetic algorithm. Bioresour. Technol. 2023, 374, 128789. [Google Scholar] [CrossRef] [PubMed]
- Hussain, S.; Khan, H.; Gul, S.; Steter, J.R.; Motheo, A.J. Modeling of photolytic degradation of sulfamethoxazole using boosted regression tree (BRT), artificial neural network (ANN) and response surface methodology (RSM); energy consumption and intermediates study. Chemosphere 2021, 276, 130151. [Google Scholar] [CrossRef]
- Chouaibi, M.; Rigane, K.; Ferrari, G. Extraction of Citrullus colocynthis L. seed oil by supercritical carbon dioxide process using response surface methodology (RSM) and artificial neural network (ANN) approaches. Ind. Crop. Prod. 2020, 158, 113002. [Google Scholar] [CrossRef]


Disclaimer/Publisher’s Note: The statements, opinions and data contained in all publications are solely those of the individual author(s) and contributor(s) and not of MDPI and/or the editor(s). MDPI and/or the editor(s) disclaim responsibility for any injury to people or property resulting from any ideas, methods, instructions or products referred to in the content. |
© 2023 by the authors. Licensee MDPI, Basel, Switzerland. This article is an open access article distributed under the terms and conditions of the Creative Commons Attribution (CC BY) license (https://creativecommons.org/licenses/by/4.0/).